

Introduction
As one of the most widespread renal ailments in child patients, primary nephrotic syndrome (PNS) has been deemed as a major cause of chronic renal failures among Chinese children [1]. The features of PNS include elevated permeability of the glomerular filtration barrier and resulting oedema, hypoalbuminaemia as well as proteinuria. So far, the mechanism underlying the PNS pathogenesis is still mostly unknown. Some scholars assume that the PNS is actually caused by the deregulation of T cells or the abnormality in T cell responses [2–4]. It was also suggested that the imbalance between the number of Th1 and Th2 cells as well as the imbalance between the number of Th17 and Treg cells leads to PNS [4, 5]. It was additionally found that oxidized low-density lipoprotein (ox-LDL) plays a stronger role in reducing the count of Treg cells than in reducing the count of Th17 cells, and the discrepancy between the count of Th17 and Treg cells might be responsible for inducing the pathogenesis of the PNS condition in children. Th17 as well as Treg cells, both of which are differentiated from naïve CD4+ T-cells, participate in the control of inflammatory responses. In particular, the effector T-cells drive the immunity while promoting inflammation, and the inhibitory Treg cells exert an opposite effect by reducing the activity of effector T-cells while reducing the level of inflammatory responses [6]. The equilibrium between the number of immuno-suppressive Foxp3+ Treg cells and the number of pro-inflammatory Th17 cells exemplifies a critical factor in regulating the homeostasis of the immune system. Furthermore, a decline in the number of Treg cells can cause immune reactions dominated by Th2 cells, resulting in their increased infiltration into eosinophilic tissues [7]. In addition, Th17 and IL -17 were shown to play an essential role in the PNS pathogenesis in children by lowering the expression of podocalyxin as well as by causing the apoptosis of podocytes [4].
LncRNAs are associated with the progression of many diseases, such as asthma, via post-transcriptional or transcriptional regulation of protein expression by means of various mechanisms [8, 9]. Some of such mechanisms could be explained via the function of competing endogenous RNAs (ceRNAs), i.e., lncRNAs may act as ceRNAs to competitively bind to certain miRNAs via base pair complementation, thus reducing the binding of such microRNAs to target genes, and leading directly to the changes in target gene expression [10]. It was found that the abnormalities in lncRNA-MEG3 in CD4+ T cells could regulate the Treg/Th17 imbalance in asthma patients by functioning as a competing endogenous RNA of microRNA-17/RORγt [11]. Also, it was found that the highly expressed MEG3 could directly suppress expression of miR-125a-5p. It was likewise noted that the overexpression of miR-125a-5p triggered the rise of Foxp3 expression as well as the decrease in RORγt expression in CD4+ cells isolated from ITP patients, indicating that miR-125a-5p actually participated in the pathogenesis of ITP partially via the regulation of Tregs as well as Th17 cells [12].
It has been reported that patients with PNS exhibited an evident imbalance between the number of Th17 and Treg cells in their PBMCs, which might be the immunological basis of the disease [13]. Ox-LDL was proved to alter the dynamic profile of Th17 and Treg cells [14, 15]. The MEG3/miRNA-17/RORγt axis and MEG3/miR-125a-5p axis were reported to be involved in asthma and immune thrombocytopenic purpura, respectively [11, 12]. In this study, we hypothesized that the activation of MEG3 signalling could influence the imbalance of Th17/Treg cells in PNS patients; and the administration of ox-LDL might influence the susceptibility of PNS by influencing the expression of MEG3 and its subsequent target genes and proteins. Therefore, we recruited PNS patients to study the effect of ox-LDL on the imbalance of Th17/Treg cells. We also performed Western blot, RT-qPCR and ELISA assays to study the molecular mechanisms underlying the role of ox-LDL in the pathogenesis of PNS.
Material and methods
Patient recruitment and patient characteristics
In this study, 40 PNS patients were recruited as the PNS group, while 42 healthy individuals were recruited as the healthy control (HC) group. Peripheral blood samples as well as demographic and clinical characteristics were collected from all patients in both groups, and then compared using Student’s t test. In addition, Th17 cells were isolated from the peripheral blood samples and then assayed for target gene expression. The institutional ethical committee has approved the protocol of this study.
Assay of Th17 cells utilizing flow cytometry
Samples of 5 ml of peripheral venous blood were collected from each of the subjects in the two groups under fasting conditions. In the next step, the samples were centrifuged to isolate 3 × 10⁹/l of mononuclear cells from each sample. Then, roughly 2 ml of each blood sample was transferred to a 24-well cell culture plate followed by addition of 1.0 µM per well of Monensin, 60 µg/l per well of Buddha wave ester, as well as 100 µM per well of streptin. Subsequently, the plate was incubated in a 5% CO2 incubator for 5 h at 37°C before the cell suspension was transferred to a sterile 2 ml centrifuge tube, which was then centrifuged for 6 min at 3000 rpm to collect the cell pellet. In the next step, the cell pellet was cleaned with PBS to get rid of the residue liquid before 15 µl of CD4 and 15 µl of IL-17a antibodies were added to each tube. After 30 min of incubation in the dark, the cells were fixed in a fixation buffer at 5°C for 10 min in the dark, centrifuged, permeabilized in 1 ml of permeabilization buffer, rinsed with PBS, and respectively stained using PE-tagged anti-IL-17 antibodies as well as PE-tagged anti-IgG1 antibodies for flow cytometry.
Assay of Treg cells utilizing flow cytometry
Samples of 2 ml of peripheral venous blood were collected from each of the subjects in the two groups under fasting conditions. In the next step, each sample was stained using 15 µl of CD4 as well as 15 µl of CD25 antibodies for 30 min of incubation in the dark before the cells were fixed in 50 µl/tube of the fixation buffer at 5°C for 10 min in the dark, centrifuged, permeabilized in 1 ml of permeabilization buffer, rinsed with PBS, and stained using PE-tagged anti-Foxp3 antibodies as well as PE-tagged anti-IgG1 antibodies, respectively, for flow cytometry.
Evaluation of the Th17/Treg population in total peripheral blood mononuclear cells
Samples of 5 ml of peripheral venous blood were collected from each of the subjects in the two groups under fasting conditions. In the next step, the samples were centrifuged to isolate mononuclear cells, which were seeded into a 24-well cell culture plate at 1 × 10⁶ cells per well. In the next step, the cells were randomly divided into four groups, i.e., a blank group of mononuclear cells treated with ox-LDL at a 0.0 µg/ml concentration, a 0.1 µg/ml ox-LDL group of mononuclear cells treated with ox-LDL at a concentration of 0.1 µg/ml, a 1.0 µg/ml ox-LDL group of mononuclear cells treated with ox-LDL at a concentration of 1.0 µg/ml, and a 10.0 µg/ml ox-LDL group of mononuclear cells treated with ox-LDL at a concentration of 10.0 µg/ml. Subsequently, the plate was incubated in a 5% CO2 incubator for 24 h at 37°C and the cells were collected for flow cytometry to determine the number of Th17 and Treg cells in each sample.
Cell culture
THP-1 cells were acquired from ATCC and then cultured in DMEM medium containing 10% fetal bovine serum and appropriate penicillin and streptomycin antibiotics (Gibco, Thermo Fisher Scientific, Waltham, MA). The cell culture conditions were 37°C and 5% CO2 in a fully humidified incubator. After reaching 80% confluence, the cells were divided into several cellular models. In cell model 1, the THP-1 cells were divided into 3 groups: 1) the PBS group (THP-1 cells treated with PBS only); 2) the ox-LDL + NC siRNA group (THP-1 cells treated with ox-LDL and then transfected with a NC siRNA); and 3. the ox-LDL + MEG3 siRNA group (THP-1 cells treated with ox-LDL and then transfected with MEG3 siRNA). In cell model 2, the THP-1 cells were divided into 2 groups: 1) the NC group (THP-1 cells transfected with an NC plasmid); and 2) the p-MEG3 group (THP-1 cells transfected with the p-MEG3 plasmid). All cell treatment and transfection lasted 48 h, and the transfection was carried out using Lipofectamine 2000 (Invitrogen, Carlsbad, CA) in accordance with the protocol provided by the reagent manufacturer. After 48 h of transfection, the transfected cells were harvested to assay the expression of target genes.
Real time PCR
The collected cell samples were processed using a Trizol kit (Ambion, Foster City, CA) in accordance with the protocol provided by the assay kit manufacturer to isolate the total RNA content. In the next step, the isolated RNA pellet was resuspended in RNase free water and subjected to reverse transcription to generate cDNA. In particular, the synthesis of cDNA using isolated miRNA samples was carried out using a miScript II RT assay kit (Qiagen, Hilden, Germany) in accordance with the protocol provided by the assay kit manufacturer. On the other hand, the synthesis of cDNA using isolated mRNA samples was carried out using a GScript First-Strand cDNA Synthesis kit (GeneDirex, New Taipei, Taiwan) in accordance with the protocol provided by the kit manufacturer. In the next step, the expression of MEG3, relevant miRNAs and relevant mRNAs in each sample was determined by real time PCR, which was carried out on a Light Cycler 480 real-time PCR machine (Roche, Basel, Switzerland) using a miScript SYBR Green PCR assay kit (Qiagen, Germantown, MD) in accordance with the protocol provided by the assay kit manufacturer. Finally, the relative expression of MEG3, relevant miRNAs and relevant mRNAs in each sample was determined using the DDCt approach [16].
Vector construction, mutagenesis and dual luciferase assay
Our preliminary bioinformatic analysis predicted a putative binding site of miR-17 on MEG3, as well as a miR-17 putative binding site in the 3¢UTR of RORγt mRNA. Therefore, subsequent luciferase assays were carried out to validate the regulatory relationship between miR-17 and MEG3 as well as between miR-17 and RORγt mRNA. In brief, wild type sequences of MEG3 as well as RORγt mRNA containing the miR-17 putative binding sites were inserted into pcDNA (Promega, Madison, WI) luciferase reporting vectors to generate wild type vectors of MEG3 as well as RORγt mRNA, respectively. At the same time, site-directed mutagenesis was carried out using a Quick Change Mutagenesis assay kit (Stratagene, San Diego, CA) in accordance with the protocol provided by the assay kit manufacturer to generate site-directed mutations in the miR-17 putative binding sites on MEG3 as well as RORγt mRNA, and the mutant sequences of MEG3 as well as RORγt mRNA containing the miR-17 putative binding sites were also inserted into pcDNA luciferase reporting vectors, to generate mutant type vectors of MEG3 as well as RORγt mRNA, respectively. In the next step, THP-1 cells were transfected with wild type/mutant sequences of MEG3 or RORγt mRNA in conjunction with miR-17 mimics or a scramble control using Lipofectamine 2000 (Invitrogen, Carlsbad, CA) in accordance with the protocol provided by the reagent manufacturer. After 48 h of transfection, the luciferase activity of transfected cells was measured using a Dual-Luciferase assay kit (Promega, Madison, WI) in accordance with the protocol provided by the assay kit manufacturer on a Lumat 9507 LB (Berthold Technologies, Oak Ridge, TN) luminometer.
Results
Patient recruitment and patient characteristics
In this study, 40 PNS patients were recruited to the PNS group, while 42 healthy individuals were recruited to the healthy control (HC) group. The demographic and clinical characteristics were collected and recorded in Table I. No significant differences were found between the PNS group and the HC group.
Percentage of Th17 and Treg cells in the PNS and HC groups
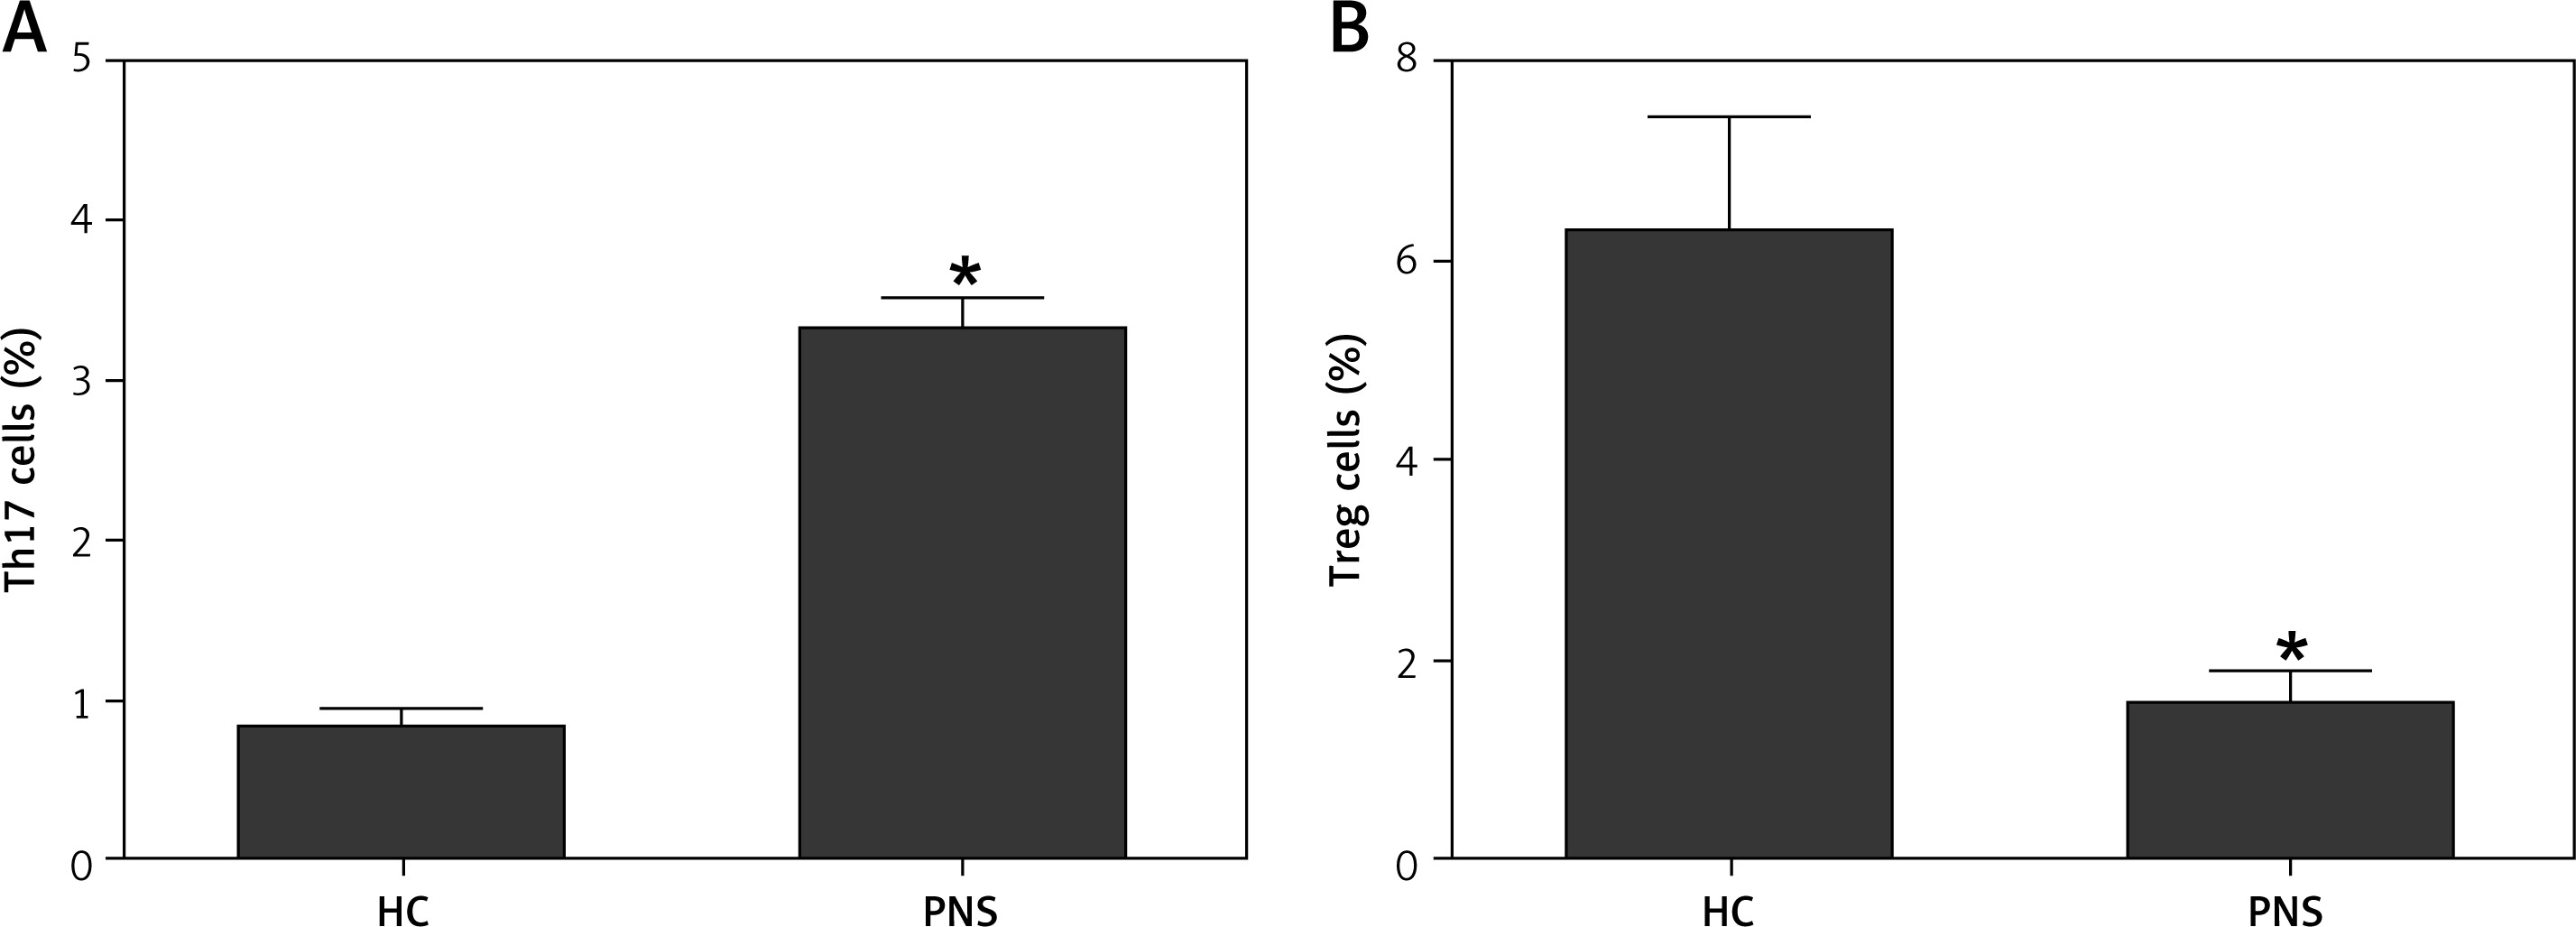
Flow cytometric analysis was performed to determine the percentage of Th17 and Treg cells in the patient groups. As shown in Figure 1, the percentage of Th17 cells in the PNS group was significantly higher than that in the HC group (Figure 1 A), whereas the percentage of Treg cells in the PNS group was markedly lower (Figure 1 B).
Figure 1
The Treg/Th17 ratio was evidently lower in PNS patients (*p-value < 0.05 vs. HC group). A – The percentage of Th17 cells in the PNS group was significantly higher compared with that in the HC group. B – The percentage of Treg cells in the PNS group was markedly lower compared with that in the HC group
Expression of MEG3, miR-17, miR-125a, RORγt mRNA and FOXP3 mRNA in PNS and HC groups
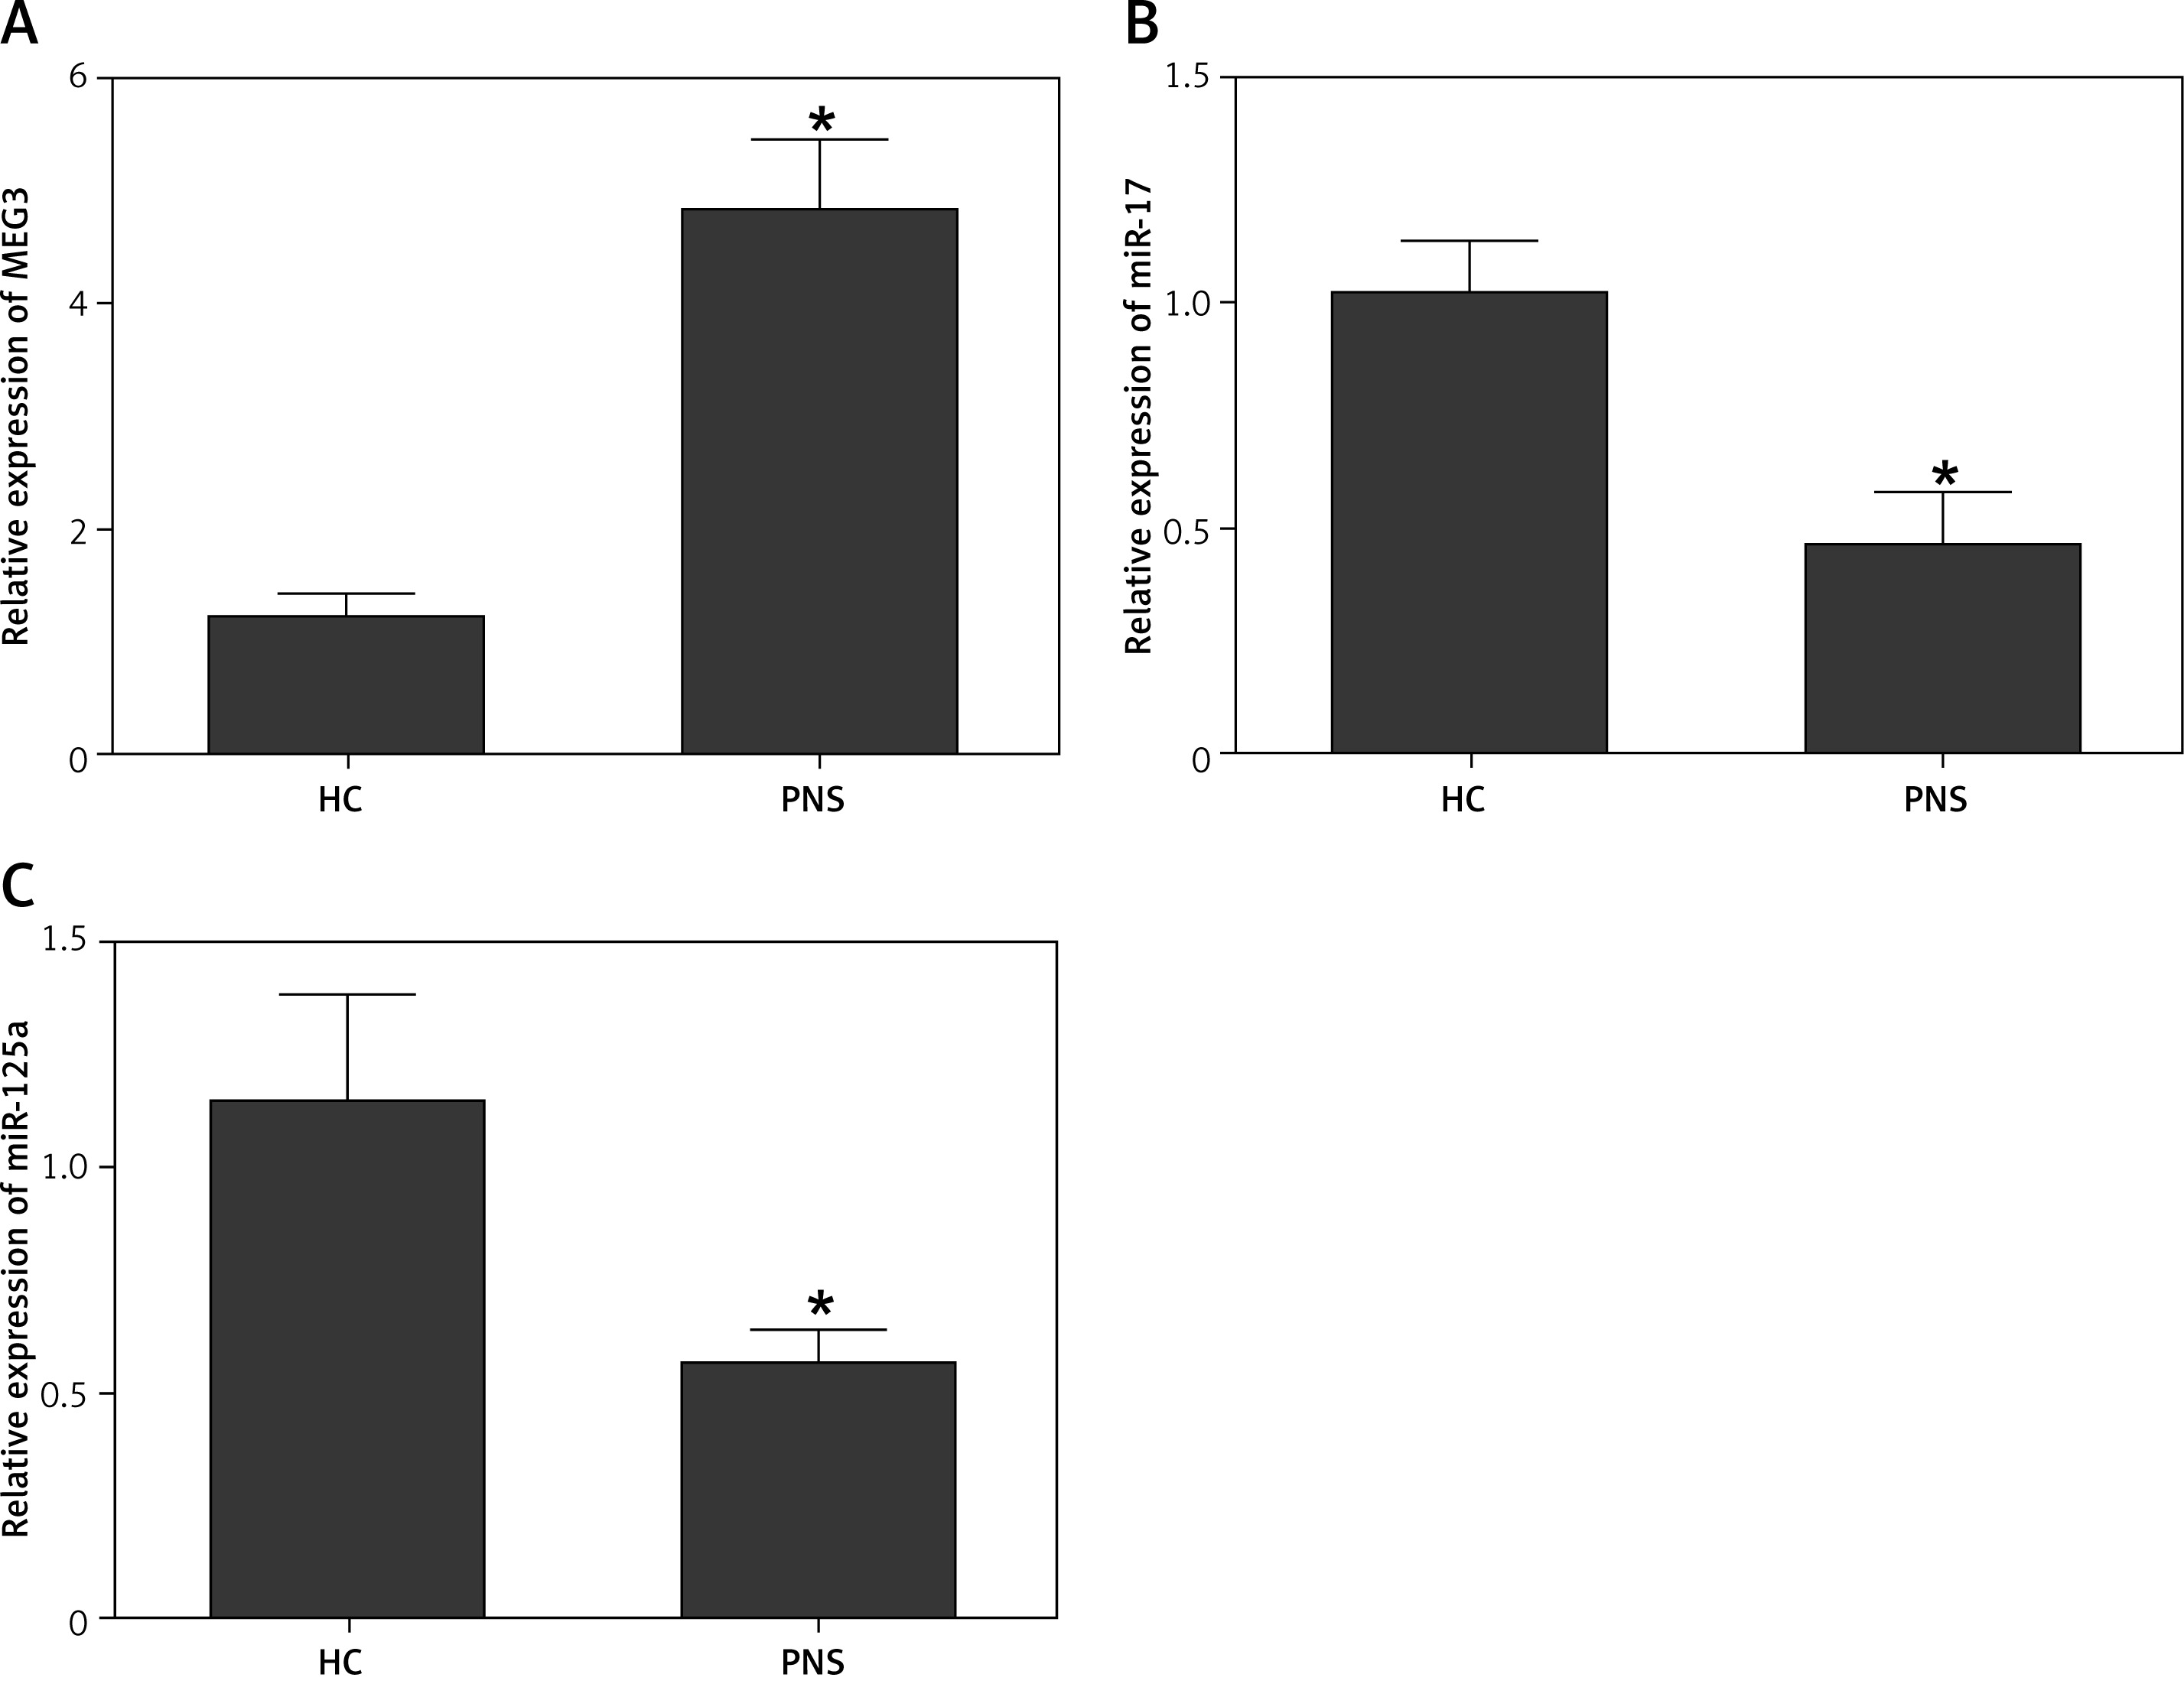
RT-qPCR results of PMBCs collected from the patient groups showed a higher MEG3 level (Figure 2 A) in the PNS group, while the expression of miRNAs including miR-17 (Figure 2 B) and miR-125a (Figure 2 D) was significantly lower in patients with PNS. The expression of mRNAs including RORγt mRNA and FOXP3 mRNA showed a different tendency. Compared with the HC group, the PNS group showed a higher RORγt mRNA level (Figure 2 C) and lower FOXP3 mRNA level (Figure 2 E). Moreover, the plasma level of MEG3 (Figure 3 A) was also higher while the plasma levels of miR-17 (Figure 3 B) and miR-125a (Figure 3 C) were both lower in PNS patients.
Figure 2
Differential expression of MEG3, relevant miRNAs and relevant mRNAs in PBMC samples collected from PNS and HC groups (*p-value < 0.05 vs. HC group). A – PBMC MEG3 expression was higher in the PNS group compared with that in the HC group. B – PBMC miR-17 expression was lower in the PNS group compared with that in the HC group. C – PBMC RORγt mRNA expression was higher in the PNS group compared with that in the HC group. D – Expression of PBMC miR-125a was lower in the PNS group compared with that in the HC group. E – Expression of PBMC FOXP3 mRNA was lower in the PNS group compared with that in the HC group
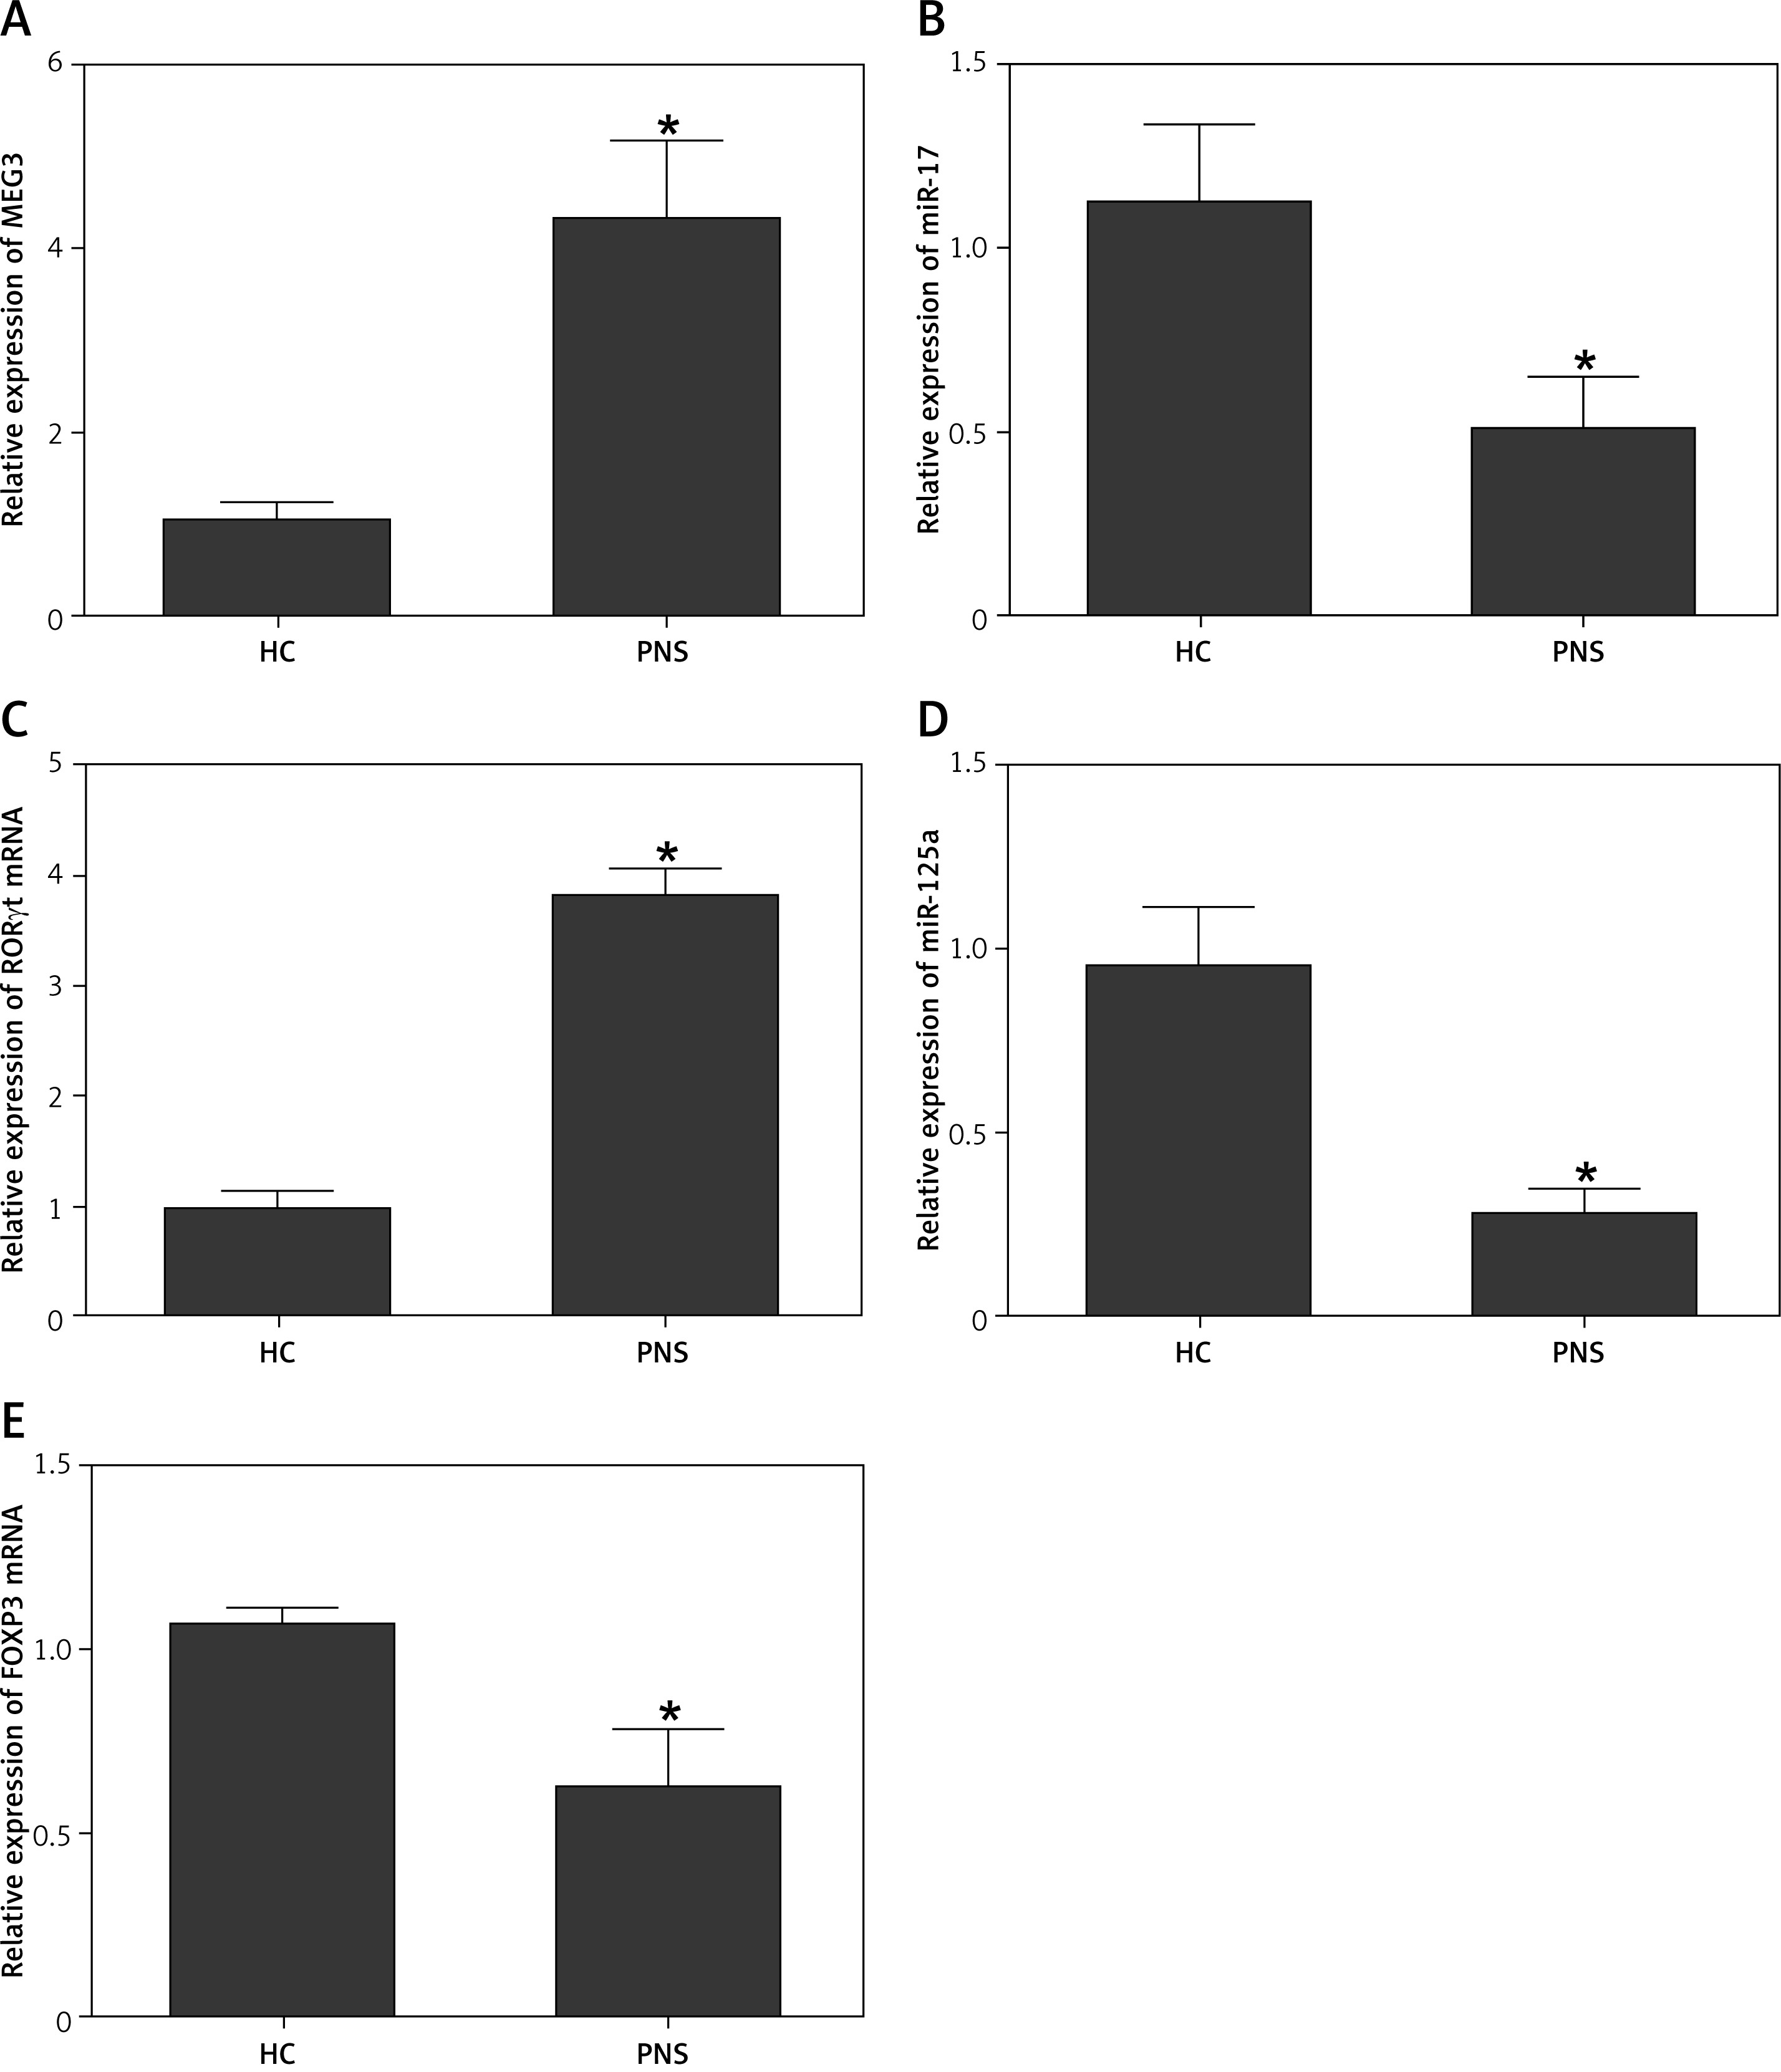
Figure 3
Differential expression of MEG3, miR-17 and miR-125a in plasma samples collected from PNS and HC groups (*p-value < 0.05 vs. HC group). A – Plasma MEG3 expression was higher in the PNS group compared with that in the HC group. B – Plasma miR-17 expression was lower in the PNS group compared with that in the HC group. C – Plasma miR-125a expression was lower in the PNS group compared with that in the HC group
Levels of IL-6 and IL-1β in PNS and HC groups
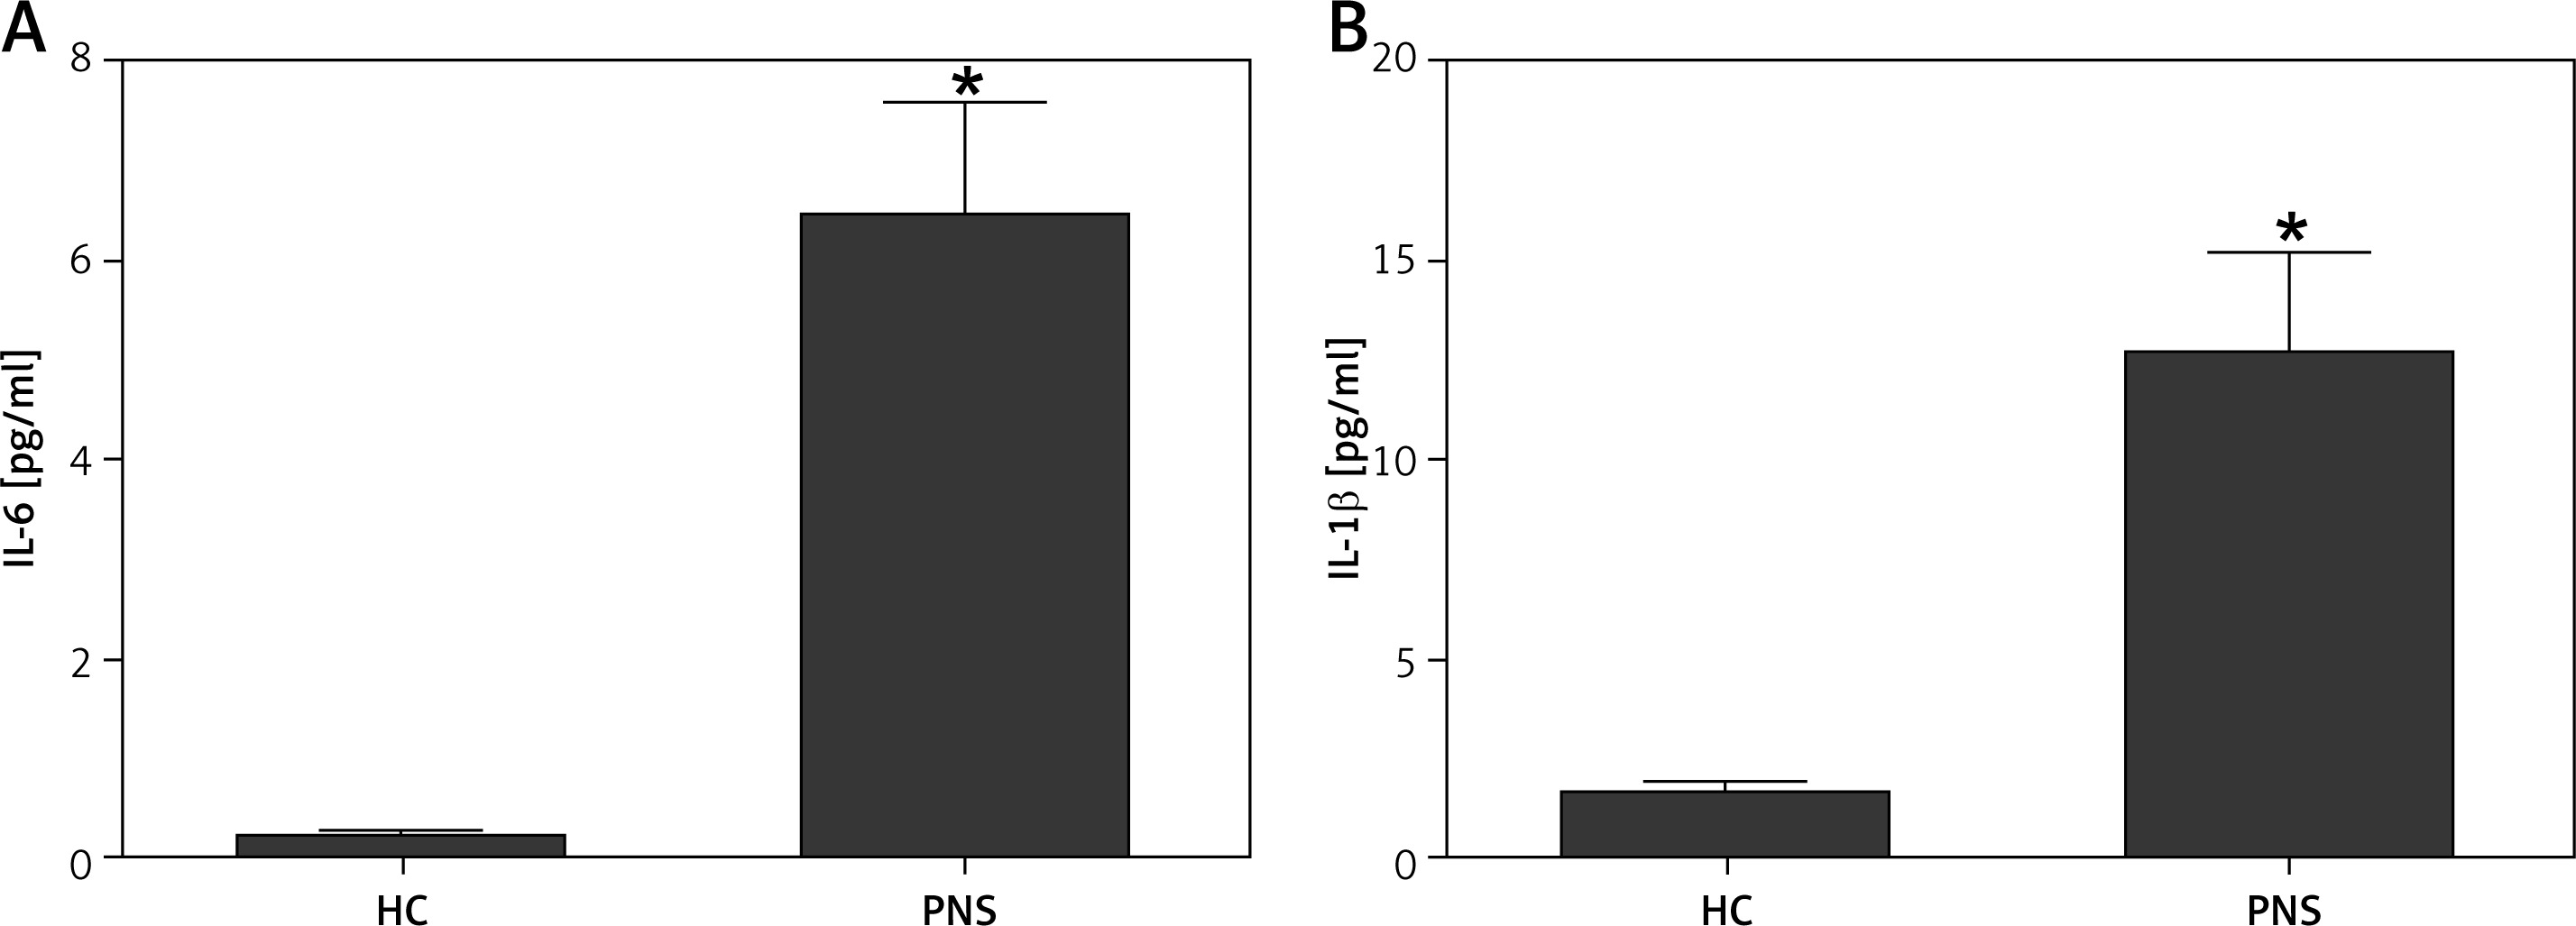
An ELISA assay was conducted to observe the levels of pro-inflammatory cytokines including IL-6 and IL-1β in the patient groups. The levels of both IL-6 (Figure 4 A) and IL-1β (Figure 4 B) were much higher in PNS patients.
Ox-LDL participated in MEG3 signalling
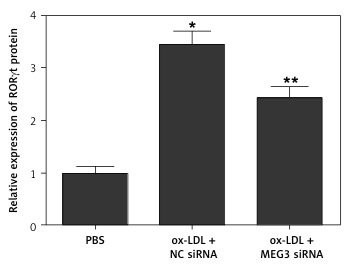
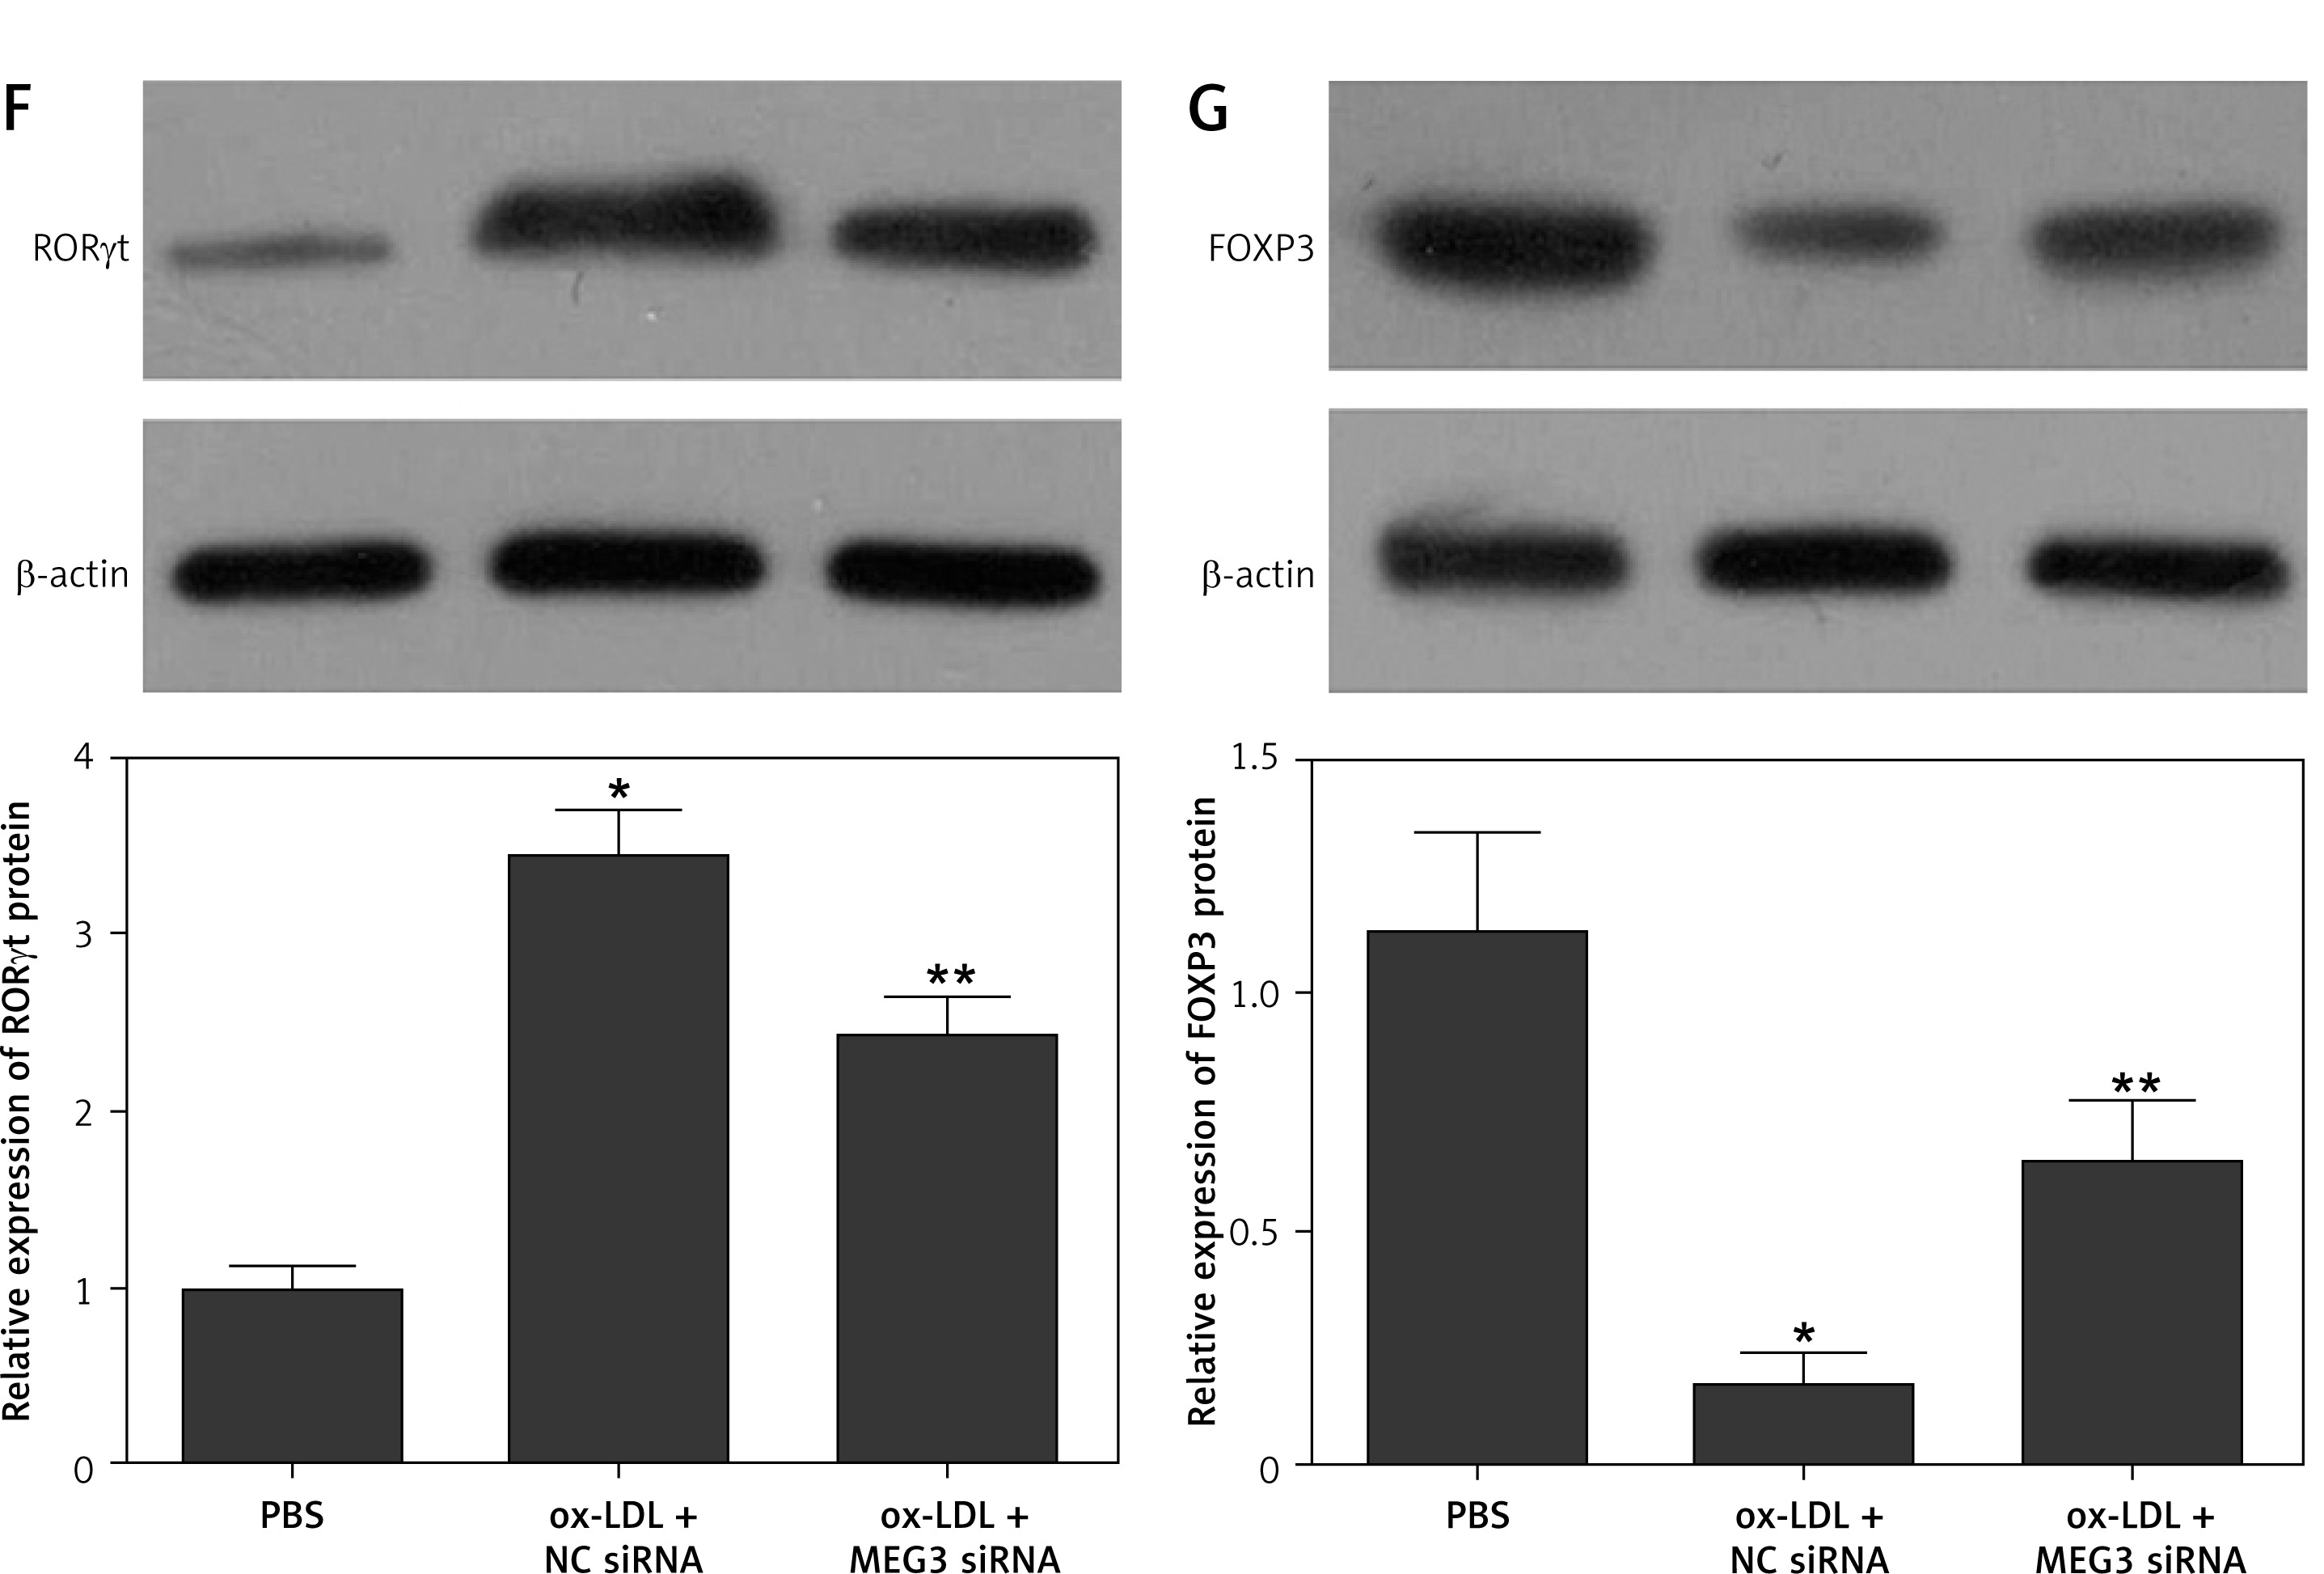
In this study, three groups of THP-1 cells were established: 1) the PBS group in which the cells were treated with PBS only; 2) the ox-LDL + NC siRNA group in which the cells transfected with NC siRNA were treated with ox-LDL; 3) the ox-LDL + MEG3 siRNA group in which the cells transfected with MEG3 siRNA were treated with ox-LDL. The RT-qPCR results indicated that, compared with the PBS group, the expression levels of MEG3 (Figure 5 A) and RORγt mRNA (Figure 5 C) and protein (Figure 5 F) were evidently higher while the expression levels of miR-17 (Figure 5 B), miR-125a (Figure 5 D), and FOXP3 mRNA (Figure 5 E) and protein (Figure 5 G) were markedly reduced by the ox-LDL treatment of NC siRNA-transfected THP-1 cells. Moreover, the transfection of MEG3 siRNA not only reduced the expression of MEG3 up-regulated by ox-LDL, but also partly recovered the dysregulation of relevant miRNAs and mRNAs induced by ox-LDL.
Figure 5
Ox-LDL regulated the expression of MEG3, relevant miRNAs and relevant mRNA in THP-1 cells (*p-value < 0.05 vs. PBS group; **p-value < 0.05 vs. ox-LDL + NC siRNA group). A – Expression of MEG3 in the PBS group, ox-LDL + NC siRNA group and ox- LDL + MEG3 siRNA group. B – Expression of miR-17 in the PBS group, ox-LDL + NC siRNA group and ox- LDL + MEG3 siRNA group. C – Expression of RORγt mRNA in the PBS group, ox-LDL + NC siRNA group and ox-LDL + MEG3 siRNA group. D – Expression of miR-125a in the PBS group, ox-LDL + NC siRNA group and ox-LDL+MEG3 siRNA group. E – Expression of FOXP3 mRNA in the PBS group, ox-LDL + NC siRNA group and ox-LDL + MEG3 siRNA group. F – Expression of RORγt protein in the PBS group, ox-LDL + NC siRNA group and ox-LDL + MEG3 siRNA group. G – Expression of FOXP3 protein in the PBS group, ox-LDL + NC siRNA group and ox-LDL + MEG3 siRNA group
MEG3 signalling
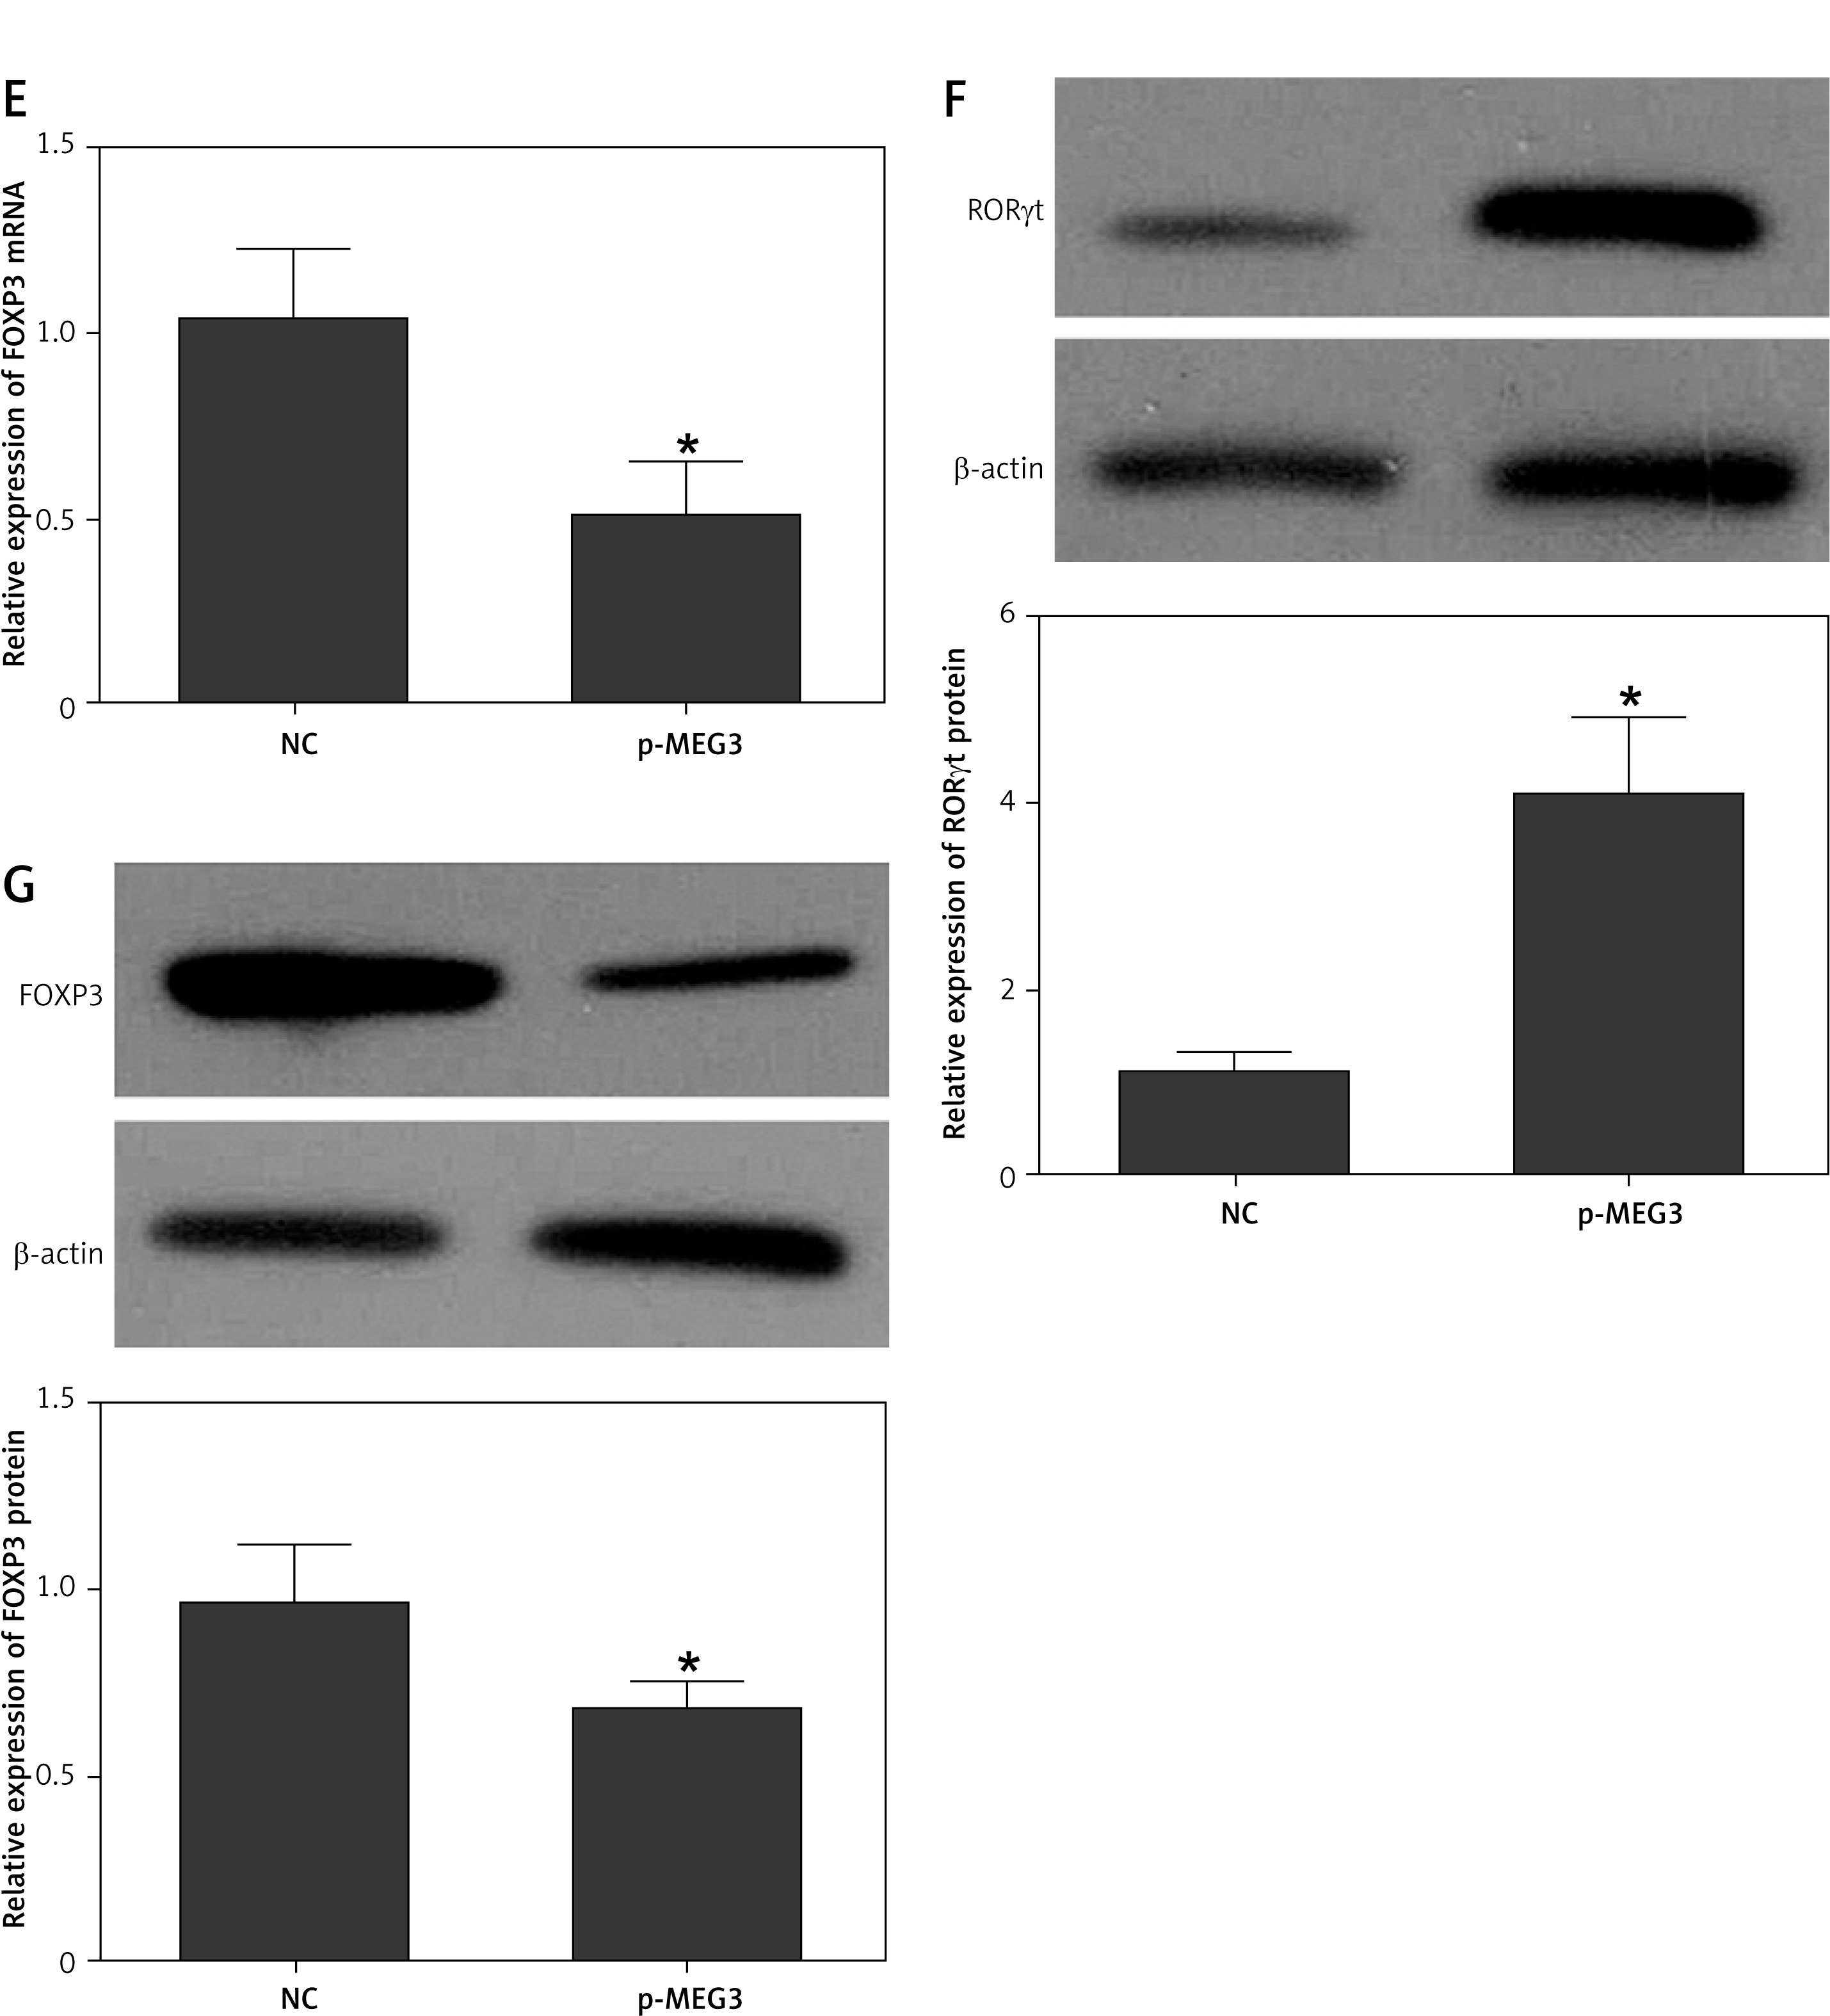
THP-1 cells were transfected with plasmids carrying MEG3. Then, the expression levels of MEG3, relevant miRNAs, relevant mRNAs and relevant proteins were observed. Upon the successful transfection of MEG3 (Figure 6 A), the expression of miRNAs including miR-17 (Figure 6 B) and miR-125a (Figure 6 D) was evidently decreased, while the expression of RORγt mRNA (Figure 6 C) and protein (Figure 6 F) was promoted. The expression of FOXP3 mRNA (Figure 6 E) and protein (Figure 6 G) was also inhibited in the presence of MEG3.
Figure 6
MEG3 regulated the expression of relevant miRNAs and mRNAs in THP-1 cells (*p-value < 0.05 vs. NC group). A – Expression of MEG3 in THP-1 cells transfected with MEG3 compared with that in the negative controls. B – Expression of miR-17 in THP-1 cells transfected with MEG3 compared with that in the negative controls. C – Expression of RORγt mRNA in THP-1 cells transfected with MEG3 compared with that in the negative controls. D – Expression of miR-125a in THP-1 cells transfected with MEG3 compared with that in the negative controls. E – Expression of FOXP3 mRNA in THP-1 cells transfected with MEG3 compared with that in the negative controls. F – Expression of RORγt protein in THP-1 cells transfected with MEG3 compared with that in the negative controls. G – Expression of FOXP3 protein in THP-1 cells transfected with MEG3 compared with that in the negative controls
Establishment of the MEG3 axis
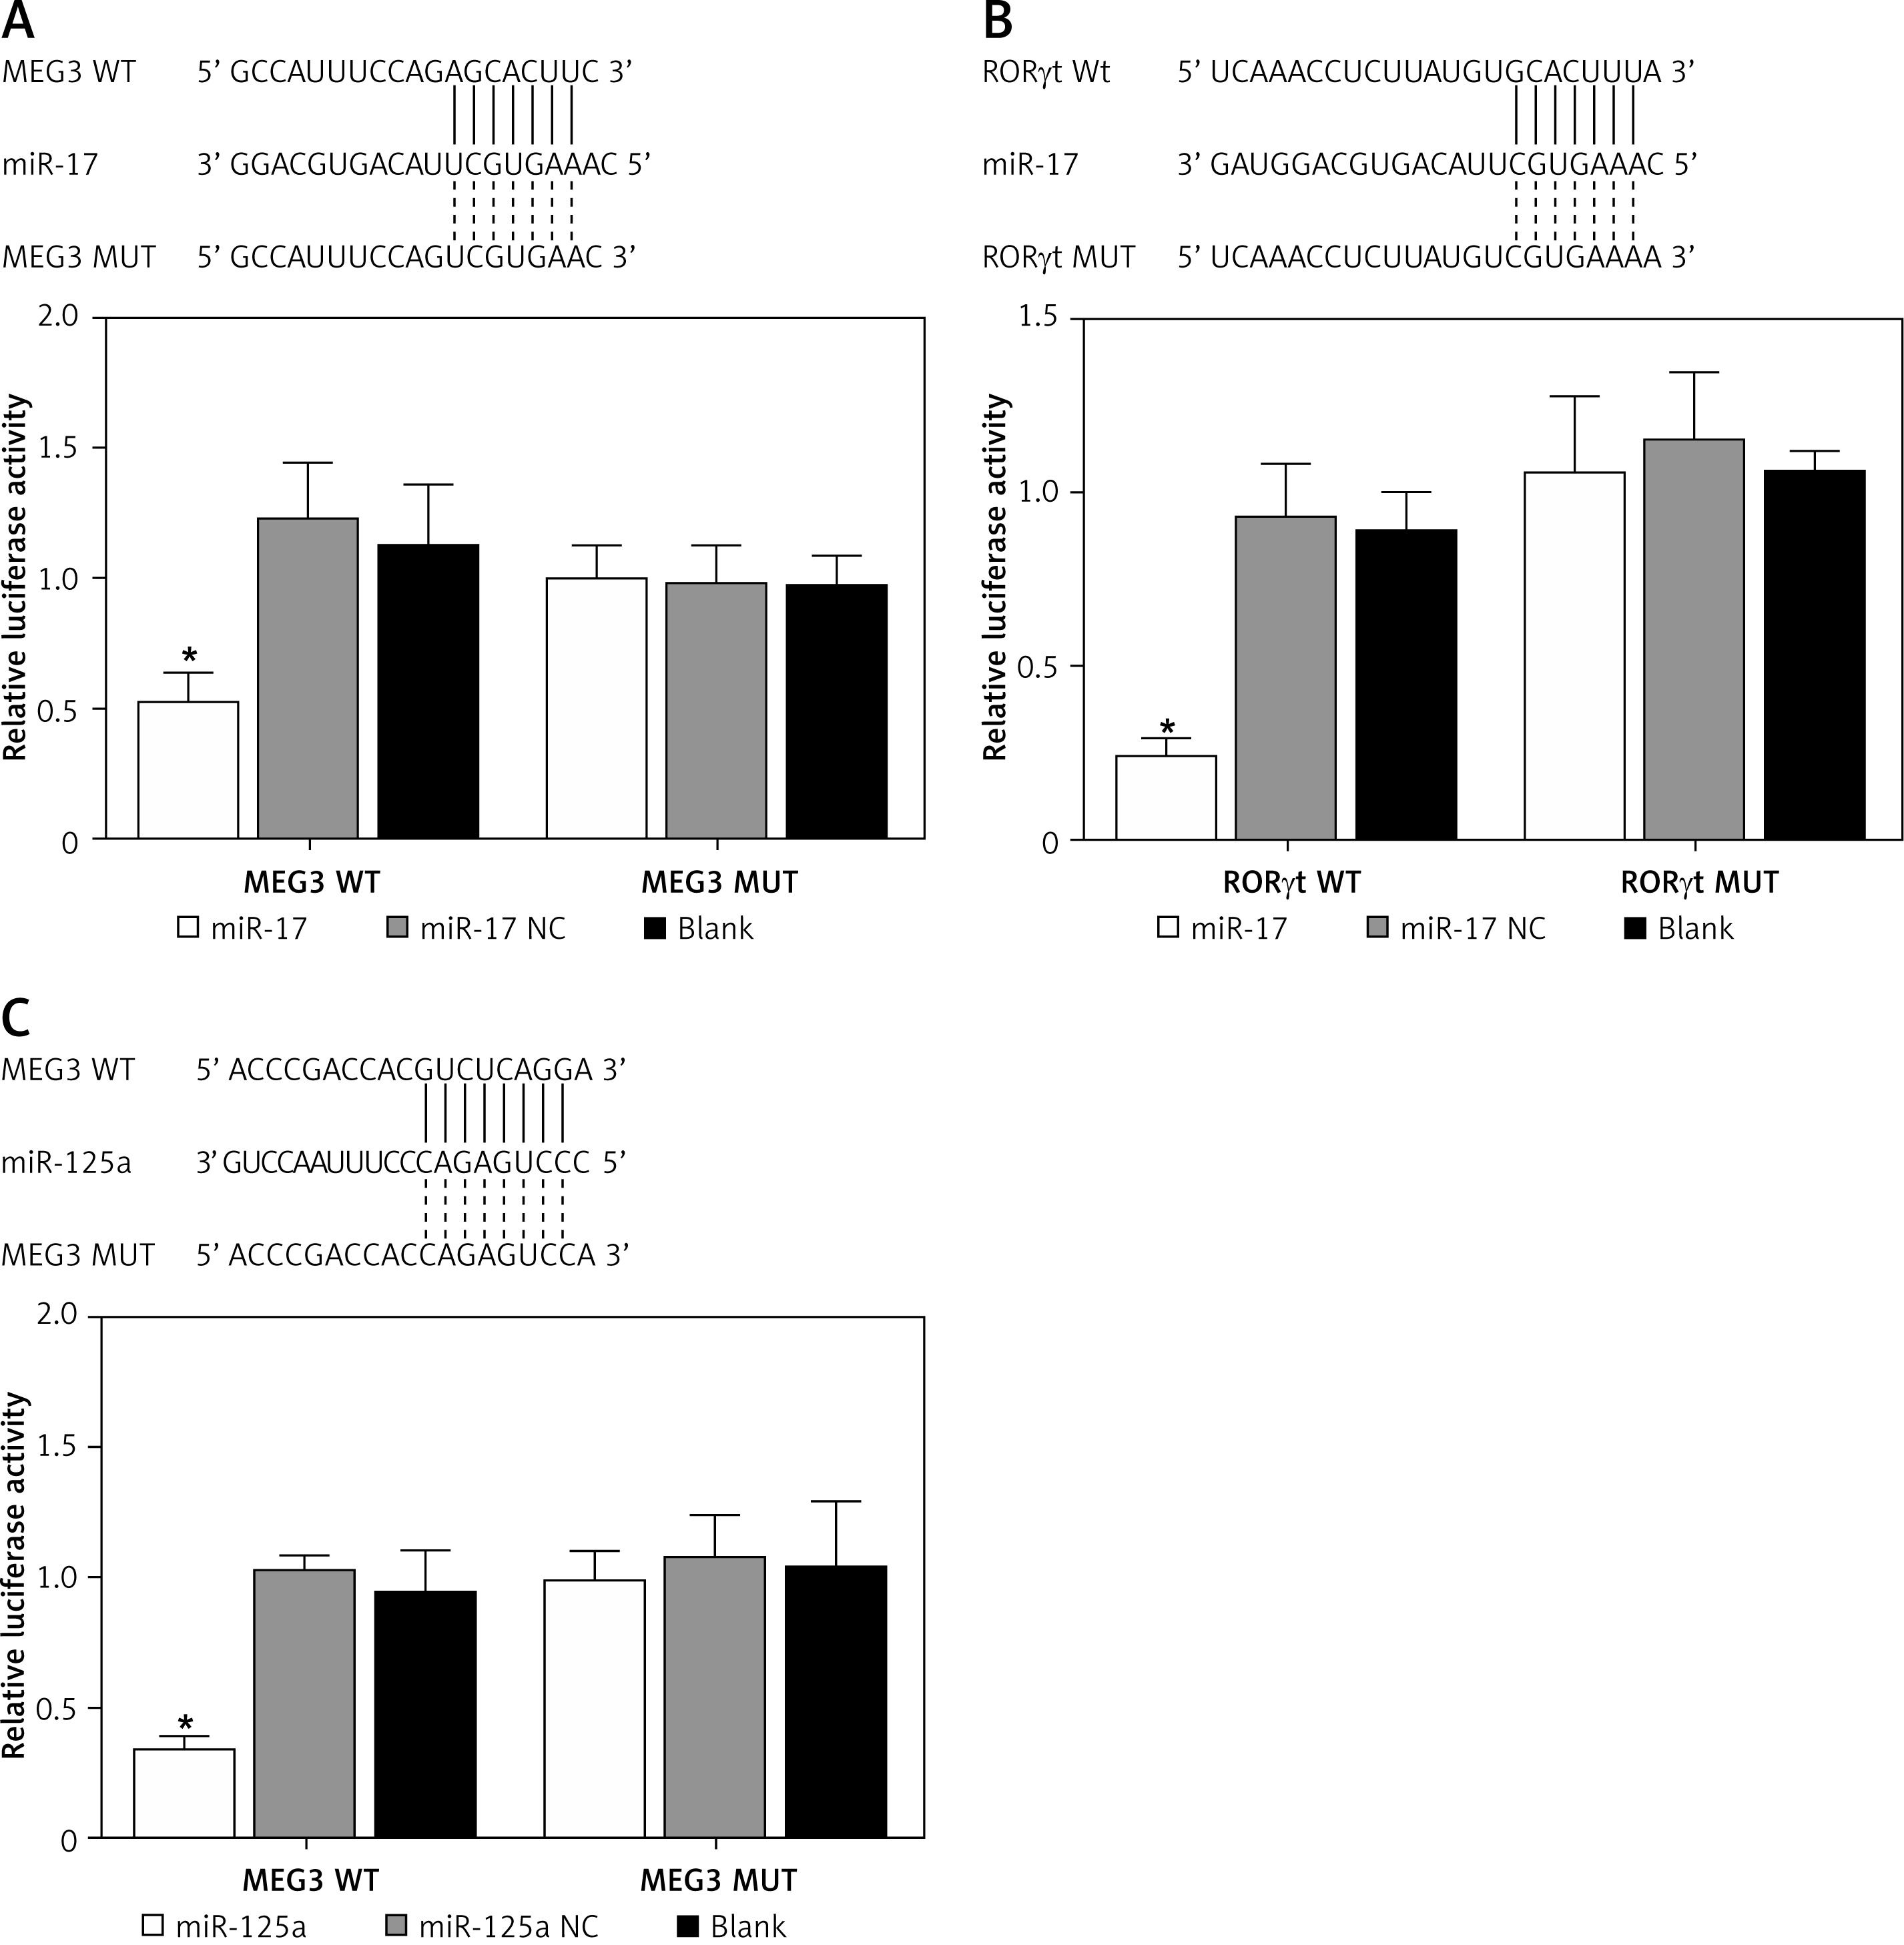
As shown in Figure 7 A, bioinformatic tools predicted a putative binding site of miR-17 on MEG3, and the subsequent luciferase assay validated that the relative luciferase activity was only reduced in THP-1 cells co-transfected with MEG3 and miR-18. Also, a miR-17 putative binding site was observed in the 3¢UTR of RORγt mRNA (Figure 7 B), and the luciferase assay also validated that RORγt mRNA was targeted by miR-17, thus establishing the MEG3/miR-17/RORγt axis. As shown in Figure 7 C, miR-125a could bind to MEG3, and the transfection of miR-125a also reduced the luciferase activity of MEG3 in THP-1 cells, validating the signalling pathway of MEG3/miR-125a/FOXP3.
Figure 7
MEG3 could sponge miR-17 and miR- 125a expression, while RORγt mRNA expression was targeted by miR-17 (*p-value < 0.05 vs. blank group). A – Bioinformatic tools and luciferase assay validated that MEG3 could sponge miR-17 expression. B – Bioinformatic tools and luciferase assay validated that RORγt mRNA was targeted by miR-17. C – Bioinformatic tools and luciferase assay validated that MEG3 could sponge miR-125a expression
Discussion
In this study, we enrolled subjects with or without PNS and compared their expression of candidate lncRNAs, miRNAs, and target genes. We found that, in the PNS group, the percentage of Th17 cells was higher whereas the percentage of Treg cells was lower. In the PBMC and plasma samples collected from the PNS group, a higher MEG3 level was observed with lower levels of miR-17 and miR-125a. The mRNA level of RORγt was higher while the FOXP3 mRNA level was lower in the PNS group. Moreover, the levels of pro-inflammatory cytokines including IL-6 and IL-1β were much higher in PNS patients. A past study revealed that ox-LDL induced a stronger effect on Treg cells as compared to the effect on Th17 cells in paediatric PNS [14]. It was additionally reported that ox-LDL reduced the viability as well as proliferation of cells to promote persistent inflammation as well as apoptosis. It was also found that ox-LDL plays its role through upregulating the expression of MEG3 in Raw264.7 cells [17]. Many studies have shown that three cytokines play important roles in coronary heart diseases. For example, IL-5 links natural and adaptive immunity to the epitopes of low-density lipoprotein (LDL) that has been oxidized to induce the growth of cells carrying IgM antibodies that are specific to oxLDL. Furthermore, IL-10 and TGF-B are both related to Treg cells by playing critical and non-redundant roles in preventing the development of atherosclerosis by means of their immunosuppressive, anti-inflammatory, as well as vasculo-protective features [18]. Naive CD4+ T cells in mice activated by TGF-b as well as IL-6 result in activation of retinoic acid-related orphan nuclear receptor gt (RORγt), which controls the differentiation of Th17 cells [19]. It was also discovered that Th17 cells result in paediatric PNS by elevating the expression of IL-23, IL-1β, IL-6, as well as RORc [4].
Past research has shown that lncRNA-MEG3 regulates the balance between Treg and Th17 cells [12]. For example, qRT-PCR showed positive lncRNA-MEG3 as well as microRNA-17 expression in the CD4+ T cells isolated from the peripheral blood samples of patients with asthma, while the increased expression of lncRNA MEG3 was accompanied by the increased expression of microRNA-17, suggesting that the lncRNA MEG3 may disrupt the equilibrium between Treg and Th17 cells in patients with asthma [11]. Bioinformatic analysis also illustrated the presence of 4 binding sites between miR-125a-5p and MEG3, and MEG3 inhibited the expression of miR-125a-5p by interacting with it directly, so as to induce an imbalance between the number of Treg and Th17 cells in ITP [12]. Another study also revealed that lncRNA MEG3 can work as a ceRNA to suppress the expression of microRNA-17 while upregulating the expression of RORγt, causing the hyperfunction of Th17 as well as a reduced Treg/Th17 ratio [11]. In this study, we also performed bioinformatic and luciferase assays to validate that MEG3 can sponge miR-17 and miR-125a expression, and that RORγt mRNA was targeted by miR-17, thus establishing the MEG3/miR-125a/FOXP3 axis and MEG3/miR-17/RORγt axis.
Interestingly, the depletion in the number of Foxp3+ CD4+ Treg cells causes severe auto-immunity, immuno-pathology, as well as allergy [20]. It was also observed that the number of Treg cells was significantly reduced in PNS patients, suggesting that Treg cells play a key protective role in the onset of proteinuria as well as PNS [21, 22]. It was also found that the effect of lncRNA MEG3 on targeting microRNA-17 and RORγt affects the activity of Th17 cells. Thus, abnormalities in the expression of lncRNAs as well as microRNAs in CD4+ T cells can help to diagnose asthma [11]. In this study, we found that the expression levels of MEG3 and RORγt mRNA/protein were evidently higher while the expression levels of miR-17, miR-125a, and FOXP3 mRNA/protein were markedly reduced by the ox-LDL treatment of NC siRNA-transfected THP-1 cells, and the transfection of MEG3 siRNA partly recovered the dysregulation of the expression of MEG3, relevant miRNAs and relevant mRNAs induced by ox-LDL. Also, the expression of miRNAs including miR-17 and miR-125a was evidently decreased upon the successful transfection of MEG3, which also promoted the RORγt mRNA/protein expression while inhibiting FOXP3 mRNA/protein expression.
RORγt has been considered as a crucial transcription factor in Th17 cells. Certainly, the RORγt expression in naïve CD4+ T cells induced by retroviral vectors promoted their differentiation to cells with IL-17A as well as IL-17F expression [19, 23]. Given that RORγt is crucial for the polarization of Th17 cells in mice, cytokines IL-6 and TGFb can increase RORγt expression in Th17 cells [19]. Interestingly, mice fed with a diet enriched in trans fats revealed greater IL-17 as well as RORγt expression along with elevated Th17 responses in colitis and severe intestinal inflammation [24, 25].
Our results demonstrated that ox-LDL could promote the inflammatory responses of PNS by up-regulating the expression levels of L-6 and IL-1β. The MEG3/miR-125a/FOXP3 axis and MEG3/miR-17/RORγt axis were established by our study, indicating that the up-regulated MEG3 expression induced by administration of ox-LDL could down-regulate the expression of FOXP3 and up-regulate the expression of RORγt, respectively. Accordingly, the dysregulation of FOXP3 and RORγt respectively led to the decreased Treg/Th17 ratio, thus resulting in the up-regulation of IL-6 and IL-1β in PNS.

