

Introduction
Chronic kidney disease (CKD) affects approximately 10–15% of the global population, significantly increasing patients’ cardiovascular event risk and all-cause mortality while imposing a substantial economic burden on healthcare systems [1, 2]. Given this formidable disease burden, early identification of high-risk populations for CKD and accurate prognostic risk assessment in diagnosed patients hold paramount clinical significance for disease prevention, early intervention, and the development of individualized therapeutic strategies [3, 4].
The development and progression of CKD represents a complex process involving multiple pathophysiological mechanisms, primarily encompassing chronic inflammatory responses, oxidative stress, endothelial dysfunction, immune system dysregulation, and nutritional-metabolic abnormalities [5–10]. Based on the complexity and diversity of CKD pathogenesis, composite biomarkers that integrate multiple pathophysiological pathways have demonstrated significant advantages in disease risk prediction and prognostic assessment in recent years [11, 12]. The CALLY index, as an emerging composite biomarker, is calculated using albumin, lymphocyte, and C reactive protein (CRP), quantifying the complex interactions among inflammatory cascades, nutritional status, and immune function, potentially providing a more comprehensive and precise information integration platform for disease risk prediction and prognostic assessment [13, 14]. However, despite the demonstrated prognostic predictive value of the CALLY index in oncology and cardiovascular disease fields, research on its application in renal disease remains relatively sparse, representing a significant research gap [14–19].
To address this critical knowledge gap, we utilized the National Health and Nutrition Examination Surveys (NHANES) data to conduct systematic analysis of relationships between the CALLY index and CKD prevalence, including its prognostic value among CKD patients in a nationally representative study population. We hypothesized that the CALLY index would demonstrate significant associations with CKD risk and mortality outcomes, with higher values indicating better prognosis.
Material and methods
Study population
Data for this investigation originated from NHANES, a comprehensive national survey administered by the National Center for Health Statistics within the Centers for Disease Control and Prevention (CDC) structure. The survey uses a stratified, multistage randomized sampling framework to achieve national U.S. population representation. The study received ethical approval from the National Center for Health Statistics (NCHS) Ethics Review Board (https://www.cdc.gov/nchs/nhanes/about/erb.html) (Protocol #98-12 for 1999-2004; Protocol #2005-06 for 2005-2010). The analysis incorporated six consecutive NHANES examination cycles conducted from 1999–2000 to 2009–2010 (https://wwwn.cdc.gov/nchs/nhanes). Participants across these cycles completed comprehensive questionnaires and underwent extensive physical examinations and laboratory assessments [20]. Exclusion criteria included individuals below 20 years of age, pregnant participants, and those with missing CALLY index, estimated glomerular filtration rate (eGFR), and urinary albumin-to-creatinine ratio (UACR) data, yielding a final study sample of 26 996 subjects.
Calculation of CALLY index and definition of CKD
The CALLY index was computed using the formula: albumin (g/l) × lymphocyte count (109/l)/[CRP (mg/l) × 10] [13]. CKD identification was established through an eGFR under 60 ml/min/1.73 m2 and/or UACR ≥ 30 mg/g, indicating albuminuria [21]. The eGFR calculation employed the Chronic Kidney Disease Epidemiology Collaboration (CKD-EPI) equation, which integrates patient age, sex, race, and serum creatinine (Scr) concentrations [22].
Mortality
The research utilized the NHANES Public-Use Linked Mortality File encompassing data up to December 31, 2019, employing probabilistic algorithms to match National Death Index (NDI) records for mortality status verification. Follow-up time for CKD study participants was determined by the interval spanning from baseline evaluation to the most recent documented survival date or censoring in the mortality file. The investigation’s main endpoints comprised all-cause mortality and cardiovascular deaths within the CKD study population. Cardiovascular-related mortality was specified according to International Statistical Classification of Diseases, 10th Revision (ICD-10) standards and NCHS categorization of heart disease (054-068) and cerebrovascular conditions (070).
Covariates
Several confounding factors were included in our analysis. Demographics encompassed age, sex, race (Mexican American, Non-Hispanic White, Non-Hispanic Black, Other Hispanic, other races), marital status (married/unmarried), poverty-income ratio (PIR), and educational achievement (above high school or not). Behavioral factors included smoking history (former/current users). Clinical parameters comprised hypertension, diabetes, cardiovascular diseases (CVDs), and biomarkers: body mass index (BMI), triglycerides (TG), total cholesterol (TC), high-density lipoprotein cholesterol (HDL-c), and low-density lipoprotein cholesterol (LDL-c), and uric acid (UA). Hypertension was identified by self-reported diagnosis, average systolic/diastolic blood pressure ≥ 140/90 mm Hg, or antihypertensive medication. Diabetes was defined through self-report, fasting plasma glucose (FPG) ≥ 7.0 mmol/l, hemoglobin A1c (HbA1c) ≥ 6.5%, or current use of antidiabetic medications. CVDs included coronary heart disease, myocardial infarction, stroke, heart failure, and angina.
Statistical analysis
A population-weighted, multi-stage survey design was implemented following the Centers for Disease Control and Prevention (CDC) weighting standards. Descriptive analyses presented continuous variables as weighted means with 95% confidence intervals (CI) and categorical variables as unweighted frequencies with weighted percentages. Statistical comparisons employed weighted t-tests for continuous measures and χ2 tests for categorical outcomes. The CALLY index-CKD relationship was analyzed using three logistic regression models: unadjusted baseline, demographic-controlled (age, sex, race, marital status, PIR, education level, and smoking history), and fully adjusted incorporating hypertension, diabetes mellitus, CVDs, BMI, TG, HDL-c, LDL-c, and UA levels. SHapley Additive exPlanations (SHAP) values were further implemented to elucidate feature contributions. Rooted in game theory’s Shapley framework, SHAP values enable equitable allocation of influence for each predictor across specific instances during model inference. Feature importance and swarm plot visualizations were generated for the top 10 predictors. Dose-response associations were examined via restricted cubic spline (RCS) methodology using four knots with the median log-transformed (ln) CALLY index as the referent category. Covariate-specific subgroup analyses were also performed. Survival analysis used Cox proportional hazards modeling to evaluate CALLY index associations with all-cause and cardiovascular mortality among CKD patients. Kaplan-Meier estimation calculated cumulative mortality risk across CALLY index quartiles, with log-rank testing comparing survival distributions. Statistical analysis was performed using R software, with statistical significance set at two-sided p < 0.05.
Results
Baseline characteristics
Table I data reveal pronounced differences between CKD and non-CKD subjects. Participants with CKD showed advanced age, increased female proportion, and distinctive racial composition featuring higher Non-Hispanic Black and lower Mexican American percentages (p < 0.001). Socioeconomic indicators demonstrated reduced PIR and educational attainment (p < 0.001). Enhanced comorbidity prevalence encompassed hypertension, diabetes, and CVDs (p < 0.001). Physical parameters showed elevated BMI, while lipid evaluations indicated increased TG and reduced LDL-c, with unaltered TC and HDL-c (p < 0.001). Laboratory findings included higher UA, CRP, and UACR concentrations, coupled with decreased albumin, lymphocyte levels, and eGFR, yielding lower CALLY measurements (p < 0.001). Table II presents ordered variations across CALLY index categories. Lower categories contained older participants with female predominance and elevated Non-Hispanic Black representation (p < 0.001). Socioeconomic factors improved systematically across categories, reflected in increasing PIR and educational standards (p < 0.001). Disease prevalence diminished substantially from lower to higher categories, affecting hypertension, diabetes, and CVDs (p < 0.001). BMI showed a progressive decrease across categories (p < 0.001). TG and TC achieved maximum levels in category two, HDL-c rose continuously, while LDL-c peaked in category two (p < 0.001). Biomarker trajectories were distinct: UA, CRP, and UACR decreased systematically, whereas albumin, lymphocytes, and eGFR increased correspondingly (p < 0.001). CKD incidence correlated negatively with CALLY categories (p < 0.001).
Table I
Demographic and clinical characteristics of participants according to CKD status
[i] Data reported as weighted means and confidence intervals for continuous variables, unweighted counts and weighted percentages for categorical variables. PIR – poverty-income ratio; CVDs – cardiovascular diseases; BMI – body mass index; TG – triglycerides; TC – total cholesterol; HDL-C – high-density lipoprotein cholesterol; LDL-C – low-density lipoprotein cholesterol; UA – uric acid; eGFR – estimated glomerular filtration rate; UACR – urinary albumin-to-creatinine ratio; CRP – C-reactive protein; CALLY Index – C-reactive protein-albumin-lymphocyte index; CKD – chronic kidney disease.
Table II
Demographic and clinical characteristics of participants across CALLY index quartiles
[i] Data reported as weighted means and confidence intervals for continuous variables, unweighted counts and weighted percentages for categorical variables. PIR – poverty-income ratio; CVDs – cardiovascular diseases; BMI – body mass index; TG – triglycerides; TC – total cholesterol; HDL-C – high-density lipoprotein cholesterol; LDL-C – low-density lipoprotein cholesterol; UA – uric acid; eGFR – estimated glomerular filtration rate; UACR – urinary albumin-to-creatinine ratio; CRP – C-reactive protein; CALLY Index – C-reactive protein-albumin-lymphocyte index; CKD – chronic kidney disease.
Associations between CALLY index and CKD
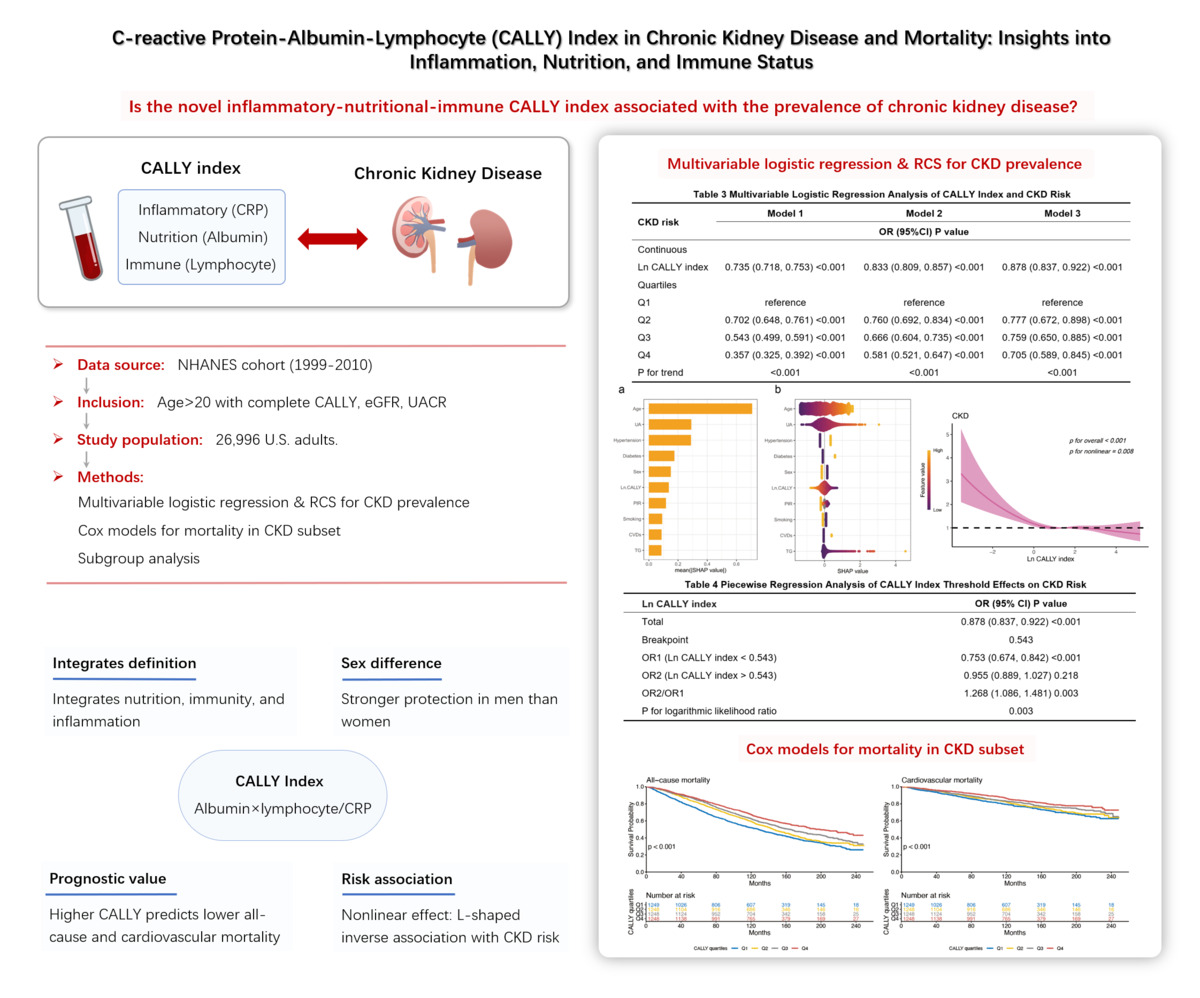
The multivariable logistic regression findings presented in Table III illustrate the relationship between ln CALLY index and CKD susceptibility using three sequential adjustment models. When stratified by quartiles, the analysis revealed a consistent inverse dose-dependent pattern, using the first quartile (Q1) as the baseline comparator. A statistically significant trend was observed across all models, with ascending CALLY quartiles associated with decreased CKD susceptibility (p for trend < 0.001). The comprehensive adjustment model indicated that Q2 participants experienced a 22.3% significant reduction in risk (OR = 0.777, 95% CI: 0.672–0.898, p < 0.001), while Q3 showed significant risk attenuation of 24.1% (OR = 0.759, 95% CI: 0.650–0.885, p < 0.001). The uppermost quartile (Q4) provided maximum protection, reducing risk by 29.5% relative to the reference group (OR = 0.705, 95% CI: 0.589–0.845, p < 0.001). SHAP analysis identified age as the strongest predictor for CKD, followed closely by UA, hypertension, and diabetes (Figure 1 A). Ln CALLY was ranked sixth in terms of contribution, indicating a moderate meaningful role in CKD risk (Figure 1 A). Swarm plot results showed that higher Ln CALLY values (highlighted in yellow) corresponded to lower SHAP scores, implying a reduced risk of CKD (Figure 1 B). Further RCS modeling indicated a L-shaped relationship between Ln CALLY index and CKD risk (Figure 2). Subsequent piecewise regression analysis identified the optimal inflection point at ln CALLY index = 0.543 (Table IV). Below this threshold, each unit increase in Ln CALLY index corresponded to a 24.7% risk reduction (OR = 0.753, 95% CI: 0.674–0.842, p < 0.001), while above the inflection point, the protective effect plateaued (OR = 0.955, 95% CI: 0.889–1.027, p = 0.218).
Table III
Multivariable logistic regression analysis of CALLY index and CKD risk
[i] OR – odds ratio. 95% CI – 95% confidence interval. Model 1: non-adjusted. Model 2: adjusted for age, sex, race, marital status, PIR, education level, and smoking history. Model 3: adjusted for age, sex, race, marital status, PIR, education level, smoking history, hypertension, diabetes, CVDs, BMI, TG, HDL-c, LDL-c, and UA levels.
Figure 1
SHAP value analysis of predictive features. A – Mean absolute SHAP value ranking of top 10 features; B – SHAP value distribution swarm plot showing top 10 features impact and value relationships
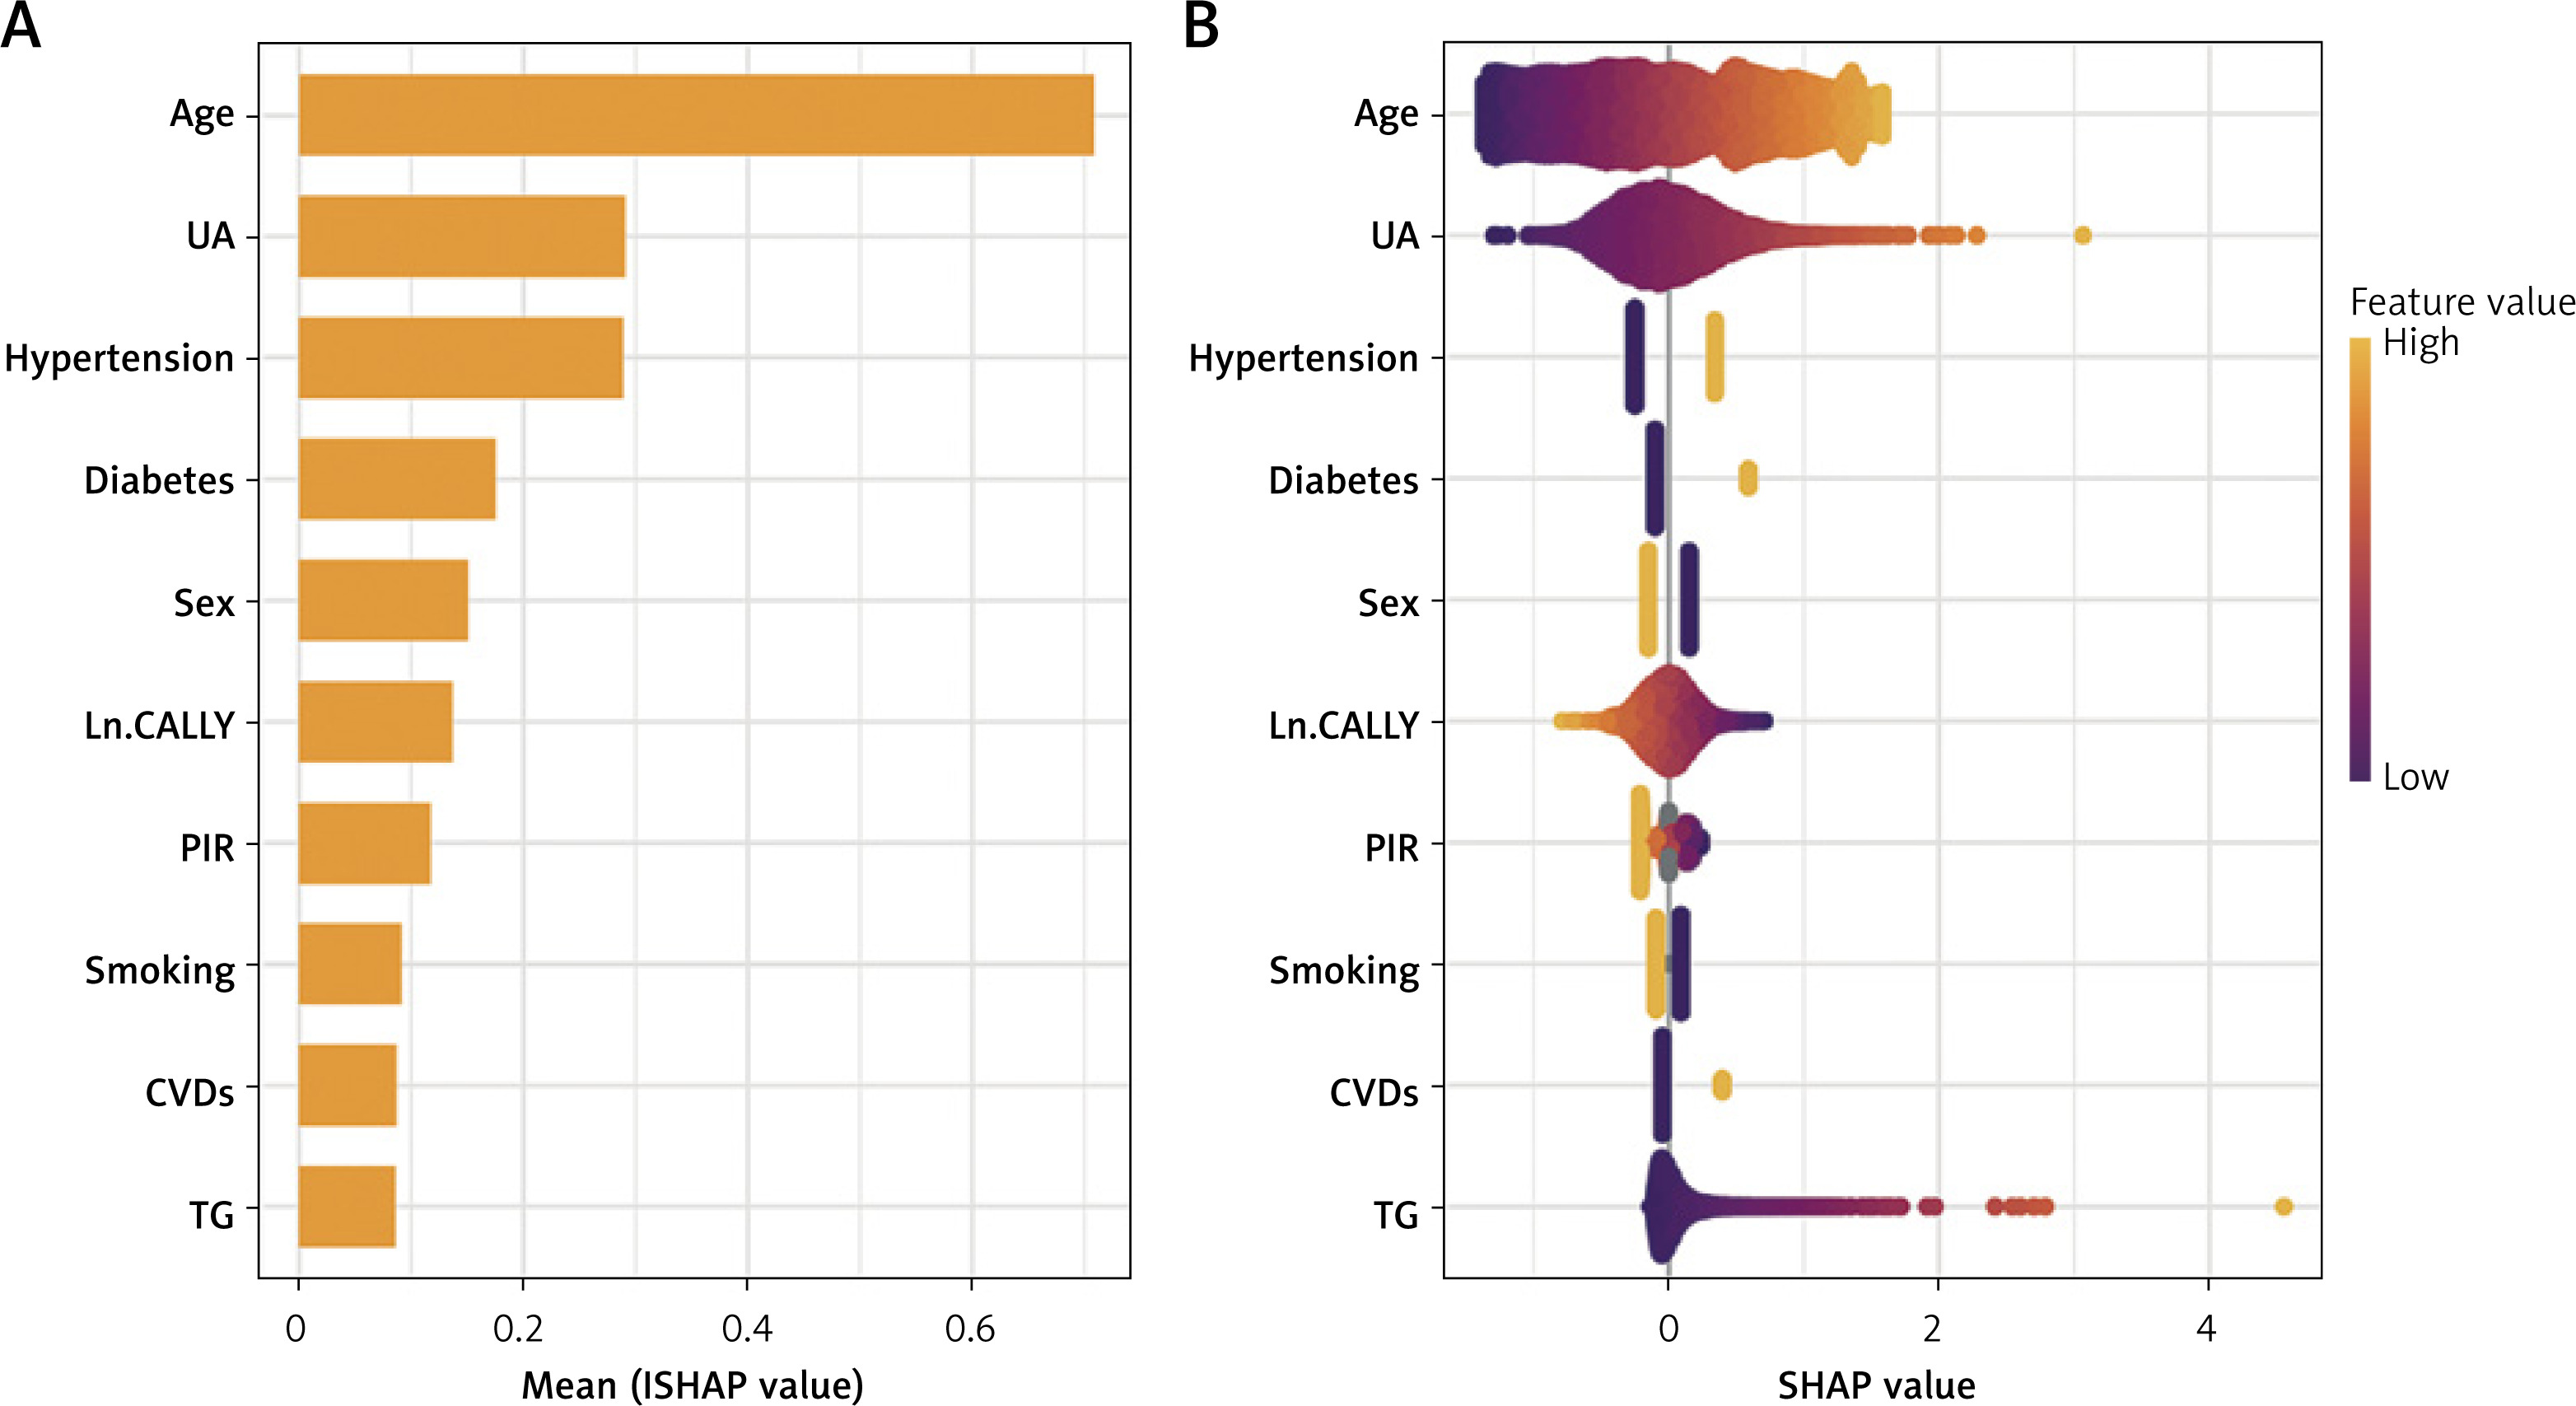
Figure 2
Restricted cubic spline curve demonstrating the relationship between ln CALLY index and CKD risk
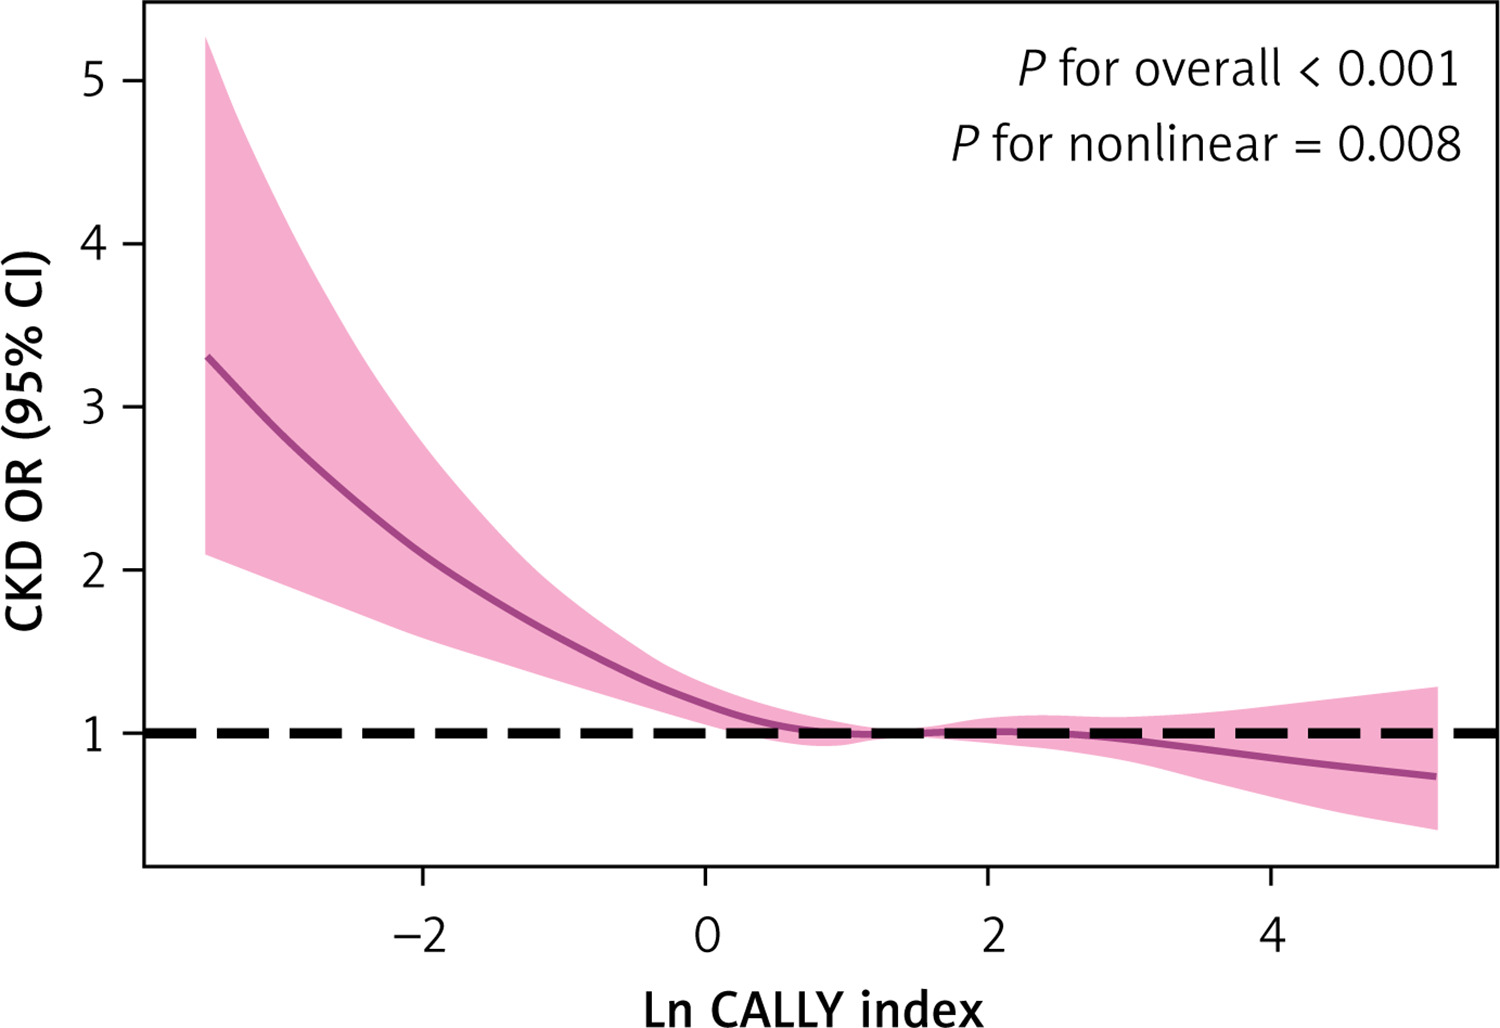
Table IV
Piecewise regression analysis of CALLY index threshold effects on CKD risk
Subgroup analyses
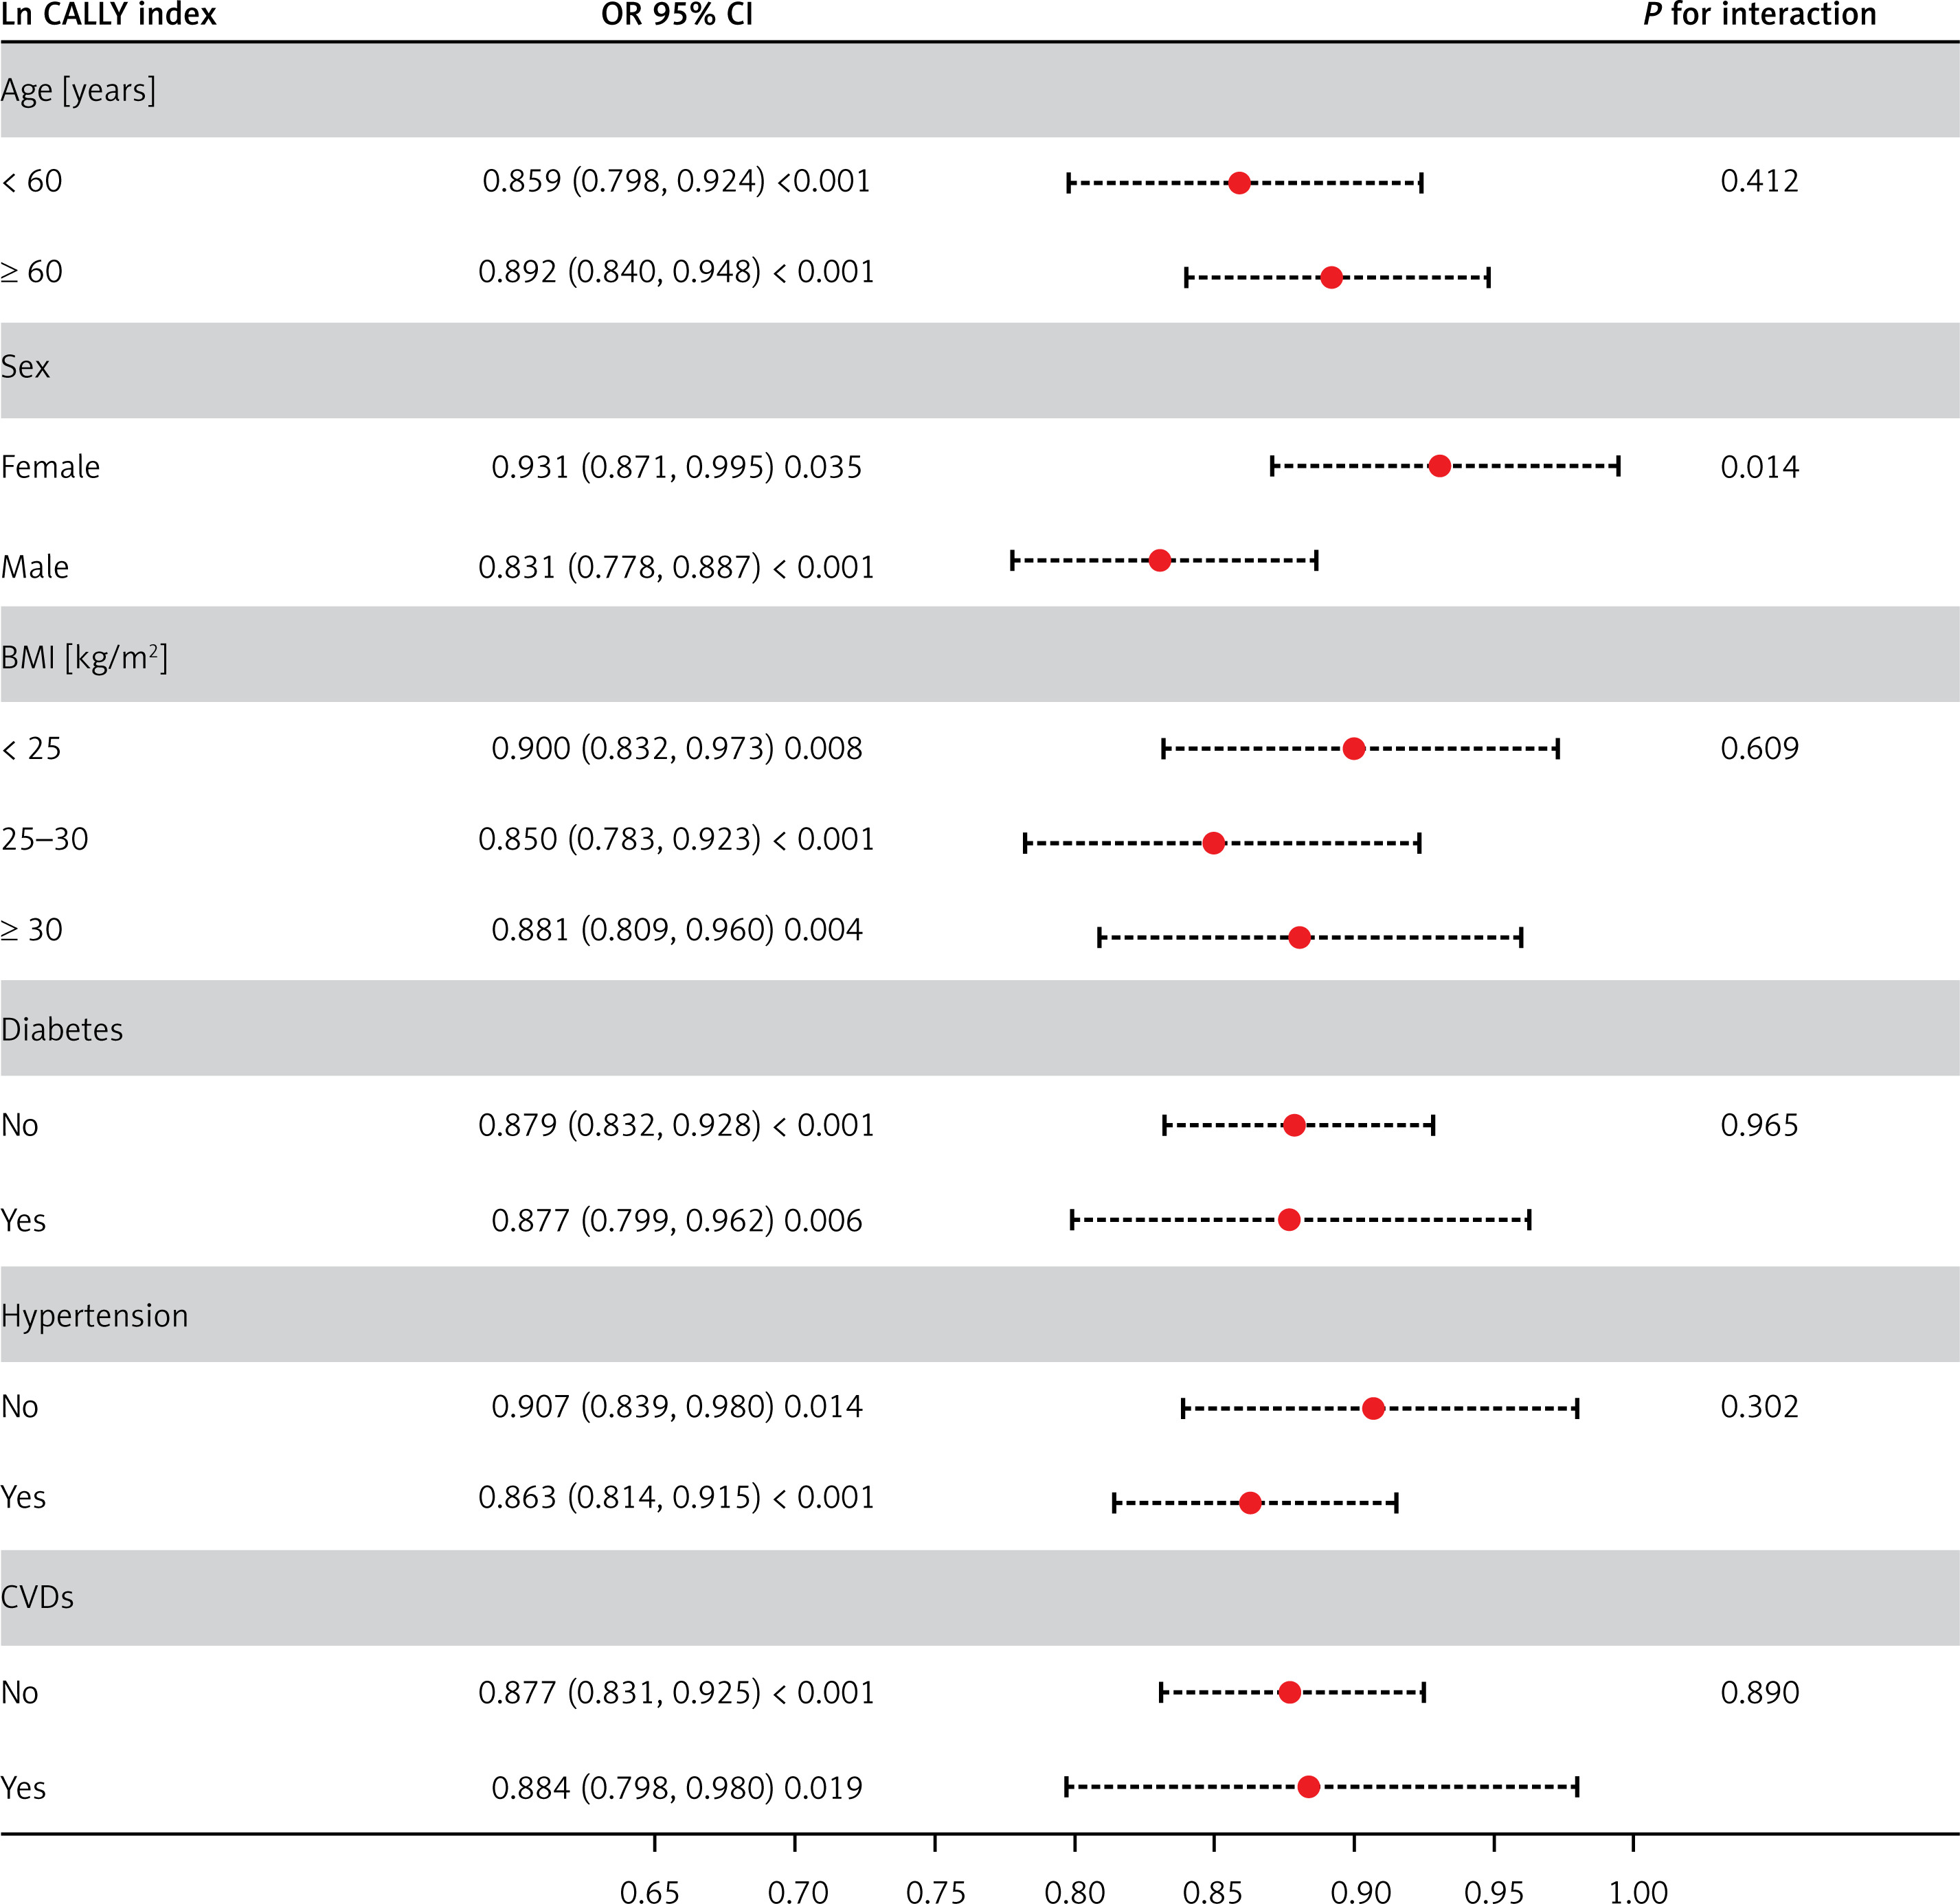
Subgroup analysis confirmed that the protective association between the ln CALLY index and CKD was robust across age divisions (< 60 years: OR = 0.859, ≥ 60 years: OR = 0.892), BMI categories (< 25 kg/m2: OR = 0.900, 25–30 kg/m2: OR = 0.850, ≥ 30 kg/m2: OR = 0.881), and disease status (non-diabetic: OR = 0.879, diabetic: OR = 0.877; non-hypertensive: OR = 0.907, hypertensive: OR = 0.863; non-CVDs: OR = 0.877, CVDs: OR = 0.884), with all interaction p > 0.05, validating the homogeneous effects across these patient characteristics. However, a statistically significant interaction by sex was detected (p for interaction = 0.014), suggesting that the protective effect was more pronounced in males (OR = 0.831) compared to females (OR = 0.931) (Figure 3).
Associations between CALLY index and mortality among CKD patients
We examined 4993 CKD patients for CALLY index-mortality correlations after excluding 4 cases with missing mortality information. Throughout 125 months median tracking, 2653 all-cause fatalities were recorded, with 980 deaths from cardiovascular origins. Kaplan-Meier survival function analysis demonstrated significantly lower cumulative death risks for both total and cardiovascular mortality in the highest versus the lowest CALLY index quartiles (p < 0.001) (Figure 4). Fully adjusted Cox proportional hazards analysis showed that higher log (CALLY index) baseline concentrations were significantly associated with lower risk of all-cause death (HR = 0.862, 95% CI: 0.816–0.910, p < 0.001) and cardiovascular mortality (HR = 0.885, 95% CI: 0.808–0.970, p = 0.009) (Table V). Complete model adjustment demonstrated that fourth-quartile subjects had 0.622-fold lower all-cause mortality risk and 0.697-fold lower cardiovascular death risk compared to first-quartile subjects.
Figure 4
Kaplan-Meier survival curves for all-cause and cardiovascular mortality stratified by CALLY index quartiles
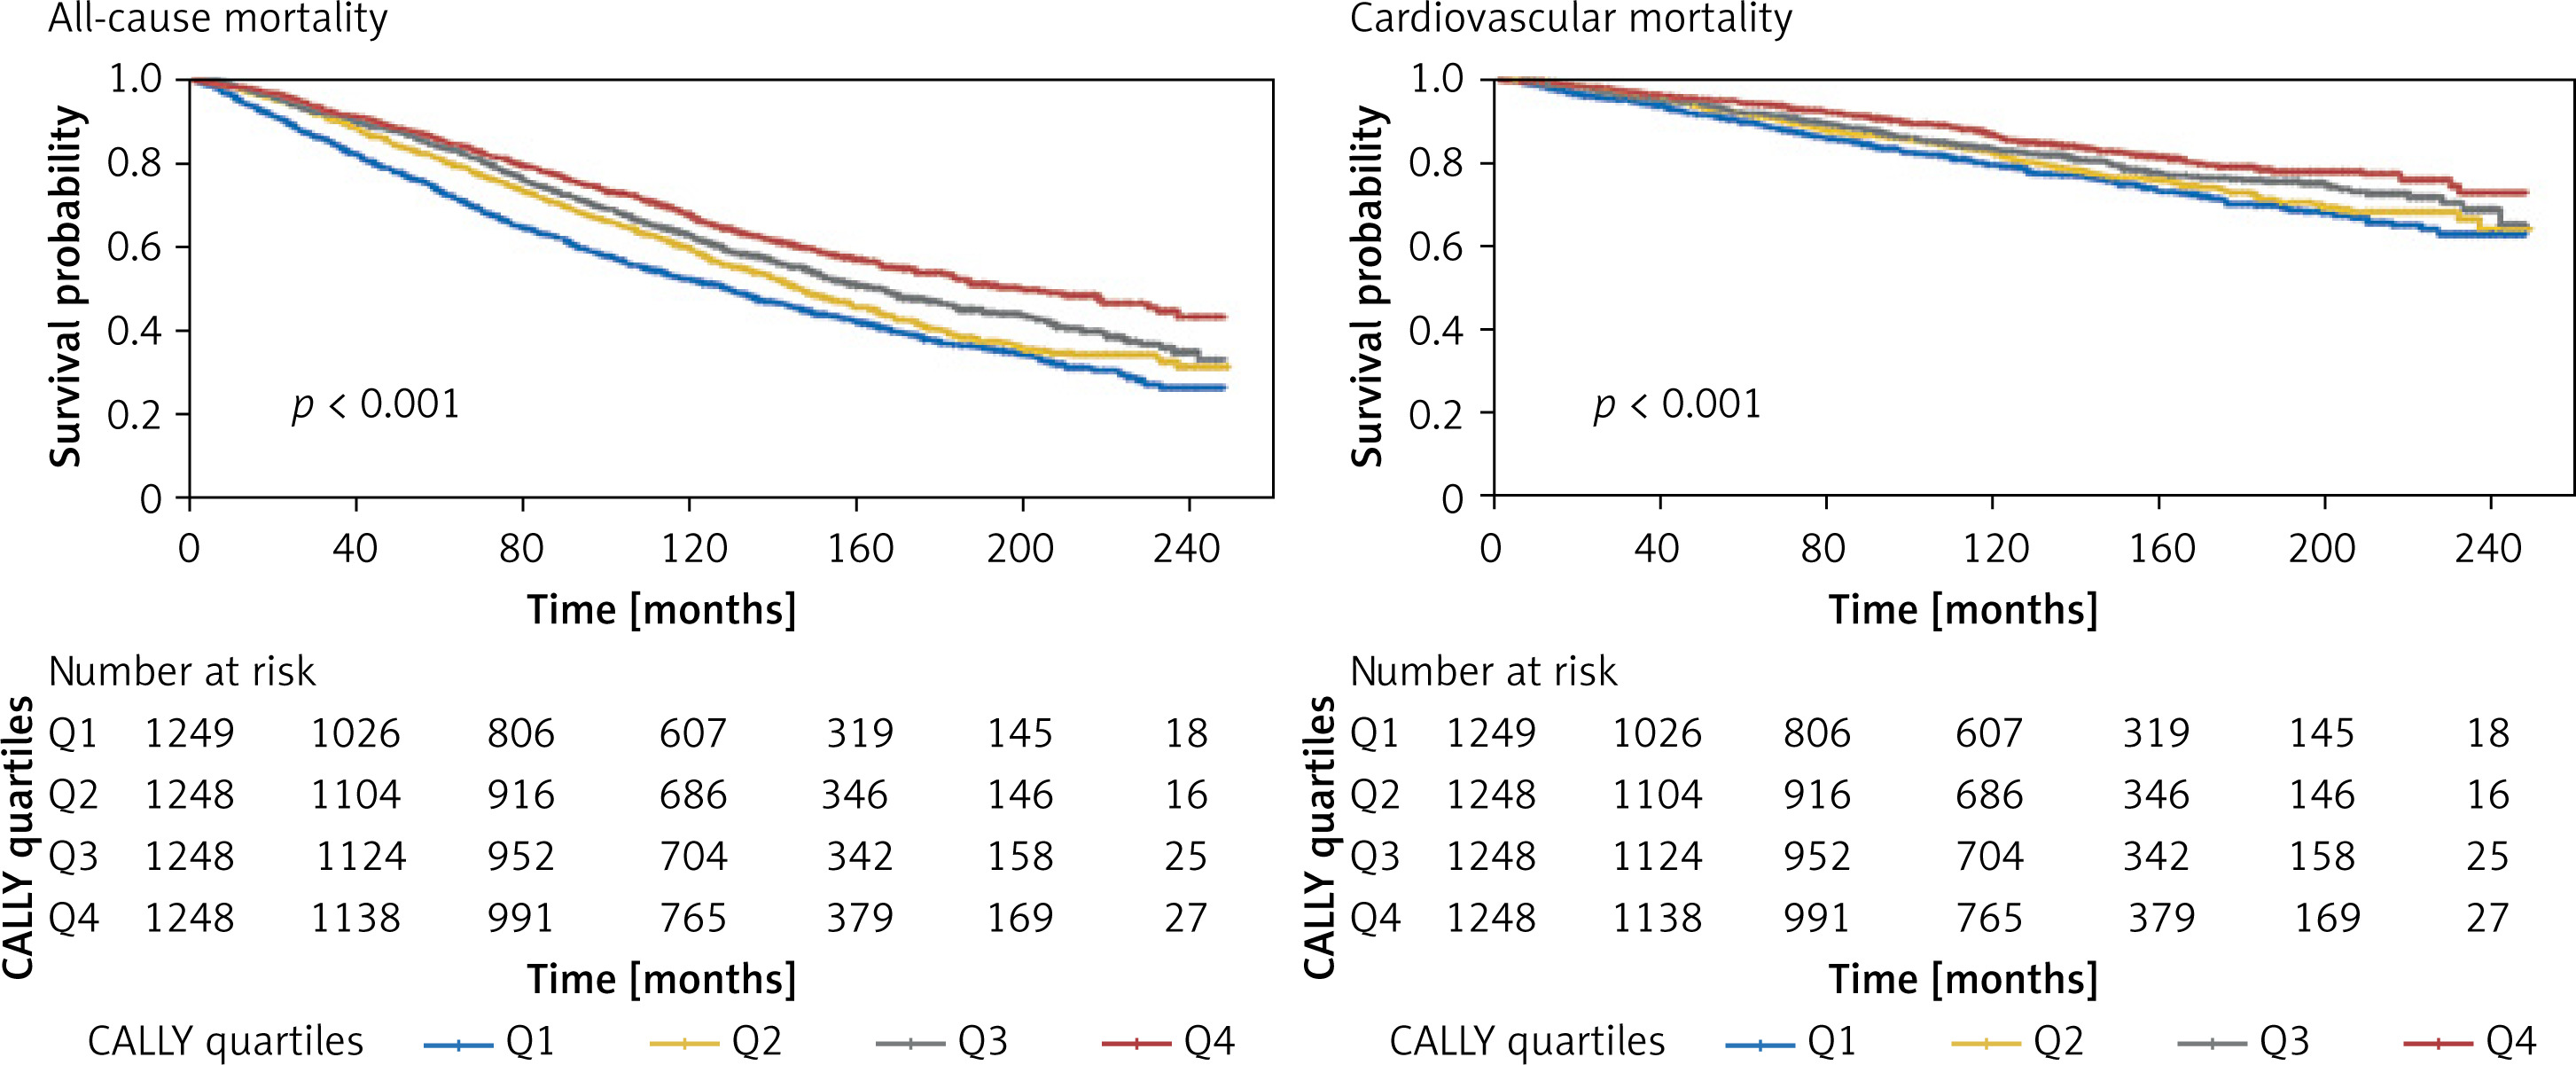
Table V
Multivariable Cox regression analysis of CALLY index and mortality outcomes among CKD patients
[i] HR – hazards ratio. 95% CI – 95% confidence interval. Model 1: non-adjusted. Model 2: adjusted for age, sex, race, marital status, PIR, education level, and smoking history. Model 3: adjusted for age, sex, race, marital status, PIR, education level, smoking history, hypertension, diabetes, CVDs, BMI, TG, HDL-c, LDL-c, and UA levels.
Discussion
Our analysis of the NHANES database establishes a remarkable non-linear, L-shaped inverse correlation between the CALLY index and CKD risk, while simultaneously demonstrating its prognostic significance for both all-cause and cardiovascular mortality in CKD individuals.
Compared to single biomarkers, composite indices can simultaneously capture multidimensional pathophysiological information involved in disease development and progression, providing more accurate and comprehensive risk assessment capabilities [23]. The prognostic role of the CALLY index was first systematically investigated in oncology. A low CALLY index is an independent predictor of all-cause and cardiovascular mortality among patients with cancer [16]. We also observed a similar pattern in our CKD cohort, where a lower CALLY score corresponds to a poorer mortality outcome. Additionally, the application of the CALLY index has been further translated to the cardiometabolic area. Research in this field indicates that a low index value is associated with an increased risk of adverse cardiovascular events, including a higher incidence of stroke in the hypertensive population [18]. Moreover, an association between the CALLY index and cardiorenal syndrome was documented by Zhehao Xu et al. in the U.S. population [15]. The CALLY index integrates three fundamental pathophysiological components that collectively reflect the complex interplay between nutritional homeostasis, immune competence, and inflammatory burden in renal disease progression. Serum albumin, as a classic biomarker reflecting nutritional status and hepatic synthetic function, exhibits decreased levels that represent a significant manifestation of protein-energy wasting syndrome in CKD patients [24–26]. Hypoalbuminemia is also associated with poor prognosis in CKD patients [26, 27]. Additionally, CKD is accompanied by alterations in the immune system [28]. Lymphocyte count, serving as an important indicator of immune function, might reflect damage to the hematopoietic and immune systems caused by the uremic environment when reduced, as well as Th1/Th2 immune response imbalance and regulatory T cell dysfunction [29–32]. Lymphocyte depletion may be associated with CKD progression to some extent [28]. CRP, as an acute phase reactant and sensitive marker of systemic inflammation, may participate in the renal injury process through mechanisms such as complement system activation and promotion of endothelial dysfunction when persistently elevated, and may be related to upregulated expression of fibrosis-related genes [33, 34]. Elevated CRP levels show a positive correlation with CKD incidence risk [35, 36]. Previously, He et al. also reported the association between the C-reactive protein to lymphocyte ratio (CLR) and the prevalence of CKD in US adults [34]. Additionally, this non-linear L-shaped pattern reveals a threshold phenomenon wherein CKD risk demonstrates substantial reduction with moderate increases in CALLY values, followed by a plateau phase where additional index elevation yields diminishing protective returns. Such biphasic behavior suggests that therapeutic strategies targeting nutritional optimization, immune preservation, and inflammatory control may exhibit maximal effectiveness in populations with lower baseline CALLY scores, while individuals with elevated indices might require alternative risk mitigation approaches focused on conventional cardiovascular risk factors. Given that our analysis was based on NHANES, the elevated mean BMI likely reflects the high prevalence of overweight/obesity in the U.S. adult population rather than selection bias [37, 38]. Because BMI is closely linked to metabolic dysregulation and low-grade inflammation, we adjusted for BMI in the fully adjusted models, and the associations were generally consistent across BMI categories.
This study has several limitations that warrant consideration. The cross-sectional study design prevents determination of causal associations between the CALLY index and CKD risk. Although NHANES offers population-representative data, the limited follow-up duration may not adequately capture the long-term predictive capacity of the CALLY index, while the use of single laboratory values for CKD diagnosis could compromise diagnostic precision. Additionally, we adjusted for multiple covariates. However, some factors (e.g., medications, diet, and other inflammatory/immune biomarkers) were unavailable across NHANES cycles, and residual confounding may remain. Finally, although the CALLY index integrates information on inflammation, nutritional status, and immune status, it may still not fully capture all dimensions of the complex pathophysiology of CKD. Future studies incorporating additional clinical parameters and emerging biomarkers may improve the precision of CKD risk stratification and prognostic assessment.
In conclusion, based on large-scale NHANES data, this study identified a nonlinear L-shaped negative association between the CALLY index and CKD risk and demonstrated that the CALLY index can predict all-cause and cardiovascular mortality in CKD patients. As a composite biomarker integrating inflammation, nutrition, and immunity, the CALLY index may serve as a novel tool for risk stratification and prognosis assessment in CKD.

