

Introduction
With the acceleration of social aging, hypertensive cerebral hemorrhage, as a common and dangerous cerebrovascular disease, shows an increasing annual incidence, posing a serious threat to human health on a global scale [1]. This disease has a sudden onset and rapid progression, often causing irreversible damage to the patient’s brain tissue in a short time [2]. Hypertensive cerebral hemorrhage not only causes physical damage to local brain tissue, but also triggers a series of complex pathophysiological changes [3]. Among them, delayed cerebral edema, as one of the common and extremely harmful complications after surgery, seriously affects the prognosis of patients. It usually develops gradually after cerebral hemorrhage for a period of time, leading to a sustained increase in intracranial pressure, compression of surrounding brain tissue, and impaired cerebral perfusion, and may even result in cerebral hernia, which is an important cause of disability and death of patients [4].
At present, in clinical practice, the prediction method of delayed cerebral edema after hypertensive cerebral hemorrhage is not perfect. Doctors mostly rely on their own clinical experience and conventional imaging examination methods to make judgments, but these methods have obvious shortcomings. Although clinical experience is valuable, it is subjective, and there may be differences among different doctors. However, traditional imaging examination can only be used when brain edema has occurred or developed to a certain extent, and has limited value for early prediction. This often places doctors in a passive situation in the face of delayed cerebral edema and unable to take timely and effective preventive measures [5].
In recent years, studies have increasingly shown that serum inflammatory factors and hemodynamic changes play a key role in the pathophysiological process after cerebral hemorrhage. As an important marker of inflammatory reaction, serum inflammatory factors exhibit significant changes during the initiation and development of a local inflammatory reaction after cerebral hemorrhage [6, 7]. They can affect cerebral vascular endothelial cell function, blood-brain barrier permeability, and neuronal survival through multiple mechanisms. The abnormal expression of inflammatory factors may induce the chemotaxis and activation of white blood cells, lead to the release of more inflammatory mediators, and further aggravate the damage and edema of brain tissue [8, 9]. Altered hemodynamics is another important factor. The change of hemodynamic parameters such as cerebral blood flow and cerebrovascular resistance is directly related to the perfusion of brain tissue [10]. After the occurrence of cerebral hemorrhage, the automatic regulation mechanism of cerebral blood vessels may be damaged, leading to the decrease of cerebral blood flow and the increase of cerebral vascular resistance. This abnormal blood flow state will lead to ischemia and hypoxia of brain tissue, which will further promote a series of pathophysiological chain reactions and create conditions for the occurrence of delayed cerebral edema [11–13].
Therefore, it is of great significance to conduct in-depth research on the relationship between the changes in serum inflammatory factors, hemodynamics, and delayed cerebral edema. The aim of this study was to construct an accurate and effective prediction model, provide a strong basis for clinical treatment and intervention, and improve the prognosis of patients with hypertensive intracerebral hemorrhage.
Material and methods
Research object
From January 2022 to January 2024, 300 patients with hypertensive intracerebral hemorrhage in our hospital were selected as the research subjects. All of them provided written informed consent to participate in this study, which was approved by the ethics committee of our hospital. Patients were randomly divided into a training set (n = 210) and validation set (n = 90) according to the ratio of 7 : 3, and general data were collected simultaneously. Data can be provided upon request. The follow-up period was 10 months.
Inclusion and exclusion criteria
Inclusion criteria
Patients should clearly meet the diagnostic criteria of hypertensive cerebral hemorrhage; age between 40 and 80 years old; time from onset to admission within 24 h; the patient or family members sign the informed consent form. Ethical approval date: December 20, 2021; Ethical Approval Number: KY2023126; Research Protocol (Version Number: Y1.0; Version Date: December 6, 2023), Informed Consent Form (Version Number: V1.0; Date: December 6, 2023).
Detection methods
Detection method of serum inflammatory factors (enzyme-linked immunosorbent assay, ELISA)
Patient’s venous blood was collected in a vacuum blood collection tube without anticoagulant, and centrifuged at 3000–3500 rpm for 15 min after the blood naturally coagulated to obtain serum. The serum was transferred to a clean EP tube, and the sample was stored at –20℃ or lower if it was not analyzed immediately. Before testing, the sample was thawed at room temperature and mixed gently. The corresponding ELISA kit was selected according to the measured serum inflammatory factors, and the status of each reagent in the kit was checked. According to the instructions, the standard was prepared into a suitable concentration gradient using the diluent. 50 µl of standard solution and 50 µl of serum sample were added to the microplate coated with specific antibody in turn, and multiple wells were prepared for each sample and standard. The microplate was gently shaken to fully mix the liquid, then the microplate was sealed with a sealing film and incubated at room temperature for 1.5 h. After incubation, the liquid in the well was discarded, and the microplate was washed with washing liquid for 5 times, soaking for 2 min each time to remove unbound substances. Then, enzyme-labeled secondary antibody (100 µl per well) was added, and the plate was sealed again and incubated at room temperature for 60 min. After that, the washing step was repeated, and then the substrate solution was added, 100 µl per hole, and color was developed in the dark. When the color had developed to an appropriate degree, the reaction was terminated by adding a termination solution. Finally, the absorbance of each hole was measured using an enzyme-labeled instrument at the wavelength of 450 nm; each sample was measured three times. Based on the average value of the absorbance obtained from the three measurements, the concentration of inflammatory factors in the sample was calculated in combination with the standard curve.
Detection method of hemodynamic parameters (TCD)
Patients adopted a supine position or sitting position, and remained quiet and relaxed. Examiners applied an appropriate amount of coupling agent to the transcranial Doppler ultrasound probe to ensure good contact between the probe and the skin and reduce air interference. Firstly, the temporal window was found in the temporal part, which is a common part of transcranial Doppler ultrasound examination. Generally, the appropriate ultrasonic signal is found by adjusting the angle and depth of the probe. When clear blood flow signals are obtained, the blood flow spectra of main cerebral vessels such as the middle cerebral artery (MCA), anterior cerebral artery (ACA), and posterior cerebral artery (PCA) are identified. For the middle cerebral artery, the probe is usually placed in the temporal window, and the depth is adjusted to about 30–65 mm to detect signals with typical blood flow spectrum characteristics, that is, the systolic blood flow velocity is relatively fast, the diastolic blood flow velocity is relatively low, and the blood flow spectrum has three peaks (peaks S1, S2, and D). The blood flow velocity parameters of each major cerebral blood vessel need to be measured repeatedly 5 times at different time points. The blood flow velocity parameters of major cerebral vessels, including peak systolic blood flow velocity (Vs), end diastolic blood flow velocity (Vd), and mean blood flow velocity (Vm), can be directly read on the instrument or calculated by measuring the spectral envelope line. At the same time, the blood pressure was recorded, and combined with the measured blood flow velocity, the hemodynamic parameters such as cerebrovascular resistance (CVR) and cerebral blood flow (CBF) were calculated according to established formulas (e.g. CVR = (mean arterial pressure-intracranial pressure)/CBF, in which CBF can be calculated from blood flow velocity and other parameters through a specific formula). During the inspection, it is necessary to adjust the angle and depth of the probe to obtain the best signal quality, and measure the average value many times at different time points to improve the accuracy of the measurement. If the temporal window is inadequate, other acoustic windows, such as the orbital or occipital window, may be used as alternatives for assessment.
Challenges encountered during the measurement process and their solutions
During the measurement process, some patients are unable to remain quiet and relaxed. This can lead to head movement or vasospasm, causing the position of the probe during measurement to change. As a result, the measured blood flow velocity values fluctuate significantly, failing to accurately reflect the true hemodynamic state and affecting the accuracy of subsequent parameter calculations. Before the examination, the examination process and precautions should be fully explained to the patients to relieve their nervousness. For patients who have difficulty cooperating, appropriate psychological comfort can be provided or sedative medications can be used (subject to the doctor’s assessment and permission). At the same time, during the measurement, a fixation device should be used to assist in fixing the patient’s head to reduce errors caused by head movement.
If the TCD instrument is not calibrated regularly, there may be errors in the basic data it measures, directly affecting the measured values of blood flow velocity. Consequently, the hemodynamic parameters calculated based on these data lose their reliability. Moreover, if unstable conditions such as signal drift occur during the use of the instrument, it will also render the measurement results unreliable.
We have established a strict instrument calibration system. In accordance with the requirements of the instrument operation manual, the TCD instrument is calibrated and maintained regularly. Before each use, the instrument should be warmed up and self-checked to ensure it is in a stable working condition. If abnormal conditions such as signal drift are detected during the measurement, it should be stopped immediately, the instrument connections and settings should be checked, and if necessary, the instrument should be recalibrated before resuming the measurement.
Statistical analysis
All data were imported into SPSS 26.0 software for analysis. Categorical data were described as frequency and percentage, and the χ2 test was used. Measurement data with a normal distribution were expressed as mean ± standard deviation, and the independent-samples t-test was applied. A model was established through logistic regression analysis, and the rms package in R language (R4.0.0) was used to visualize the model. The receiver operating characteristic (ROC) curve of the model was plotted to determine the sensitivity, specificity, Youden index, and optimal cut-off value of the model. The discrimination of the model was evaluated by the area under the curve (AUC) of the ROC curve. The larger the value, the better the discrimination. The calibration of the model was evaluated using the calibration curve or Hosmer-Lemeshow test. Decision curve analysis (DCA) was used to test the practical application efficiency of the model.
Results
Comparison of delayed cerebral edema rate and clinical characteristics between training set and validation set
100 (47.62%) cases of 210 patients in the training set developed delayed cerebral edema, and 42 (46.67%) cases of 90 patients in the validation set developed delayed cerebral edema. There was no significant difference in the incidence and clinical characteristics between the training set and the validation set (p > 0.05), as shown in Table I.
Table I
Comparison of clinical characteristics between training set and validation set
[i] BMI – body mass index, IL-6 – interleukin-6, TNF-α – tumor necrosis factor-α, IL-1β – interleukin-1β, IL-8 – interleukin-8, IL-10 – interleukin-10, MCP-1 – monocyte chemoattractant protein-1, MIP-1α – macrophage inflammatory protein-1α, CBF – cerebral blood flow, CVR – cerebrovascular reactivity, HMGB1 – high-mobility group Box 1 protein, CRP – C-reactive protein.
Comparison of clinical features between edema group and non-edema group
In the training set, the results of univariate analysis showed significant differences in interleukin-6 (IL-6), tumor necrosis factor-α (TNF-α), interleukin-1β (IL-1β), macrophage inflammatory protein-1α (MIP-1α), CBF, CVR, high-mobility group Box 1 protein (HMGB1), and C-reactive protein (CRP) between patients with edema and those without edema (p < 0.05), as shown in Table II.
Table II
Comparison of clinical characteristics between edema group and non-edema group
Risk factor analysis of delayed cerebral edema after cerebral hemorrhage
The occurrence of edema was treated as the dependent variable (0 = no, 1 = yes), and variables with p < 0.05 in the univariate analysis were included as covariates. Further multivariate logistic regression analysis showed that IL-6, TNF-α, IL-1β, CBF, CVR, HMGB1, and CRP were independent risk factors for bleeding (p < 0.05), as shown in Table III.
Table III
Logistic regression analysis of risk factors of delayed cerebral edema after cerebral hemorrhage
Establishment of nomogram prediction model for delayed cerebral edema after cerebral hemorrhage
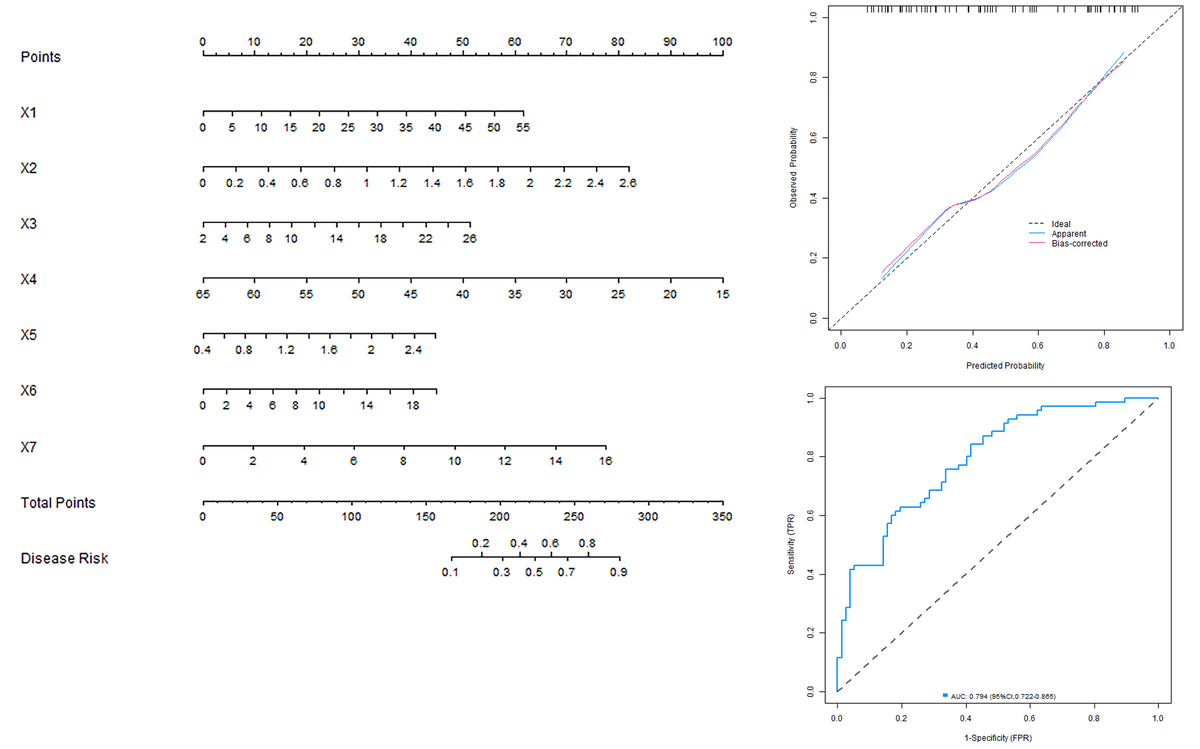
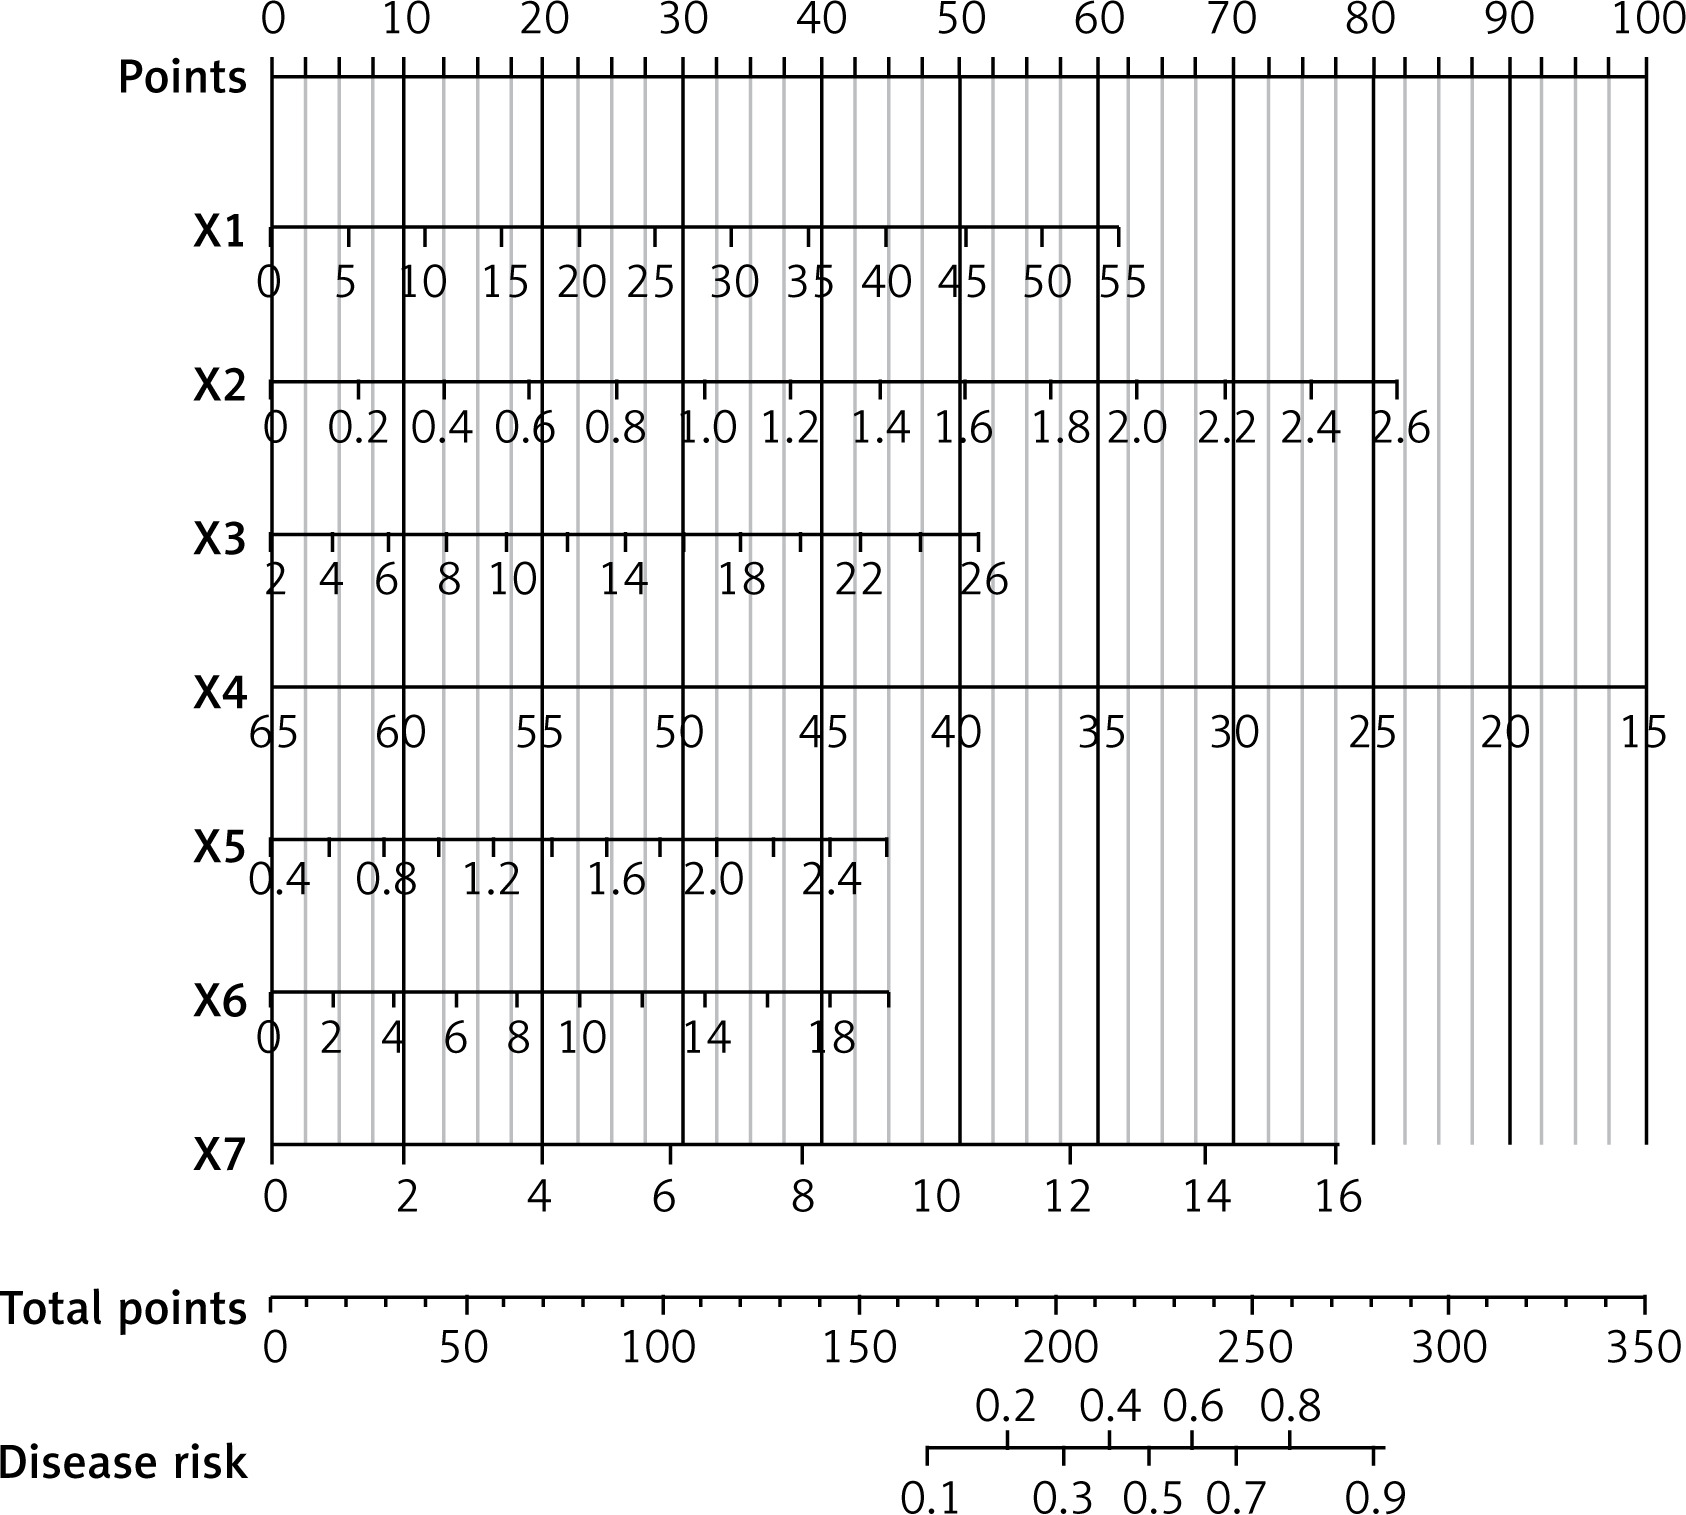
Based on the independent risk factors identified by multivariate logistic regression analysis, the nomogram prediction model of delayed cerebral edema after cerebral hemorrhage was constructed, the independent risk factors in the model were assigned, and the total score was calculated for predicting delayed cerebral edema after cerebral hemorrhage, expressed as the predicted probability of bleeding. The higher the total score, the higher was the accuracy of predicting delayed cerebral edema after cerebral hemorrhage (Figure 1).
Evaluation and validation of the prediction model of delayed cerebral edema after cerebral hemorrhage
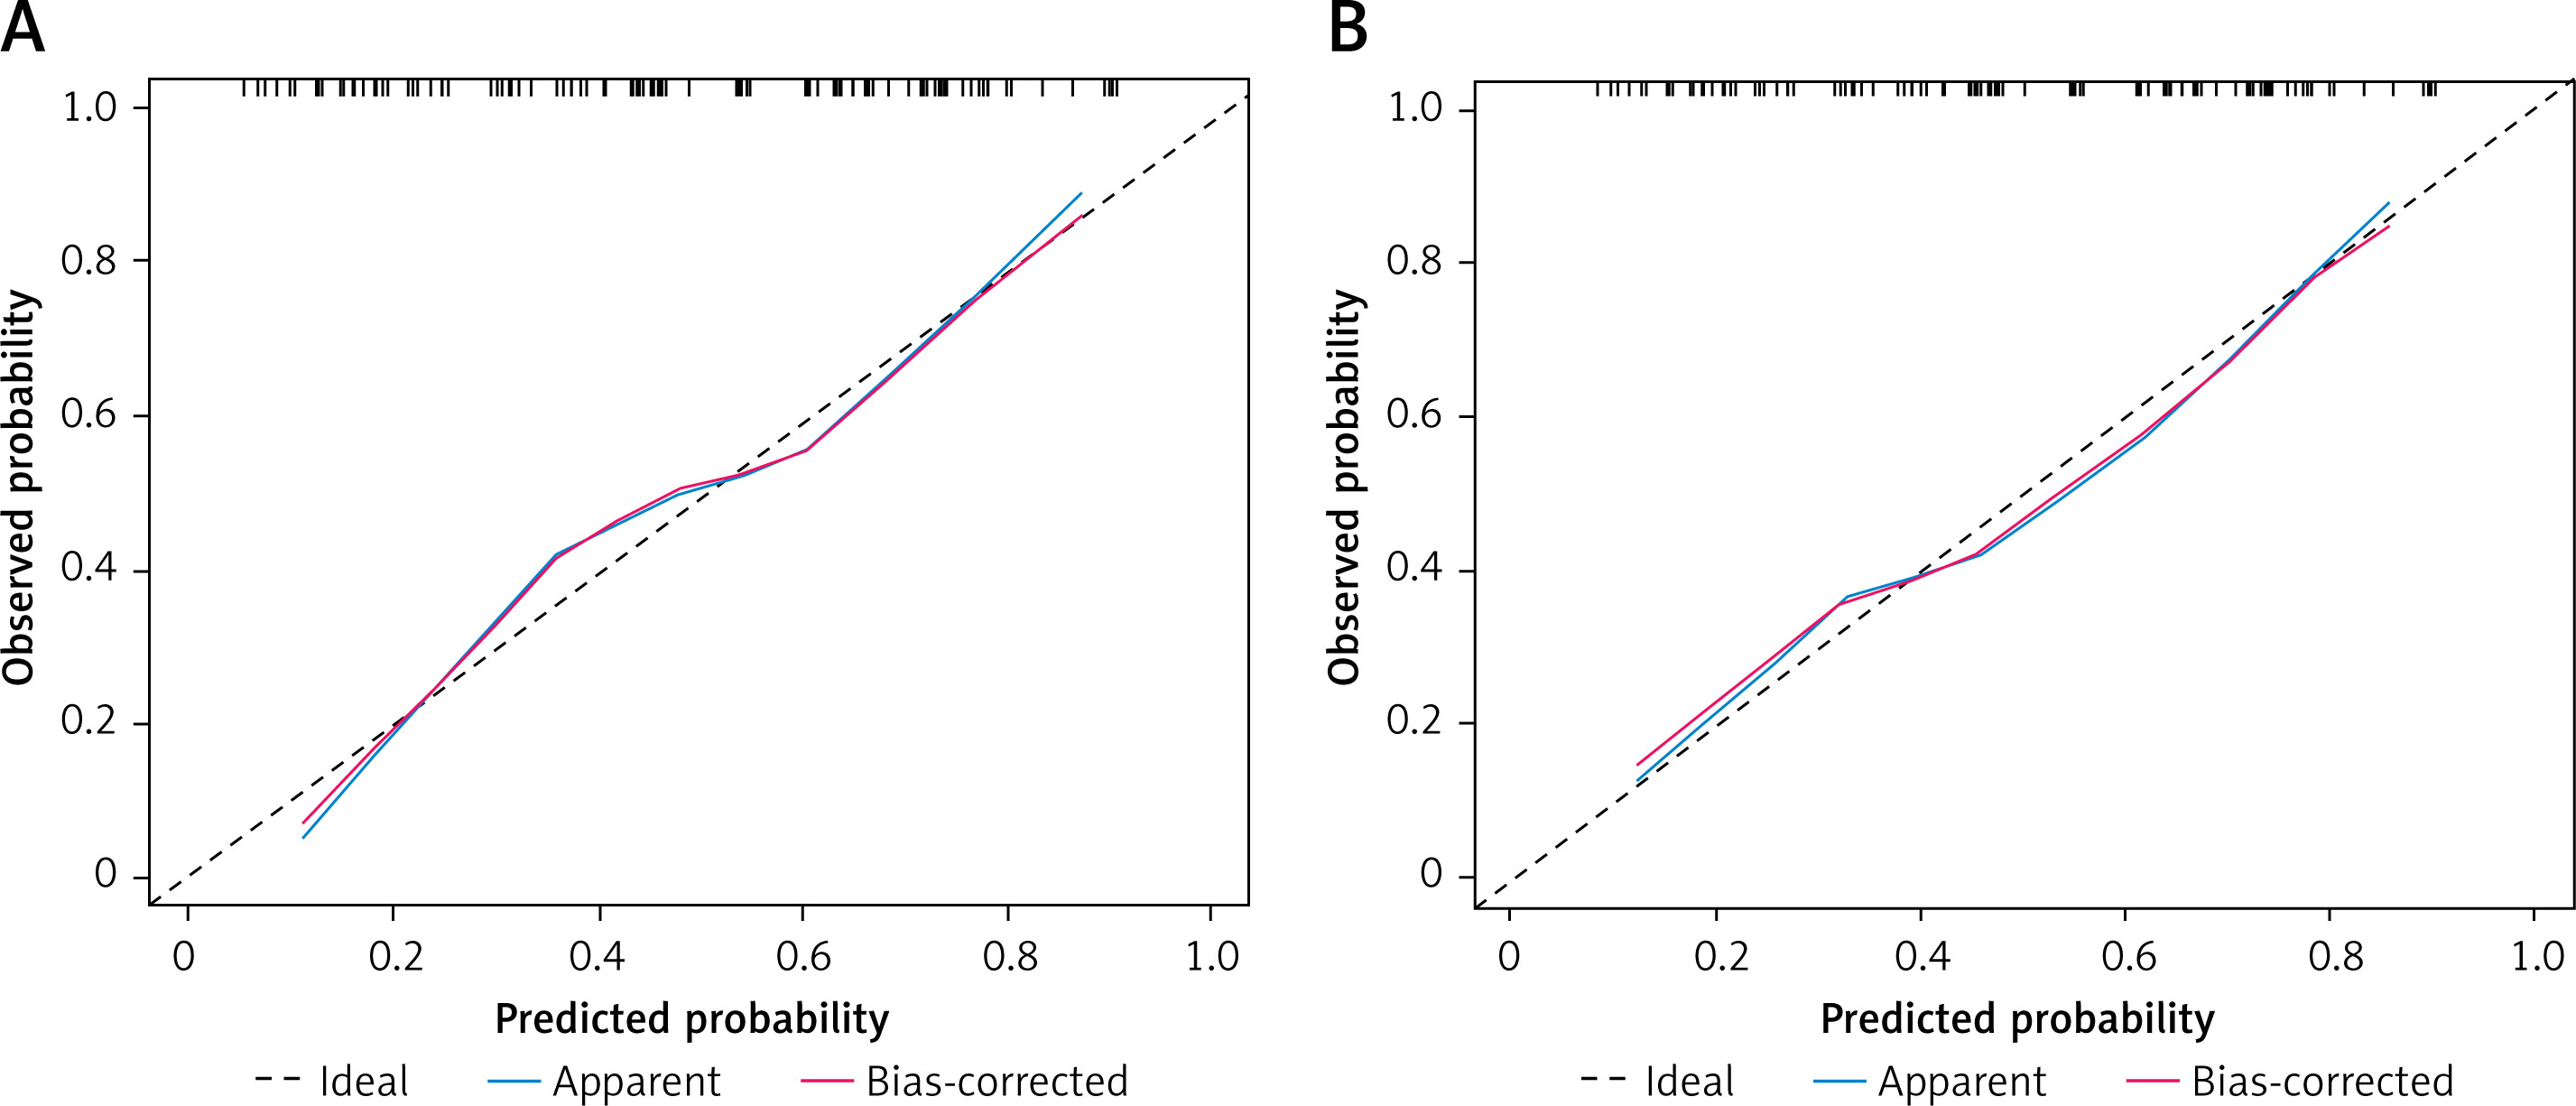
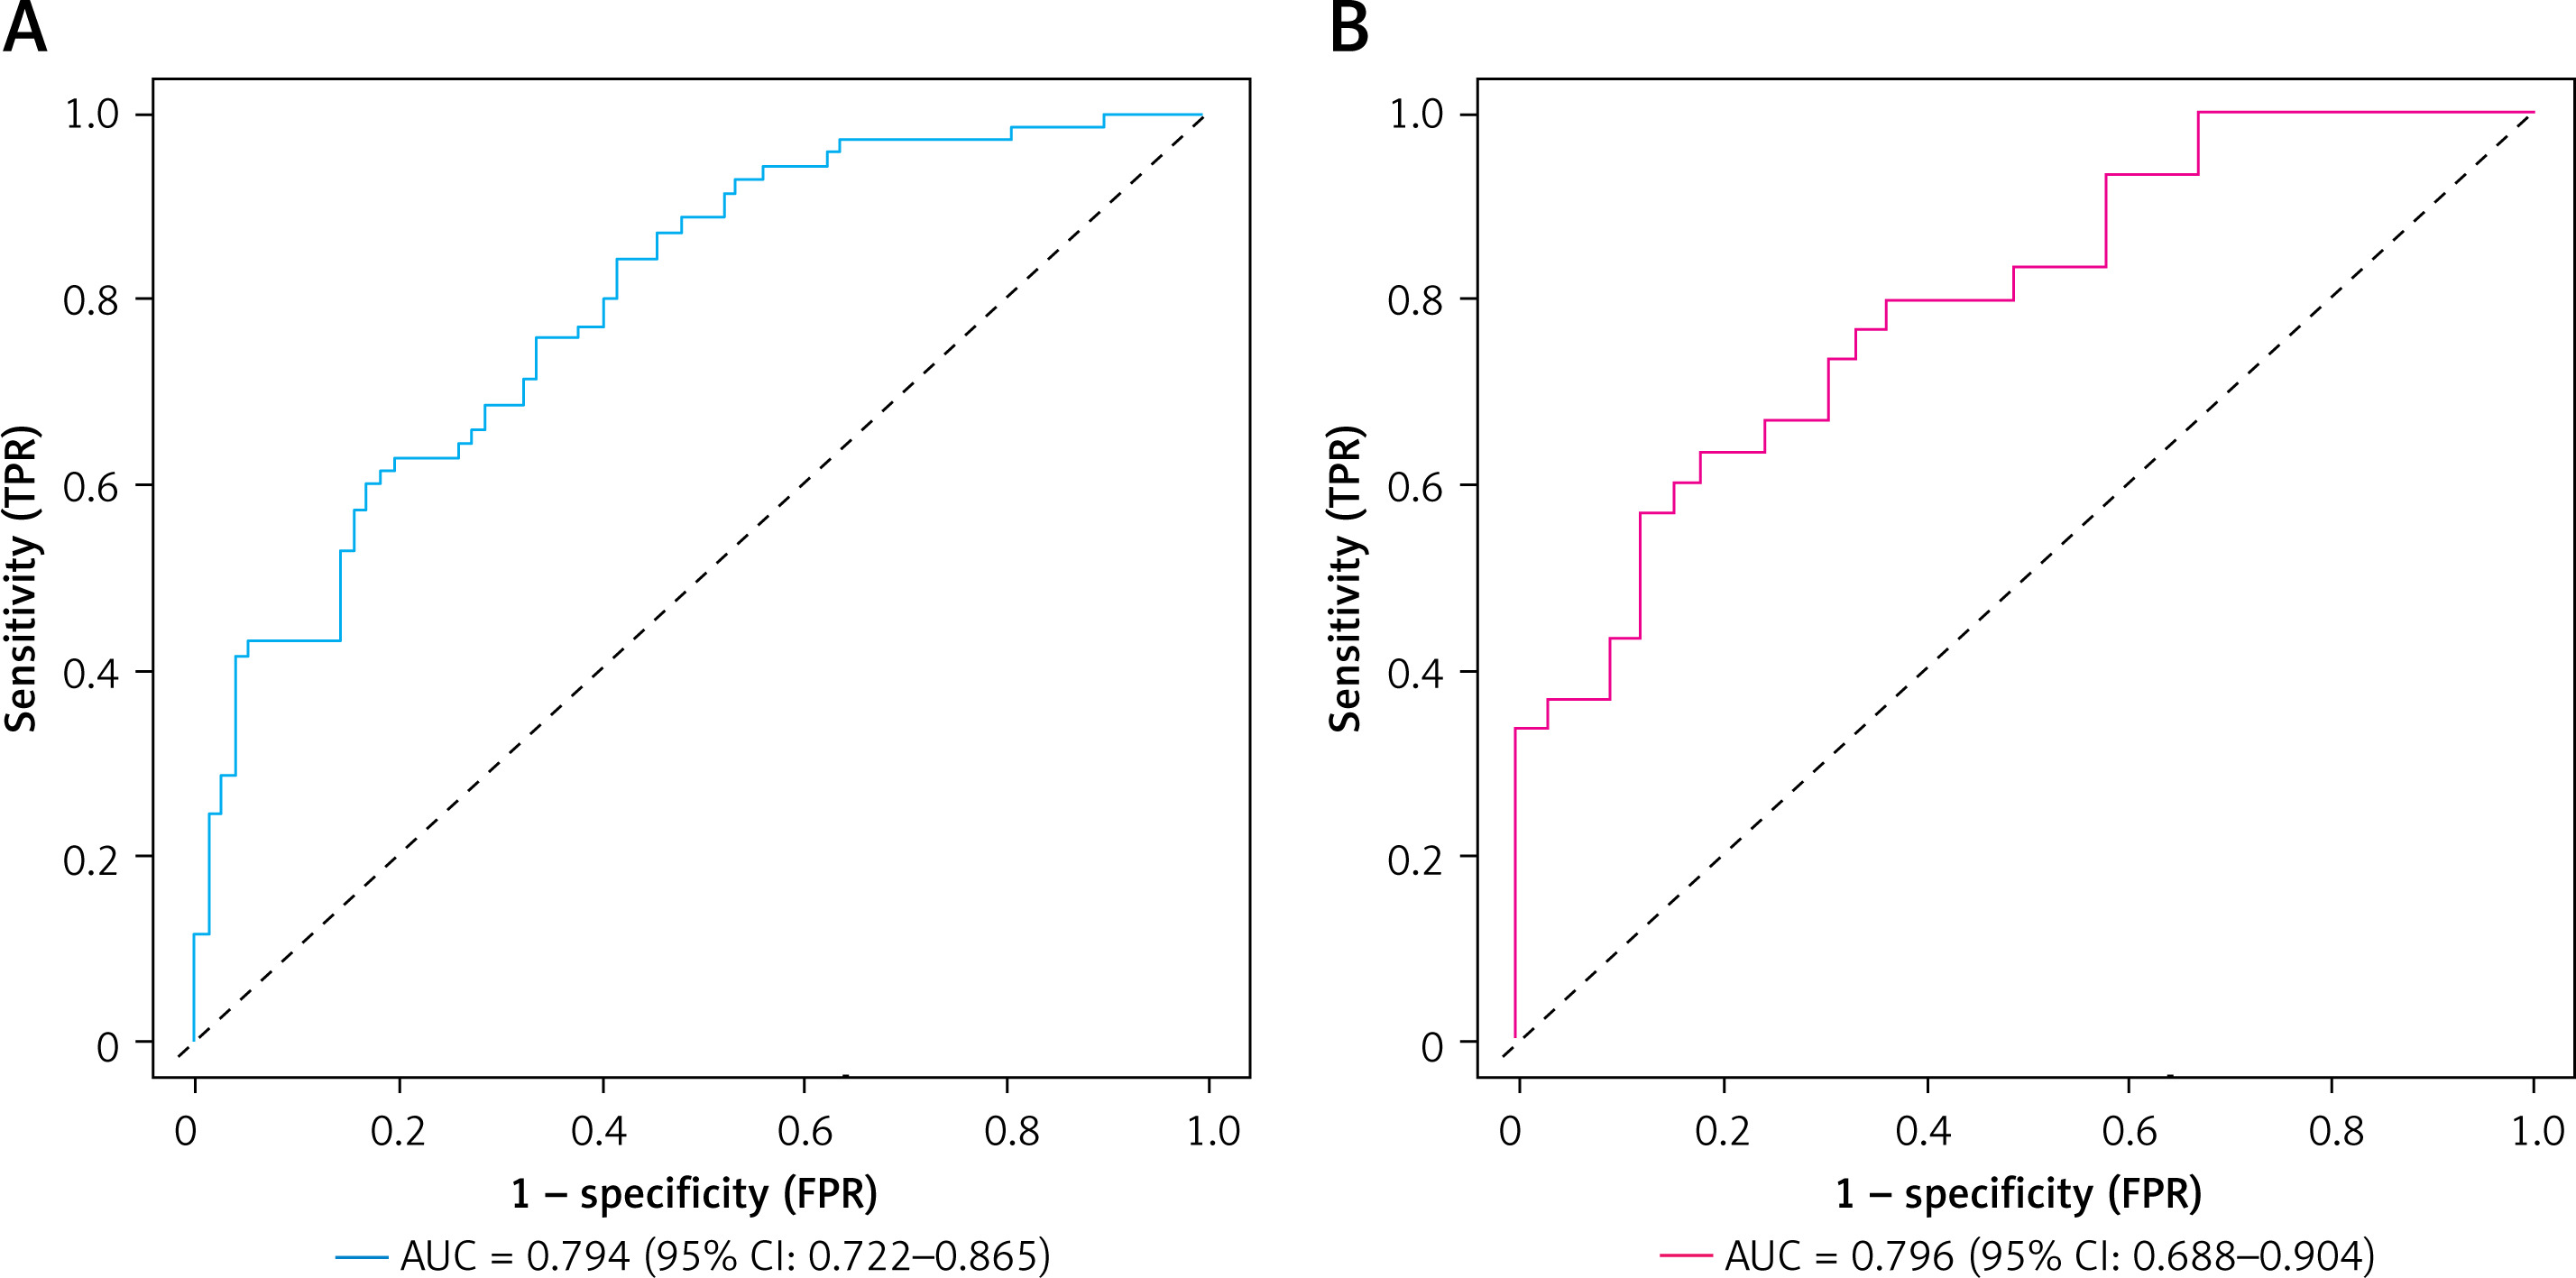
In the training set and validation set, the C-index index of the nomogram model was 0.792 and 0.799, respectively. The average absolute error of the coincidence degree between the predicted value and the real value in the calibration curve was 0.188 and 0.182, respectively, and the results of Hosmer-Lemeshow test were χ2 = 16.582, p = 0.035 and χ2 = 7.472, p = 0.487, respectively. The ROC curve is shown for the training set and the validation set. The AUC of the nomogram model in predicting delayed cerebral edema was 0.794 (95% CI: 0.722–0.865) and 0.796 (95% CI: 0.688–0.904), and the sensitivity and specificity were 0.629 and 0.804, respectively. See Figure 2 for the calibration curve and Figure 3 for the ROC curve.
Analysis of decision curve of nomogram prediction model for delayed cerebral edema after cerebral hemorrhage
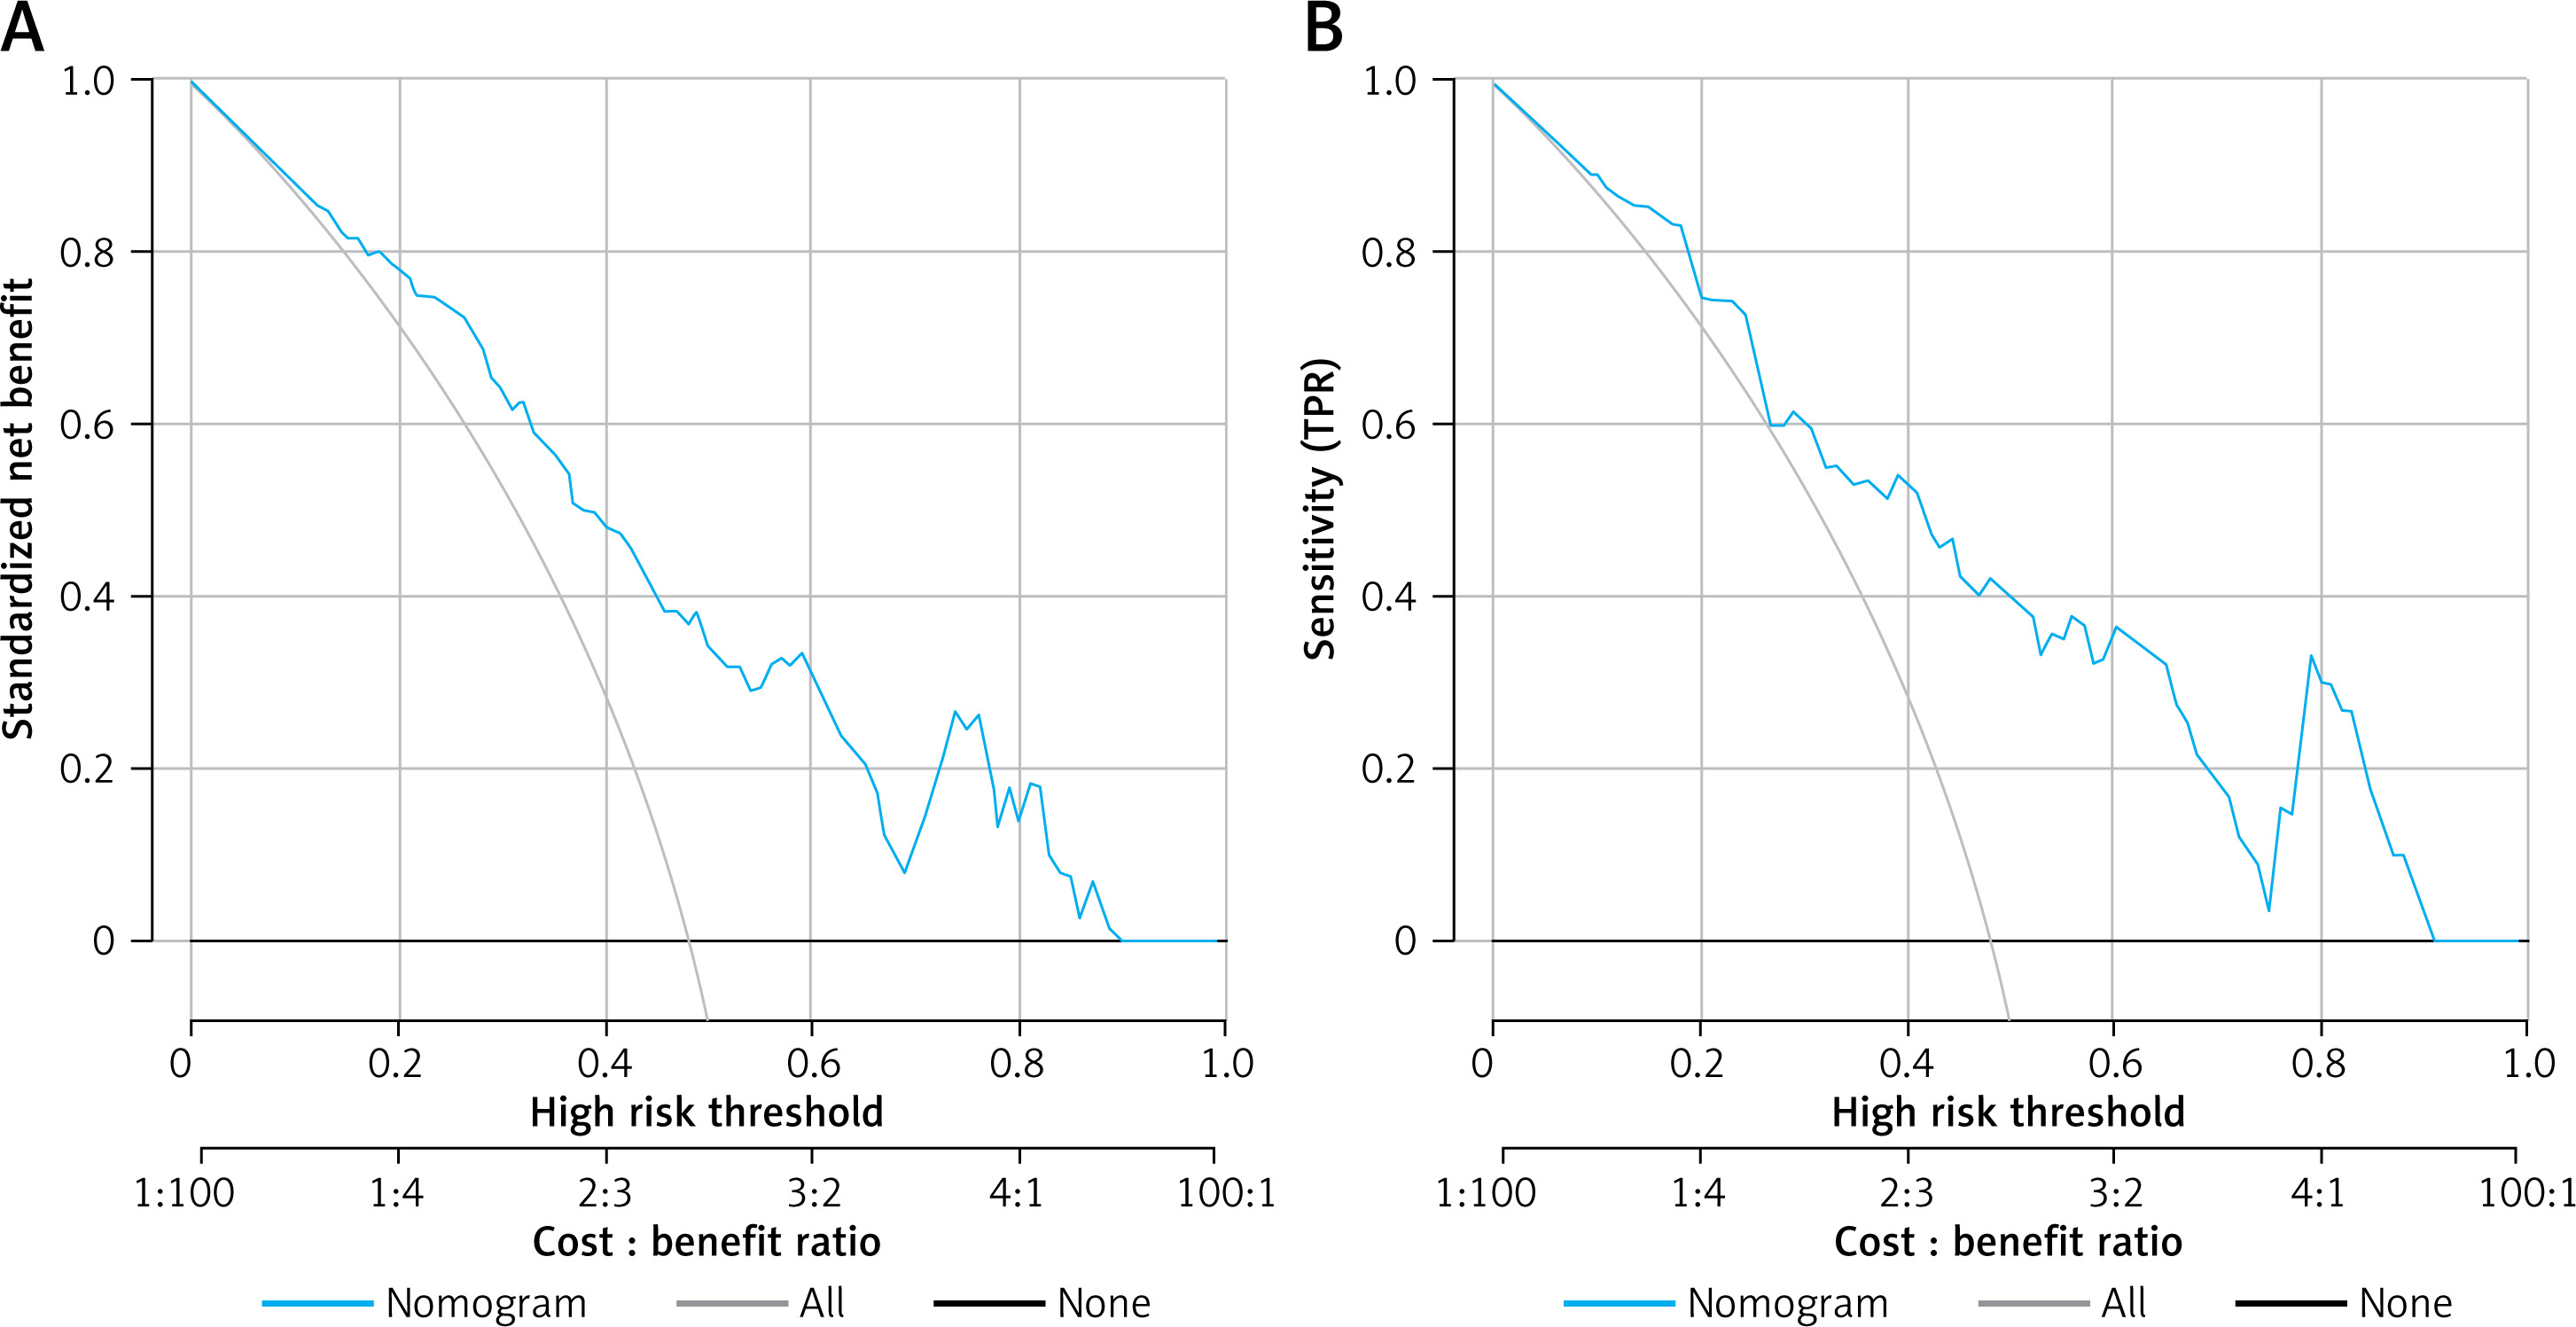
The decision curve shows that when the threshold probability is between 0.05 and 0.95, the nomogram model constructed in this study has more clinical benefits in predicting postoperative bleeding (Figure 4).
Discussion
Delayed cerebral edema after hypertensive cerebral hemorrhage seriously affects the prognosis of patients, and there is no effective prediction method in clinical practice at present. The nomogram prediction model constructed in this study is of great significance. Serum inflammatory factors play a key role in the inflammatory response after cerebral hemorrhage. As important proinflammatory factors, IL-6, TNF-α, and IL-1β can activate a series of inflammatory cascade reactions [14, 15]. IL-6 can induce the activation and proliferation of immune cells, promote the production of adhesion molecules by vascular endothelial cells, increase vascular permeability, and make plasma components seep into the brain tissue space, leading to brain edema [16]. TNF-α can directly damage vascular endothelial cells, destroy the integrity of the blood-brain barrier, and induce chemotaxis and infiltration of inflammatory cells [17]. IL-1β activates endothelial cells in the early stage of inflammation, promotes the expression of inflammatory cell adhesion molecules, and further intensifies the inflammatory reaction. These inflammatory factors interact and jointly promote the development of brain edema [18]. The changes of hemodynamic parameters CBF and CVR are also closely related to delayed cerebral edema [19]. A decrease in CBF indicates insufficient perfusion of brain tissue, which can cause ischemia and hypoxia of brain tissue, disrupt energy metabolism of cells, increase anaerobic metabolism, result in high lactic acid accumulation, lead to intracellular acidosis, and subsequently cause an imbalance of intra- and extracellular ion homeostasis, ultimately inducing cellular edema [20]. At the same time, ischemia and hypoxia can also activate inflammation-related signal pathways, promote inflammatory cells to release more inflammatory mediators, and aggravate brain edema. The increase of CVR reflects cerebral vasospasm of cerebral vessels, which hinders normal blood perfusion, further reduces CBF, and interacts with CBF, constituting important hemodynamic factors in the occurrence of cerebral edema [21]. As an injury-related molecular model molecule, HMGB1 is released from injured cells after cerebral hemorrhage. It can activate the signal pathways of various immune cells, induce inflammatory cells to produce more inflammatory factors, such as IL-6 and TNF-α, and form a positive feedback loop, continuously amplifying the inflammatory response, increasing the permeability of the blood-brain barrier, and promoting the development of brain edema [22, 23]. As an acute phase reaction protein, the increase of CRP level reflects the degree of activation of the inflammatory reaction, which can activate the complement system, enhance the function of phagocytes, lead to vascular endothelial damage, promote destruction of the blood-brain barrier, and create conditions for brain edema [24].
The nomogram model constructed in this study demonstrated good predictive performance. In terms of calibration and model fit, the C-index was 0.792 and 0.799, respectively, which shows that the model has good predictive accuracy and discrimination ability. The average absolute error of the calibration curve was small, 0.188 and 0.182, respectively, indicating that the predicted value was in high agreement with the real value. Hosmer-Lemeshow test results further support the goodness of fit of the model in the training set (p = 0.035) and validation set (p = 0.487). ROC curve analysis showed that the AUC of the training set and the validation set was 0.794 and 0.796, respectively. This result shows that the model has good discriminatory performance and can effectively distinguish patients with and without delayed cerebral edema. The sensitivity and specificity of the model were 0.629, 0.805, 0.633, and 0.786, respectively, which shows that the model is reliable in accurately identifying whether patients will have delayed cerebral edema. Compared with traditional forecasting methods, this model has obvious advantages. Traditional methods rely on doctors’ experience or a single examination index, which is subjective and limited. However, this model comprehensively considers many factors closely related to the occurrence of cerebral edema, organically combines serum inflammatory factors and hemodynamic parameters, and more comprehensively reflects the complex pathophysiological state after cerebral hemorrhage. The form of the nomogram is intuitive and easy to understand. Clinicians can easily calculate scores according to patients’ specific indicators, quickly assess the risk of patients with delayed cerebral edema, and help to identify high-risk patients early in clinical practice.
Although some achievements have been made in this study, there are still some limitations. First, although the sample size was 300 cases, a larger sample may be necessary for this complex clinical situation to improve the stability and accuracy of the model. A larger sample size can better cover patients with different severity and individual differences, and reduce the errors caused by sample deviation. Second, there may be other factors that have not been taken into account in the process of model construction, which have an impact on delayed cerebral edema. For example, the genetic polymorphism of patients may play a role in the inflammatory reaction and the development of brain edema after cerebral hemorrhage, but this study did not examine this aspect. In addition, factors such as patients’ lifestyle and drug use may also be related to the occurrence of brain edema. Future research can further improve the model and include these potential factors. In terms of research design, this was a retrospective study. Although the relationship between related factors and delayed cerebral edema can be analyzed to some extent, there may be problems such as information bias. Prospective research can be carried out in future to further verify the application value of the model in clinical practice, and at the same time, the whole process from cerebral hemorrhage to delayed cerebral edema can be observed more accurately, and more comprehensive data can be collected. In this study, the specific application processes, application scenarios of the model in clinical practice, as well as the adaptation methods to the existing clinical workflow were not clarified. One of the key focuses of future research work will be to develop the nomogram into software or clinical tools. This can provide intuitive and efficient support for clinical decision-making, enhance the accessibility and practicality of the model in clinical practice, promote its true integration into the clinical decision-making process, and improve the quality of medical services.
In conclusion, the nomogram prediction model based on serum inflammatory factors and hemodynamics provides a new and effective tool for predicting delayed cerebral edema after hypertensive cerebral hemorrhage. Through further research and improvement, it is expected that the model will be continuously optimized, so that it can better serve clinic practice and improve the prognosis of patients with hypertensive cerebral hemorrhage.

