Introduction
Guillain-Barré syndrome (GBS) is an acute immune-mediated polyneuropathy. It is pathophysiologically classified into acute inflammatory demyelinating polyneuropathy (AIDP), acute motor axonal neuropathy (AMAN), acute motor and sensory axonal neuropathy (AMSAN), etc. The main pathophysiological mechanism is complement-mediated nerve injury, induced by antibody-antigen interaction in the peripheral nerves [1]. The forms of treatments are various; however, until today, plasmapheresis, intravenous human immunoglobulin, and other immunotherapies do not provide satisfactory treatment results [2].
There are a large number of microorganisms in the human intestine, in which the intestinal microbiota accounts for a large proportion. The number of genes contained in the intestinal microbiome is up to millions. These include multiple gene groups [3] related to metabolism and immunity. Under normal circumstances, the intestinal microbiota and the host maintain a dynamic balance. The intestinal microbiota plays an important role in regulating the innate and adaptive immune response, the intestinal barrier homeostasis and other protective roles [4, 5]. Studies have shown that imbalance of intestinal microbiota and changes in microbiota composition and proportion are not only associated with intestinal inflammatory diseases, but also closely related to chronic diseases such as autoimmune diseases, diabetes, dementia and obesity [6–8].
In the recent years, extensive research has been done on the imbalance of T helper cell (Th) 17/regulatory T (Treg) cells in GBS patients. Studies have shown that a complex network of Th17, Treg and other immune cells and their effector cytokines in the CD4+ T cell subgroup participates in the immune regulation of GBS, and these affect the occurrence, development and outcome of diseases [9]. In the acute phase of infection or inflammation, interleukin (IL)-6 increases the expression of specific transcription factor, retinoic-acid-receptor-related orphan nuclear receptor γ (RORγt) and induces the differentiation of Th17 cells [10]. With the body at a state free of inflammatory infection or the stable immune response, the expression of Foxp3+ is increased. This is actualized by the induction of transforming growth factor-β (TGF-β), to promote the differentiation and proliferation of Tregs. Tregs increase expression of IL-10, inhibit the role of RORγt, reduce or downregulate the autoimmune response, and thus maintain body immune tolerance. During the anti-immunotherapy and recovery phases of GBS, the expression of Th17 cytokine is reduced whereas the level of Treg cytokine is increased [11].
Bifidobacteria in the gut microbiome of children have a protective role against inflammation-related diseases, highlighting their possible use in developing novel, targeted and effective probiotics [12]. In our previous research, we also found the concentrations of IL-17A in serum and cerebrospinal fluid (CSF) of acute phase of GBS patients significantly higher than those in the healthy control group. These results were positively correlated with the GBS disability scale scores (GDSS) and negatively correlated with Bifidobacterium infantis in the intestine. Treatment with B. infantis significantly improved the symptoms of EAN animal models, through reducing the levels of IL-17A [13]. Therefore, we hypothesize that, under the conditions of infection or other precursor events, the imbalance of intestinal microbiota leads to an immune regulation disorder. Conversely, the imbalance of Th17/Treg expression leads to demyelination of peripheral nerves. B. infantis can improve the clinical symptoms of GBS through regulating the imbalance of intestinal microbiota.
Material and methods
Establishment of experimental autoimmune neuritis (EAN) rat model
This study was approved by the ethics committee of Bengbu Medical College (CMU-2020107). Lewis rats, 6–8 weeks old, weighing 200 ±20 g were purchased from the Experimental Animal Center of Bengbu Medical College. The animals were fed at 22–25°C, with automatic switches between lightness and darkness every 12 h. A total of 100 µl of sensitizers were given to the rats on their soles of the hind limbs, containing 250 µg myelin P2 protein (amino acids 53–78) emulsified in an equivalent amount of complete Freund’s adjuvant (Sigma, MO, USA, comprising 10 mg/ml M. tuberculosis H37Ra) [14]. At 0 and 24 h, the rats were injected with 200 ng of pertussis toxin (CAT Number: 70323-44-3, Sigma, MO, USA) via the tail vein. Animals were randomly divided into three groups: Control, EAN group and EAN + B. infantis. Each group comprised six rats. Daily intragastric administration of B. infantis (109 CFU/ml) prescription started from the first day after immunization [13]. The clinical paralysis symptoms of the rats in each group were evaluated daily by two experimenters, and paralysis scores and changes in their weight were recorded. Paralysis scoring criteria were as follows: Normal – 0 points; tail mopping or tail tip up – 1 point; righting reflex impairment – 2 points; moderate paralysis – 3 points; severe paralysis – 4 points; quadriplegia or death – 5 points [14, 15]. The rats were sacrificed on day 15 of immunization, and their gastrocnemius samples were taken for hematoxylin-eosin (HE) staining.
Electron microscopy of sciatic nerve
A 1 cm length of sciatic nerve was taken on each side and fixed in 2.5% glutaraldehyde. After washing with PBS, it was dehydrated in series, and treated with absolute ethanol for 15 min and 95% acetone for 15 min. Then it was treated with anhydrous acetone for 10 min, and the solution was changed once every 5 min. The tissue was placed in the embedding agent propylene oxide solution (1 : 1) for 1 h and in a pure embedding agent for 3 h. Its ultra-thin sections were double-stained with uranyl acetate and lead citrate. The slides were observed and photographed with a transmission electron microscope (TEM).
Sequencing of intestinal microbiota of EAN rats
After the collection of fresh stool samples, the DNA was extracted with a kit; the concentration and purity were detected by ultraviolet spectrophotometer. The quality of the DNA samples was detected by 0.8% agarose gel electrophoresis, and stored at –20°C for metagene detection. Stool samples from normal control, model and treatment groups were collected for intestinal microbiota sequencing. Specific primers (338F: ACTCCTACGGGAGGCAGCAG and 896 R: GGACTACHVGGGTWTCTAAT) with a barcode were synthesized according to the bacterial 16S rRNA V3 region.
The PCR of 16S rRNA V3 region was amplified, and the sequencing library of the Illumina MiSeq was prepared using the amplified product as a template; the V3 region was sequenced using the Illumina MiSeq system. First, quality control on the raw data was performed. Flash software (http://www.genomics.jhu.edu/software/FLASH/index.shtml) was used to connect the sequences that passed the quality control and filter the connected sequences (consecutive identical bases < 6; fuzzy bases N < 1) to get the final sequence for analysis. The sequences were classified into multiple operational taxonomic units (OTUs) based on their similarity. Based on the OTU data obtained, a dilution curve was made for each sample. The OTU abundance values of each sample were sorted, and their log2 values were used for the abundance distribution curve. The software mothur (http://www.mothur.org/) was used to calculate the commonly used biodiversity index and the analysis of significant differences among groups.
ELISA
After 15 days of treatment with B. infantis, blood from the tail vein was collected and centrifuged at 1500 × g for 5 min, and the supernatant was carefully collected. 50 µl of the sample to be tested was added to each detection well of the ELISA plate, 50 µl of enzyme conjugate was added to each well, nothing was added to the blank control well, and they were incubated at 37°C for 2 h. Then the liquid in the wells was discarded, 100 µl of the developer was added to each well, mixed and then incubated at 37°C for 15 min. The blank control well was zeroed, the wavelength was set to 450 nm, and the optical density (OD) of each well was measured with a microplate reader. According to the standard curve, the expression levels of IL-17 (ab119536), IL-10 (ab100764) and TGF-β (ab119558) in serum samples were calculated. The ELISA kits were purchased from Abcam, Shanghai, China.
Flow cytometry
After 15 days of B. infantis treatment, the blood from the tail vein was collected. The T lymphocytes were isolated using a 1 : 1 ratio of an appropriate amount of lymphocyte separation medium (Haoyang, Tianjing, China). The collected cells were stained by adding anti-CD4-PerCP-Cy5.5 (BD Biosciences, San Jose, CA, USA), incubated for 15 min, and fixed by incubation for 15 min with 1 ml of fixative, and washed; then its supernatant was discarded. 1 ml of lysing agent was added to rupture the membrane. After washing, monoclonal antibodies anti-rat IL-17-PE and anti-rat Foxp3-APC (BD Biosciences, San Jose, CA, USA) were added for intracellular staining. Flow cytometry was carried out to calculate the percentage of Th17 cells and Treg cells.
Detection of IL-7 and Foxp3 mRNA expression
Total RNA from lymphocytes (106 cells) was extracted using Trizol (Invitrogen, CA, USA) and reverse transcription was carried out with a Reverse Transcriptase kit (Takara, Dalian, China). Primer sequences were synthesized by Sangon Biotech. The PCR reaction products were electrophoresed, viewed under an Ultraviolet (UV) transmission instrument, and then analyzed with a Gel-Pro Imager 60-2517 imaging analysis system. The relative expression of the target RNA was determined according to target RNA/β-actin.
Detection of intestinal bacterial biomarker in GBS patients by fluorogenic quantitative PCR
All patients with GBS who accepted medical services in the First Affiliated Hospital of Bengbu Medical College in the period from January 2017 to December 2018, 30 patients in all, and 20 healthy controls (HC) were enrolled in this study. The patients were diagnosed according to the National Institute of Neurological Disorders and Stroke (NINDS) diagnostic criteria. Their demographic and clinical characteristics are summarized in Supplementary Table SI. Written informed consent was obtained from individual participants, and the experimental protocol was approved by the Ethical Committee of Bengbu Medical College. After the collection of fresh stool samples, the RNA was extracted with a RNA specific kit (Dingguo, Beijing, China). The primers (Table I) of the selected intestinal bacteria were designed and detected by fluorogenic quantitative PCR.
Table I
Primers for quantitative polymerase chain reaction
Statistical analysis
The software package SPSS19.0 was used for statistical analysis. Data were expressed as mean ± standard deviation. Comparisons between groups were made using t-tests. Comparisons of more than two groups were analyzed using one-way analysis of variance. Comparisons between groups were analyzed using the rank sum test. Correlation analysis was performed using rank correlation coefficients. P < 0.05 indicated that differences between groups were statistically significant.
Results
Bifidobacterium infantis improved EAN
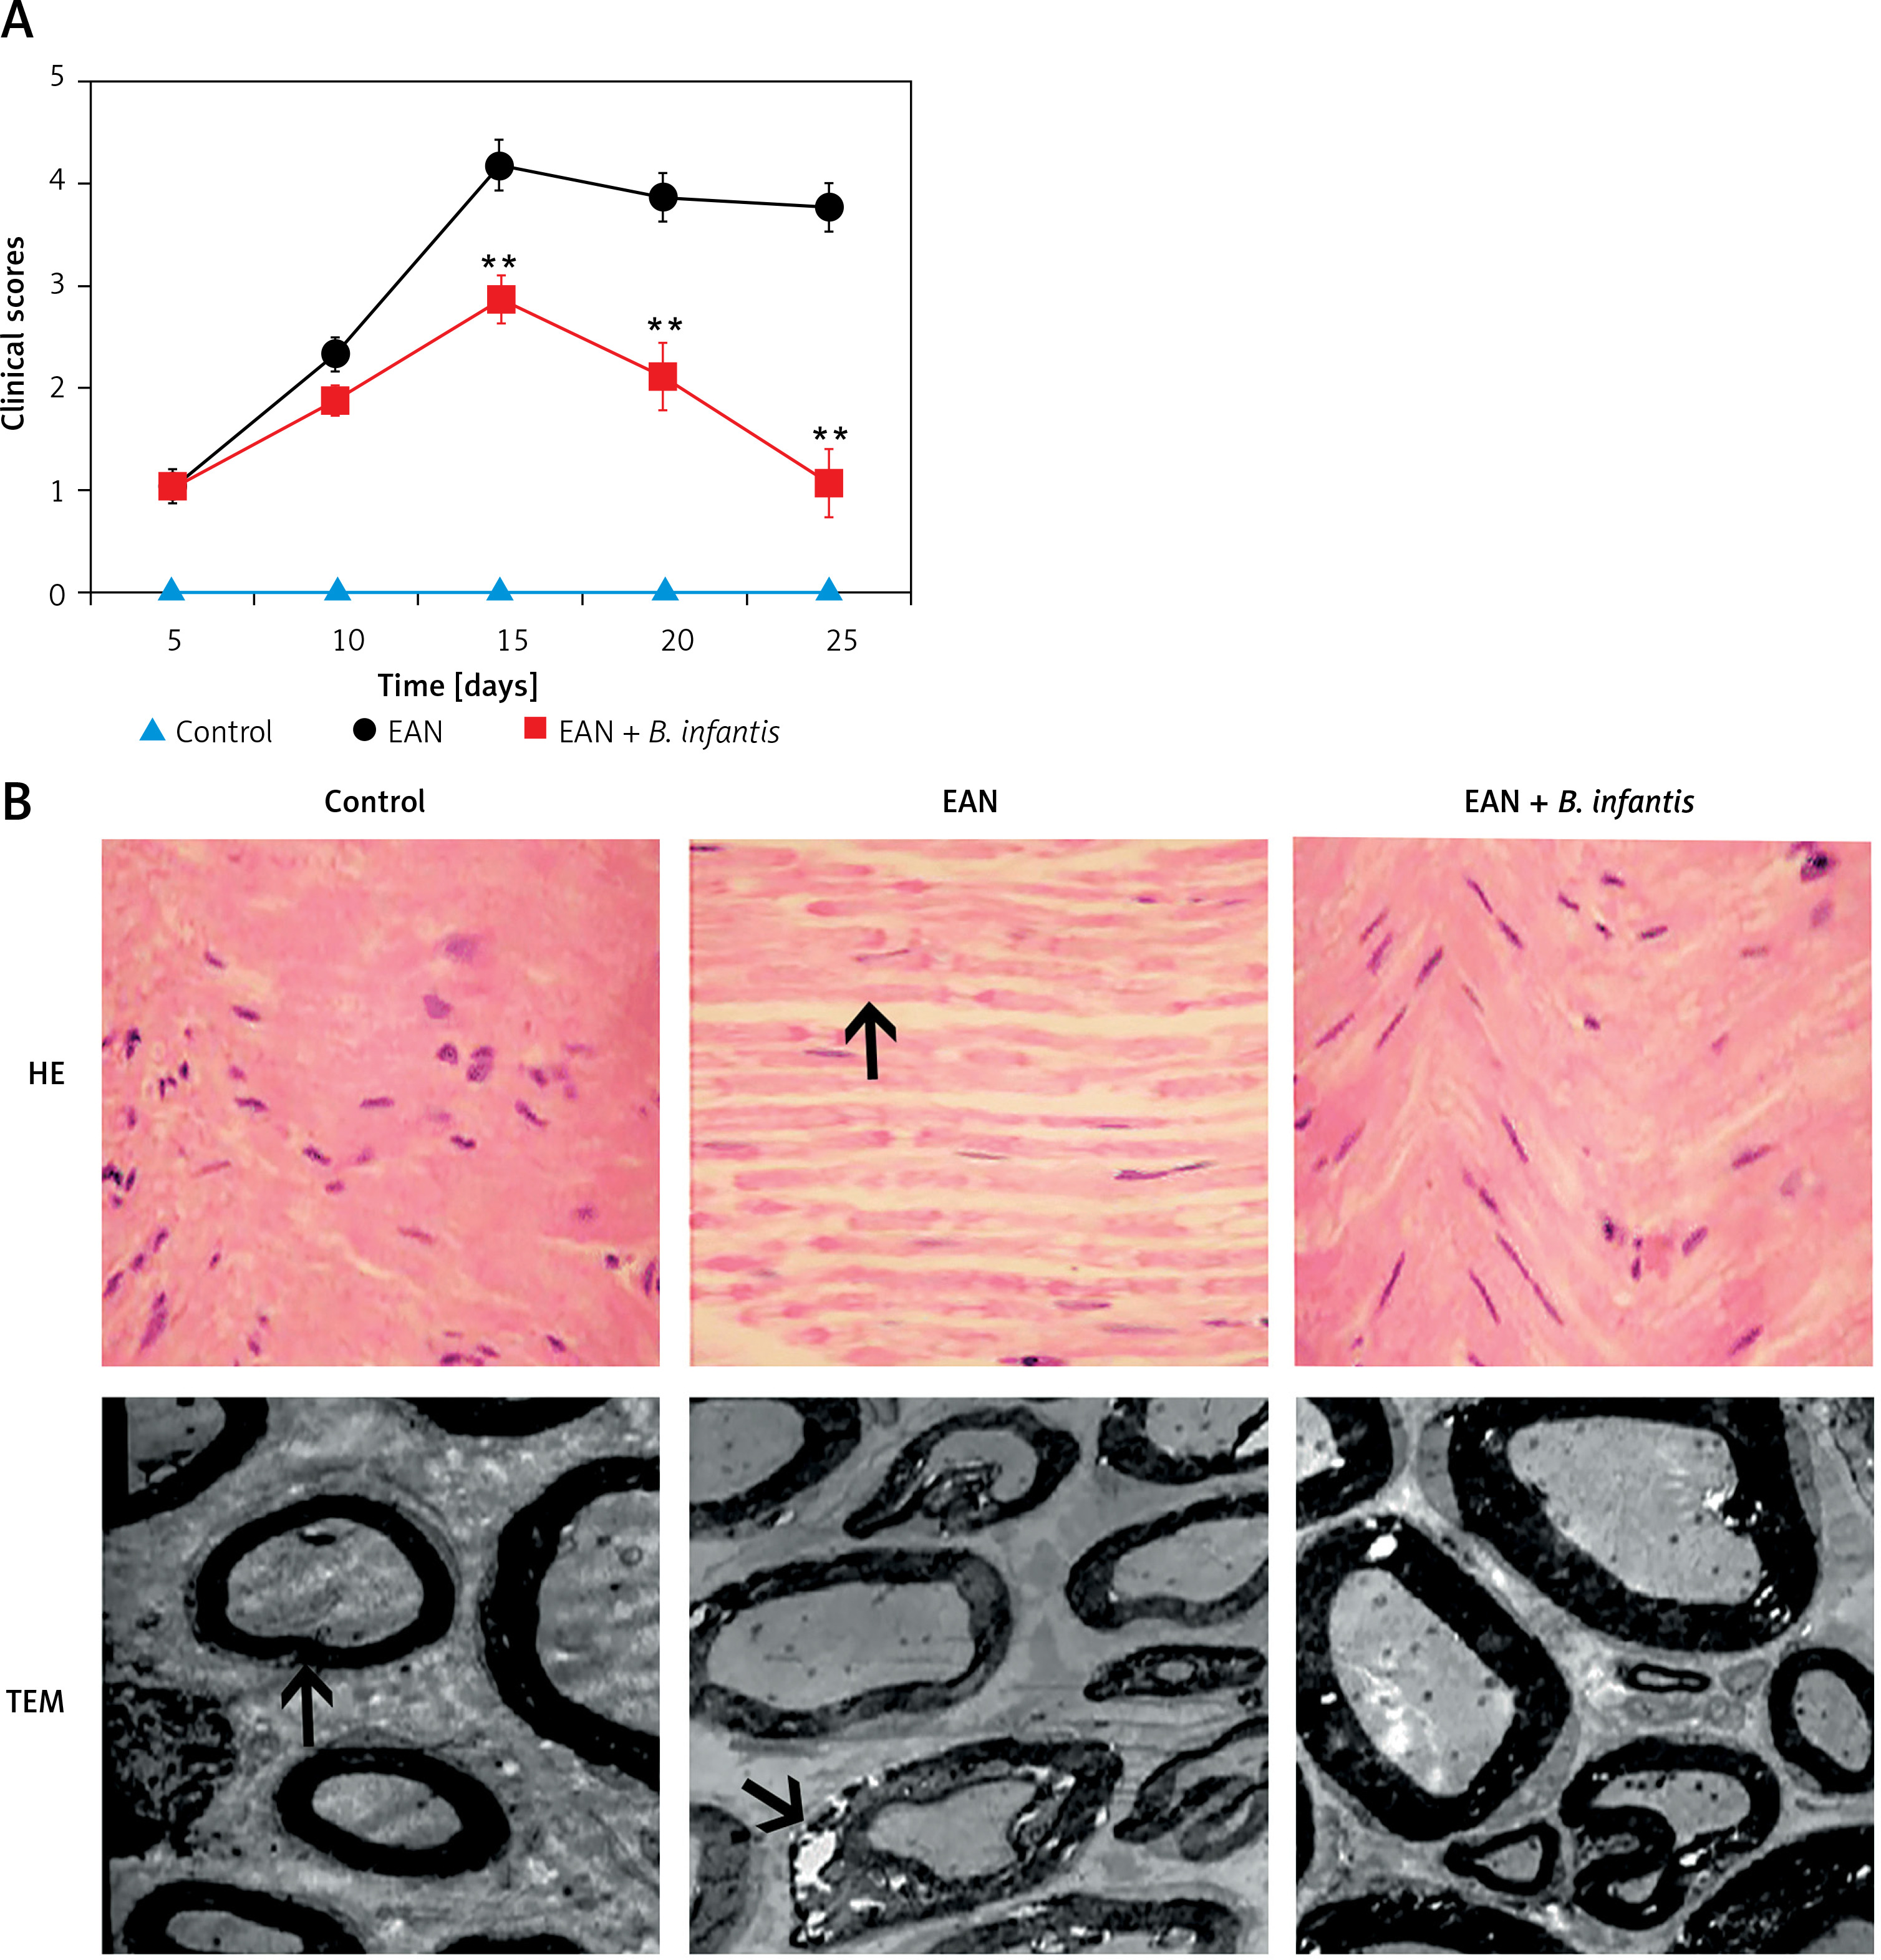
The rats of the EAN group began to exhibit clinical symptoms from the first day of immunization. On the 5th day of immunization, the rats exhibited tail mopping behavior with the clinical score 1.04 ±0.15. This indicates that the modeling is successful. Paralysis peaked on the 15th day with a clinical score of 4.24 ±0.38, and the symptoms gradually eased off from the 20th day, after which the clinical scores decreased. From the 15th day, the clinical scores were significantly improved after administration of B. infantis (p < 0.01, Figure 1 A). The HE staining results showed that the muscle fibers became thinner, the arrangement was disordered, and the gap was increased in the EAN group. The gastrocnemius muscle exhibited a recovery to normal morphology after administration of B. infantis (Figure 1 B). Moreover, the nerve fiber myelin sheath and axonal structure were normal, and the central axon was surrounded by the layered myelin sheath laminar structure in the control group. Compared with the control group, obvious demyelination was observed in the EAN group. The demyelination of the sciatic nerve was alleviated after administration of B. infantis (Figure 1 B).
Figure 1
Bifidobacterium infantis improved EAN (n = 6). A – clinical scores. B – hematoxylin-eosin (HE) staining (×400) – the arrow indicates gastrocnemius muscle, and transmission electron microscope (TEM) – the arrow indicates myelin lamellae. Separation of the myelin lamellae was observed in the EAN group
**p < 0.01 vs. EAN
Bifidobacterium infantis improved Th17/Treg imbalance
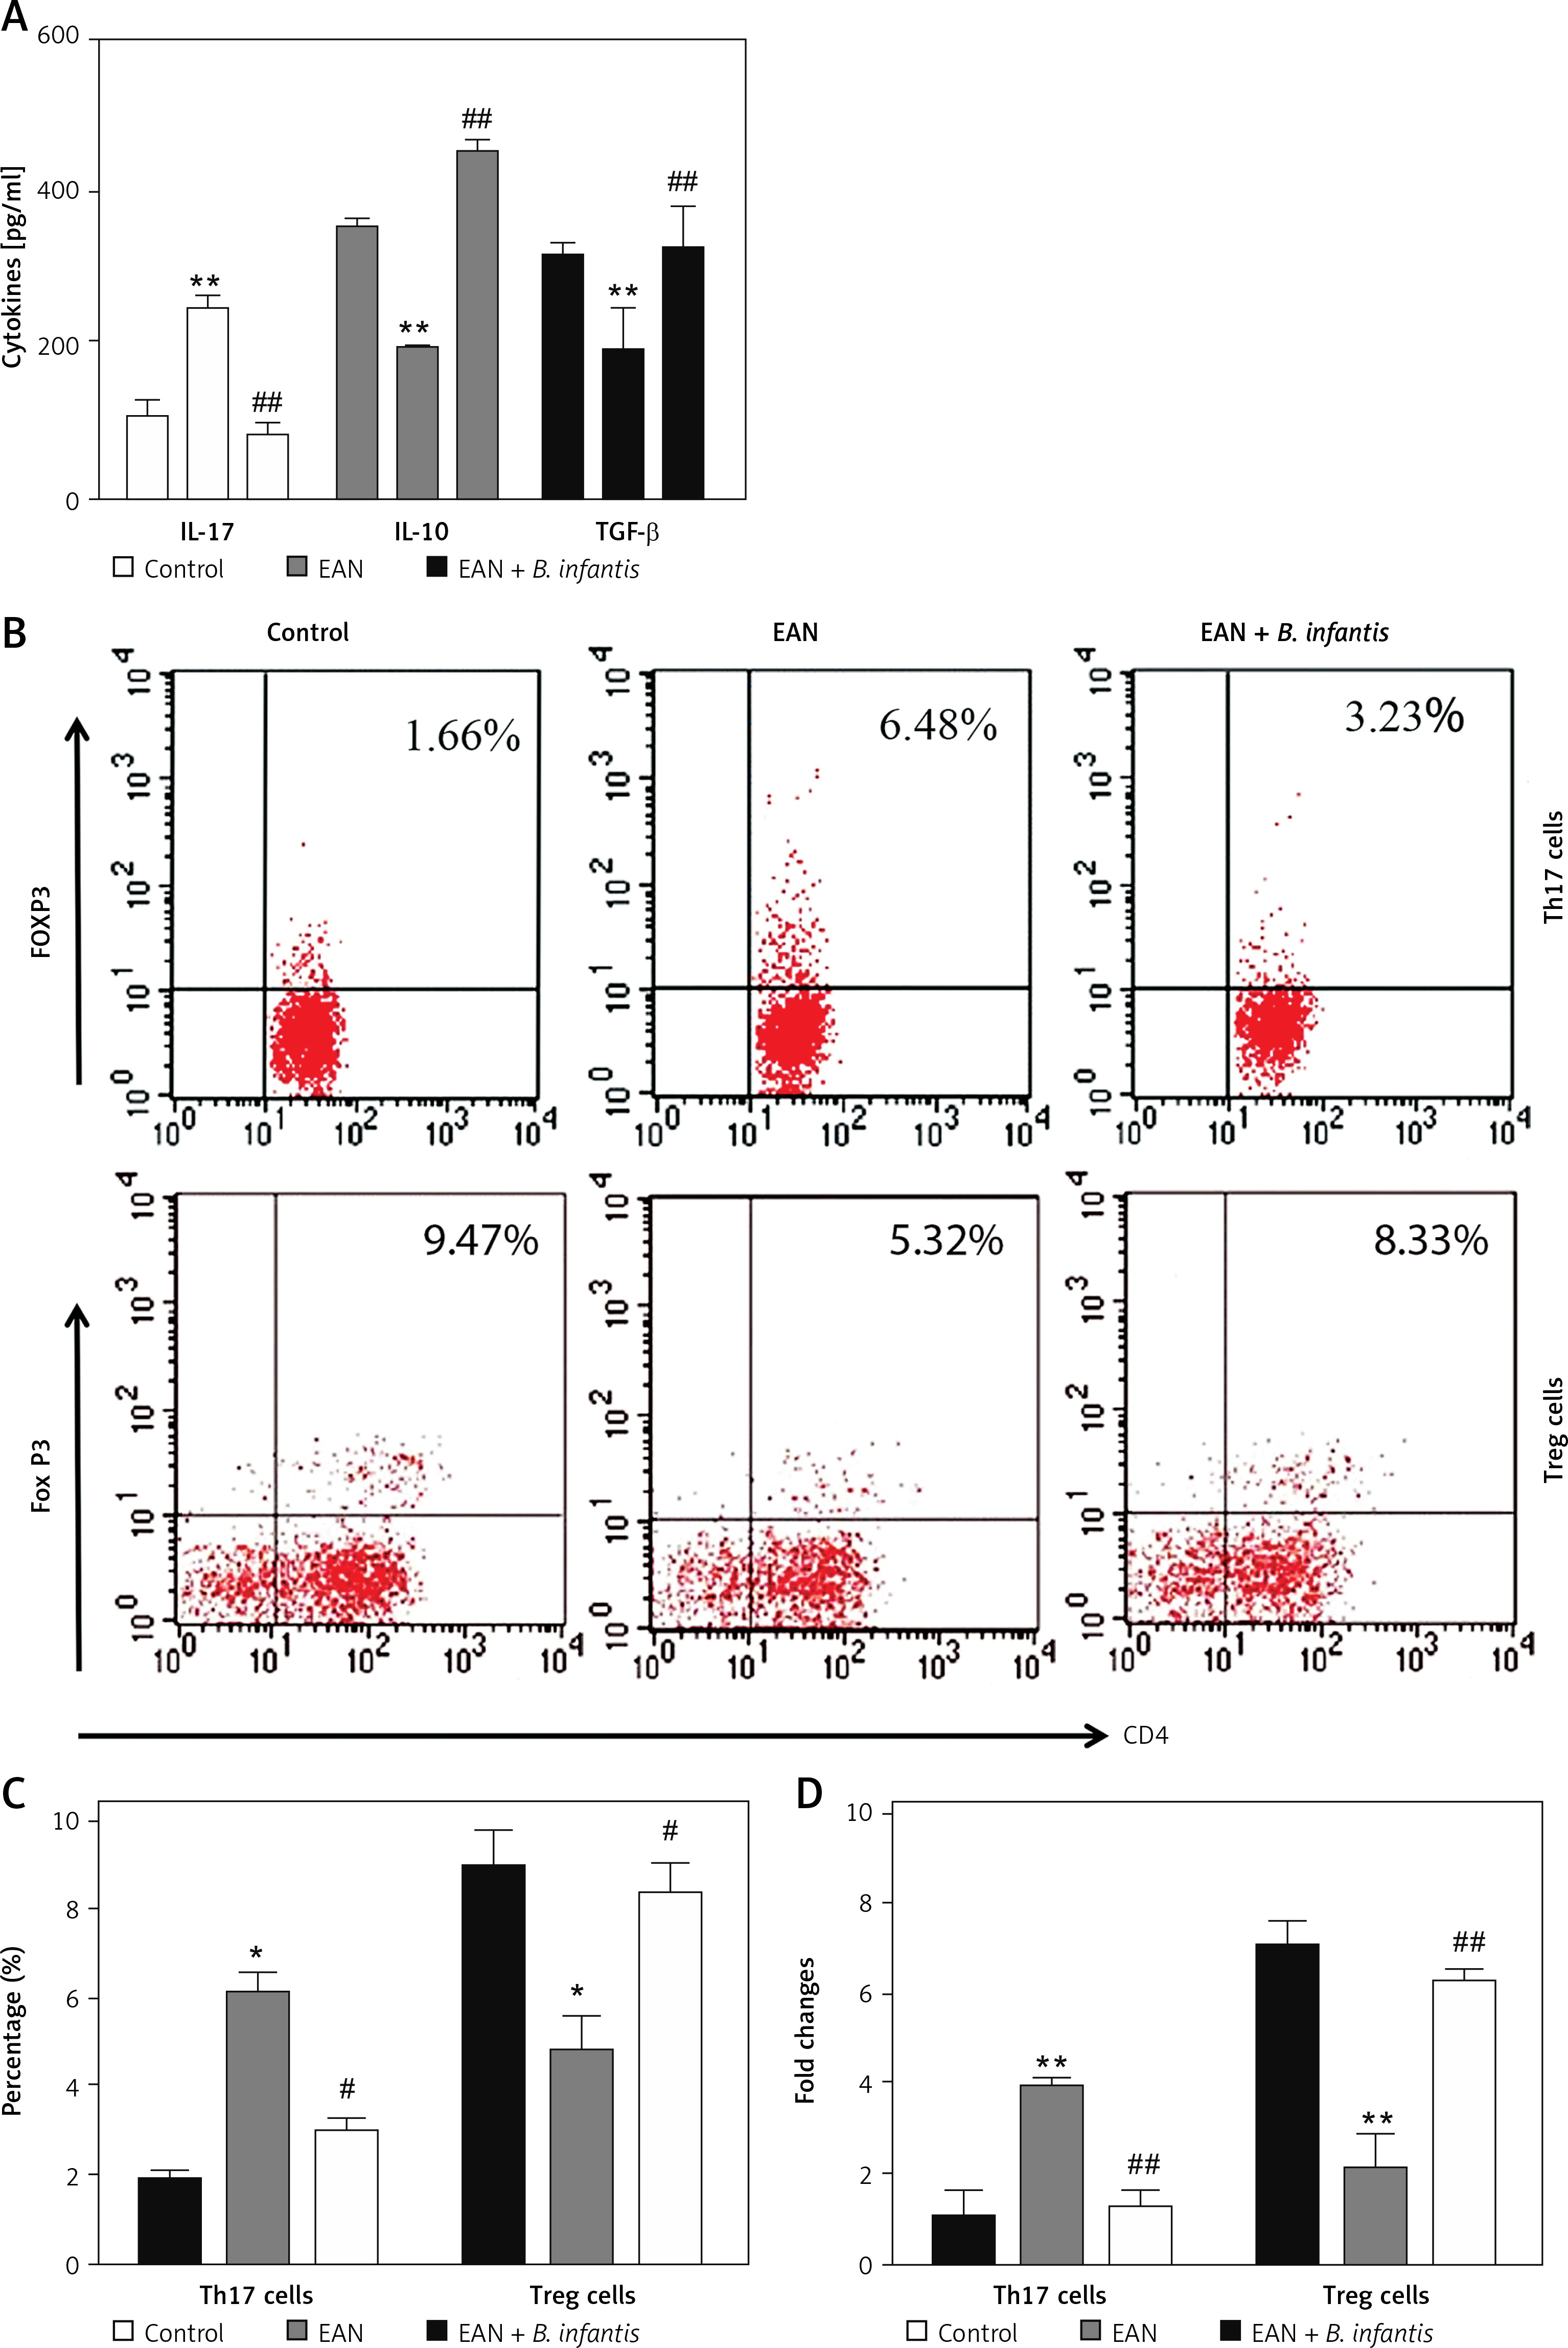
By detecting cytokines, we found that the expression levels of IL-17 were increased, while IL-10 and TGF-β in the serum of the EAN group were reduced when compared with the control group (p < 0.01). After administration of B. infantis, the expression levels of IL-17 were reduced, while IL-10 and TGF-β were increased, when compared with the EAN group (p < 0.01, Figure 2 A). Flow cytometry was used to detect the number of Th17 and Treg cells in blood samples. The results showed that the proportion of Th17 cells increased and Treg cells decreased in the EAN group. After the treatment of B. infantis, the proportion of Th17 cells decreased, and Treg cells increased (p < 0.05, Figures 2 B and C). Real-time PCR showed the same results (p < 0.01, Figure 2 D).
Figure 2
Bifidobacterium infantis improved Th17/Treg imbalance (n = 6). A – IL-17, IL-10 and TGF-β in the serum were examined using ELISA. B, C – the number of Th17 and Tregs cells in blood sample were determined using flow cytometry. D – the number of Th17 and Tregs cells in blood sample were determined using real-time PCR
*p < 0.05, **p < 0.01 vs. EAN, #p < 0.05, ##p < 0.01 vs. EAN.
Bifidobacterium infantis regulated EAN-induced intestinal microbiota imbalance
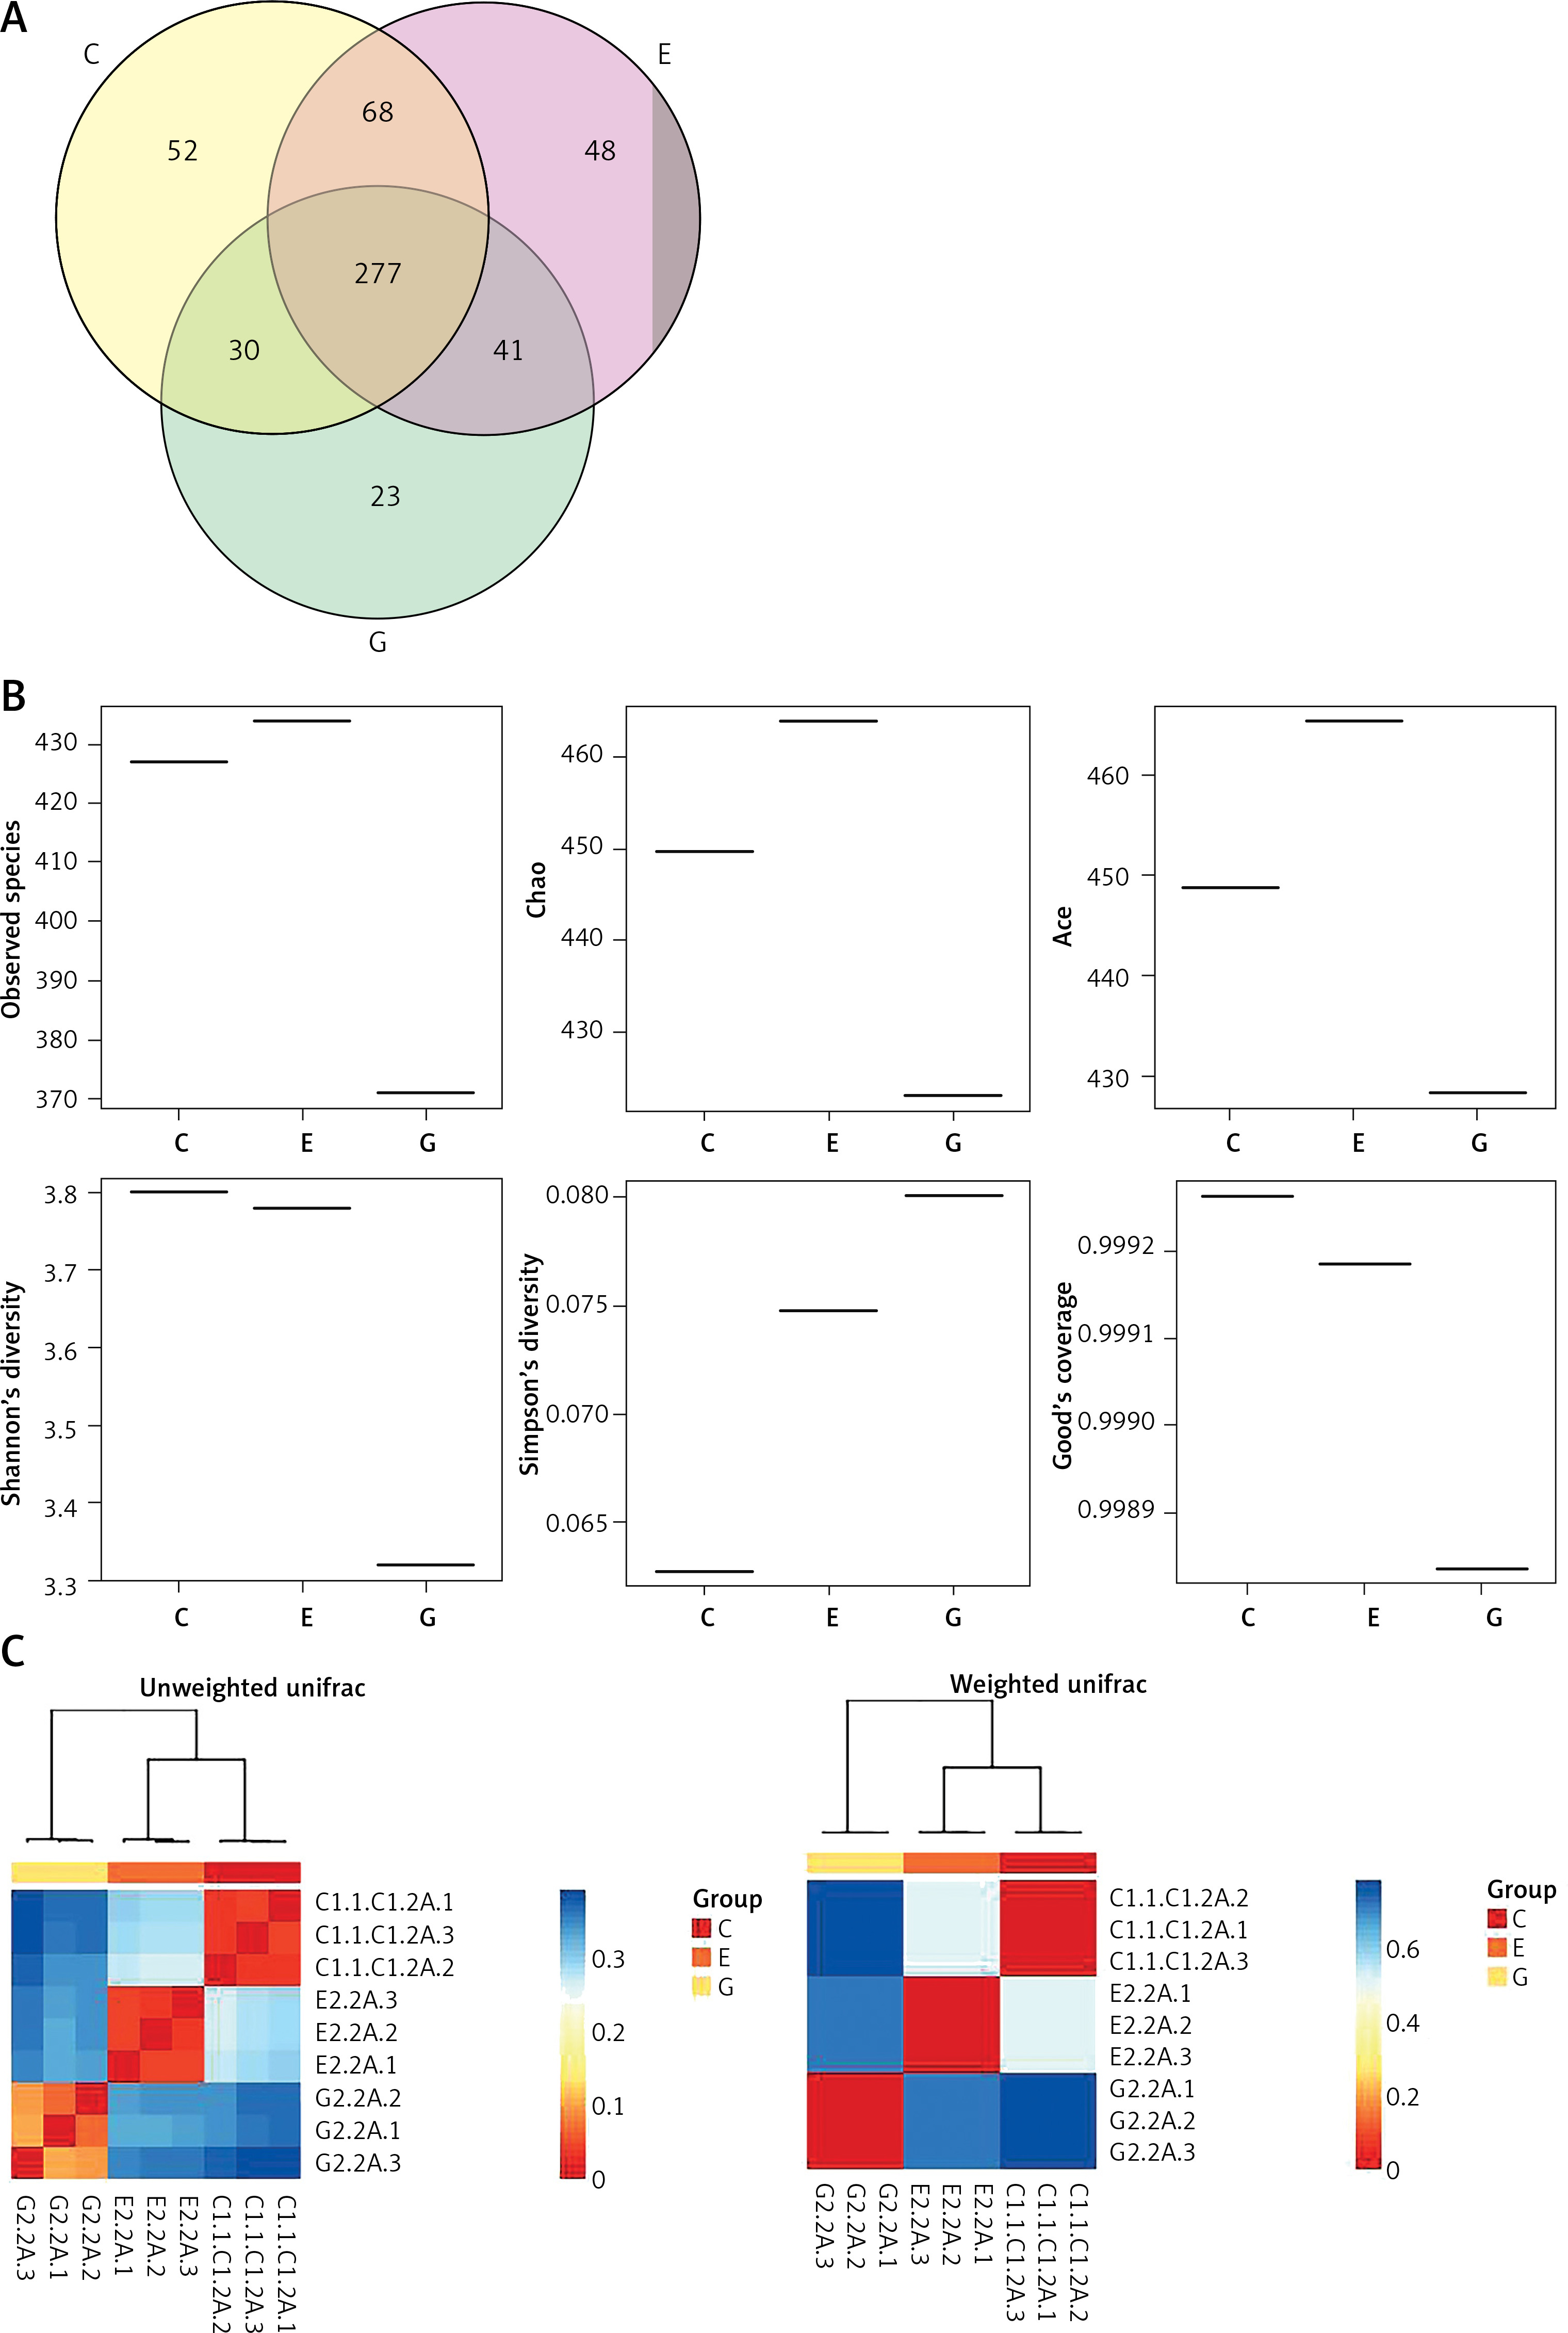
After removing the interrogative sequences, the remaining OTUs were analyzed: The EAN group had 177 different OTUs compared to the normal group, and the B. infantis group had 169 different OTUs compared to the EAN group (Figure 3 A). The end of the α curve of species diversity in each group tended to be flat, showing that this sequencing was sufficient to reflect community diversity (Supplementary Figure S1). The α diversity boxplot including observed species (sobs), chao1, ace, shannon, simpson and Good’s coverage showed that the EAN group had increased intestinal microbial diversity compared to the normal group, and the B. infantis group had a significant decrease in microbial diversity compared to the EAN group (Figure 3 B). The inter-group diversity (β diversity) of the three groups showed that the diversity within the three groups was similar (Figure 3 C), and there was a significant difference in species diversity among groups (Supplementary Figure S2).
Figure 3
The α and β diversity within the three groups. A – the number of different species among three groups. B – α diversity boxplot including observed species (sobs), chao1, ace, shannon, simpson and Good’s coverage. C – inter-group diversity (β diversity)
C – control, E – EAN, G – EAN + B. infantis
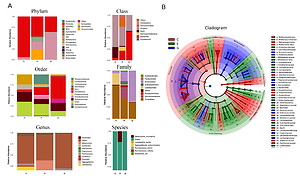
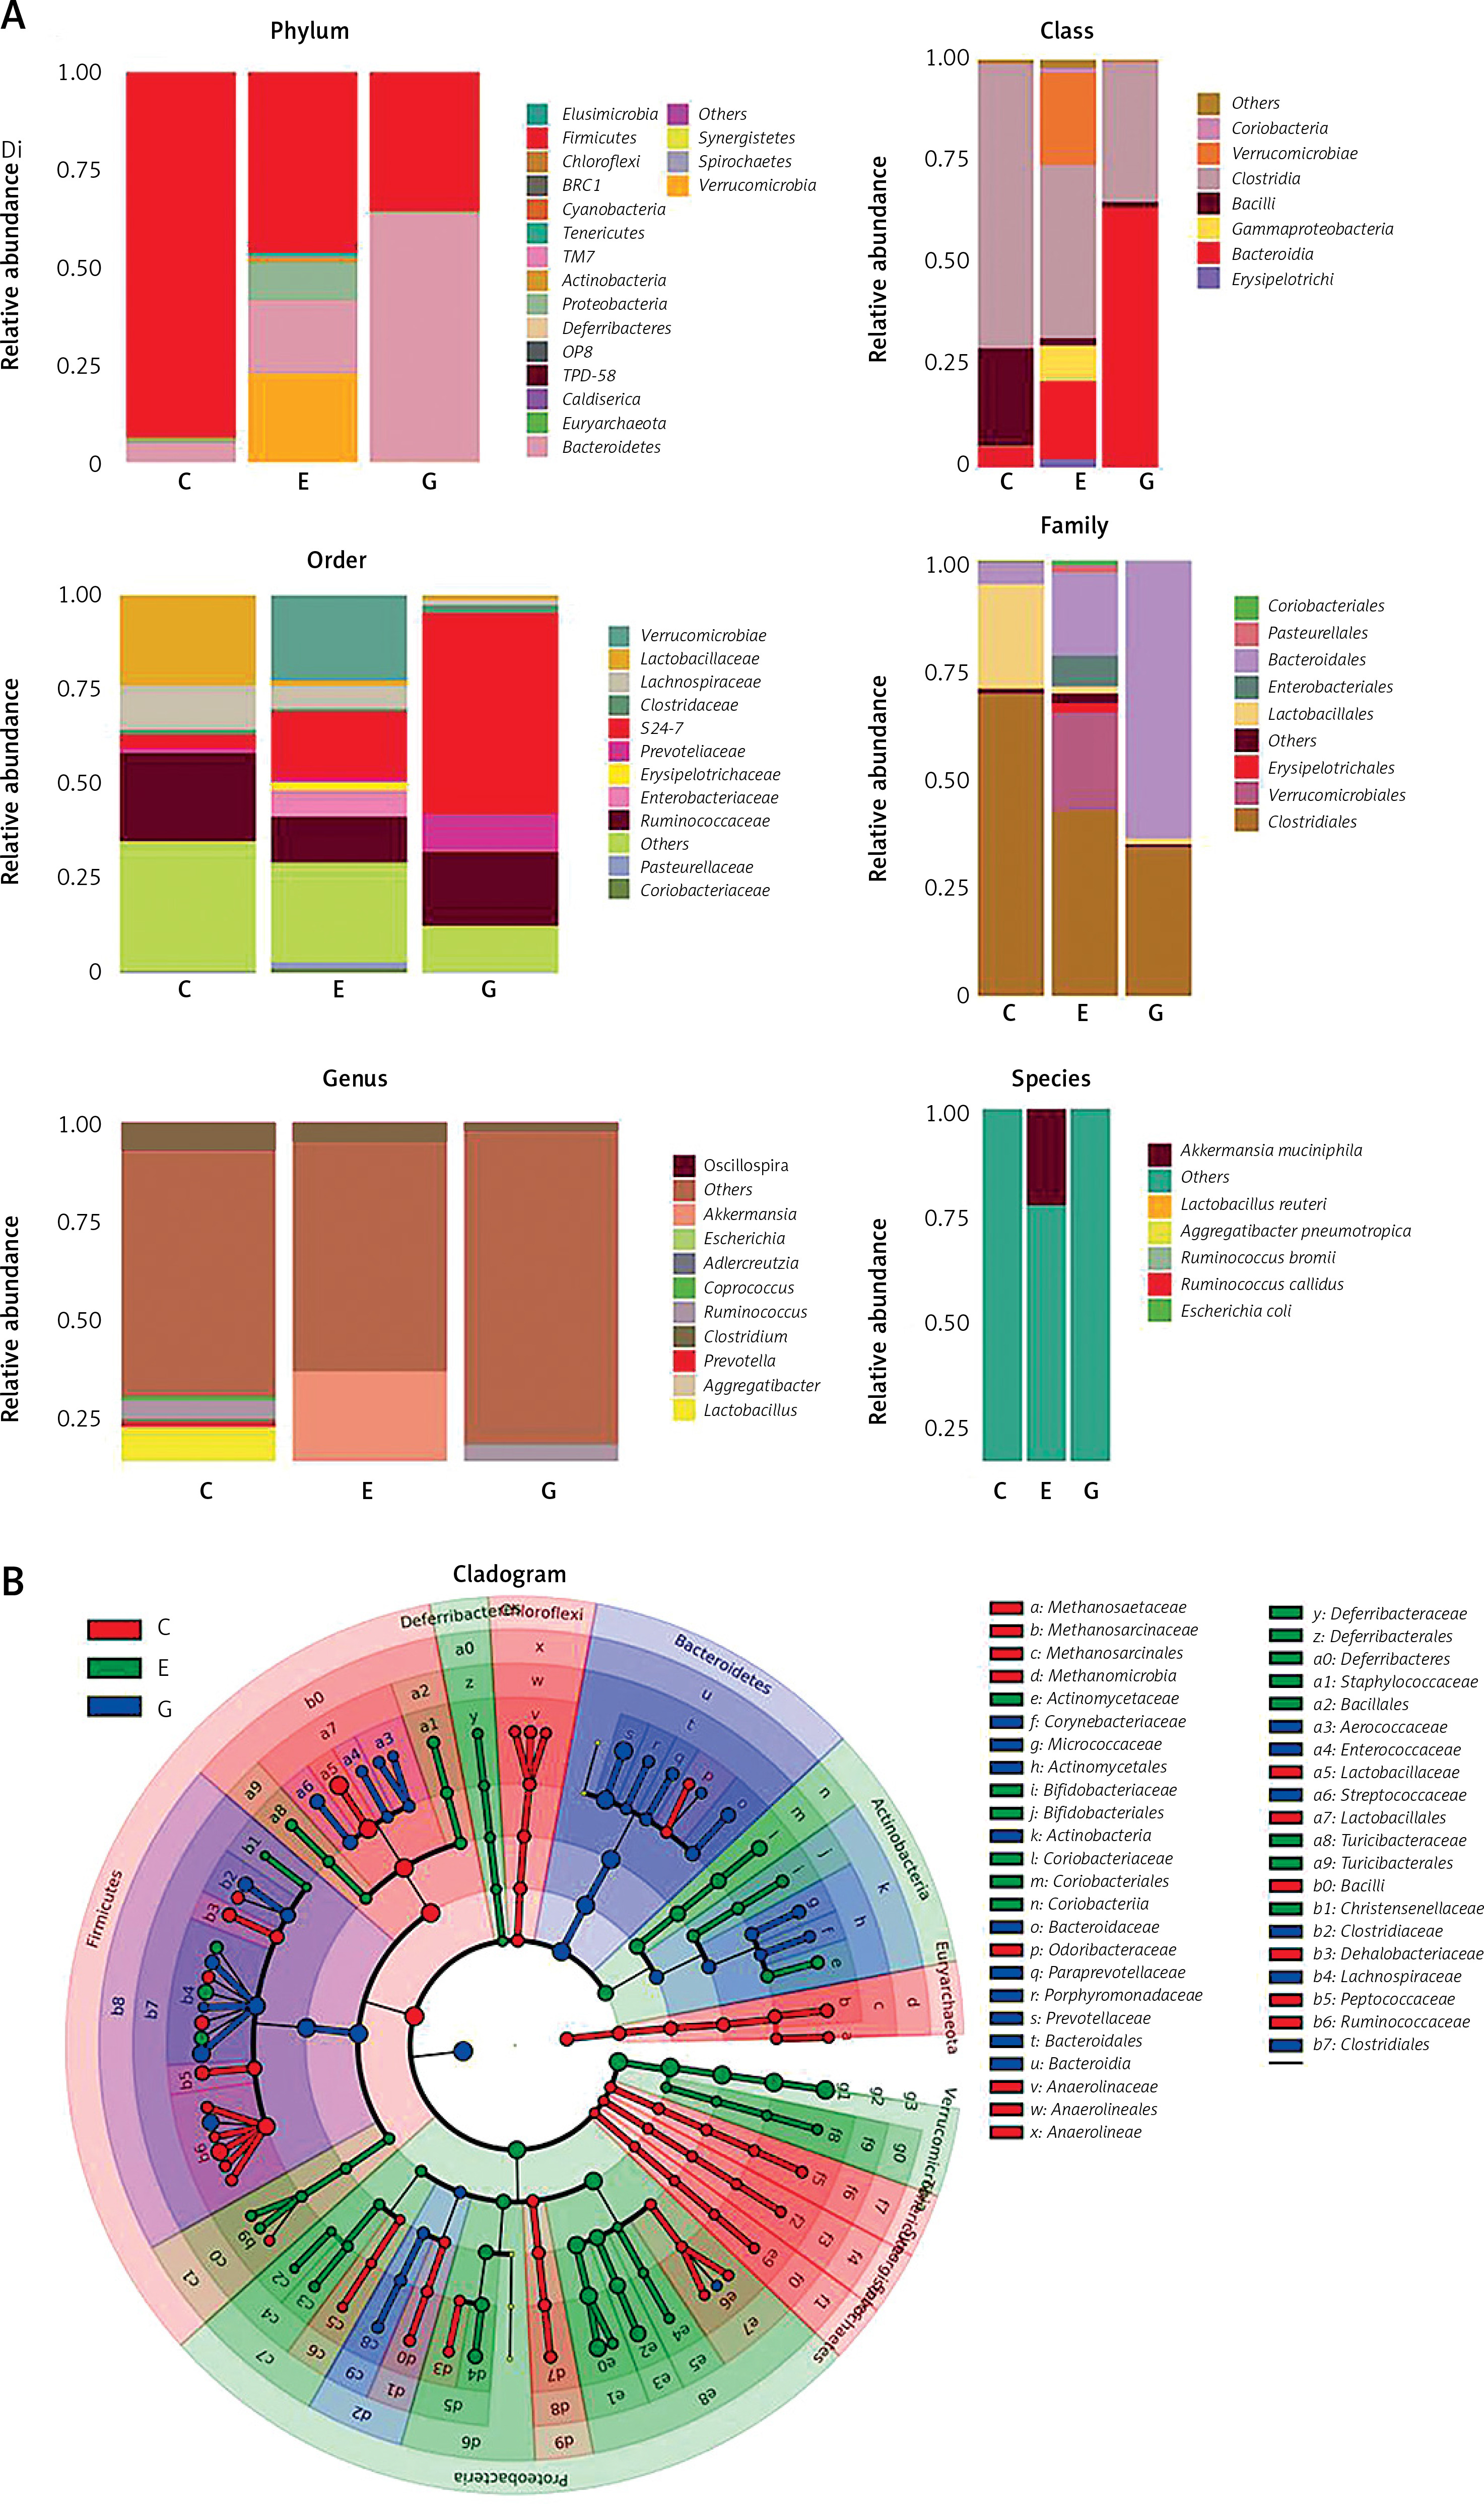
By comparison with the database, the species of OTU were classified, and the histograms of species abundance of each sample were made at the levels of phylum, class, order, family, genus and species. As shown in Figure 4 A, at the phylum level, the number of the dominant bacterial phylum Firmicutes in the EAN group were reduced, and the numbers of Actinobacteria, Proteobacteria and Bacteroidetes were increased. The numbers of Actinobacteria and Proteobacteria were reduced, while Bacteroidetes was increased after B. infantis intervention. At the genus level, the numbers of Lactobacillus, Ruminococcus and Clostridium were reduced and the numbers of Akkermansia, Escherichia and Coprococcus increased in the EAN group; the numbers of Ruminococcus and Clostridium were increased but the numbers of Akkermansia, Escherichia and Coprococcus were reduced after B. infantis intervention. At the species level, the numbers of L. reuteri, R. bromii, and R. callidus were reduced and the numbers of A. muciniphila, P. pneumotropica and E. coli increased in the EAN group; the numbers of R. bromii and R. callidus were increased and the numbers of A. muciniphila, P. pneumotropica and E. coli were reduced after B. infantis intervention. Figure 4 B is the LEfSe analysis clustering diagram.
Figure 4
Bifidobacterium infantis regulated EAN-induced intestinal flora imbalance. A – species abundance of each sample was determined at the levels of phylum, class, order, family, genus and species. B – LEfSe analysis clustering diagram
C – control, E – EAN, G – EAN + B. infantis
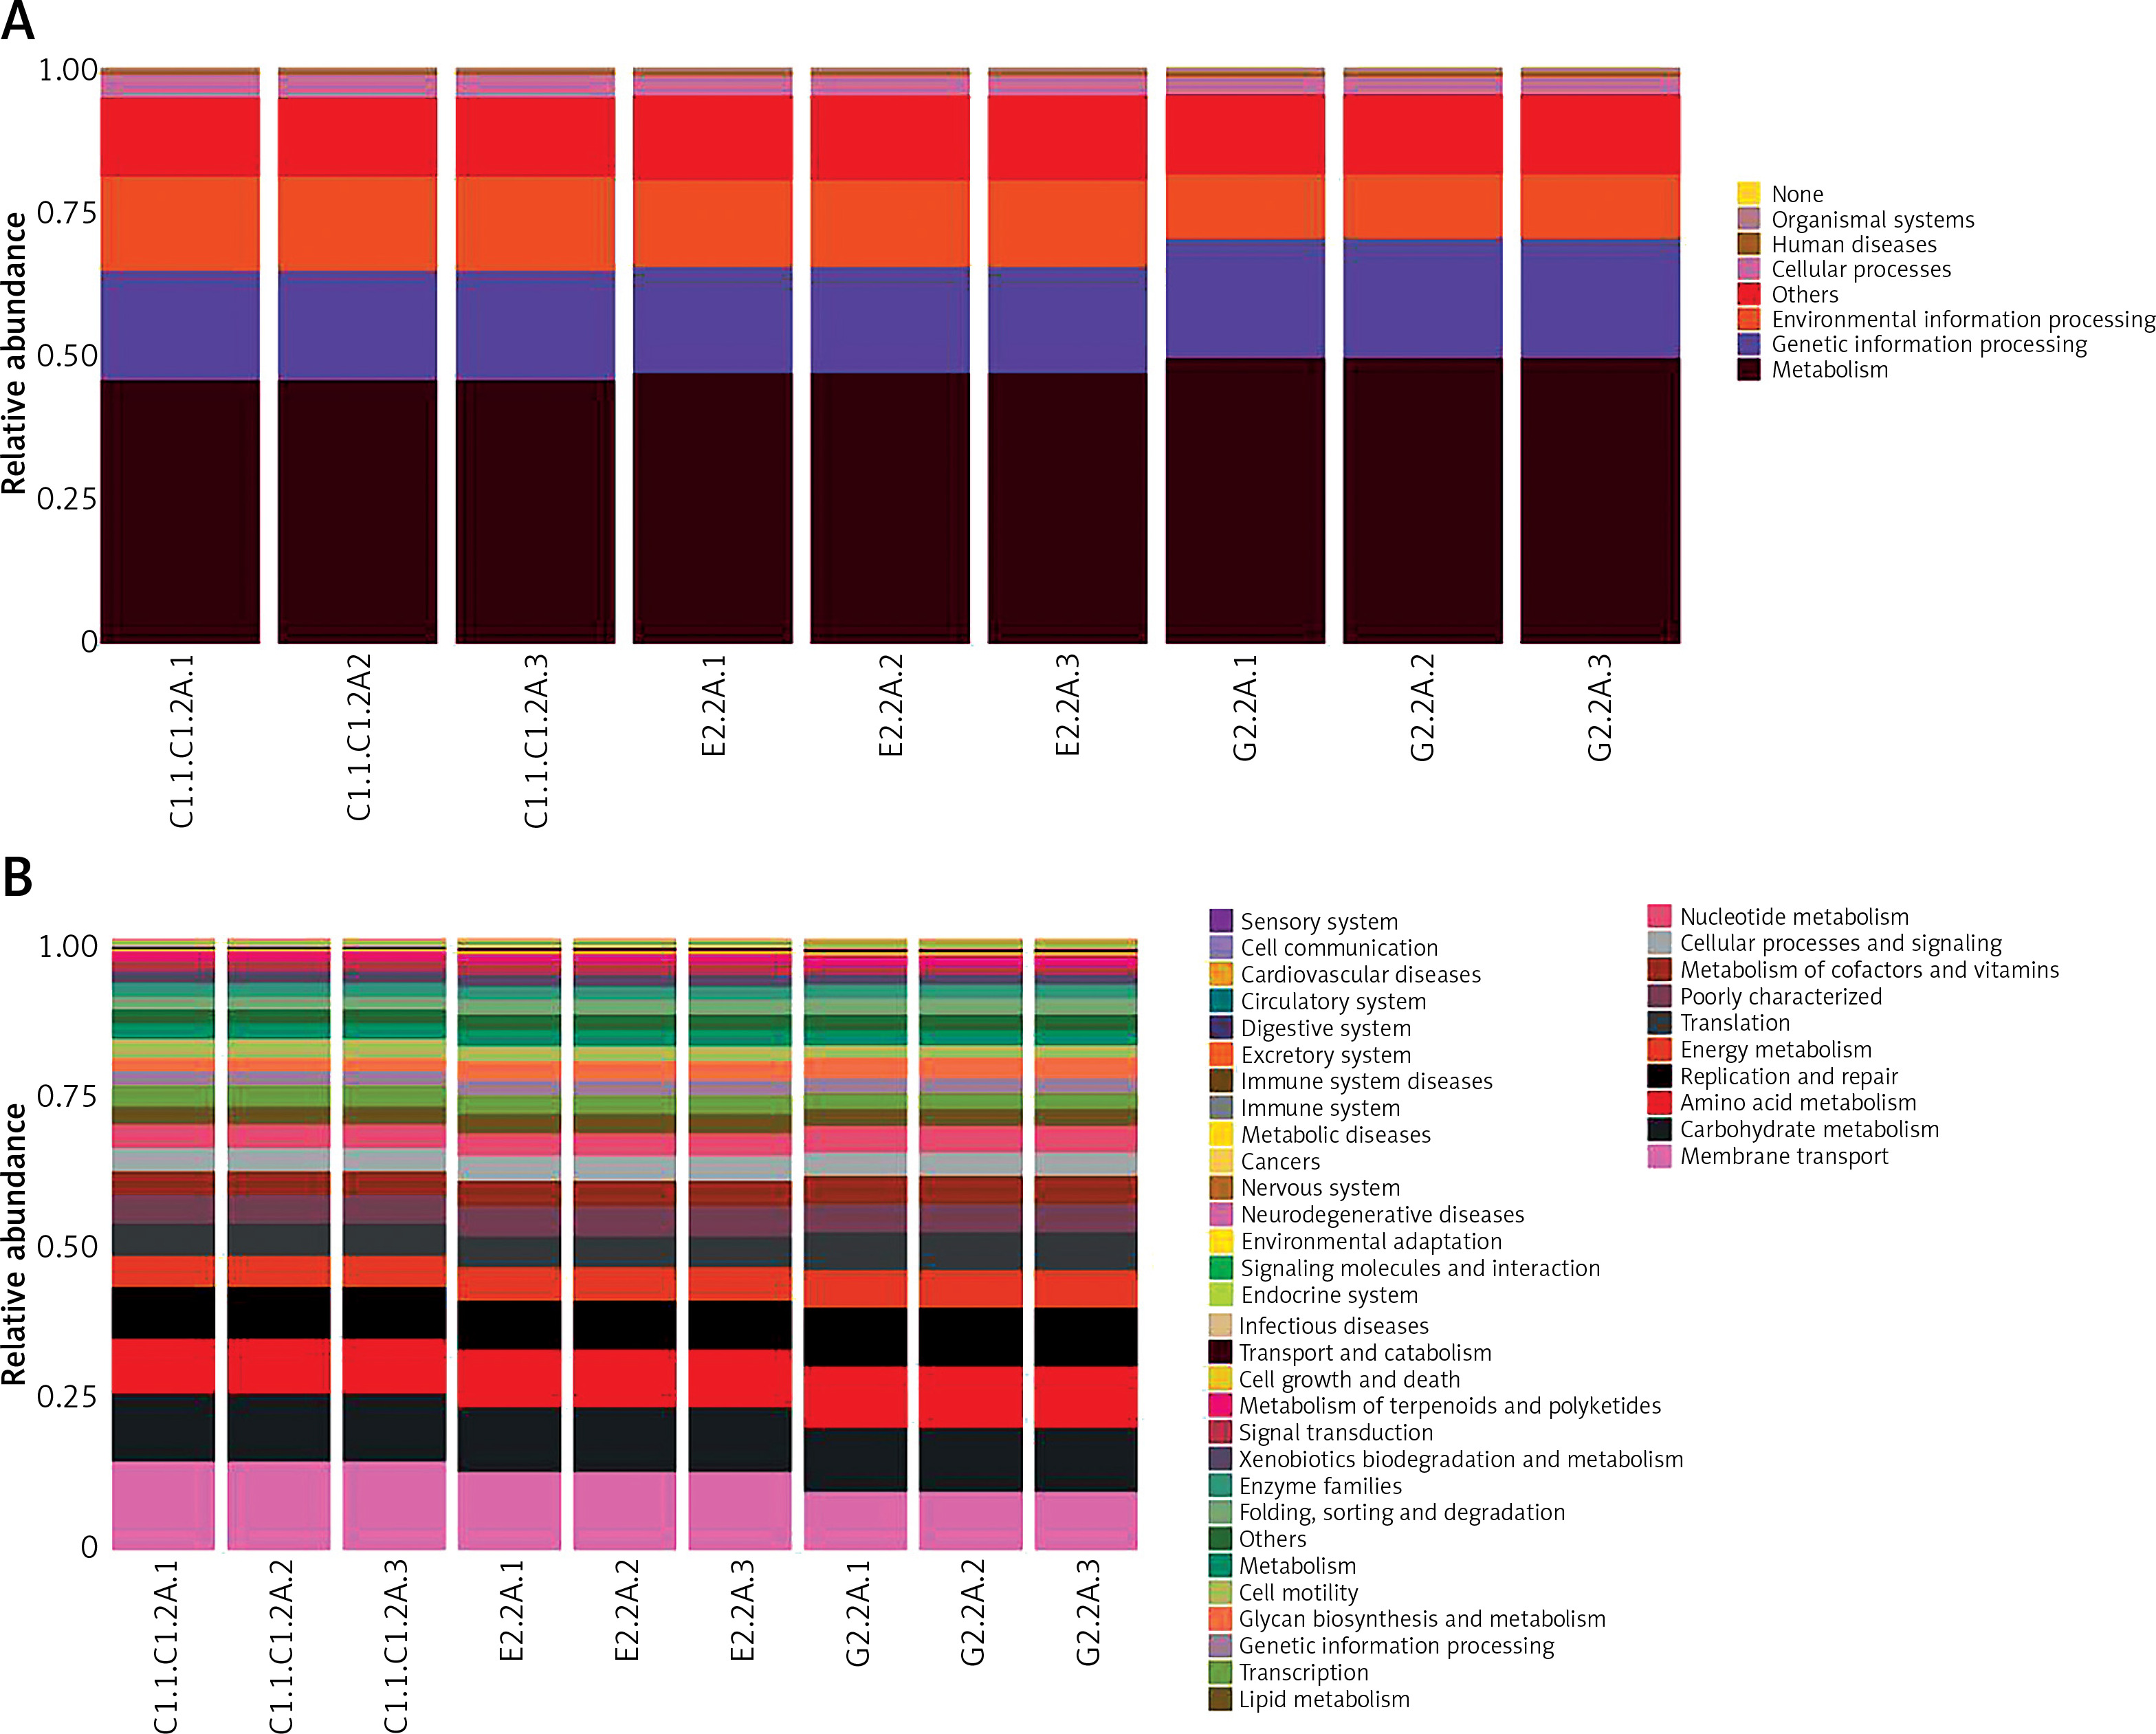
According to the KEGG function prediction heat map in Figure 5, it can be seen that, compared with the EAN group, bacteria related to metabolism and genetic information processing increased to some extent. Bacteria related to environmental information processing significantly decreased in the B. infantis group. However, the differences were not obvious between the EAN group and control group.
Intestinal microorganisms can be used as targets for diagnosis or treatment
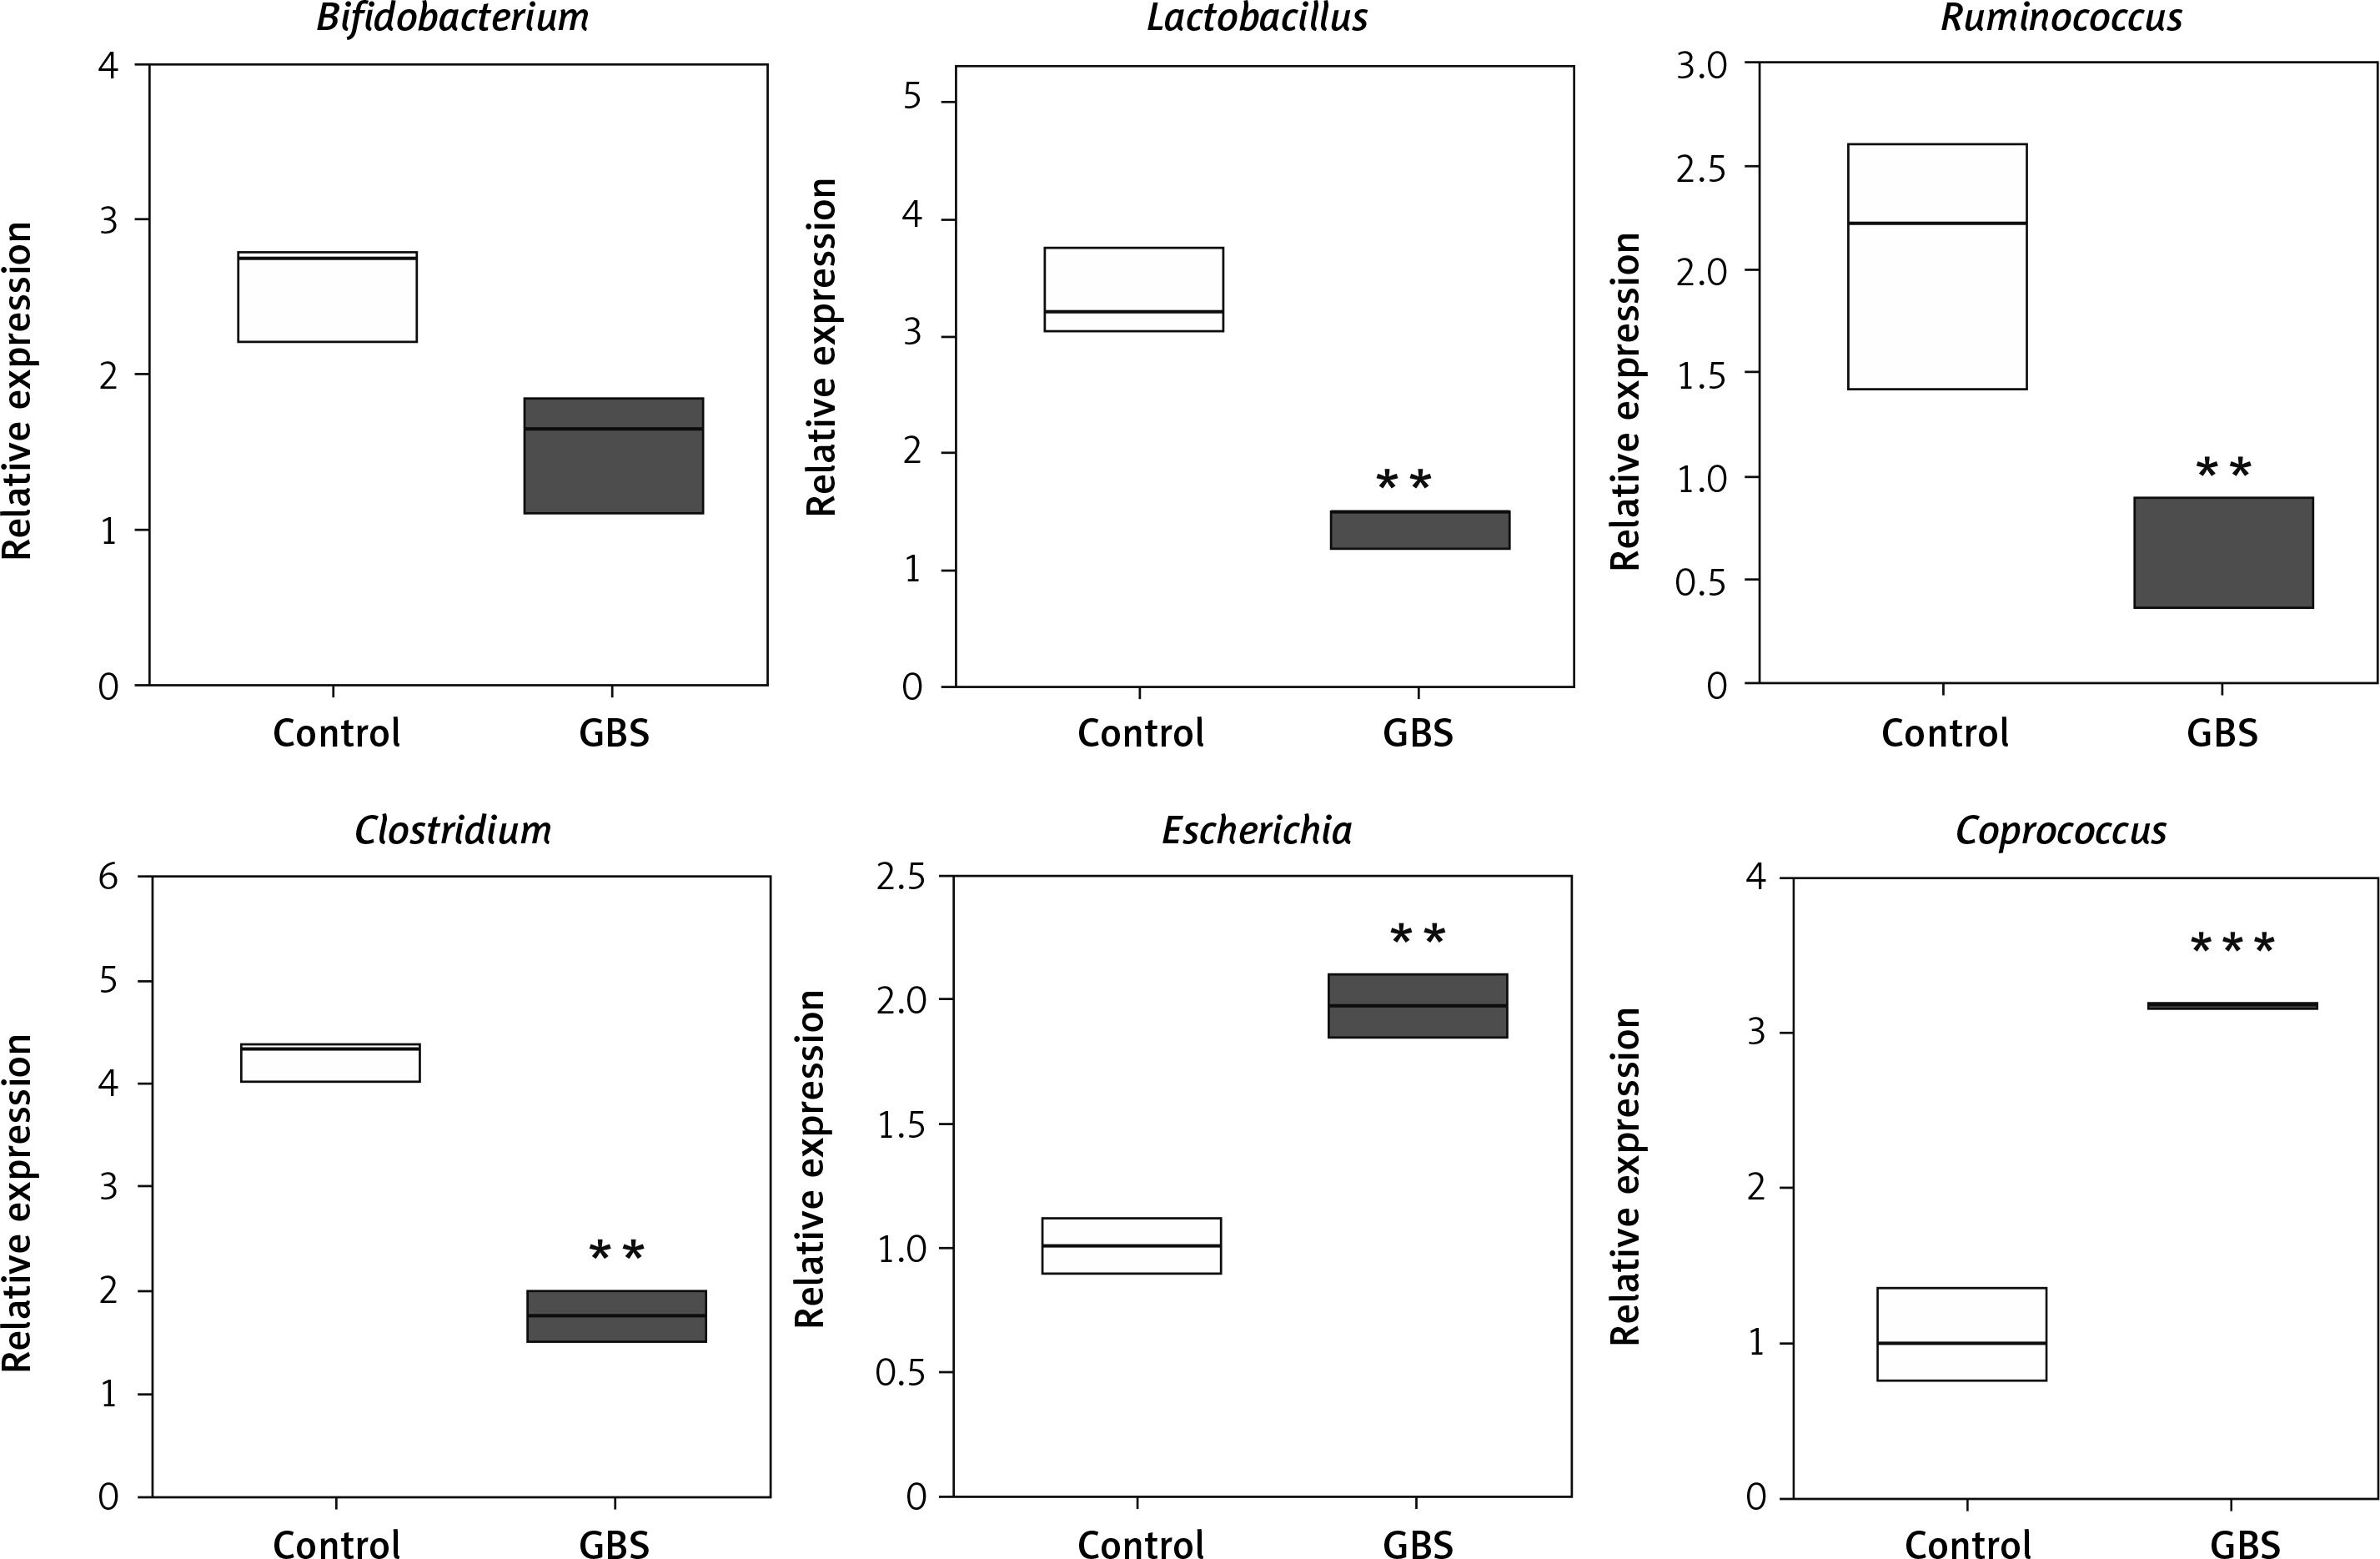
Next, we detected the number of abnormal microorganisms in fecal samples from 30 GBS patients and 20 HC. There was no significant difference in the distribution of age and gender between the GBS patients and the HC (Supplementary Table SI). By testing several microorganisms, it was found that Lactobacillus, Ruminococcus and Clostridium were significantly reduced, while Escherichia and Coprococcus were significantly increased in patients with GBS (Figure 6). This suggests that intestinal microorganisms may be used as targets for diagnosis or treatment.
Discussion
The etiology of GBS has not been fully elucidated. About 70% of GBS patients had a history of infection within 1–2 weeks before onset, and a few patients had a history of surgery or vaccination [16]. In 1955, Waksman and Adams developed an animal model of EAN by using peripheral nerve infusion and an adjuvant. This animal model is very similar to the inflammatory and demyelinating pathological changes of GBS, and it is the main animal model for studying GBS at present [17]. In this study, we used the same model, and found typical pathological changes similar to GBS.
The intestinal microbiota plays an important role in maintaining immune homeostasis [18]. It has been proven that mitigated Tregs and augmented Th17 cells and cytokines are associated with the occurrence and development of EAN [19]. In order to delay and suppress clinical signs of the disease, therapeutic interventions may be focused on inhibiting Th17 cells and their cytokines in the early phase of EAN [19]. Our results indicated that B. infantis can restore the Th17/Treg balance. Th17 cells are an important component of the intestinal innate immune barrier, and their production depends on the presence of normal microbiota [20]. Treg cells and the related factors IL-10 and TGF-β play an important role in the immune tolerance to the intestinal microbiota [21, 22]. This indicates that the effect of B. infantis on Th17/Treg is achieved by regulating intestinal microbiota. Further analysis showed that there is significant microbiota imbalance in the EAN animal model, including reduced numbers of Lactobacillus, Ruminococcus and Clostridium, whereas increased numbers of Akkermansia, Escherichia and Coprococcus were observed. B. infantis interventionpromoted the numbers of Ruminococcus and Clostridium and inhibited the numbers of Akkermansia, Escherichia and Coprococcus. These results are basically consistent with the report that the frequency of Lactobacillus, Anaeroplasma, Adlercreutzia, RF39 and Clostridium was significantly decreased in collagen-induced arthritis, which exhibited Th17/Treg imbalance [23]. Administration of L. salivarius and L. plantarum reduced the Th17 cell fraction and increased the Treg fraction [24]. Intestine-derived Clostridium induces murine tolerogenic dendritic cells and regulatory T cells in vitro [25]. There are some inconsistencies as well; for example, Akkermansia was shown to inhibit Th17 and promotes Tregs in dextran sulfate sodium (DSS)-induced colitis [26], indicating that the immune state of the body is the result of the interaction of microbiota. In order to achieve an effective intervention effect, a variety of single strains or compound strains, which can serve as a control for GBS immune imbalance, can be studied in any future disease intervention.
Next, we verified our results with human patients and found that Lactobacillus, Ruminococcus and Clostridium were significantly reduced whereas Escherichia and Coprococcus were significantly increased in patients with GBS. This suggests that intestinal microorganisms may be used as specific molecular targets for the diagnosis and treatment of GBS. However, the related mechanisms for diagnostic and therapeutic purposes need further study.
In conclusion, our study showed that microbiota disequilibrium is involved in GBS. B. infantis intervention can recover Th17/Treg balance by regulating unbalanced intestinal microbiota, thereby improving GBS.