Introduction
The corpus callosum (CC) is the largest white matter tract in the human brain, consisting of over 190 million fibres that connect the left and right cerebral hemispheres. It plays a crucial role in facilitating higher-order cortical functions, such as the multidimensional representation of information, associative and executive functions, coordination of sensory-motor responses, intellectual processing, and management of social and emotional stimuli [1, 2]. The majority of CC fibres serve to promote homotopic interconnections between the hemispheres, but certain heterotopic fibres also link various cortical regions in an asymmetrical manner [3, 4]. Since there are no clear anatomical landmarks capable of delimiting the different CC subregions in the midsagittal section, previous studies have designed different geometric partitioning schemes to subdivide the CC [4–7].
With the development of magnetic resonance (MR) technology, especially the application of diffusion tensor imaging (DTI) and fibre tractography techniques, the CC and other white matter fibres in the brain can now be better studied [8] thus making it possible to study the fine structure of the CC in vivo. Hofer and Frahm [7] utilised DTI-based tractography to identify 5 vertical segments of the CC. They specifically mapped the callosal radiata, which connect corresponding cortical regions in opposing hemispheres, with greater detail than previously described. These segments comprised fibres that projected into the parietal, temporal, and occipital cortices, as well as the prefrontal, premotor (including supplementary motor), primary motor, and primary sensory areas. Importantly, this subdivision of the CC explained cortex-related abnormalities better than classical anatomical descriptions [7].
CC abnormalities account for up to 2.3% of birth defects in the paediatric population [9]. The clinical manifestations of CC abnormalities vary widely, from completely asymptomatic to severe mental retardation and epilepsy [10]. Consequently, providing prenatal counselling for obstetricians presents a challenge. Different terminologies are used to describe CC abnormalities, with some authors focusing only on partial and complete agenesis while disregarding other conditions. Our centre has reported cases with various additional abnormalities, such as increased thinning, thickening, shortening, and localised bulging. Due to the intricate morphology of CC abnormalities, a comprehensive evaluation cannot rely solely on a single measurement of thickness or length. Therefore, a more detailed approach is necessary to accurately quantify this evaluation.
The issue of sex differences in the CC has also been a subject of much debate. A comprehensive MRI study reported that the second part of the body was thicker in females, while the CC and splenium lengths were greater in males compared to females [11]. Some studies of adults found that females had a larger splenium and higher fractional anisotropy (FA) values [12], whereas males had a larger genu and higher FA values [13]. As these previous studies were focused on adolescents and adults, data on foetal CC morphology is lacking. Therefore, further investigation is required to better understand the possible relationship to foetal sex differences.
The primary objective of this study was to establish comprehensive reference ranges for quantitative characteristics of the foetal CC using cortical connectivity information. Furthermore, the study aimed to investigate potential sex differences and assess the validity of the measurement technique for cases with CC dysplasia.
Material and methods
Between July 2019 and September 2021, we enrolled pregnant women between 19- and 40-weeks gestation undergoing routine sonographic examinations. The gestation was confirmed by the last menstruation period, the foetus’s biological parameters, or crown-rump length in the first trimester. All foetuses were followed up to neonates and infants, and the neonatal brain ultrasound revealed no obvious structural abnormality, such as holoprosencephaly, encephalocele, anencephaly, hydrocephalus, Dandy-Walker malformation, or microcephaly. Taking the image quality into account, maternal body mass index (BMI) > 30 kg/m2 was excluded. Unfortunately, environmental factors such as smoking and environmental pollutants were not considered. According to cross-sectional rules, only data of one measurement were included for each foetus. In cases where the same foetus was scanned multiple times during pregnancy, only data from one scan were retained and chosen at random from those available. This study was approved by the Ethics Committee, and pregnant women provided written informed consent.
All measurements were performed by 2 senior sonographers (T.T.S., L.W.). Voluson E8 and E10 ultrasound systems (GE Healthcare, Austria GmbH & Co OG) with a transabdominal (2–9 MHz) or transvaginal probe (4–-9 MHz) were used. All cases underwent a detailed anatomy scan, including foetal neurosonography. Standard plane and biometry measurements were obtained according to the International Society of Obstetrics and Gynaecology guidelines on foetal central nervous system evaluation [14]. Our study included only cases with high-quality images that clearly showed the full picture of the CC.
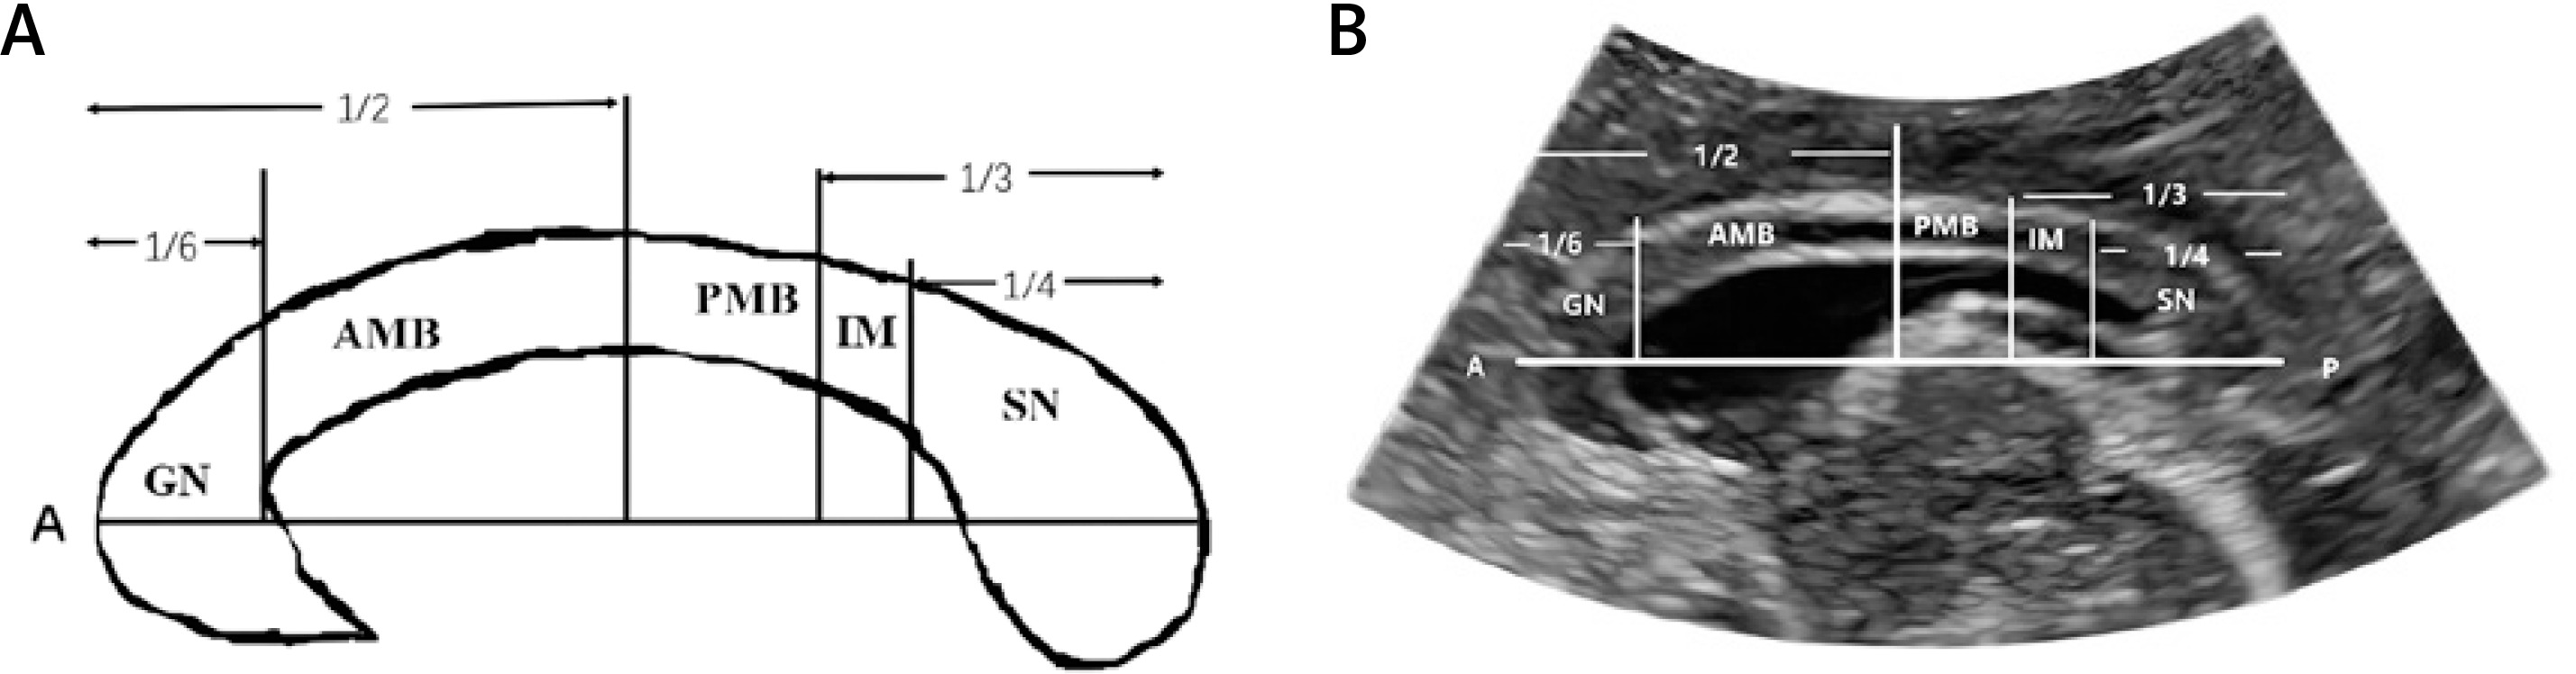
The CC thickness and length measurements were performed in the midsagittal plane. After the most anterior and most posterior points of the CC were determined, we made vertical lines at 1/6, 1/2, 2/3, and 3/4 according to Hofer and Frahm’s classification [7] system that distinguished 5 vertical partitions (Figure 1). The genu contains fibres projecting into the prefrontal region; the anterior midbody, fibres projecting into the premotor and supplementary motor cortical areas; the posterior midbody, fibres projecting into the primary motor cortex, and the isthmus, fibres projecting into the primary sensory areas. Finally, callosal parietal, temporal, and occipital fibres all cross the CC through the splenium. Although connecting to the orbitofrontal cortex, the foetal rostrum can be challenging to identify due to its small size and high variability, and it was included as part of the genu. The thickness of the CC was measured by evaluating the hypoechoic band between 2 echogenic lines at its maximum point within the specific subregion. The thickness was measured along a radial line perpendicular to the horizontal line within the specific subregion.
Figure 1
Subdivision of the corpus callosum based on Hofer and Frahm’s classification [7]. A schematic diagram of corpus callosum segmentation based on Hofer and Frahm’s method is shown in furthermore (A), B – illustrates the segmentation measurements on ultrasound images
GN – prefrontal, AMB – premotor and supplementary motor, PMB – motor, IM – sensory, SN – parietal, temporal, and occipital. A – anterior, P – posterior, GN – genu, AMB – anterior midbody, PMB – posterior midbody, IM – isthmus, SN – splenium.
To comprehensively evaluate abnormalities in the CC, we applied our segmentation method to cases of dysplasia from our centre. For their scans, we divided the residual length of the CC by the normal value and calculated the approximate ratio to determine the subdivision.
Statistical analysis
The statistical analyses were performed using Medcalc Version 20.0.27. We randomly selected 53 foetuses to evaluate the reliability analysis for the CC thickness and length. Intraobserver variability was assessed by a sonographer (T.T.S.) performing 2 measurements without seeing the results. Interobserver variability was assessed by comparing the measurements of 2 sonographers (T.T.S. and L.W.). The intraclass correlation coefficient (ICC) and Bland-Altman plots were assessed. The agreement was considered slight when the ICC ≤ 0.2, fair when 0.2 < ICC ≤ 0.4, moderate when 0.4 < ICC ≤ 0.6, substantial when 0.6 < ICC ≤ 0.8, and excellent with the ICC > 0.8. Regression analysis was used to determine the significance of the association between the biological measurements and gestational age (GA). To examine the influence of sex factors, we applied the regression model. Since there was a strong correlation between GA and CC measurements, GA needed to be controlled in the analysis. The regression model applied was: y = β0 + β1Sex + β2GA + β3Sex × GA + ui. Because the interpretation of this model depended on the GA, we used the mean GA to fit the empirical results. A significance level of p < 0.05 was used for the two-tailed comparisons to determine statistical significance.
Results
We recruited 1260 participants for this cross-sectional study at our centre for foetal sonographic examination. The median GA was 29.6 weeks (range: 19.1–40.8 weeks). 204 foetuses were excluded from the study due to unavailability of CC images, along with an additional 66 extra scans. Maternal factors resulted in the exclusion of 107 cases, including 22 cases with uncertain gestational weeks, 59 women with a BMI greater than 30 kg/m2, and 26 cases of multiple pregnancies. Furthermore, 31 cases were excluded due to foetal abnormalities, including 8 cases with foetal chromosomal anomalies, 18 cases with major anatomical malformations, and 5 cases with detected intrauterine growth retardation. In the end, the study analysed a final total of 852 foetal CC measurements, consisting of 403 males and 449 females (Figure 2).
Figure 2
CONSORT Diagram. In this prospective study, a total of 1260 participants were initially recruited. Following a series of screening procedures, 852 normal foetuses were identified and included in the final analysis
Intra- and interobserver agreement was performed, with a correct 95% limit of agreement (LoA) for the mean bias estimates (Supplementary Table SI). The intraclass correlation coefficients ranged from 0.86 to 0.98 and 0.84 to 0.97, respectively.
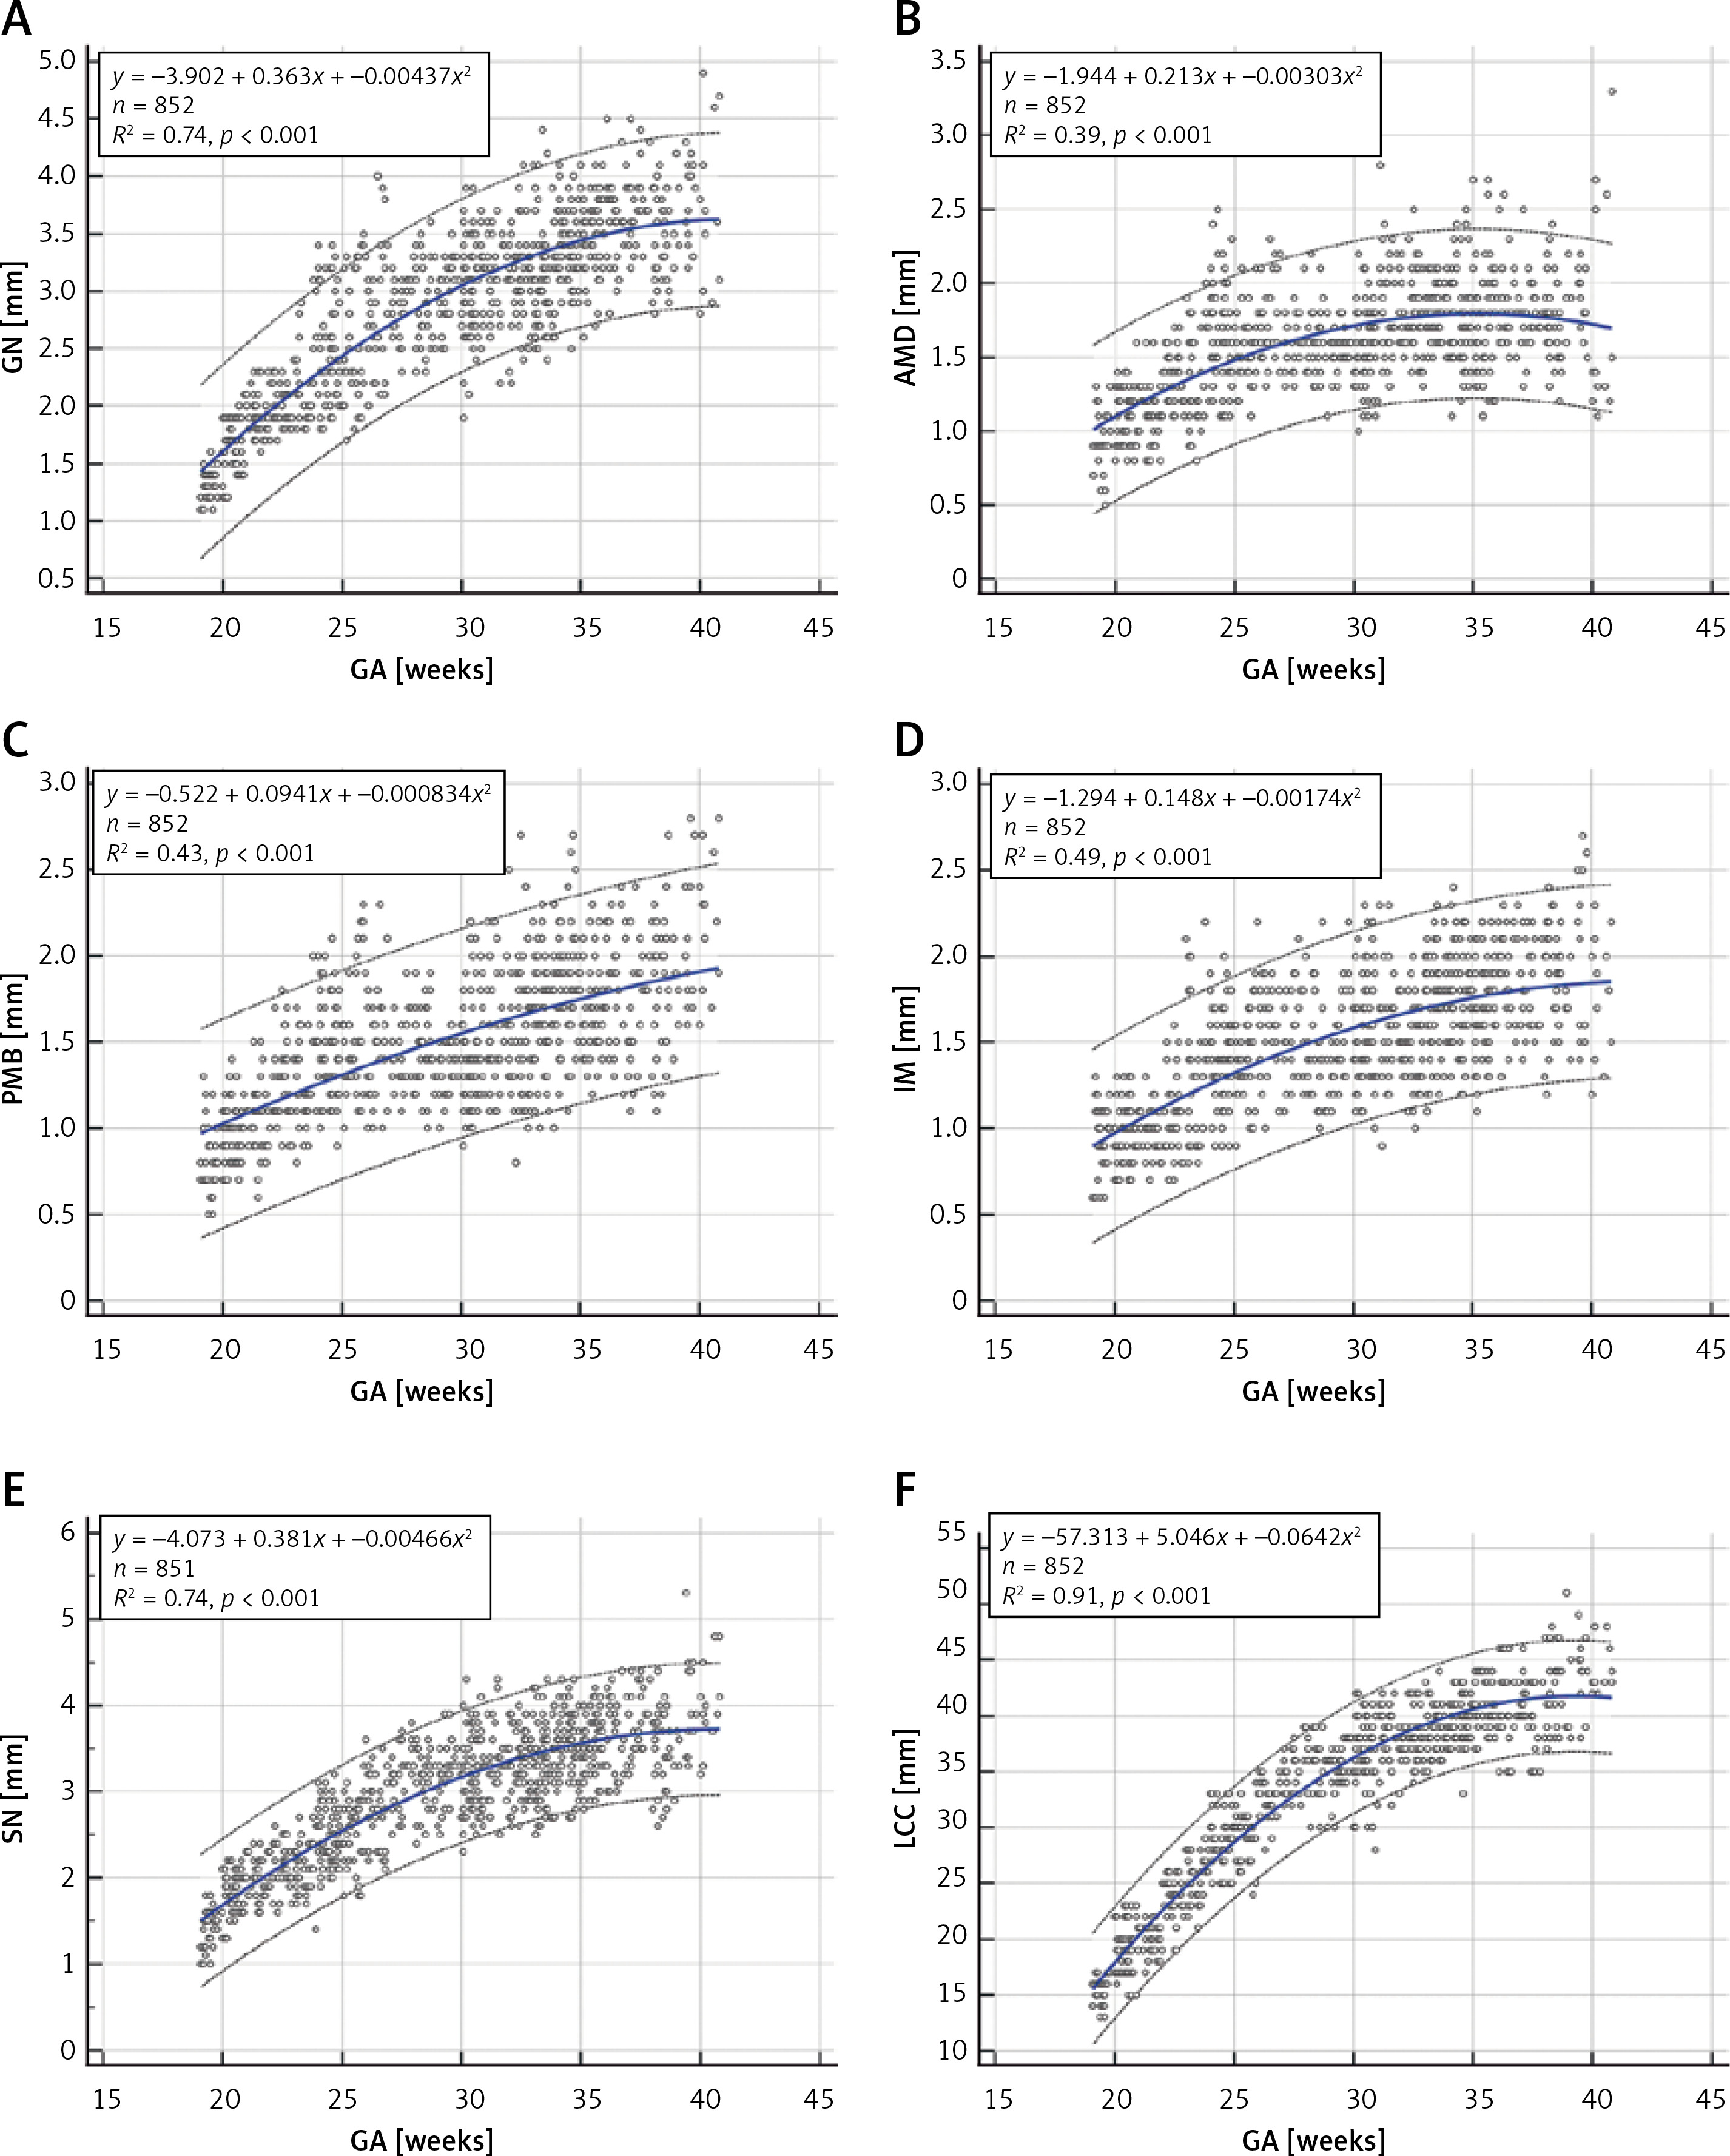
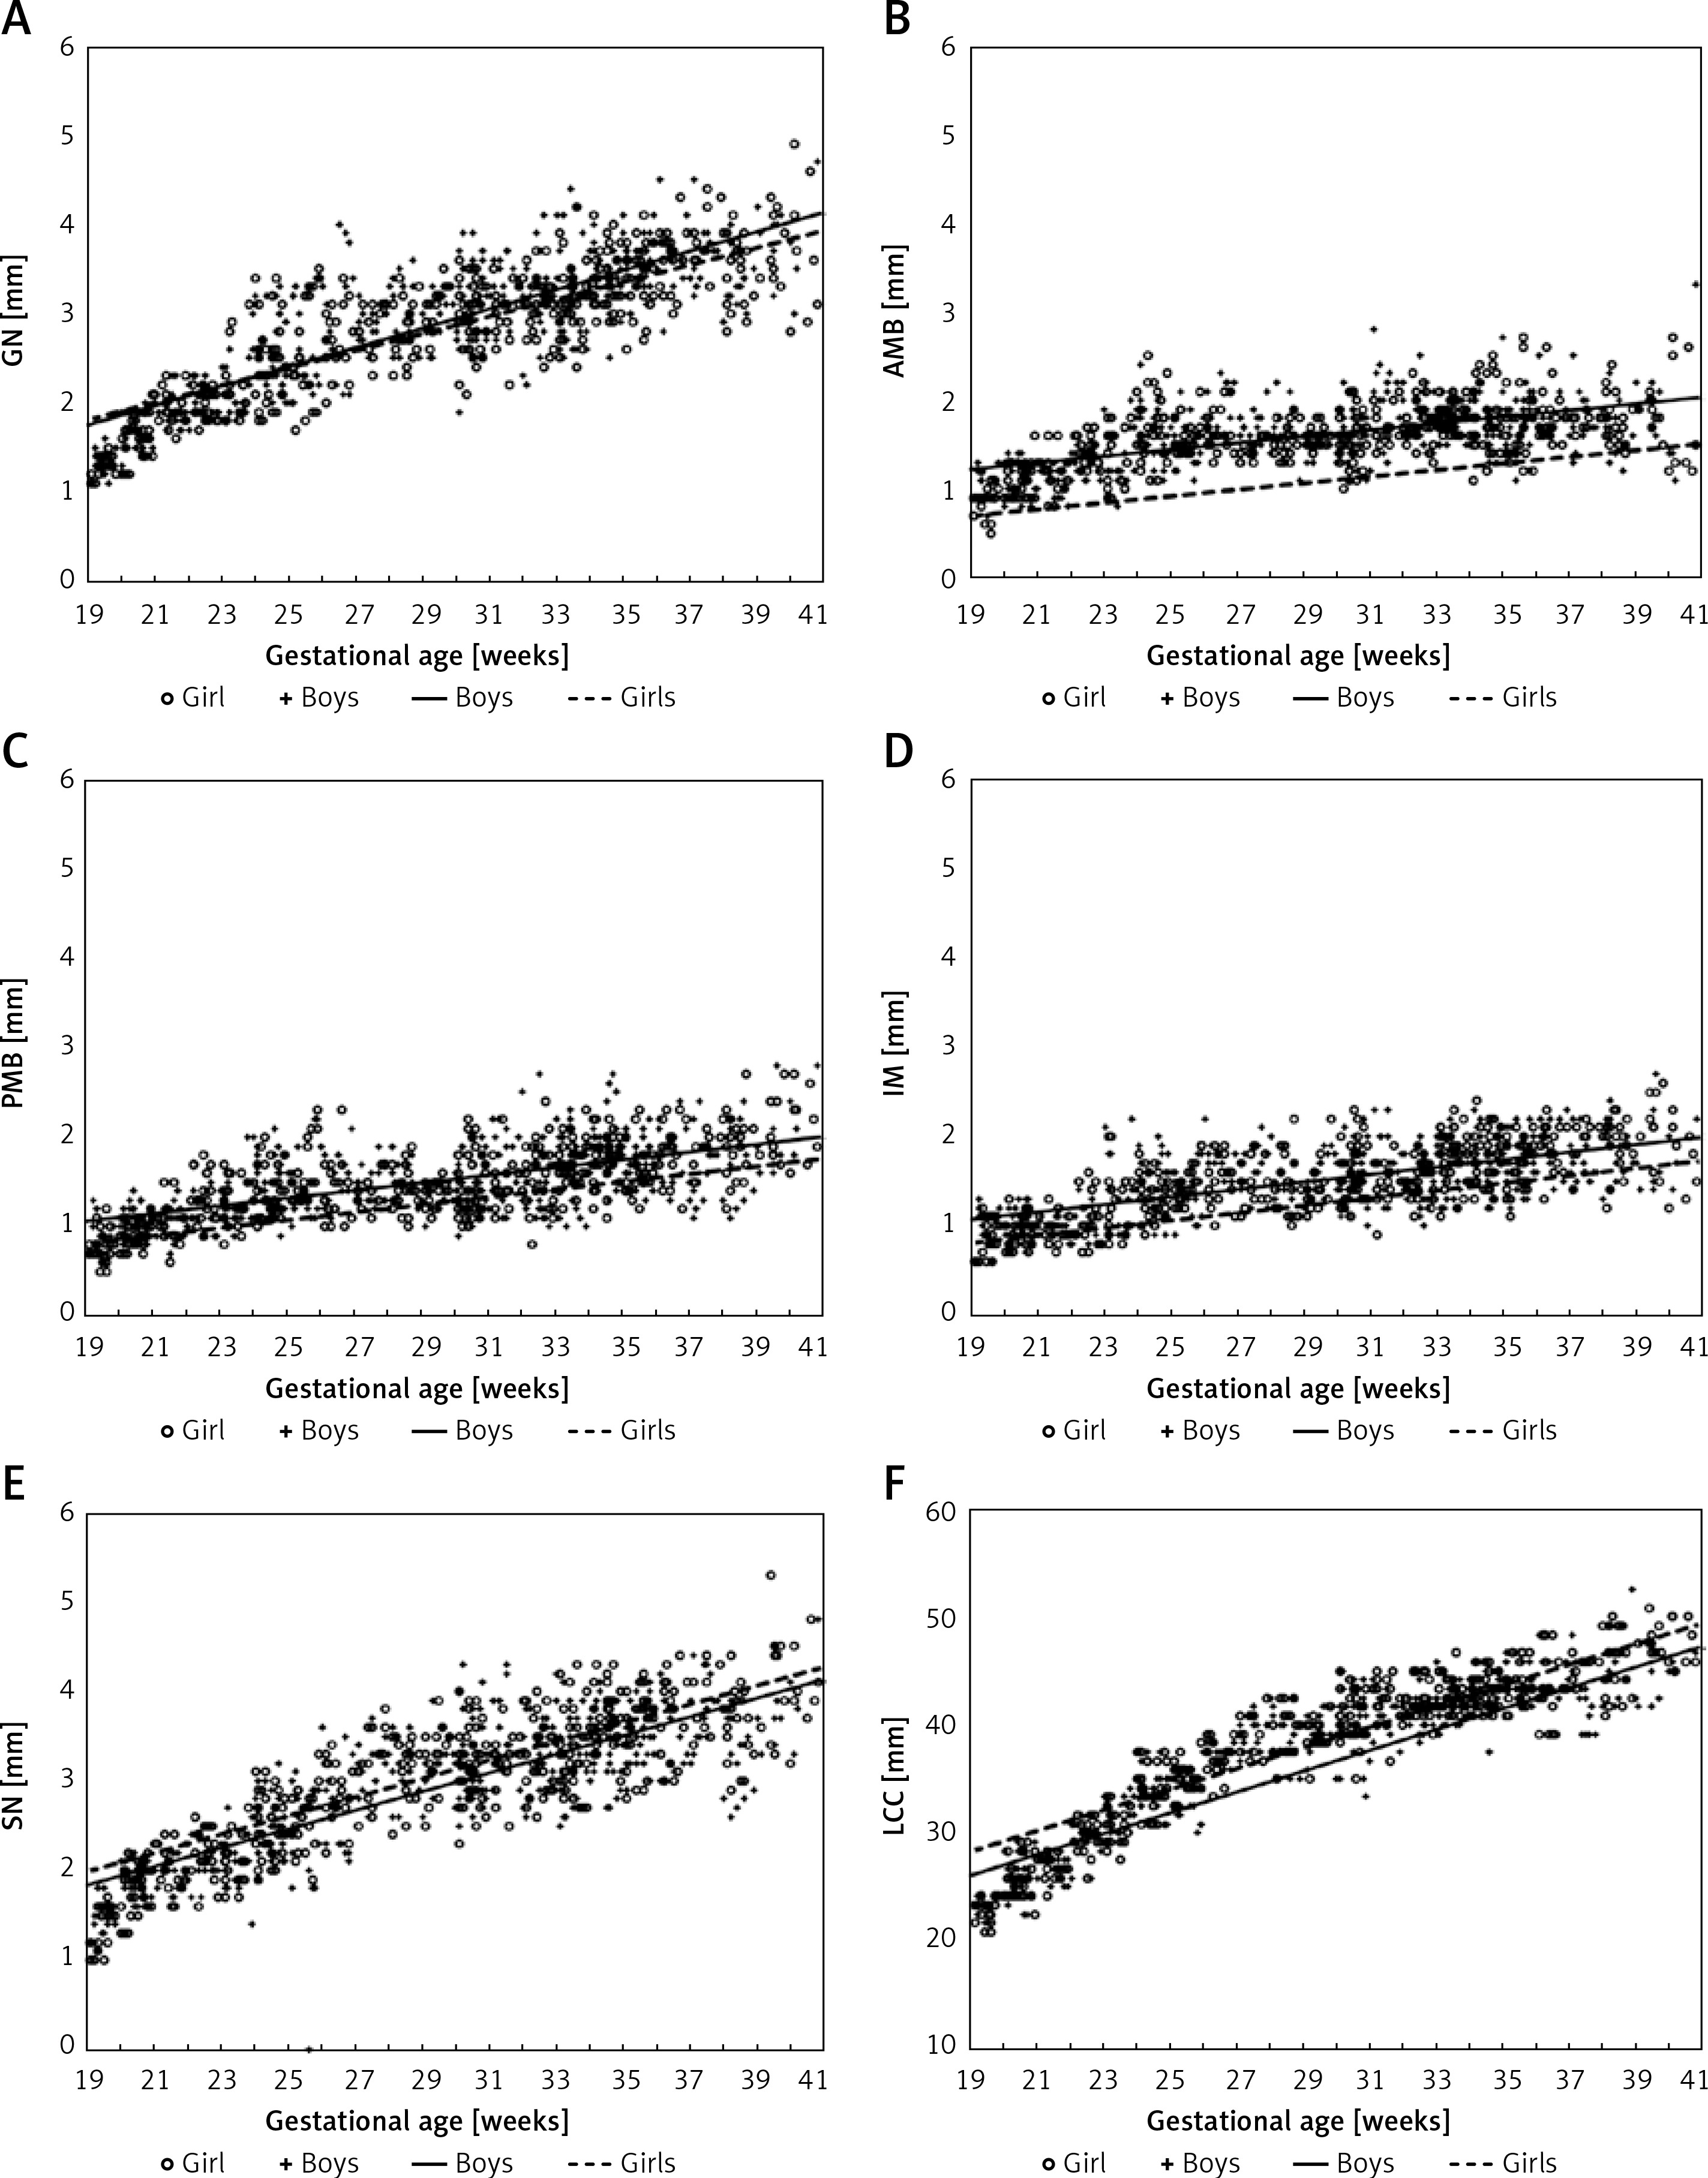
Table I lists the reference ranges for CC thickness and length to gestational age. The biometric measurements of foetal CC show a curvilinear increase with the increase of GA (Figure 3). The genu, splenium, and length of the CC all show a relatively good fit with GA, whereas the anterior midbody, posterior midbody, and isthmus indicate a poorer fit.
Table I
Foetal CC thickness and length [mm] according to gestational age
Figure 3
Individual measurement scatter plots of 6 different parts of the corpus callosum in relation to gestational age (19–40 weeks): (A) genu, (B) anterior midbody, (C) posterior midbody, (D) isthmus, (E) splenium, and (F) length of the corpus callosum. Each scatter plot includes a mean regression curve (solid blue line) and a 95% prediction interval (dashed line). The upper left corner of each graph displays the regression equation and the R2 value
GN – genu, AMB – anterior midbody, PMB – posterior midbody, IM – isthmus, SN – splenium, LCC – length of the CC.
The most rapid increase in CC thickness occurred between 19 and 26 weeks of gestation, while CC length followed a more constant rate of growth (Supplementary Figure S1).
There was a statistically significant sex effect for the CC (Table II, Figure 4). According to Table II, at the average gestation age, the genu, anterior midbody, posterior midbody, and isthmus of male foetuses were 0.06280 mm, 0.04435 mm, 0.01731 mm, and 0.01556 mm, respectively, thicker than those of female foetuses, whereas the splenium of the female foetus was 0.06583 mm thicker than the male foetus.
Table II
Regression results between ultrasound measurements of different segments on the foetal corpus callosum and foetal sex
| Parameter | GN | AMB | PMB | IM | SN | LCC |
|---|---|---|---|---|---|---|
| Sex | 0.3126*** | 0.5195*** | 0.2390*** | 0.2660*** | 0.1453 | 2.6499** |
| Sex × GA | 0.0128*** | 0.0162*** | 0.0076*** | 0.0085*** | 0.0027 | 0.0704* |
| Difference at mean | 0.0628 | 0.0444 | 0.0173 | 0.0156 | 0.0658 | 0.5843 |
| N | 852 | 852 | 852 | 852 | 852 | 852 |
| F | 8.11*** | 21.42*** | 5.44*** | 6.57*** | 3.76** | 4.25*** |
| R2 | 0.9806 | 0.9630 | 0.9603 | 0.9652 | 0.9813 | 0.9907 |
Pathological cases
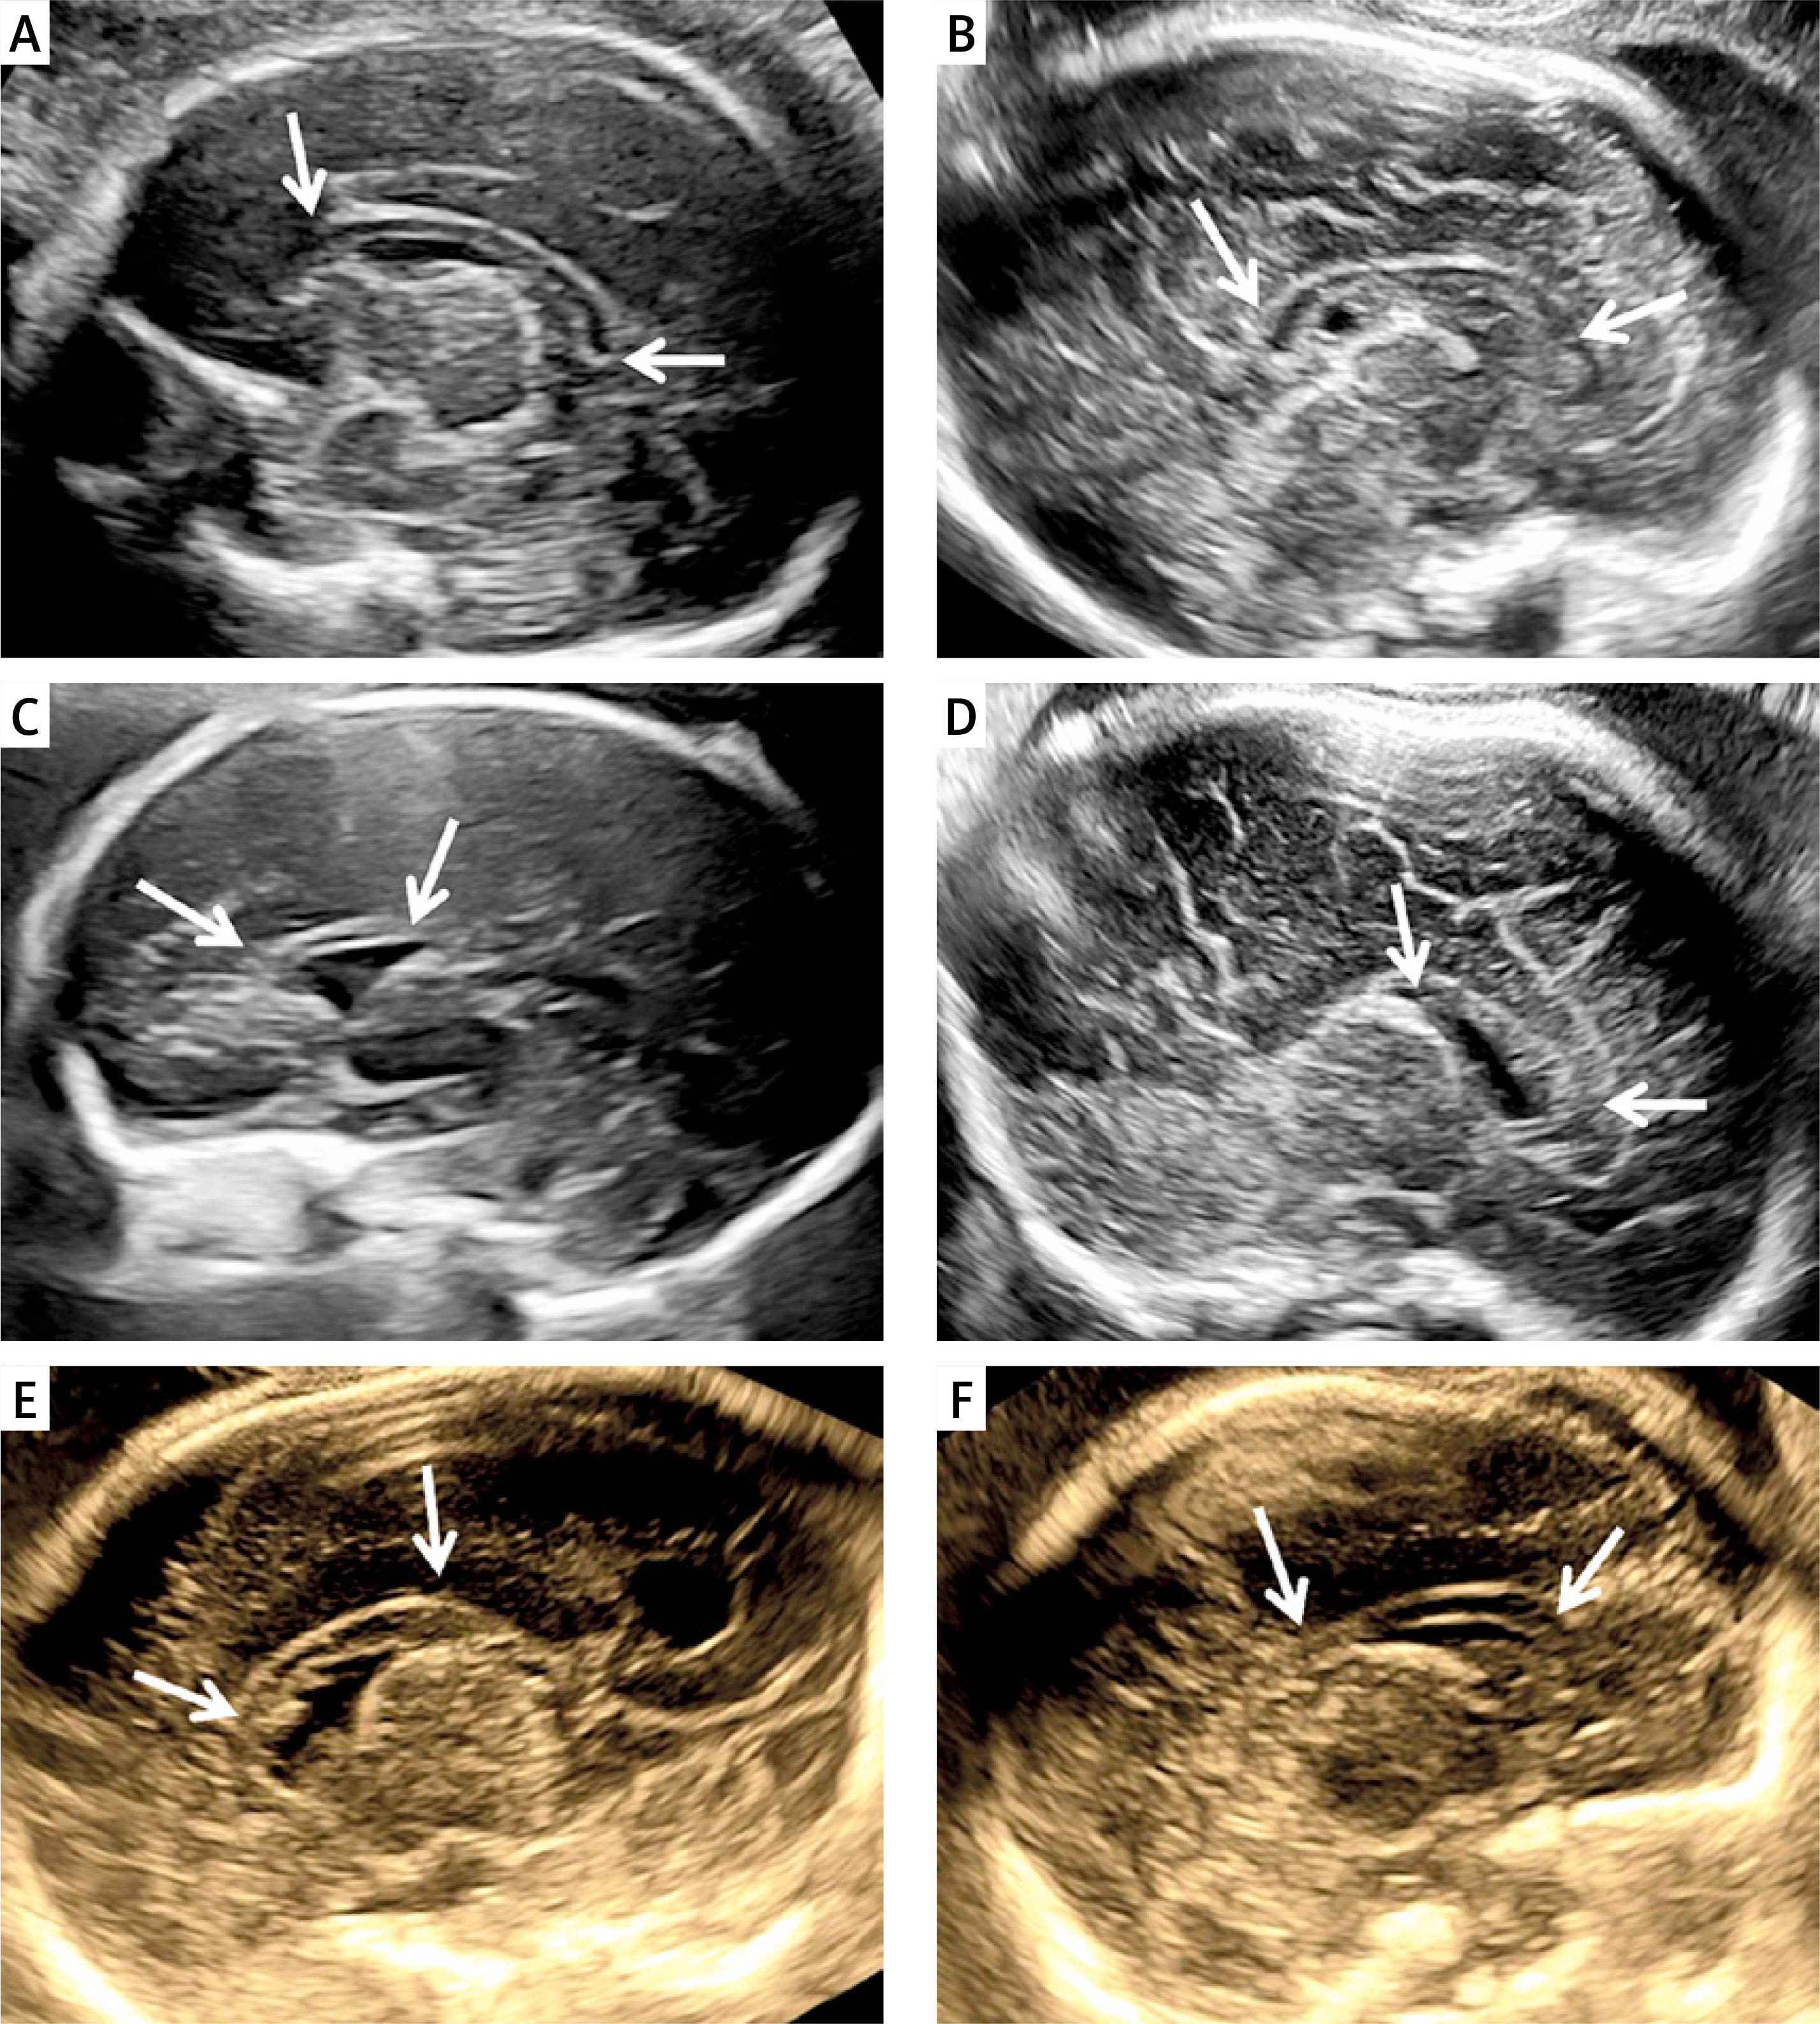
A comprehensive search conducted on the database of our centre from 2017 to 2022 revealed 23 examples of abnormal CC development. Of these, 18 cases with complete absence of the CC were excluded. The remaining 5 cases had partial agenesis of the CC. These cases were quite heterogenous. In Case 1, the CC was with intact morphology but was thin according to our reference ranges, with the thickness of each region being more than 2 standard deviations (SD) below normal. In Case 2, the CC was both short and thin, and the posterior midbody, isthmus, and splenium were not visible. In Case 3, the CC was short and thick, and the isthmus and splenium were absent. In Case 4, the CC was morphologically intact but shortened and thickened with all subdivisions being more than 2 SD above the normal value, while the length was 2SD below. In Case 5, the CC was short but normal in thickness, and the isthmus and splenium were not visible. The thickness and length of the CC are summarised in Table III, and Figure 5 shows ultrasound images. All cases were aborted, and postpartum MR confirmed the prenatal diagnosis.
Table III
Summary of ultrasound findings, gestational age in cases with partial agenesis of the corpus callosum


Figure 5
Cases of normal and abnormal CC development. A – Normal; B – the CC is morphologically intact but thinned; C – the CC is shorter and thinner; D – the length of the CC is shorter, but the thickness is thicker; E – the CC is structurally intact, but shortened and thickened; F – although the length of the CC is shorter, the residual part maintains a normal thickness
Discussion
We aimed to provide a comprehensive set of reference range values for the thickness and length of the CC based on Hofer and Frahm’s divisions. Instead of using their numerical system, however, we applied a structuring naming system replace I-V with the “genu”, “anterior midbody”, “posterior midbody”, “isthmus”, and “splenium”. Our study revealed specific patterns of thickness and length growth in the CC. The biometric measurements of foetal CC showed a curvilinear increase with the increase of GA. We also examined for sex differences and assessed the validity of the measurement technique for cases with CC dysplasia.
Inconsistencies were observed in the literature regarding the growth pattern with GA. Some studies demonstrated a linear growth pattern [15–21], whereas others indicated a nonlinear growth pattern [22]. Our study revealed a positive correlation between the length of the CC and GA. Furthermore, we found that the thickness of the genu and splenium exhibited a significantly positive correlation with GA when compared to the anterior midbody, posterior midbody, and isthmus. Interestingly, we observed distinct growth patterns in terms of thickness. Specifically, there was a rapid growth in CC thickness before the 26th week of pregnancy, followed by a slower rate of growth thereafter. We speculated that later in the second trimester after the CC morphology had almost formed, the CC grew mainly along the longitudinal axis, with a slight increase in thickness.
We found that the thickness and length increased approximately 2- to 2.8-fold, respectively, over the course of gestation. However, Malinger and Zakut [19] reported a 2-fold increase in the thickness of the CC, while Achiron et al. [16] observed a 3-fold increase in thickness and width. These variations could be attributed to the different gestational age ranges considered in each study.
We observed a statistically significant sex effect in the CC, which may set the stage for later-in-life sex differences in this area as well as in related abilities. Some studies have indicated that female foetuses tend to exhibit a thicker CC compared to males, while others failed to show this difference [23–26]. Achiron [23] believed that prenatal sex hormones played an important role in the mechanisms determining callosal anatomy. We found that at the average GA, the genu, anterior midbody, posterior midbody, and isthmus of male foetuses were thicker than those of female foetuses, and compared with the male foetus, the female foetus’s splenium was thicker. Although identifying differences of 0.01 mm magnitude in ultrasound images poses significant challenges for ultrasound physicians, we maintain that there are small yet real sex differences in the size of the CC.
To establish a reference range for CC biometric measurement, several researchers have relied on MR or ultrasound [15–18, 22, 27–30]. However, there are certain limitations in reporting the biological reference range. These limitations included small sample sizes per gestational week [22, 23] or a limited gestational span [17, 18, 29, 30], which can lead to varying results. Tsur et al. [28] used the CC length/estimated foetal weight (EFW) ratio to build a personalised chart of foetal CC length. The use of the ratio to evaluate the CC may not be reliable in certain conditions such as macrosomia or intrauterine growth restriction because the ratio may appear normal despite the length of the CC being outside the normal range.
In measuring the biological parameters of the CC, researchers have typically focused on length, perimeter, area, and width. However, limited attention has been paid to the measurement of thickness, and the methods used for such measurements vary [15, 16, 31]. Chang et al. [31] and Achiron et al. [16] measured a single thickness value in the midcoronal plane, while Pashaj et al. [15] measured the 4 parts (rostrum, genu, body, and splenium) in the midsagittal plane. In our study, we utilised Hofer and Frahm’s segmentation method, which involves dividing CC fibre bundles into 5 regions based on their projection relationship with the cerebral cortex. We then measured the thickness of each subregion. This approach is advantageous for providing a more comprehensive evaluation of the foetal CC with reference ranges for each segment.
We conducted an analysis on foetuses with CC dysplasia and observed that the morphology of the residual CC varied among these cases. On this basis, we concluded that a thorough assessment of the residual CC is crucial due to the regional differences in fibre composition and function within the CC. By understanding the distribution of the cerebral cortex that corresponds to the missing part of the CC, we can provide better prenatal prognosis consultation for foetuses with CC dysplasia.
Due to the intricate anatomical structure of the foetal brain, a meticulous assessment of the subregions within the CC is crucial for precise diagnosis of hypogenesis, dysgenesis, and thick CC. However, there are several limitations. Hofer and Frahm’s method used postnatal brains, our research was based on the assumption that the projection fibres of the CC in the foetal period are basically consistent with the projection range after birth. The sex differences we observed while statistically significant and potentially relevant at a later age, are not clinically meaningful for ultrasonographers as they are so small. Moreover, due to the challenges in obtaining the coronal plane, our study focused solely on measuring the thickness of the CC on the median sagittal plane, without considering parameters such as width, volume, and area. We did not examine for smoking and environmental factors, which could be explored in future studies to uncover potential associations.
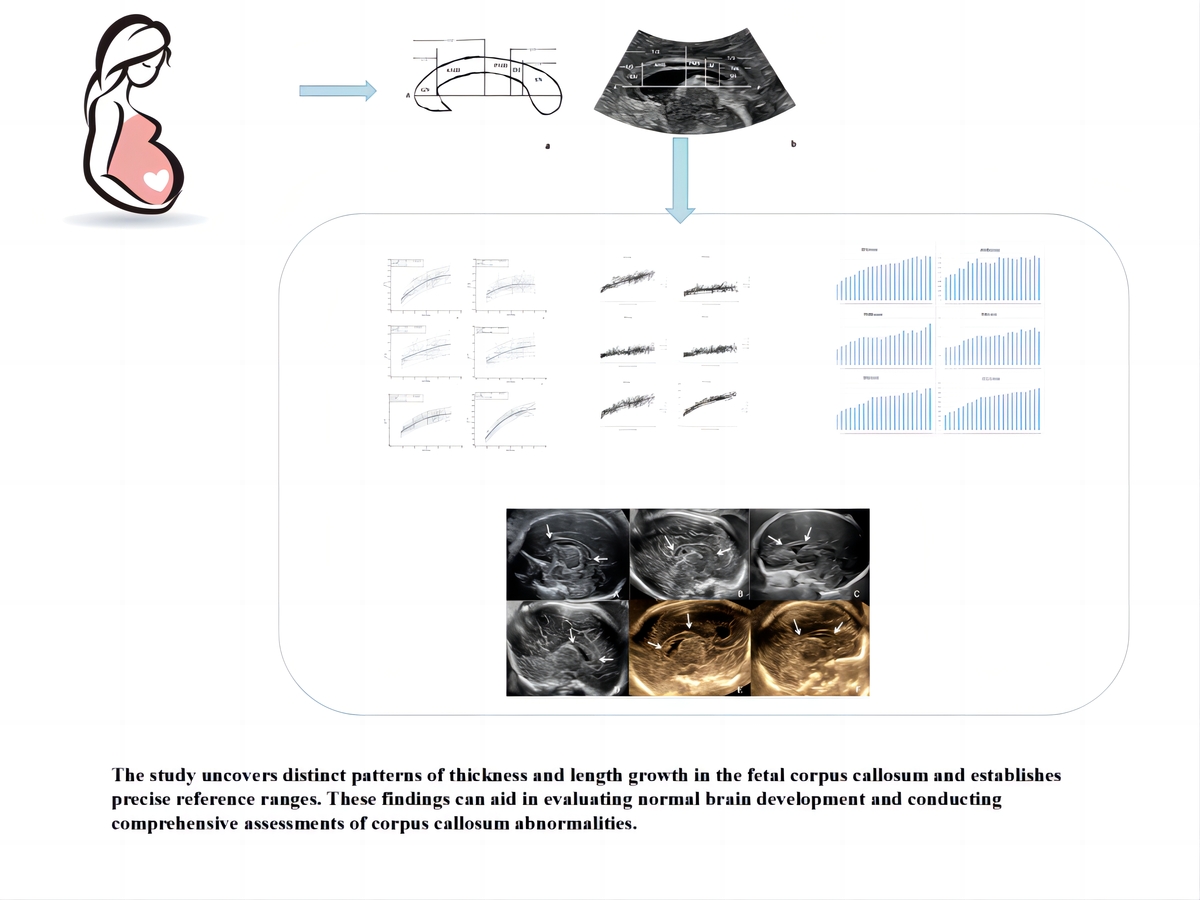
In conclusion, this study provides novel critical findings on the development of CC in foetal life. In this study, we have demonstrated specific patterns for thickness and length of the CC during foetal development. Additionally, we established reference ranges for foetal CC subdivision thickness and length and used these reference ranges to evaluate the severity of abnormal development in cases with partial agenesis of the CC during gestation.