Introduction
Colorectal cancer (CRC) is the third most common cancer and the second leading cause of cancer death worldwide. About 1 in 10 cancer patients aged < 50 years old is diagnosed with CRC [1, 2]. The 5-year survival rate is < 15%, which causes a heavy burden on human health [3]. CRC prevention strategies include the following four aspects: endoscopy, population screening, chemoprophylaxis, and lifestyle changes [4]. Unfortunately, patient compliance, popularity, and high-cost limit population screening [5]. At the same time, missed CRCs are frequent in those who underwent endoscopy [6], and population screening is not enough to fully filtrate patients with CRC [7]. Therefore, exploring chemoprevention strategies to reduce the incidence and mortality of CRC has attracted the attention of researchers and has become a crucial research hotspot.
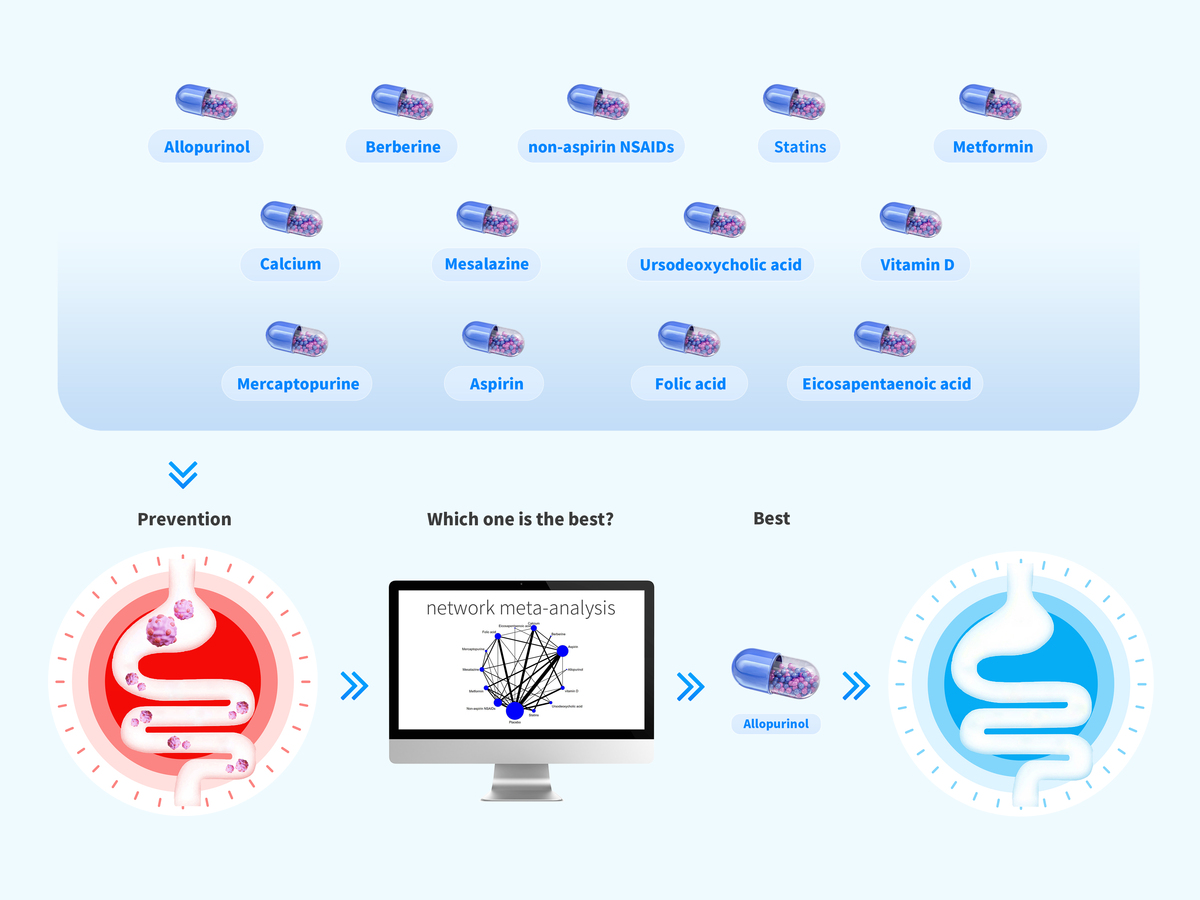
Some meta-analyses show that non-aspirin non-steroidal anti-inflammatory drugs (NSAIDs) [8], aspirin [9], metformin [10], calcium [11], berberine [12], mesalazine [13], statins [14], ursodeoxycholic acid [15], folic acid [16], and other drugs can effectively reduce the incidence of CRC. Yet, clinical studies have proved the uneven efficacy of these drugs. Still, some studies only compared the chemoprophylaxis of one drug with a controlled drug in patients with CRC, and there is still a lack of studies that compared multiple drugs. Therefore, finding a more suitable drug is of essential importance, especially when doctors consider using chemoprophylaxis strategies to prevent CRC.
Traditional meta-analyses can judge the effect of different intervention measures by direct head-to-head comparison; however, the research on direct head-to-head comparison is limited. When there is a lack of direct comparison data, indirect comparison of different intervention measures was used [17]. Network meta-analysis can be used to make direct and indirect comparisons according to logical reasoning [18]. At the same time, network meta-analysis can rank different interventions, selecting the best and worst interventions [19]. In this study, we used Stata16.0 software to compare the preventive effect of 13 drugs (allopurinol, aspirin, berberine, calcium, eicosapentaenoic acid, folic acid, mercaptopurine, mesalazine, metformin, non-aspirin NSAIDs, statins, ursodeoxycholic acid, vitamin D) on CRC.
Material and methods
Search strategy
The following five databases were searched: PubMed, Web of Science, Embase, Cochrane Library, and China National Knowledge Infrastructure. The search strategy was built using the PICOS tool: P (Population): patients with previous CRC; I (Intervention): 13 drugs; C (Comparison): the control group was given a placebo or one or more drugs (only including 13 drugs mentioned above); O (Outcomes): the number of patients with recurrent CRC; S (Study type): RCTs or cohort studies. Connect PICOS through Boolean logic operators. The study was published between 1 January 2000, and 1 July 2022, with no language restrictions. Table I shows the detailed search strategy (take PubMed as an example).
Table I
Search strategy on PubMed
Study selection
Inclusion criteria were as follows: (1) patients with previous CRC; (2) clinical RCTs or cohort studies; (3) experimental groups were treated with one of the following drugs: allopurinol, aspirin, berberine, calcium, eicosapentaenoic acid, folic acid, mercaptopurine, mesalazine, metformin, non-aspirin NSAIDs, statins, ursodeoxycholic acid, vitamin D; (4) controls were treated with a placebo or one or more drugs (only including 13 drugs mentioned above); (5) methods for CRC detection were colonoscopy, biopsy or tumor markers in colorectal mucosa; (6) the results were the number of patients with recurrent CRC in the experimental and control groups.
Exclusion criteria were as follows: (1) duplicate literature/studies from different databases; (2) studies with incomplete data; (3) patients with other tumors; (4) cellular or animal studies; (5) reviews, conference abstracts, case-control studies, case reports, and letters.
We used the document management software Endnote to screen the articles. The two researchers made a preliminary screening by reading the titles and abstracts of the articles. Then, the preliminarily selected articles were carefully read by two researchers. In case of disagreements, a third researcher was invited.
Data extraction
A standardized, six-item, pre-designed data extraction form was used to record study data. Data included the following: (1) the name of the first author; (2) year of publication; (3) country; (4) age; (5) drug and sample size of the experimental and control groups; and (6) methods for CRC detection.
Quality assessment
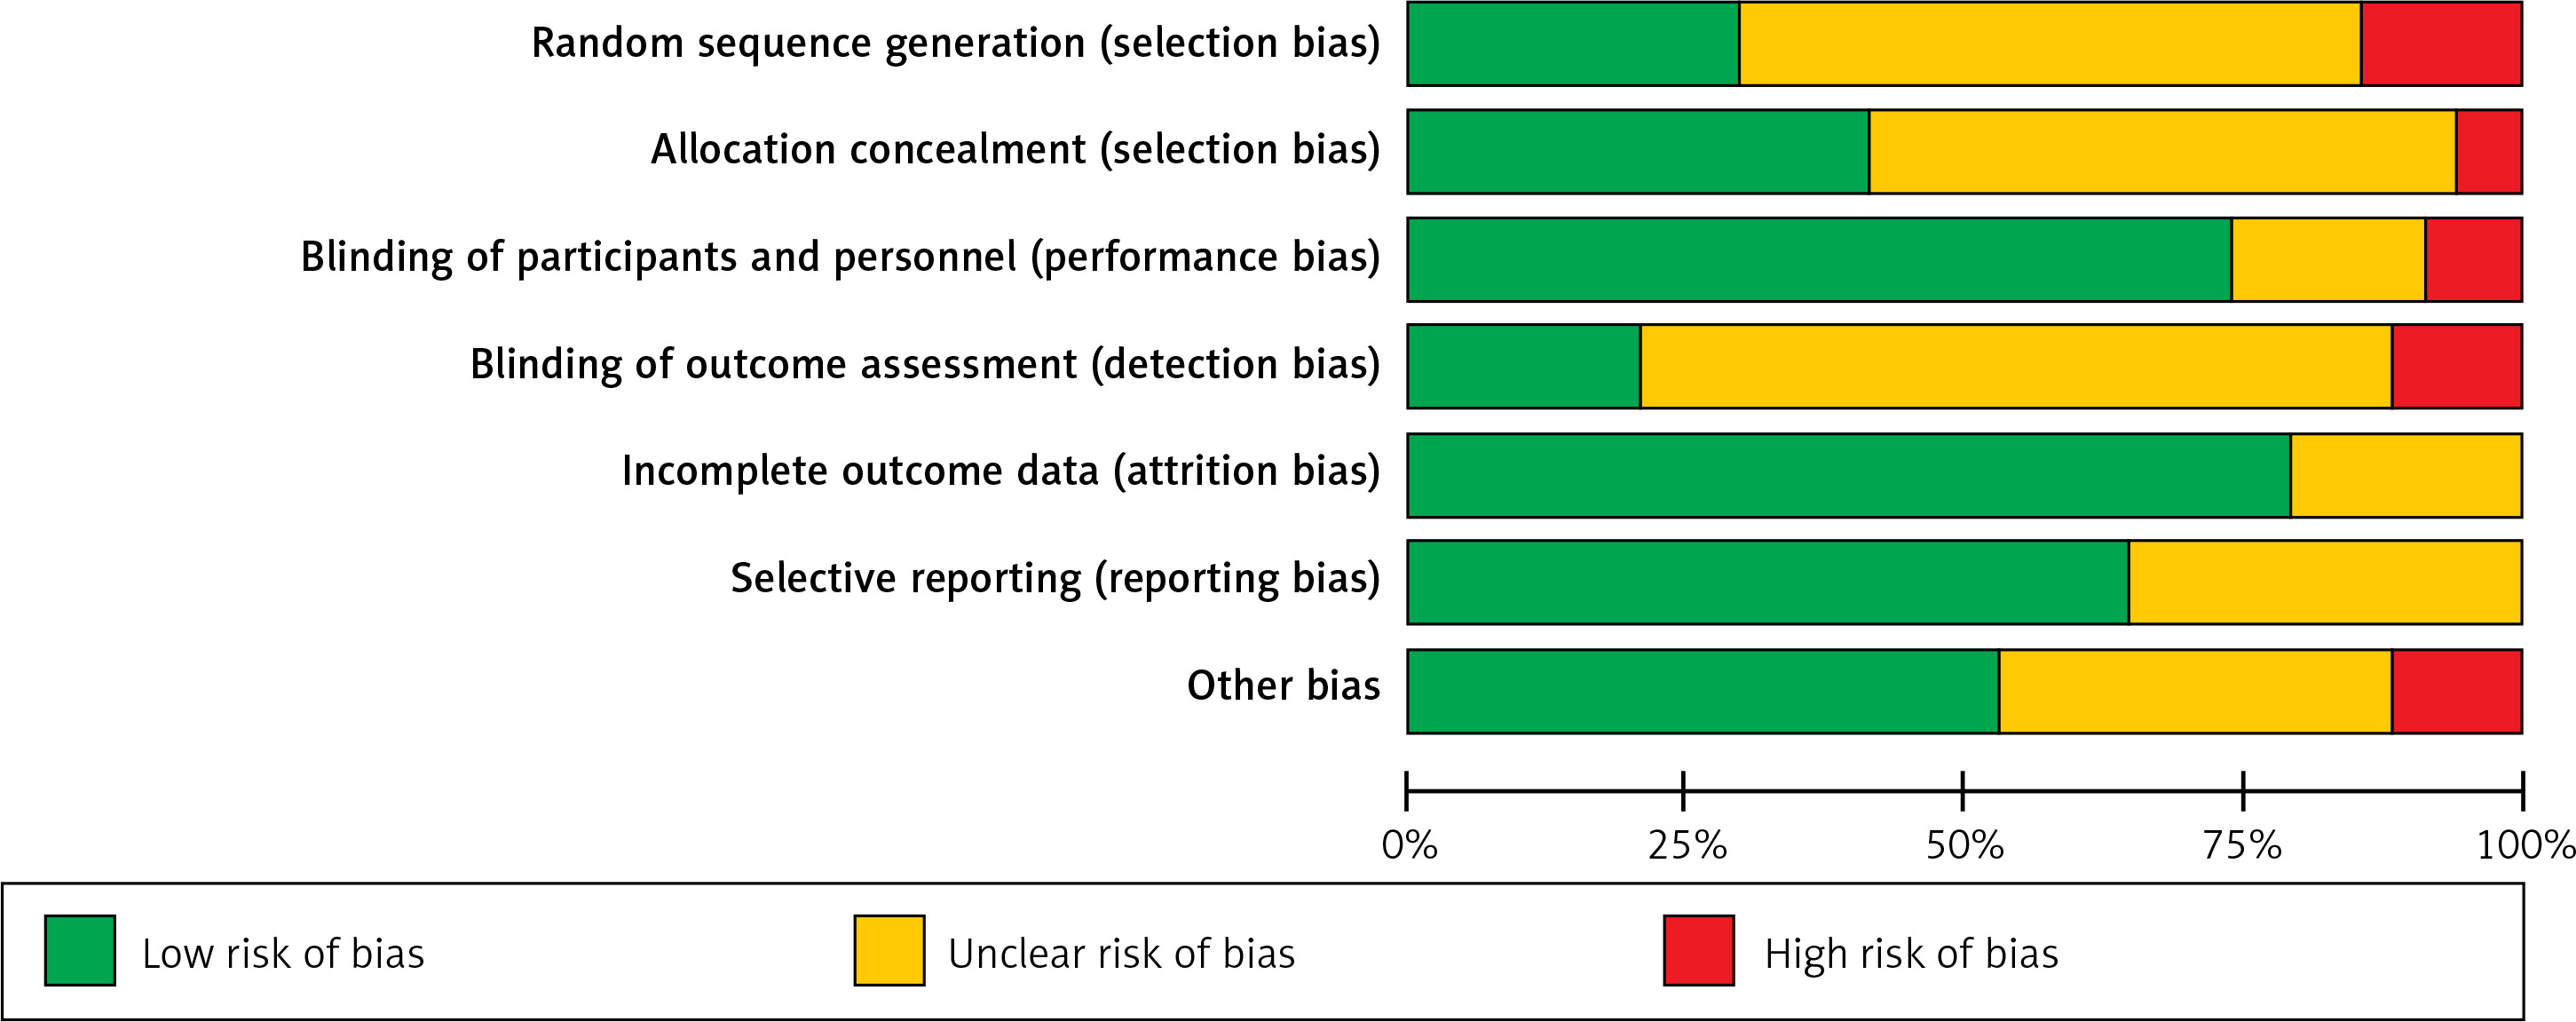
The included RCTs were evaluated by the risk of bias tool recommended by the Cochrane Handbook for systematic reviews (version 5.1) [20]. The assessment included the following seven items: (1) random sequence generation; (2) allocation concealment; (3) blinding of participants and personnel; (4) blinding of outcome assessment; (5) incomplete outcome data; (6) selective reporting; and (7) other bias. Each item includes three options: low risk, unclear risk, and high risk.
The Newcastle-Ottawa Scale (NOS) quality evaluation tool was used to evaluate the quality of cohort studies [21]. The NOS quality evaluation tool includes three dimensions: Selection, Comparability, and Exposure, with a total score of 9. Selection includes 4 items and 1 point for each item: (1) adequate definition of the case; (2) representativeness of the cases; (3) selection of controls; and (4) definition of controls. Comparability contains a 2-point item: comparability of cases and controls based on the design or analysis. Finally, exposure includes 3 items and 1 point for each item: (1) ascertainment of exposure, (2) same method of ascertainment for cases and controls, (3) non-response rate. Articles with a total score of ≥ 6 were considered good quality.
Data analysis
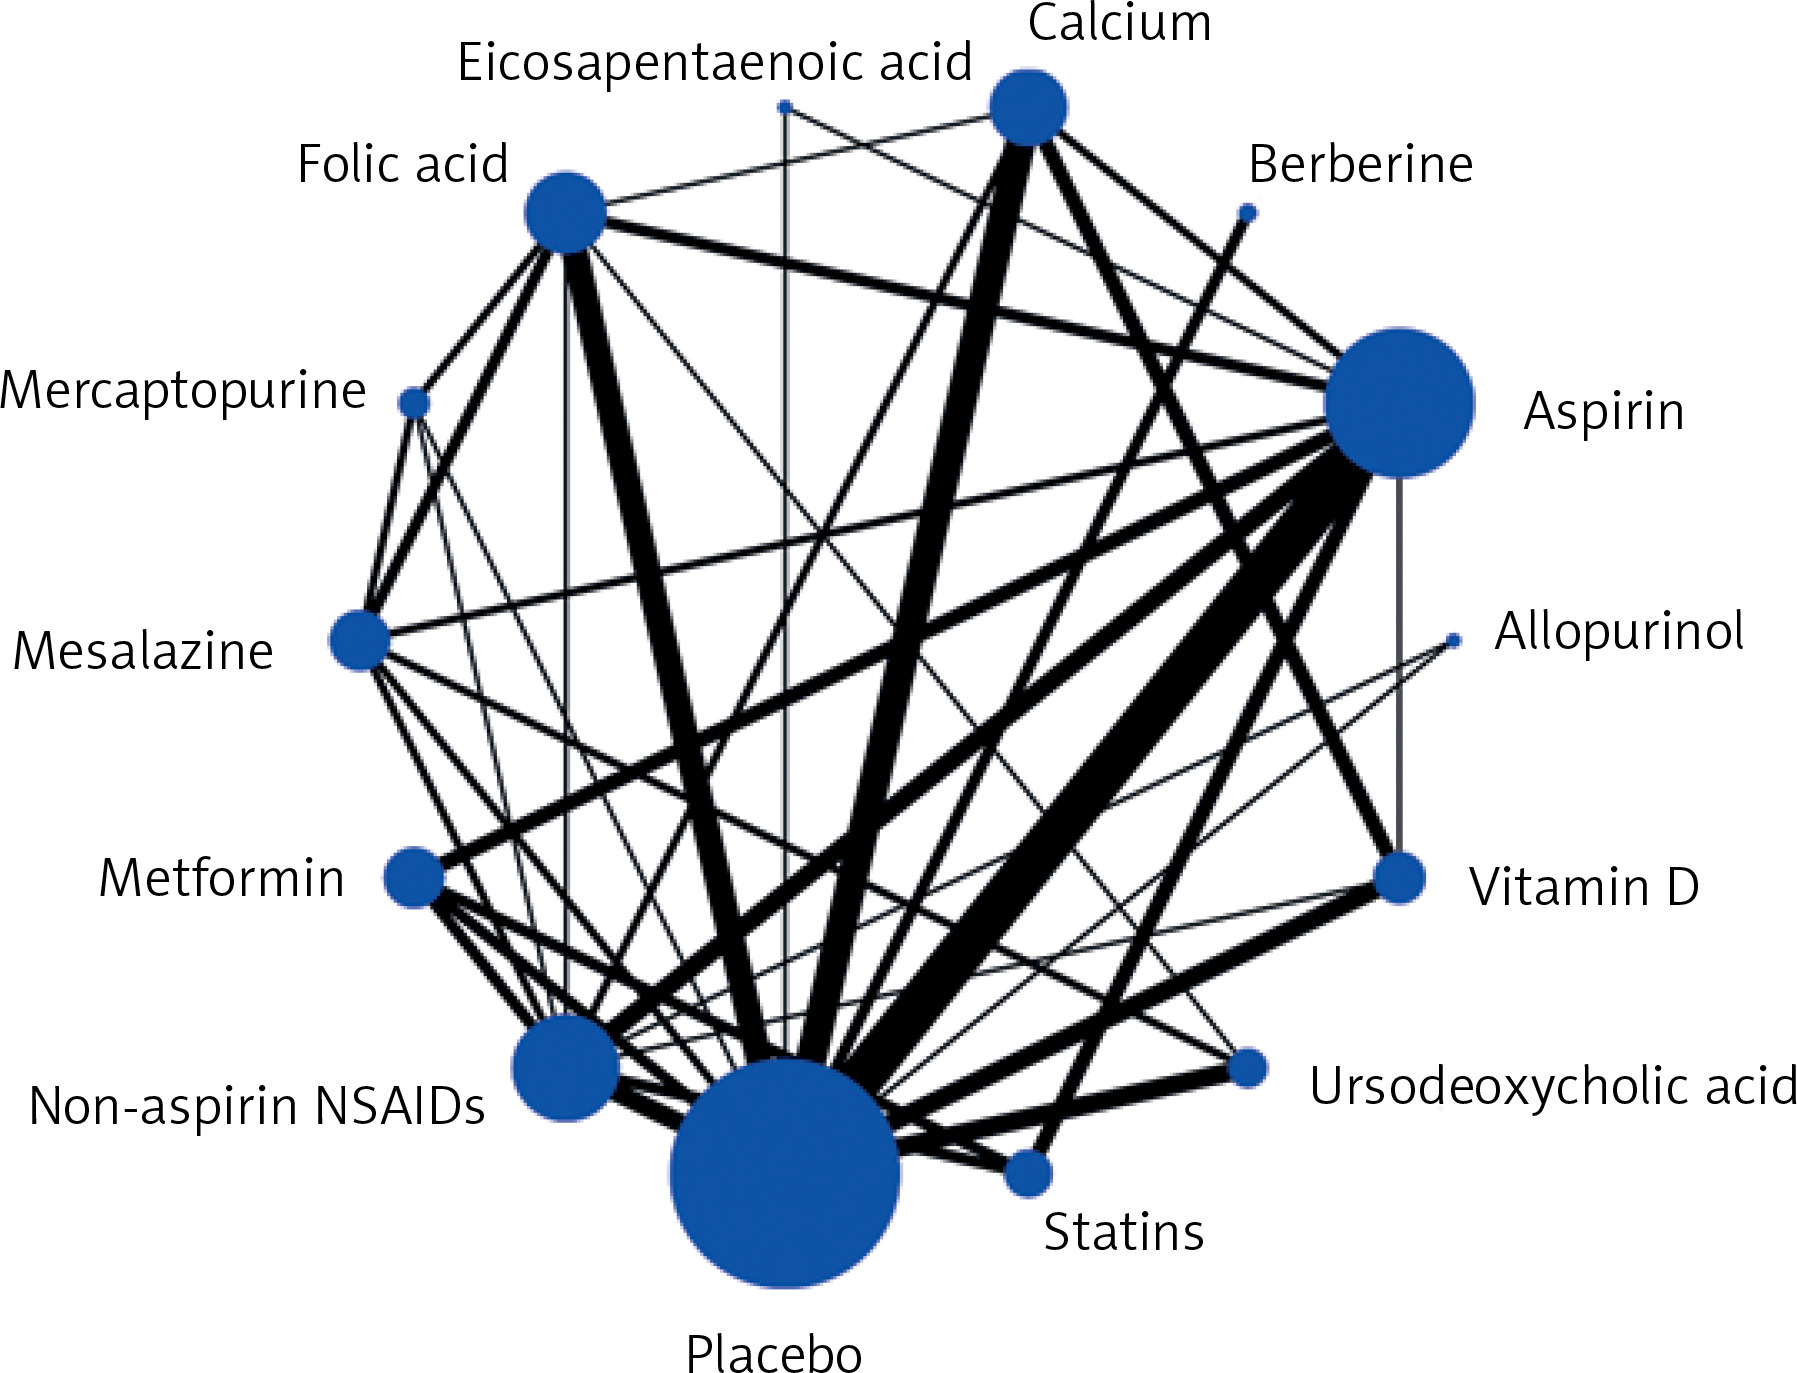
A frequentist framework was used to perform a network meta-analysis of the outcome using Stata software (version 16.0). In this network meta-analysis with drug intervention, all variables were dichotomous variables. Odds ratio (OR) was used as the effective index in the counting data, and 95% CI was used as the effective index in interval estimation. The preventive effects of two and more groups of drugs were analyzed by direct and indirect comparison. We used the node-splitting method to analyze each node, and the consistency of the results was evaluated by comparing the statistical differences between direct and indirect evidence. In the network meta-analysis map, each node represents a different intervention drug. The larger the sample size, the larger the node; the line of the connecting node represents the direct comparison between different drugs and the more related studies, the thicker the line.
The intervention hierarchy was summarized and reported as a P score. P score is the frequency simulation of the surface under the cumulative ranking curve (SUCRA) value, which can measure the degree of certainty that one intervention is better. The range of the P score is 0-1, where 1 indicates the best intervention with certainty, 0 suggests the worst intervention with certainty, and the higher the p-value, the higher the degree of advantage. We made a funnel chart and observed its symmetry to determine the presence of any publication bias.
Results
Search process
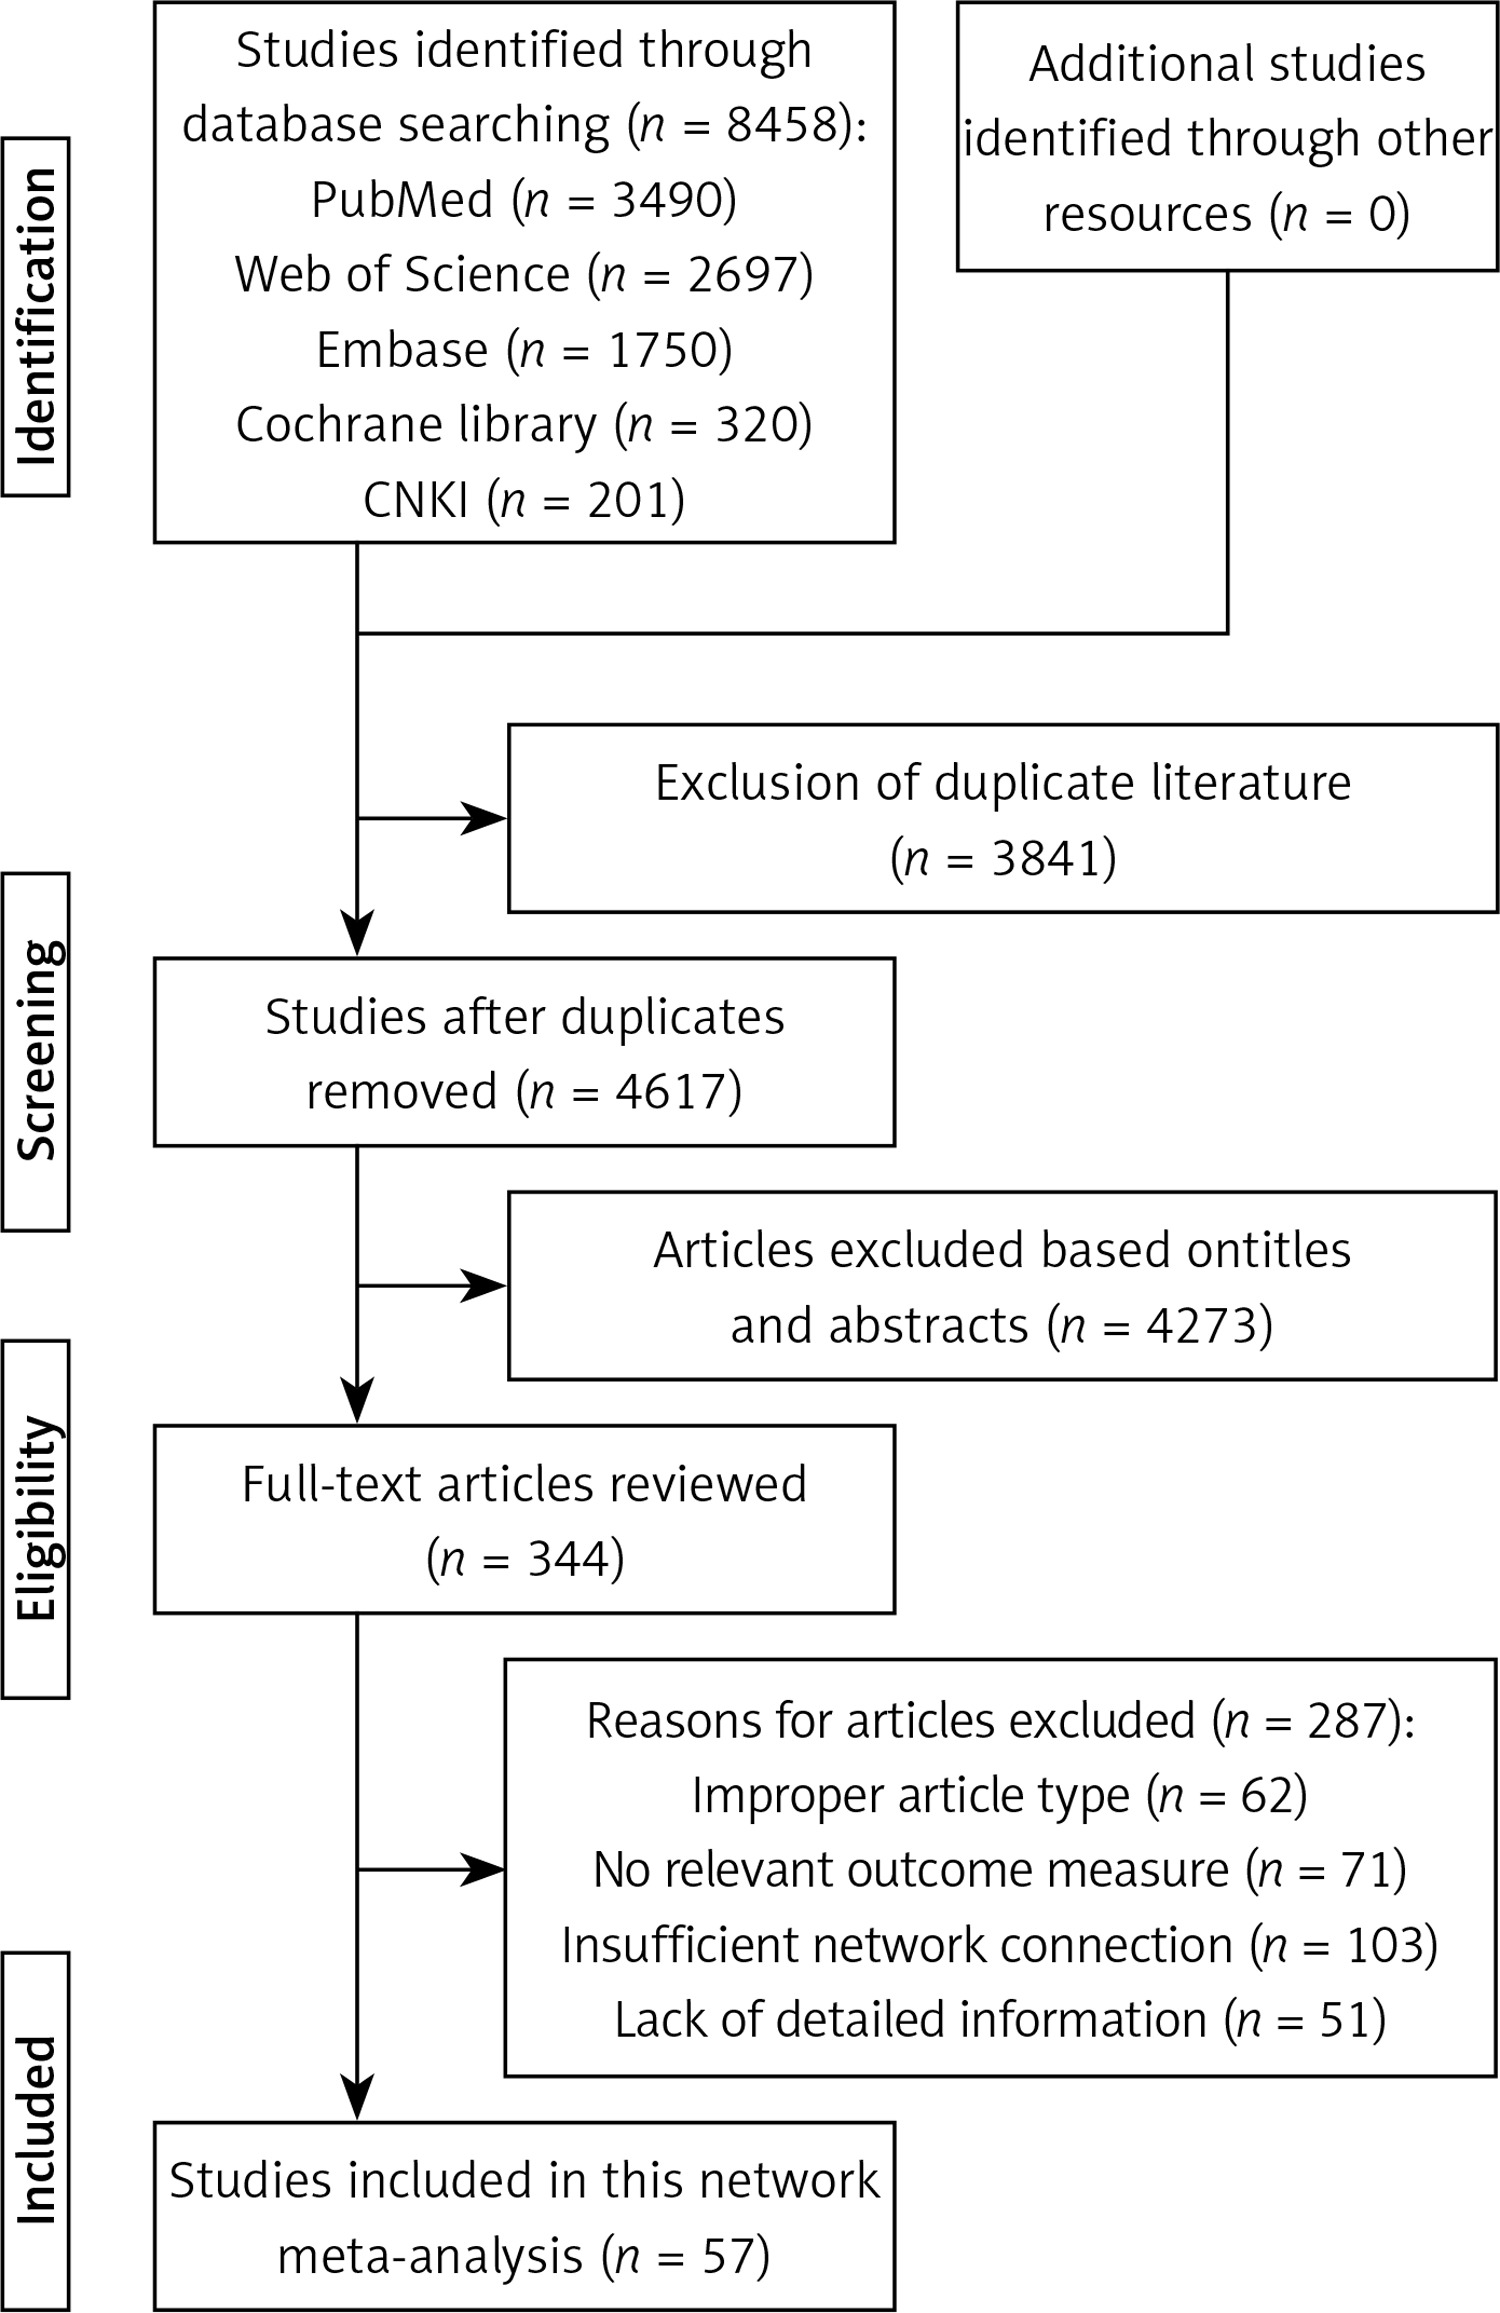
The search process is shown in Figure 1. According to the search strategy, 8458 articles were searched from PubMed, Web of Science, Embase, Cochrane Library, and China National Knowledge Infrastructure databases. A total of 3841 repeated articles were excluded. Then, titles and abstracts of the remaining 4671 articles were analyzed, after which 4273 articles were excluded. Consequently, 287 articles were excluded after reading the full text (reasons were the following: improper article type, no relevant outcome measure, insufficient network connection, and lack of detailed information). Finally, 57 articles [22–78] were included in this network meta-analysis.
Characteristics of included studies
Characteristics of included studies are shown in Table II. Among the 57 included articles, 34 were RCTs and 23 were cohort studies. Thirty studies were from North America, 15 were from Europe, 10 were from Asia, and 2 were from Australia. A total of 34 articles included elderly, 12 young and middle-aged subjects, and 11 all age groups. The intervention measures of 22 studies involved aspirin, 1 article involved eicosapentaenoic acid, 2 involved allopurinol, 13 involved non-aspirin NSAIDs, 8 involved metformin, 5 involved statins, 8 involved mesalazine, 6 involved ursodeoxycholic acid, 3 involved folic acid, 6 involved vitamin D, 9 involved calcium, and 39 involved placeboes. There were 40 double-arm studies and 17 multi-arm studies. Three studies used tumor markers in colorectal mucosa as the detection method, 9 used biopsy, and 45 used colonoscopy.
Table II
Characteristics of 57 included studies in this network meta-analysis
Results of quality assessment
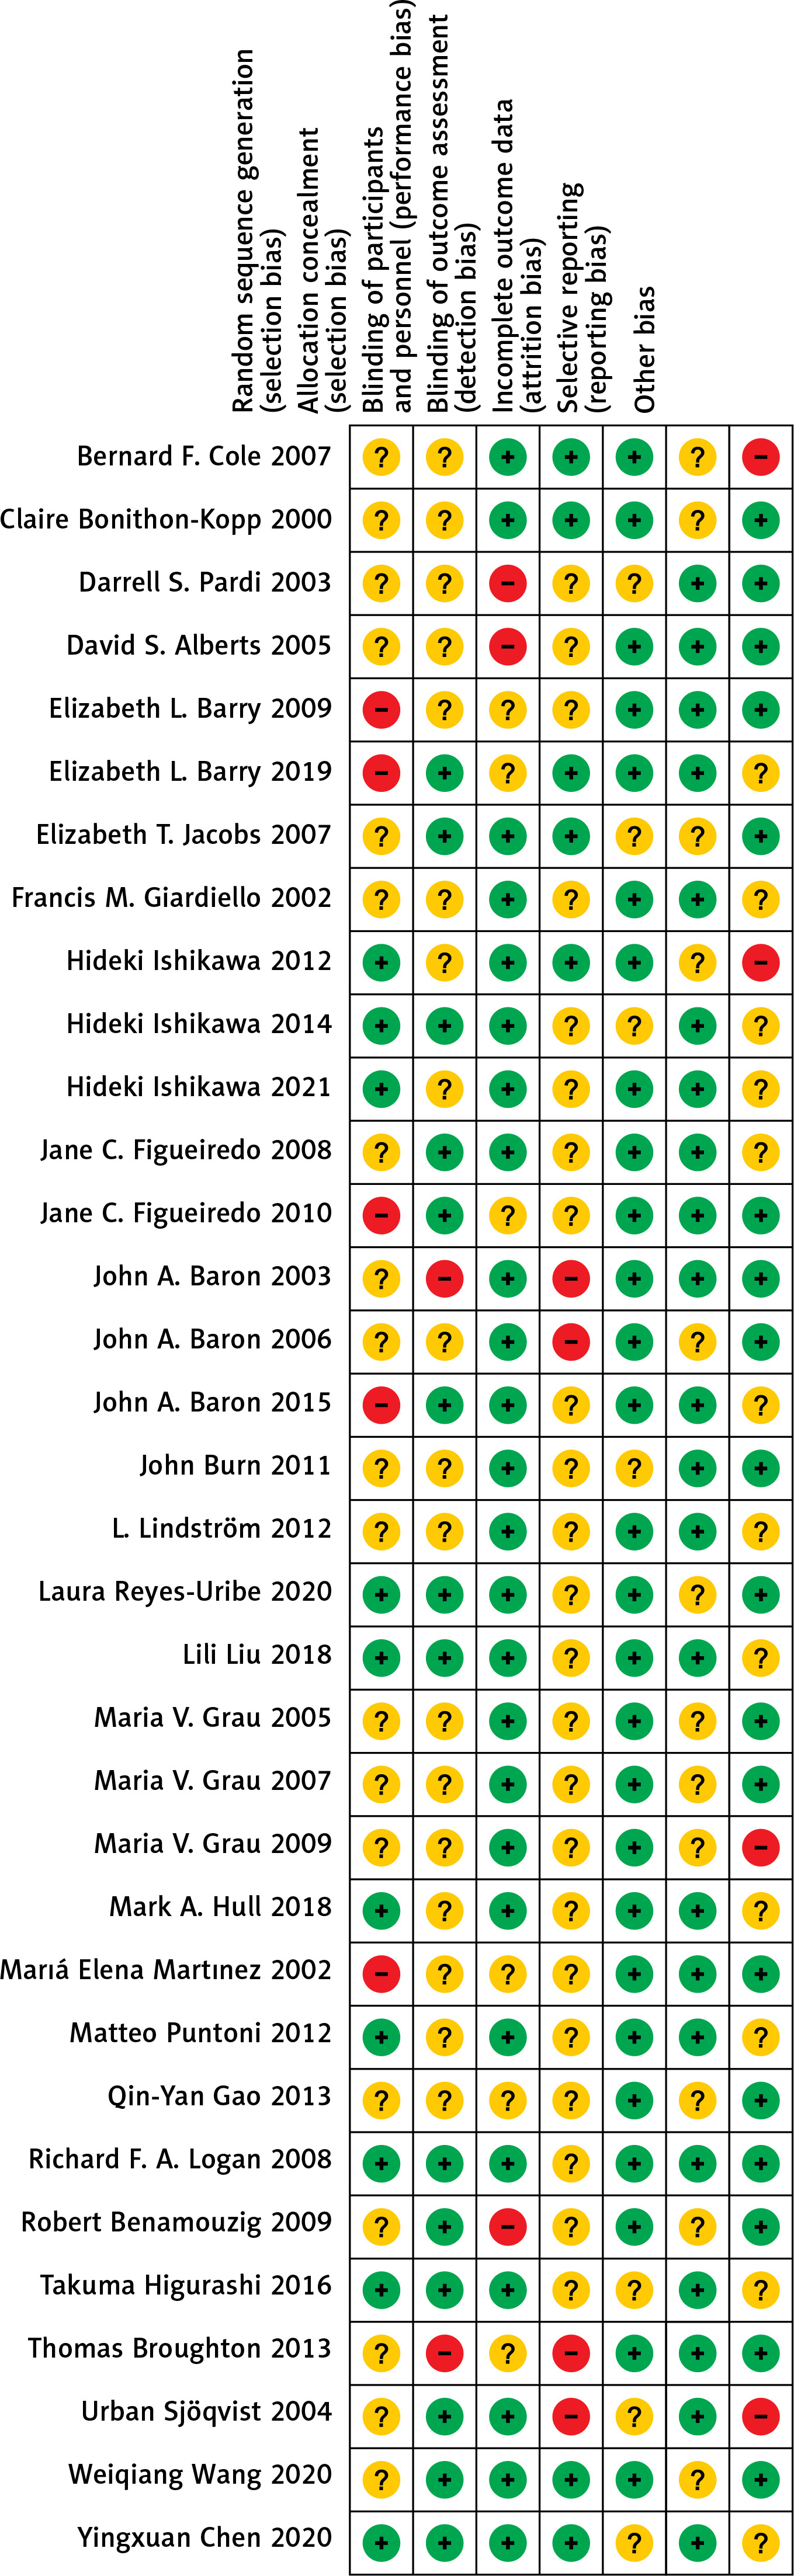
The quality assessment results of 34 RCTs are as follows: (1) Ten studies that were related to the random sequence generation were judged to have a low risk; 5 studies did not involve the random sequence generation and were considered to have a high risk; 19 studies only mentioned random while did not mention the sequences, so they were judged to have an unknown risk. (2) Fourteen studies used the method of allocation concealment and were judged to have a low risk; 2 studies did not adopt the allocation concealment method and were evaluated to have a high risk. The remaining 18 studies did not mention allocation concealment and were considered to have an unknown risk. (3) In terms of blinding of participants and personnel, 25 studies that used the blind method were considered to have a low risk; 3 studies without the blind method were judged to have a high risk; 6 studies were evaluated to have an unknown risk without the blind method. (4) Regarding blinding of outcome assessment, 7 studies used the blind method and were judged to have a low risk; 4 studies did not use a blind approach and were considered to have a high risk; 23 studies did not mention the blinding, so they were evaluated to have an unknown risk. (5) Regarding incomplete outcome data, 27 studies with a low risk did not report on lost cases or described cases lost to follow-up, while 7 did not describe cases lost to follow-up and were judged to have an unknown risk. (6) Regarding selective reporting, 22 studies described the outcome indicators and were defined to have a low risk, while 12 studies described only the main indicators and were defined to have an unknown risk. (7) In other biases, 18 studies with low risks reported no adverse reactions; 4 studies with high risks reported adverse reactions; 12 articles did not mention adverse reactions and were defined to have an unknown risk. The details are shown in Figures 2 and 3.
The quality assessment results of 23 cohort studies are as follows: 3 studies had 6 points, 11 had 7 points, and 9 had 8 points. The scores of 23 cohort studies were all ≥ 6, indicating good quality (Table III).
Table III
Quality assessment of 23 cohort studies by using NOS quality evaluation tool
Network meta-analysis
Figure 4 shows a network map of 13 drugs and the placebo. Each node represents a drug, and the node’s size is proportional to the sample size. The connecting lines express the comparison between drugs, and the thickness of the lines is proportional to the number of studies compared.
Figure 4
Network map of randomized controlled trials and cohort studies comparing preventive effects of 13 different drugs on colorectal cancer
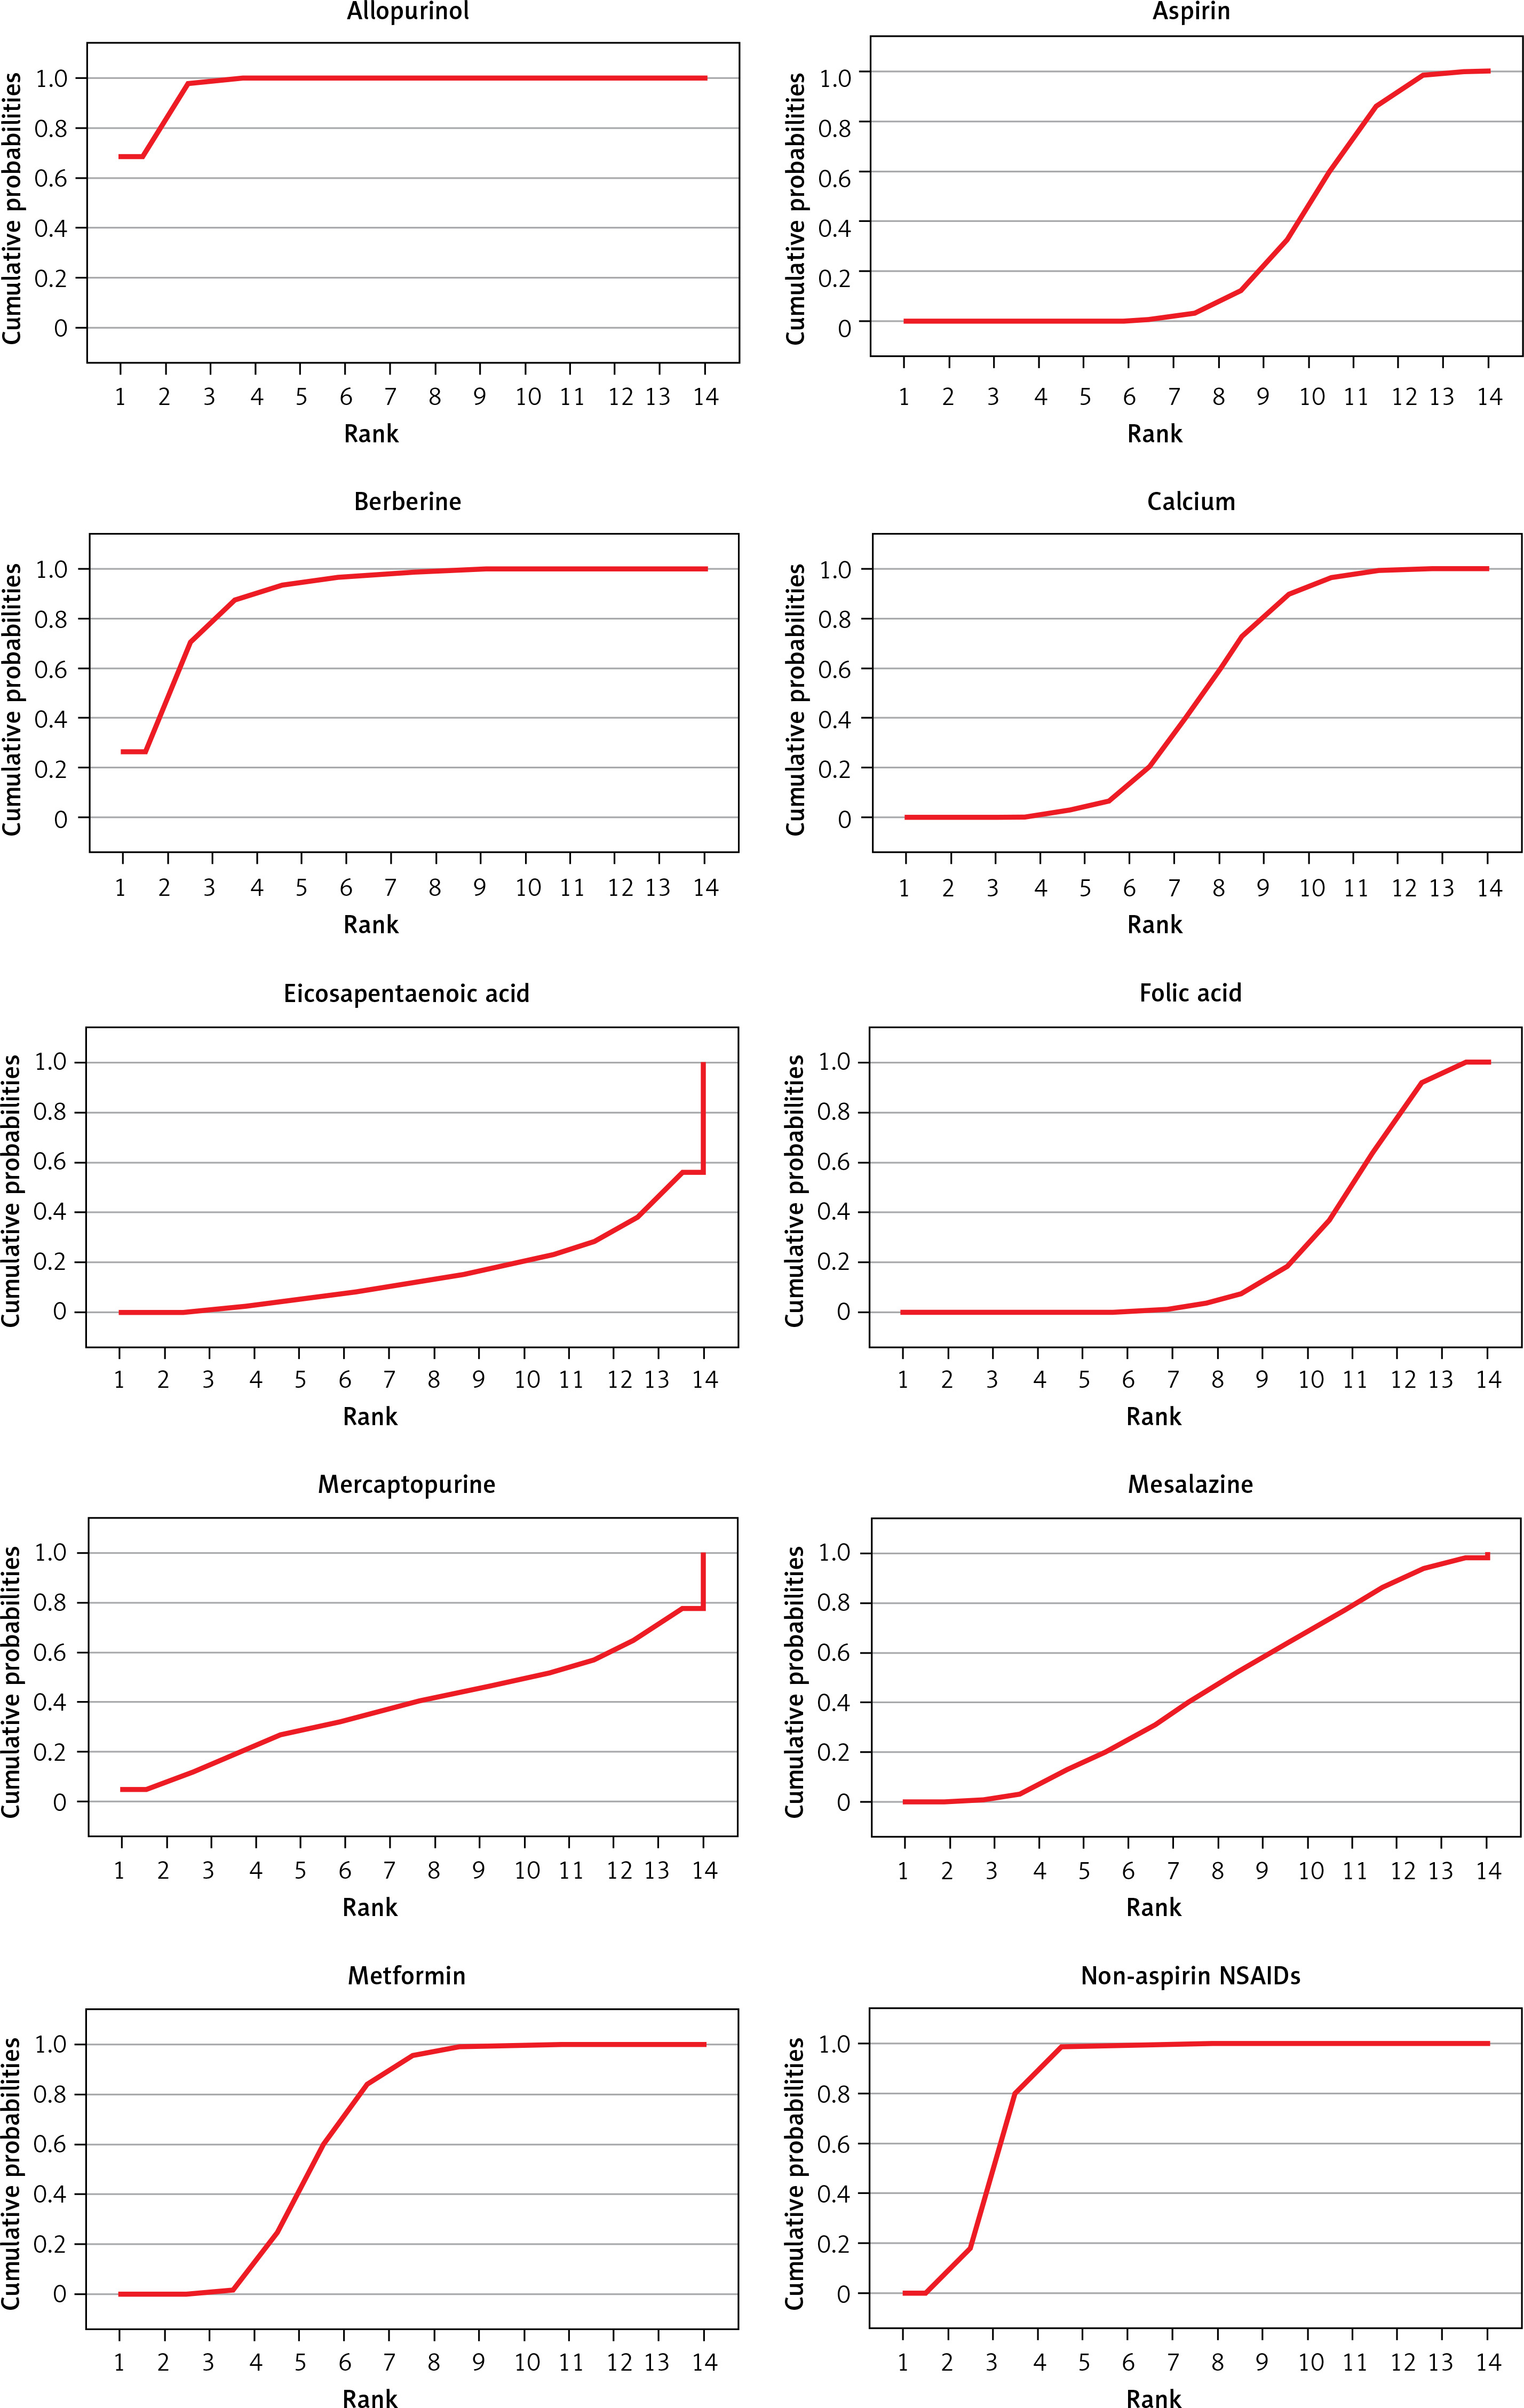
The rank of the preventive effect of all drugs on CRC is shown in Figure 5. The area under the red curve represents the surface under the cumulative ranking curve (SUCRA). The value of SUCRA is expressed as a percentage, and the higher the value, the better the drug’s effect. The best effect was seen for allopurinol (97.2%), followed by berberine (89.9%), non-aspirin NSAIDs (84.5%), statins (66.5%), metformin (66.3%), calcium (48.9%), mesalazine (44.5%), ursodeoxycholic acid (42.6%), vitamin D (41.4%), mercaptopurine (39.4%), aspirin (30.4%), folic acid (24.9%), and eicosapentaenoic acid (16.3%).
The league table is shown in Table IV. The data in the table are the results of direct and indirect comparisons of each group of drugs. The effect size is expressed by OR (95% CI). OR < 1 indicates that the horizontal intervention is better than the longitudinal intervention, and OR > 1 suggests that the longitudinal intervention is better than the horizontal intervention. The comparison between the following drugs is statistically significant: compared to placebo: allopurinol (OR = 0.54, 95% CI: 0.47–0.63), berberine (OR = 0.59, 95% CI: 0.45–0.78), non-aspirin NSAIDs (OR = 0.66, 95% CI: 0.61–0.71), statins (OR = 0.74, 95% CI: 0.68–0.82), metformin (OR = 0.74, 95% CI: 0.68– 0.81), calcium (OR = 0.81, 95% CI: 0.74–0.88), vitamin D (OR = 0.83, 95% CI: 0.74–0.92), aspirin (OR = 0.86, 95% CI: 0.80–0.93), folic acid (OR = 0.89, 95% CI: 0.81–0.98); compared to allopurinol: non-aspirin NSAIDs (OR = 0.82, 95% CI: 0.73–0.93), statins (OR = 0.73, 95% CI: 0.63–0.85), metformin (OR = 0.73, 95% CI: 0.63–0.85), calcium (OR = 0.67, 95% CI: 0.57–0.79), mesalazine (OR = 0.66, 95% CI: 0.51–0.85), ursodeoxycholic acid (OR = 0.66, 95% CI: 0.51–0.85), vitamin D (OR = 0.66, 95% CI: 0.55– 0.78), aspirin (OR = 0.63, 95% CI: 0.54–0.73), folic acid (OR = 0.61, 95% CI: 0.51–0.72), eicosapentaenoic acid (OR = 0.53, 95% CI: 0.35–0.82); compared to berberine: calcium (OR = 0.74, 95% CI: 0.56–0.98), vitamin D (OR = 0.72, 95% CI: 0.54–0.96), aspirin (OR = 0.69, 95% CI: 0.52–0.91), folic acid (OR = 0.67, 95% CI: 0.50–0.89), eicosapentaenoic acid (OR = 0.59, 95% CI: 0.36–0.95); compared to non-aspirin: statins (OR = 0.88, 95% CI: 0.81–0.97), metformin (OR = 0.88, 95% CI: 0.81–0.96), calcium (OR = 0.82, 95% CI: 0.73–0.91), vitamin D (OR = 0.80, 95% CI: 0.70–0.90), aspirin (OR = 0.76, 95% CI: 0.70–0.83), folic acid (OR = 0.74, 95% CI: 0.66–0.83), eicosapentaenoic acid (OR = 0.65, 95% CI: 0.43–0.97); compared to statins: aspirin (OR = 0.86, 95% CI: 0.80–0.92), folic acid (OR = 0.84, 95% CI: 0.74–0.95); compared to metformin: aspirin (OR = 0.86, 95% CI: 0.80–0.92), folic acid (OR = 0.84, 95% CI: 0.74–0.94).
Table IV
League table of preventive effects of 13 different drugs on colorectal cancer (Statistically significant values are marked in red)
Results of publication bias
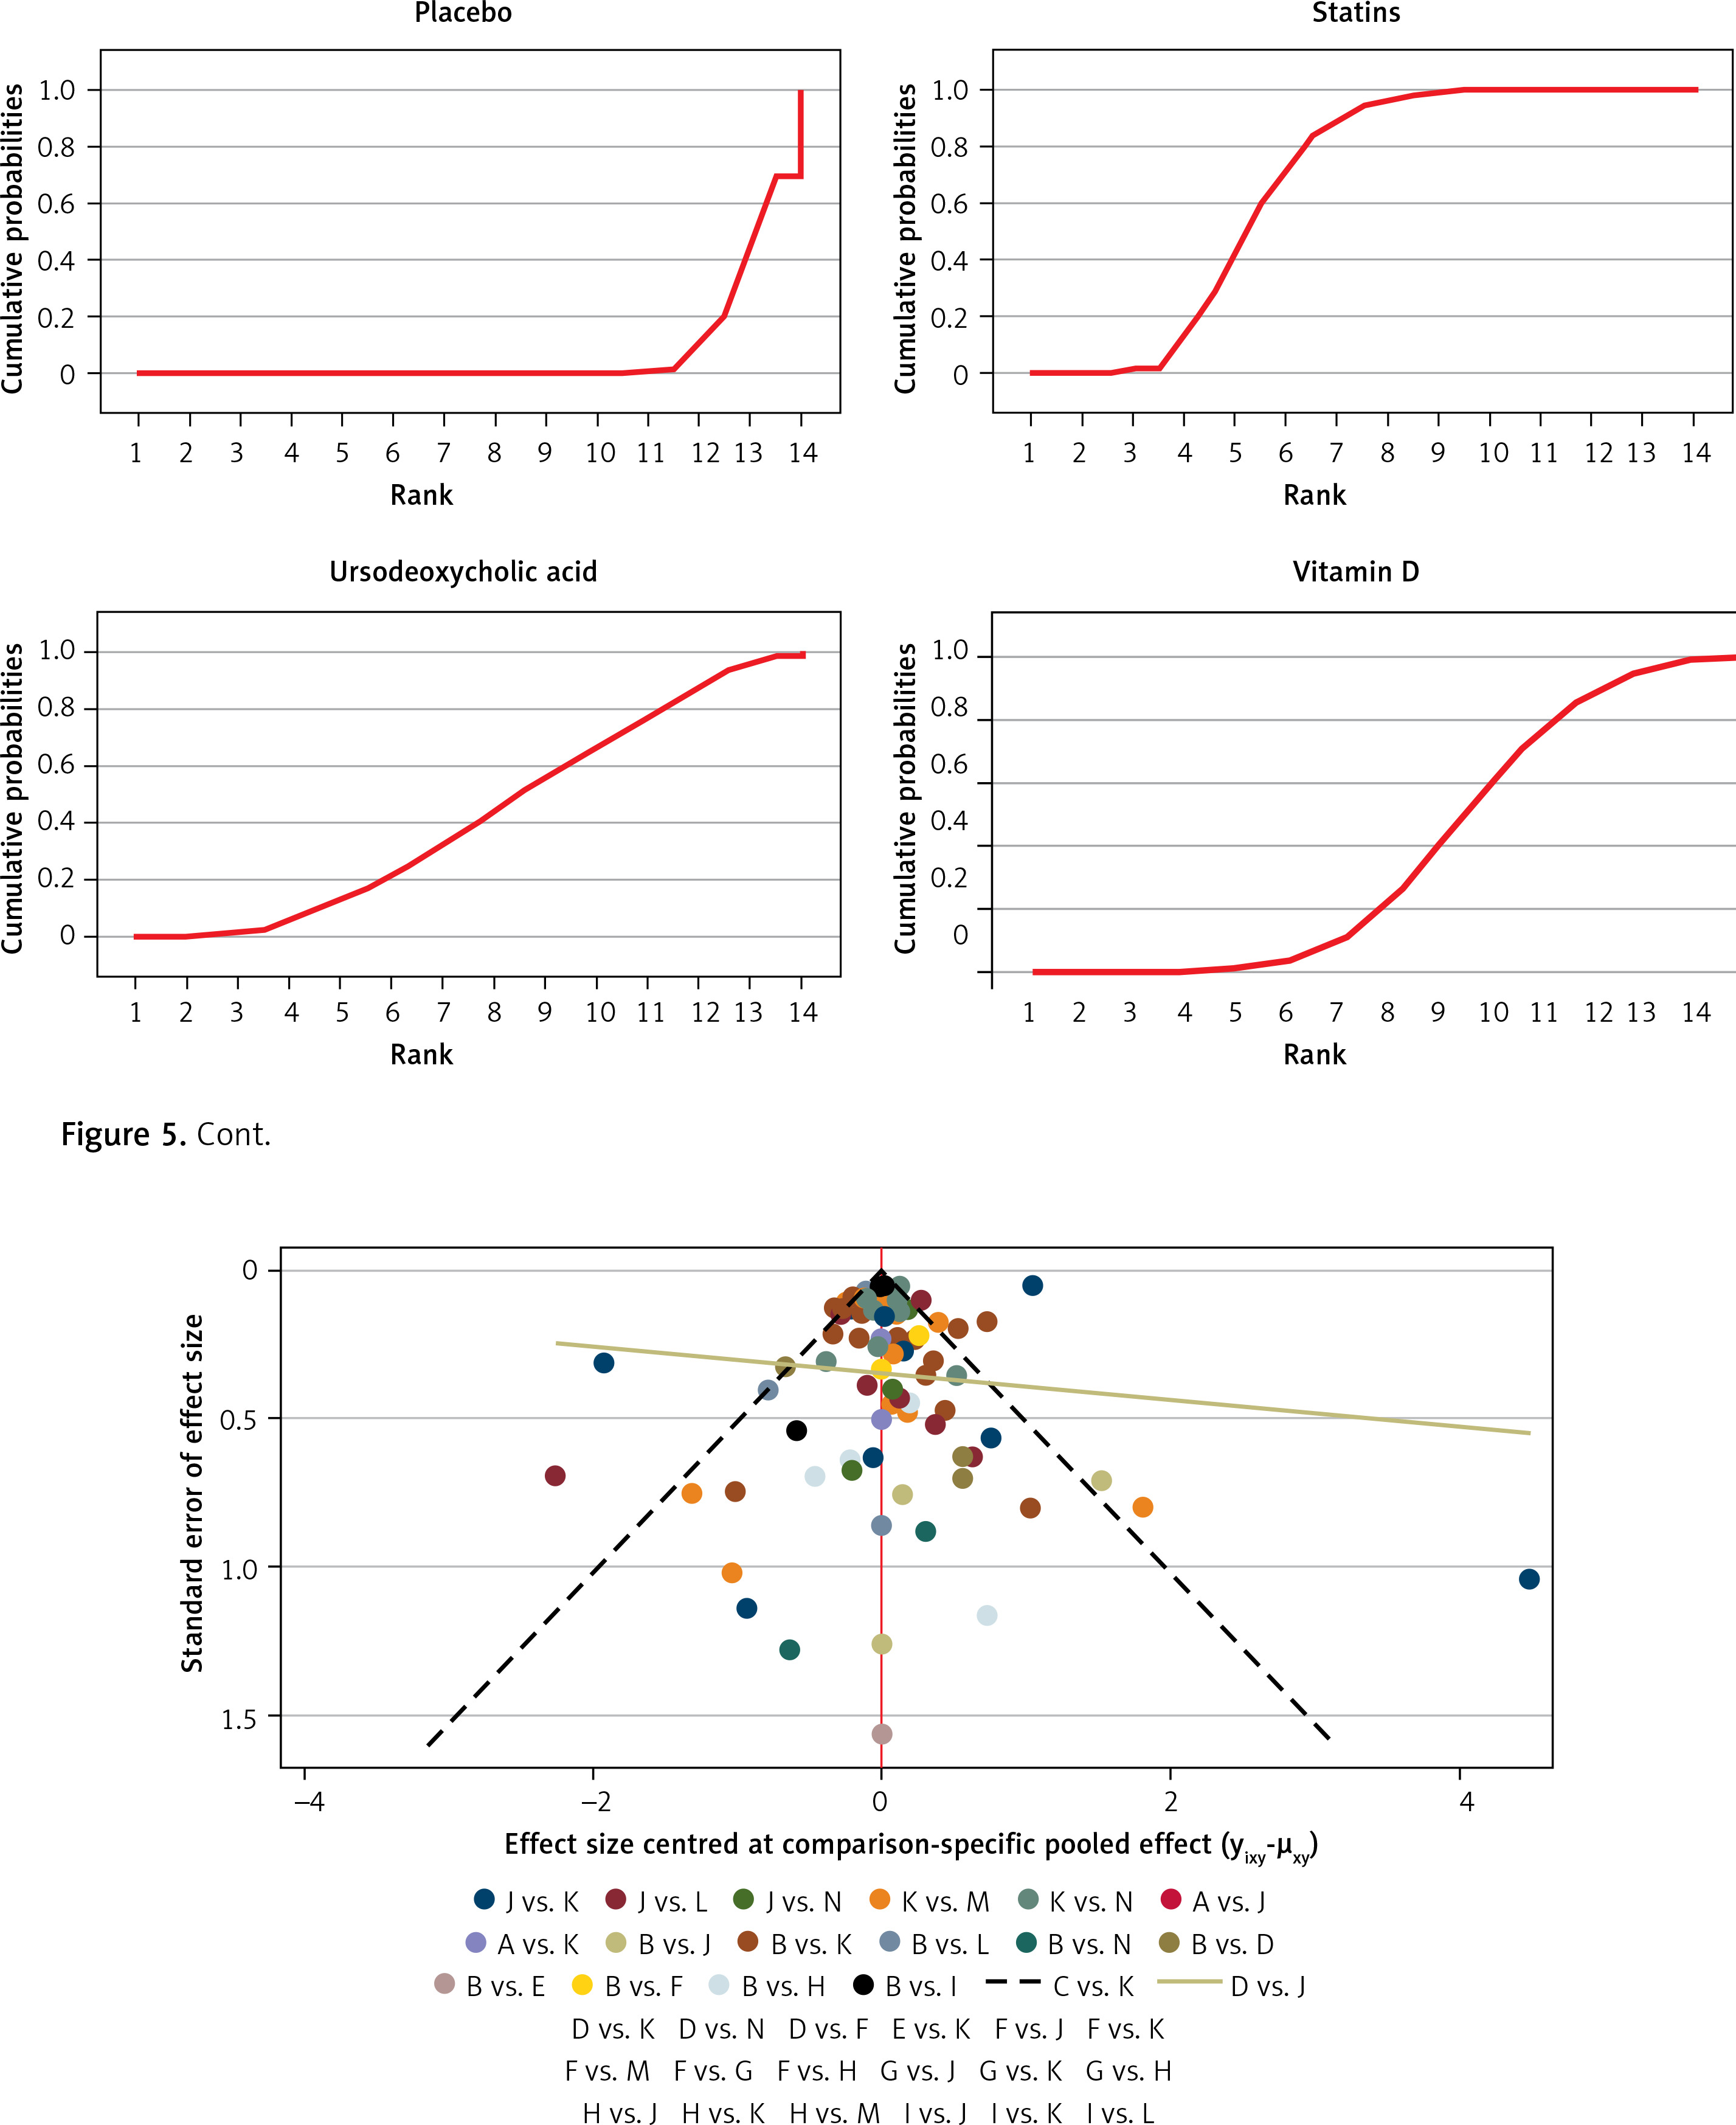
Figure 6 shows the funnel plot; the red line suggests the null hypothesis that study-specific effect sizes do not differ from respective comparison-specific pooled effect estimates. The dots of different colors represent the comparisons of different drugs. All the dots are evenly distributed on both sides of the funnel plot and roughly symmetrical, indicating no potential publication bias in this network meta-analysis. (Abbreviations: T – Total, R – Relapse, A – allopurinol, B – berberine, C – non-aspirin NSAIDs, D – statins, E – metformin, F – calcium, G – mesalazine, H – ursodeoxycholic acid, I – vitamin D, J – mercaptopurine, K – aspirin, L – folic acid, M – eicosapentaenoic acid, N – placebo).
Discussion
In this network meta-analysis, we compared the preventive effects of different drugs on CRC. Fifty-seven clinical studies were included, and the quality assessment confirmed that these studies were of good quality and had no significant publication bias. The effects of thirteen drugs were compared, and 82719 patients were included in the final analysis. The results revealed that allopurinol had the best preventive effect on CRC, followed by berberine, non-aspirin NSAIDs, statins, metformin, calcium, mesalazine, ursodeoxycholic acid, vitamin D, mercaptopurine, aspirin, folic acid, and eicosapentaenoic acid. This network meta-analysis overcame the limitations of the traditional meta-analysis, which can only directly compare two drugs. Herein, we performed direct and indirect comparisons of 13 different drugs, ranking the preventive effects of various drugs and providing more explicit guidance for clinicians.
CRC pathogenesis is not fully understood. Some of the factors affecting CRC are oxidative stress, inflammation, heredity, intestinal microflora structure, and living environment [79, 80]. Therefore, chemical drugs are an essential strategy for preventing CRC. Allopurinol, a structural analog of hypoxanthine, is widely used in the treatment of gout [81]. It can reduce uric acid levels by inhibiting xanthine oxidase [82]. Considering that xanthine oxidase is abundant in cancer tissues, clinical studies have suggested that allopurinol may inhibit the development of CRC by inhibiting xanthine oxidase [83]. Also, as allopurinol has been used for decades, there are solid clinical data. However, further elucidating its preventive effect on CRC constitutes a significant breakthrough. Allopurinol is more widely accepted than conventional chemotherapy drugs because of its low price and fewer side effects. Yet, more clinical studies are needed to further verify the preventive effect of allopurinol on CRC.
Berberine was first extracted from Coptis Chinensis and used in enteritis treatment. The anti-tumor effect of berberine was first reported in animal experiments, which showed that berberine could regulate the structure of intestinal microorganisms and inhibit tumor-related pathways to inhibit cancer [84]. In recent years, the preventive effect of berberine on CRC has been confirmed in clinical trials [73].
NSAIDs are considered one of the most effective drugs for preventing CRC, but their chemical protective mechanism remains unclear [85]. NSAIDs can change the cell cycle by reducing the expression of cyclin B1 and E and inducing apoptosis of cells by promoting the expression of Bax (an apoptotic protein) [86, 87]. In addition, NSAIDs can significantly inhibit the expression of cyclooxygenase-2 (cox-2), which is often upregulated in CRC [88].
Aspirin is one of the NSAIDs. Yet, some results showed that non-aspirin NSAIDs (sulindac, naproxen) are more effective in preventing CRC than aspirin. Statin is a cholesterol-lowering drug for the treatment of cardiovascular diseases. However, some studies have discovered that statins may also prevent CRC [89] by inducing tumor cell apoptosis, changing tumor cell adhesion, and preventing tumor cell cycle progression by inhibiting 3-hydroxy-3-methyl glutaryl coenzyme A reductase [90, 91].
Metformin is a first-line hypoglycemic drug for type 2 diabetes. Interestingly, some observational and preclinical studies showed that metformin has a potential anti-tumor effect [92, 93]. Metformin can inhibit the proliferation of cancer cells by activating tumor suppressors, inhibiting the mammalian target of rapamycin, and activating the liver kinase B1-dependent activation of AMPK [94].
Vitamin D and calcium are essential nutrients for bone mineralization that can prevent CRC [95, 96]. The anti-tumor mechanisms of vitamin D include affecting cell adhesion, regulating the cell cycle, affecting growth factor signal transduction, regulating tumor suppressor genes, and so on [97, 98]. In addition, calcium can bind to secondary bile acids and free fatty acids to inhibit the proliferation of cancer cells [99].
Mesalazine is widely used in the treatment of inflammatory bowel disease. However, inflammatory bowel disease is considered a significant risk factor for CRC. The oxidative stress caused by inflammation can damage DNA, activating oncogenes and suppressing tumor suppressor genes [100]. Mesalazine may exert a preventive role in CRC by reversing intestinal inflammation.
Ursodeoxycholic acid is a synthetic bile acid used to treat primary sclerosing cholangitis. Early clinical studies have shown that using ursodeoxycholic acid can reduce the incidence of CRC [101] by inhibiting the proliferation of cancer cells and mitotic signal transduction [102].
Folic acid is an indispensable nutrient in the human body, which has been confirmed to be involved in nucleotide synthesis and DNA methylation repair [103]. There is a large amount of epidemiological evidence proving that folic acid deficiency is closely related to CRC [104]. Folic acid can assist serine hydroxymethyltransferase (SHMT) in producing 5-century-10-methylenetetrahydrofolate, which can be used as a critical carrier of a single carbon group in the process of DNA methylation repair [105]. The repair of DNA methylation can restore tumor suppressor gene expression and inhibit tumor cell proliferation [106]. In addition, folic acid has been proven to inhibit oxidative stress and angiogenesis in CRC [107].
Eicosapentaenoic acid, an Omega (u)-3 polyunsaturated fatty acid (PUFA), was first found in cold-water fish oil [108]. It is often used in the treatment of cardiovascular diseases [109]. In recent years, its preventive effect on CRC has aroused great interest among scholars. However, the inhibitory mechanism of eicosapentaenoic acid on CRC is not completely clear. It has been recognized that eicosapentaenoic acid can inhibit cyclooxygenases (especially COX-2), reduce the conversion of arachidonic acid to prostaglandin E2, and eventually lead to the apoptosis of cancer cells [110].
This NMA included 82719 participants. The huge sample size can represent the whole of the patients and ensure the reliability of the results. The quality of the 57 included articles is good, and there was no obvious publication bias, which also ensures the reliability of the results. This study analyzed as many chemoprophylaxis drugs for CRC as possible, and the protective effects of the 13 drugs can provide better guidance for their clinical applications.
However, this study also has a few limitations. First, although we have tried our best to control the heterogeneity of the original research, some factors, such as different countries, gender, and age, may lead to inevitable heterogeneity. Second, some of the included RCTs had certain deficiencies in design, such as failure to use and explain randomization, blinding, and allocation methods. Third, we only compared the efficacy of the drugs; yet, we also found that these drugs had some side effects, such as nausea, vomiting, and dizziness. Future studies should compare the side effects of these drugs. Although this study has a specific clinical guidance value, more high-quality clinical studies are still needed to further verify these results.
In conclusion, compared with the placebo, 13 drugs in this study showed preventive effects on CRC, with allopurinol showing the best effect and eicosapentaenoic acid being the least effective.