Metabolic abnormalities, such as disturbances in glucose, lipid, and protein metabolism, are closely linked to chronic diseases like cardiovascular diseases, diabetes, and obesity [1]. Among these, iron metabolism disorders – characterized by iron deficiency or overload – pose a significant health threat. Iron is essential for oxygen transport, DNA synthesis, and energy metabolism, and its imbalance can lead to conditions like anemia or iron overload, which can damage organs and increase the risk of diseases such as cardiovascular disease, diabetes, and cancer [2].
Iron metabolism disorders also interact with other metabolic abnormalities. For example, iron imbalance can disrupt glucose and lipid metabolism, contributing to conditions like diabetes and non-alcoholic fatty liver disease [3]. Given the broad impact of iron metabolism on health, identifying modifiable factors to prevent or improve iron balance is critical [2].
Physical activity (PA) is an important modifiable factor known to improve metabolic health [4], yet its effects on iron metabolism are less understood. While some studies suggest that moderate PA may improve iron absorption and utilization, excessive high-intensity exercise may lead to iron loss [5]. There is a lack of large-scale studies to evaluate PA’s impact on iron metabolism in the general population. This study uses data from the National Health and Nutrition Examination Survey (NHANES) to explore the relationship between PA and iron metabolism abnormalities in a representative sample.
We analyzed data from the 2017–2018 NHANES, a cross-sectional survey using a complex, multi-stage sampling design to represent the U.S. population. Of 9,254 participants, we excluded individuals under the age of 20, as well as those lacking iron metabolism biomarkers, covariates, or physical activity data. Individuals with significant metabolic disorders, cancer, or mental disorders were also excluded, leaving 4,623 participants in the final analysis [6].
In this study, the average age of participants was 52.14 years. Regarding gender distribution, males comprised 2,158 individuals. The racial distribution of participants was as follows: 620 Hispanic Americans, 444 other Hispanic individuals, 1,623 non-Hispanic whites, 1,046 non-Hispanic blacks, 665 non-Hispanic Asians, and 225 individuals of other races (including those of multiple races). Regarding educational attainment, participants were distributed as follows: 393 had less than 9th grade education; 520 had 9th to 11th grade education (including 12th grade without a diploma); 1,072 had a high school diploma or equivalent; 1,489 had some college or an associate degree; and 1,149 had a bachelor’s degree or higher. The mean income level was 2.57, with a standard deviation of 1.50. Regarding smoking habits, 1,933 participants reported having smoked at least 100 cigarettes in their lifetime, while 2,690 had smoked fewer than 100 cigarettes. Concerning alcohol consumption, 969 individuals indicated daily drinking, whereas 3,654 did not drink daily. The mean BMI was 29.97 with a standard deviation of 7.45.
We examined six iron-related biomarkers: Serum ferritin (FER) which reflects total body iron stores. Abnormal levels were defined as < 25 µg/l or > 300 µg/l. Serum transferrin receptor (TFR) which reflects cellular iron demand; abnormal levels were defined as < 9.6 nmol/l or > 29.6 nmol/l [7].
Serum iron (IRN) which indicates iron bound to transferrin; abnormal levels were defined as < 7.8 µmol/l or > 32.2 µmol/l. Transferrin saturation (PCT) which is the percentage of transferrin bound to iron; abnormal levels were defined as < 20% or > 55% [8]. Total iron-binding capacity (TIBC) which is the total amount of iron that serum transferrin can bind; abnormal levels were defined as < 43.0 µmol/l or > 80.6 µmol/l. Unsaturated iron-binding capacity (UIB) which is an unbound portion of transferrin; abnormal levels were defined as < 25.06 µmol/l or > 51.91 µmol/l [6].
In all analyses, these indicators were categorized as normal or abnormal. Iron overload was considered when these markers exceeded the normal range, whereas iron deficiency corresponded to levels below the range.
PA was assessed using the Global Physical Activity Questionnaire (GPAQ), covering occupational, transportation, and leisure-time domains. Weekly moderate and vigorous PA minutes were summed. For vigorous-intensity PA, total minutes were doubled before adding them to moderate-intensity minutes. Participants accumulating fewer than 150 min of moderate-to-vigorous PA per week were classified as inactive, and those with 150 min or more were classified as active [9].
Covariates included demographic factors (age, sex, race, education, marital status), behavioral factors (smoking, alcohol use, sedentary behavior), and health conditions (hypertension, stroke, diabetes, and body mass index). All analyses accounted for NHANES’s complex design (weights, sampling units, and strata).
We used weighted logistic regression to examine whether PA (active vs. inactive) was associated with the risk of abnormal iron metabolism indicators. Three sequential models were constructed: Model 1: PA status only; Model 2: Adjusted for demographic variables; and Model 3: Further adjusted for behavioral and health factors. P < 0.05 indicated statistical significance. Additionally, restricted cubic spline (RCS) analysis assessed non-linear relationships between total PA (TPA) and continuous iron markers.
All results can be found in Tables I and II and Figure 1.
Table I
The results of RCS model
Table II
The results of logistic regression model
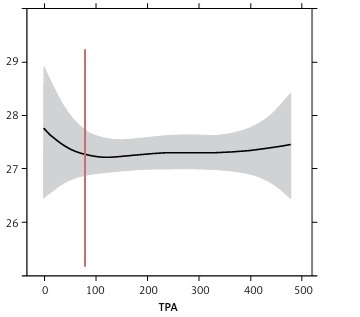
Figure 1
Visualization of RCS model results. A – LBDIRNSI (serum iron), B – LBDPCT (transferrin saturation), C – LBDFERSI (serum ferritin), D – LBDTIBSI (total iron-binding capacity), E – LBDTFRSI (serum transferrin receptor)
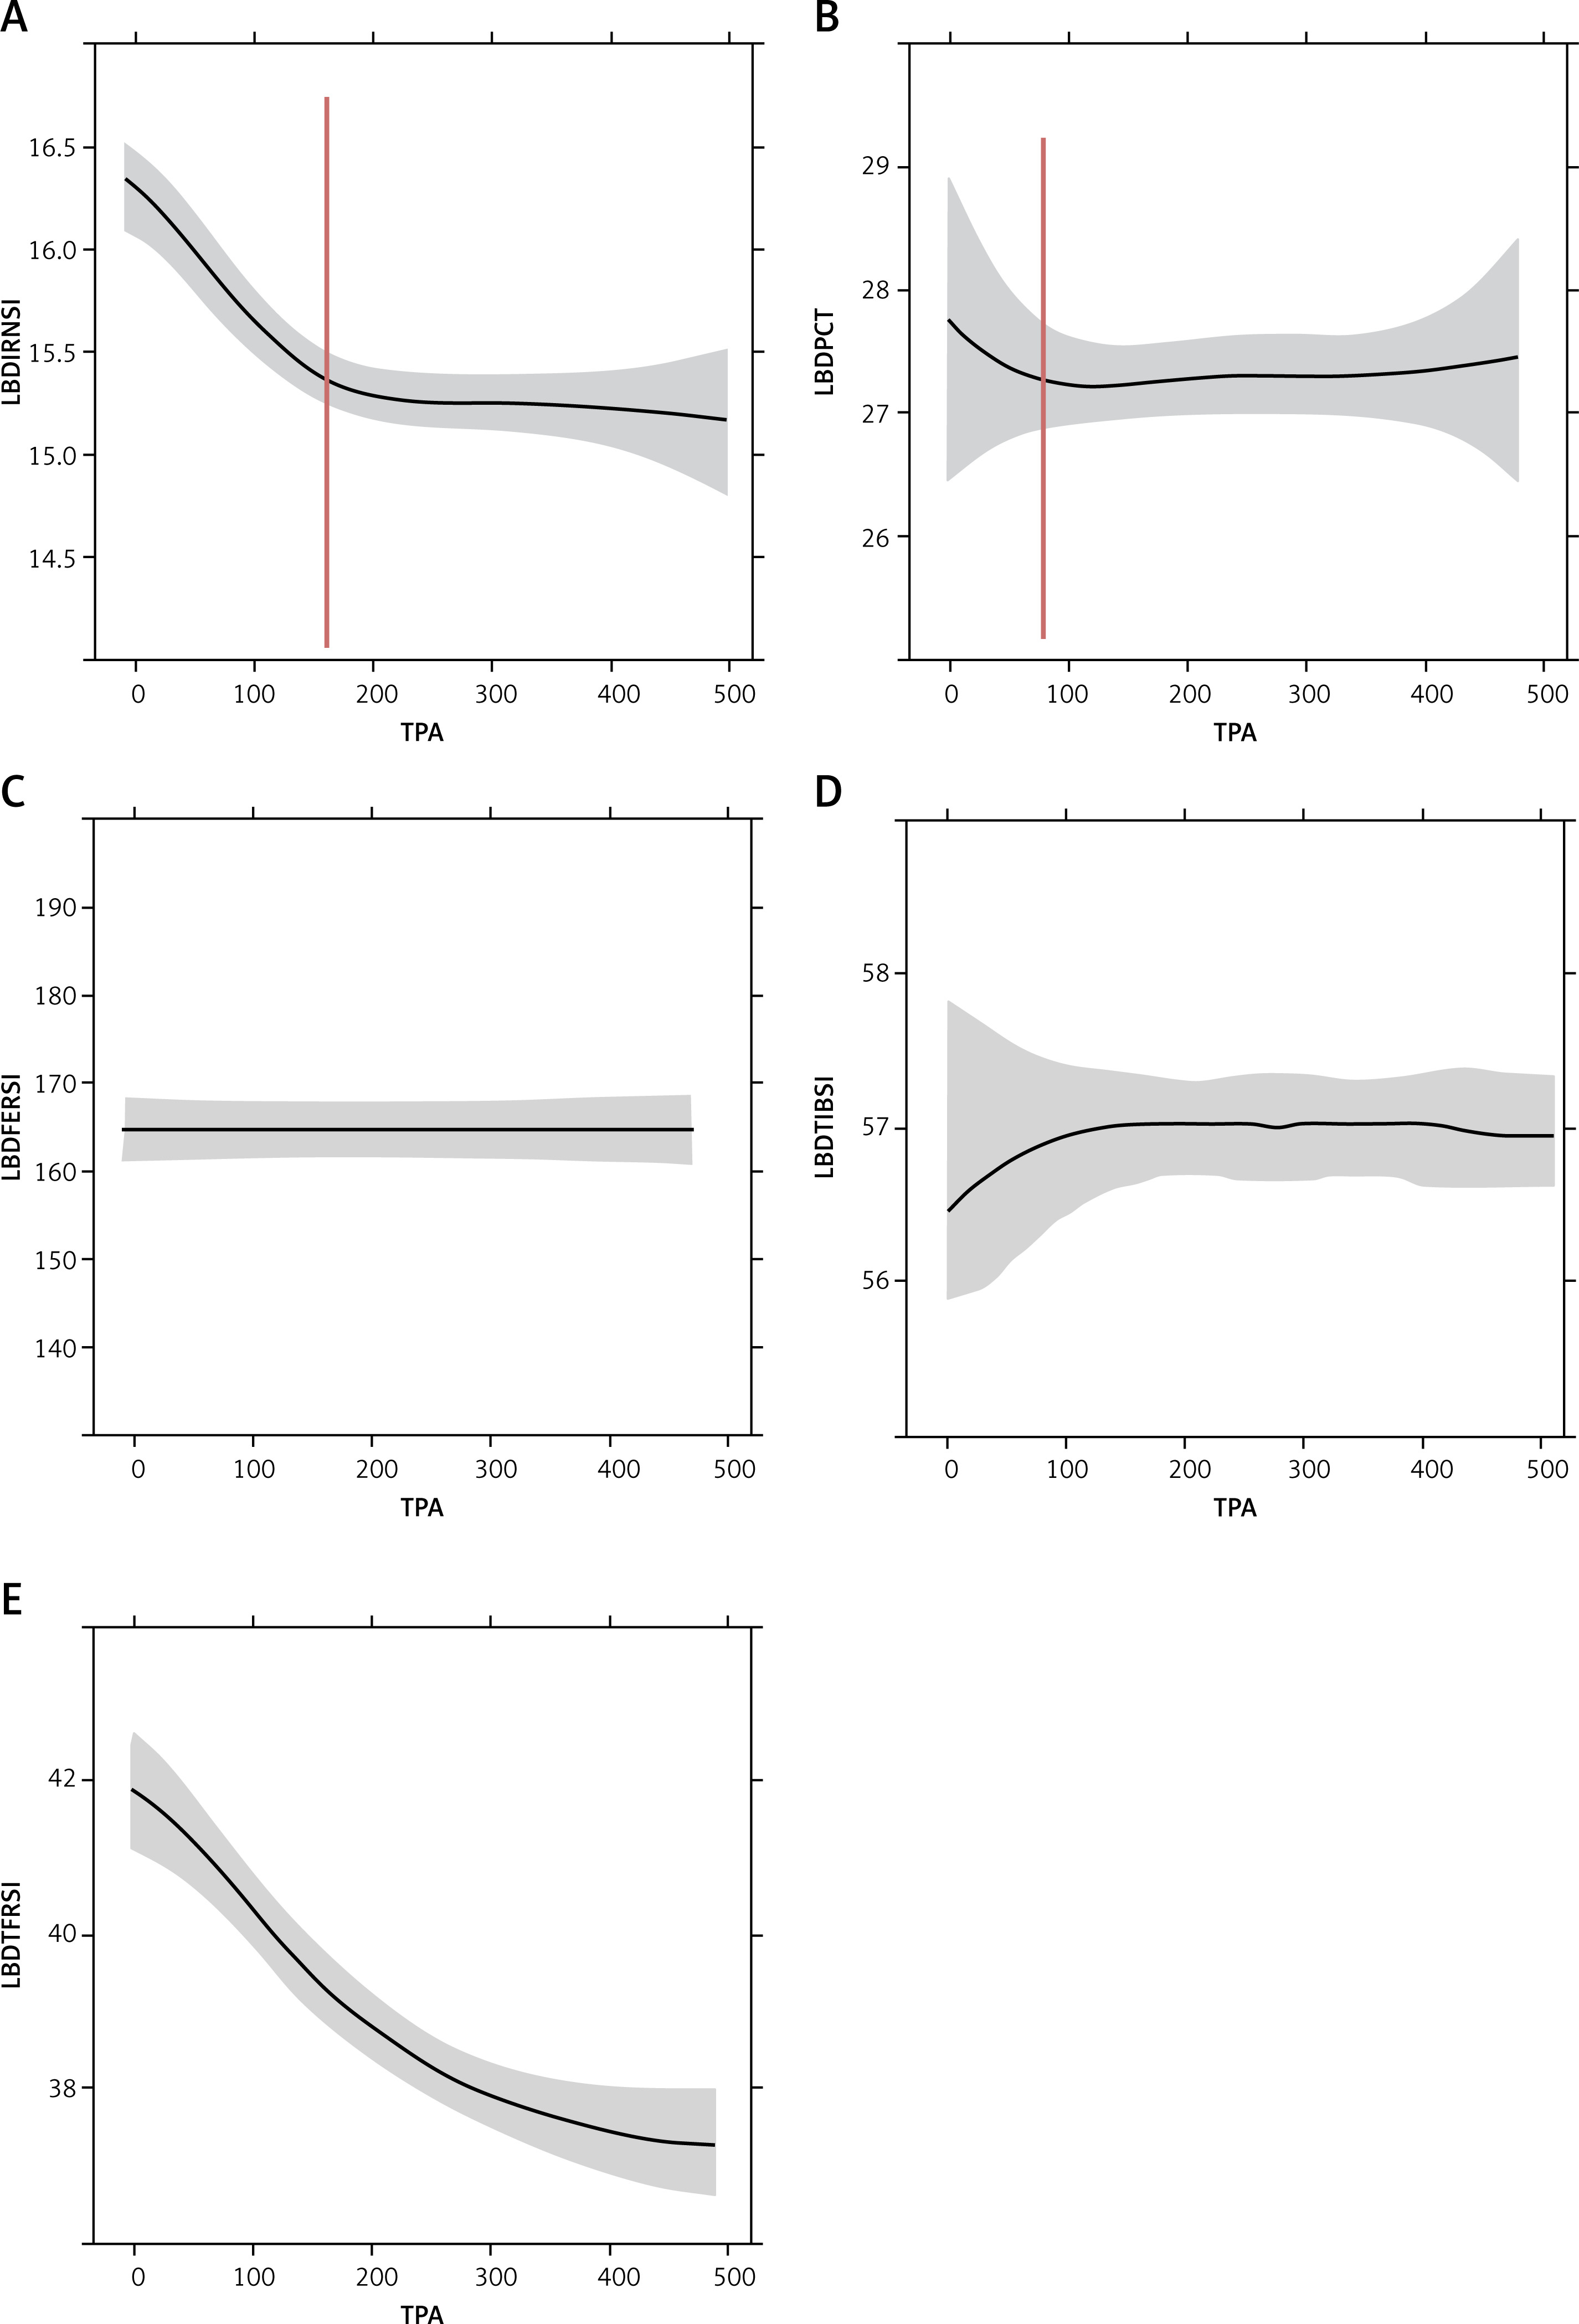
Logistic regression indicated that being physically active was significantly associated with a lower risk of iron overload (i.e., higher-than-normal serum iron). This protective effect persisted after adjusting for age, sex, race, and other confounders. RCS analysis showed a notable decline in serum iron levels as PA increased up to about 150 min per week, with a more modest effect beyond this point.
Abnormal TIBC did not show a significant relationship with PA status in adjusted models. RCS analysis suggested a slight, non-significant increase in TIBC at low-to-moderate PA levels, implying that short-term or moderate increases in PA may not substantially modify TIBC.
Being active significantly lowered the risk of abnormal transferrin saturation, suggesting a protective effect against iron overload. RCS analysis confirmed a negative correlation between PA and transferrin saturation, especially for individuals who engaged in under 150 min of PA per week.
No significant relationship was observed between PA status and abnormal ferritin levels. Both logistic regression and RCS analyses indicated that ferritin, a reflection of iron stores, may be relatively unaffected by short-term or moderate changes in PA.
Active individuals showed a lower risk of abnormal TFR levels associated with iron overload. This association remained significant after adjustments for demographic and health factors, reinforcing the beneficial influence of PA on iron regulation at the cellular level.
Logistic models indicated that active participants had a lower risk of abnormal UIB, again suggesting a protective effect of PA against iron overload. These findings highlight the consistent link between PA and healthier iron homeostasis across multiple biomarkers, although the magnitude of this benefit varied by specific indicator.
This study found that regular PA is associated with a lower risk of iron overload, particularly in serum iron, transferrin saturation, and transferrin receptor. Active individuals showed fewer iron metabolism abnormalities than inactive participants. After adjusting for demographic and health factors, PA remained protective, suggesting that moderate exercise may help regulate iron absorption, utilization, and distribution.
Restricted cubic spline analysis showed a non-linear association between PA and serum iron: moderate PA (< 150 min/week) significantly lowered iron levels, but further increases offered no added benefit and could increase iron loss via hemolysis or muscle damage. By contrast, PA had limited effects on ferritin or TIBC, indicating it more strongly influences circulating iron markers than iron stores. Mechanistically, moderate PA could enhance blood circulation, erythropoiesis, and reduce inflammation, improving iron balance [10]. However, excessive exercise may elevate oxidative stress, potentially aggravating iron overload [11].
Because this is a cross-sectional study, causality cannot be inferred. Future longitudinal studies should clarify optimal PA intensity and duration and account for factors like diet and genetic predisposition, especially in high-risk groups. However, we must acknowledge that the physical activity assessment methods employed in NHANES analyses rely primarily on subjective questionnaires. Future research should place greater emphasis on refining objective measurement techniques, such as wearable devices like actigraphs. This approach would ensure objectivity while incorporating closely related factors – such as sleep patterns or sedentary behavior – into such analyses.
In conclusion, in a representative U.S. adult sample, regular PA was linked to lower risks of iron overload, particularly in serum iron, transferrin saturation, and transferrin receptor. Moderate PA helped prevent excessive iron accumulation, though its effects on ferritin and TIBC were less clear. These findings highlight the importance of regular PA in maintaining iron balance and reducing iron overload risks. Further research is needed to determine the optimal exercise guidelines for different populations and clinical settings.