Introduction
Adolescence, as a period of increased nutritional demand and changes in psychosocial behavior, is often associated with obesity and metabolic disturbances closely related to insulin resistance (IR) [1]. IR may precede other cardiometabolic disorders, such as non-alcoholic fatty liver disease, metabolic syndrome, type 2 diabetes, and cardiovascular disease, later in life [2–5]. In the aim of better understanding of the regulatory mechanisms of insulin signaling pathways, many biomolecules and their mutual interaction have been investigated [6–8]. Recent advances in that field indicated the relationship between several iron homeostasis biomarkers and IR [9–14]. However, those results are inconclusive, leaving doubt as to whether they act via different and independent pathways.
Ferritin has been widely used in iron deficiency anemia, and its low levels indicate depleted iron stores. However, it was suggested that ferritin may not be a reliable determinant of iron deficiency in individuals with obesity, since the obese state represents a bias factor when interpreting ferritin results [15]. Namely, as an acute phase reactant, ferritin levels increase in obesity, concomitantly with the increase in inflammation level and questioning the true reflection of iron stores [15, 16]. Transferrin is a protein that binds iron in the circulation, and its levels increase with increased requirement of iron. Similarly to ferritin, it increases in parallel with an increase in inflammation [9, 16]. The cellular demands of iron are regulated by the soluble transferrin receptors (sTfR). Those transmembrane receptors are presented in a soluble form in all cells. Through an interaction between transferrin and sTfR, cellular iron uptake occurs (i.e., transferrin–iron complex endocytosis), then sTfR is released into the circulation [9, 16]. Intracellular demands of iron and erythropoietic activity are known to be the principal regulators of sTfR expression. Therefore, its higher synthesis as well as higher circulating levels of sTfR are increased in the case of iron deficiency. Unlike ferritin and transferrin, sTfR levels are considered not to be influenced by inflammation [11, 16].
Although the majority of studies on the associations between iron homeostasis biomarkers and IR were conducted in the adult population [9–11] and reported discrepant results, such research in youngsters is scarce [12–14], especially in late adolescents, as a vulnerable population group.
Hence, having in mind a smaller number of studies conducted in the pediatric population compared to adults, as well as the inconclusive results considering this issue, we aimed to gain a deeper knowledge into the complex pathophysiological mechanisms related to IR. Since inflammation and adipokines may also have an impact on insulin signaling pathways, in addition to several parameters of iron homeostasis (i.e., ferritin, transferrin, sTfR and their indexes (sTfR/ferritin index and sTfR/log ferritin index)), we also included well-established inflammation biomarker (i.e. high sensitivity C-reactive protein (hsCRP)) and adipokine (i.e. retinol-binding protein 4 (RBP4)) to explore their joint effect on IR in the cohort of adolescent girls. Importantly, to our knowledge, no previous study has explored the mutual effect of adipokines, inflammation indices, and iron homeostasis parameters on IR.
Material and methods
Study population
A total of 60 adolescent girls who voluntarily agreed to participate were included in this case control study. The inclusion and exclusion criteria were described elsewhere [17]. In brief, girls older than 16 but younger than 19 years (i.e. girls from the third and fourth grade of two secondary schools in Podgorica) were included. Those girls who reported acute/chronic inflammatory disease, diabetes, hypothyroidism, hyperthyroidism, conditions that could affect body iron stores, as well as any medication used, were excluded. Those who reported being smokers or having consumed alcohol were also excluded to eliminate other potential bias factors related to inflammation.
The research was approved by the Ethical Committee of the Primary Health Care Center-Podgorica, Montenegro, following the ethical principles of the Helsinki Declaration. All girls provided signed informed consent. Parental written consent was also obtained for girls younger than 18 years.
Anthropometric measurements
Body weight (kg), waist circumference (WC) (cm) and body height (cm) were taken in the morning. WC was measured at the midpoint between the lowest rib and the iliac crest using tape over the abdomen without clothes. The non-stretchable tape was parallel to the floor without compressing the skin. Measurements were performed at the end of normal expiration. Body weight was measured to the nearest 0.1 kg on a balance beam scale. Girls were wearing light clothing and were without shoes. Height was measured to the nearest 0.1 cm using a stadiometer. For such purposes girls were also barefoot. Body mass index (BMI) was calculated as follows: weight (kg) divided by height in meters squared (kg/m2) [18].
Adolescent girls with 30 > BMI ≥ 25 kg/m2 were considered to be overweight, whereas girls with BMI ≥ 30 kg/m2 were considered as obese. However, for simplicity we included all those girls in one group called the overweight/obese group (i.e. with BMI ≥ 25 kg/m2), whereas girls with BMI < 25 kg/m2 were regarded as normal weight.
Biochemical analyses
Venipuncture sampling was performed in the morning after an overnight fast of at least 8 h, as previously stated [17]. Serum levels of RBP4, hsCRP, ferritin, transferrin, and sTfR were measured immunonephelometrically (Behring Nephelometer Analyzer, Marburg, Germany). Standardized procedures were used for determination of serum levels of glucose, total protein, iron, and creatinine, and these analyses were measured on an automatic analyzer (Roche Cobas 400, Mannheim, Germany). Serum insulin was determined by chemiluminescent immunometric assay (AxSYM, Abbott, Abbott Park, Illinois, USA). Homeostasis model assessment of insulin resistance (HOMA-IR) [18], sTfR/ferritin index [19], and sTfR/log ferritin index [16] were calculated.
Statistical analysis
After testing the data distribution with the Shapiro-Wilk test, normally distributed continuous variables were expressed as the mean ± standard deviation and skewed distributed continuous variables as medians and interquartile ranges. Comparisons between groups were analyzed by Student’s t-test and the Mann-Whitney U test dependent on data distribution. Categorical variables were presented as absolute frequencies. Non-parametric correlations between HOMA-IR and general demographic and laboratory data were tested with Spearman’s correlation analysis. Those variables were given as a correlation coefficient (ρ). Associations between HOMA-IR and tested variables were further analyzed by binary logistic regression analysis. The dependent categorical variable was HOMA-IR given as follows: 0 – HOMA-IR < 2.5 and 1 - HOMA-IR ≥ 2.5. Variables that were significantly correlated with HOMA-IR in Spearman’s correlation analysis were afterwards analyzed in a multivariate binary regression analysis to determine their possible independent associations with HOMA-IR. The data from regression analyses were given as odds ratio (OR) and 95% confidence intervals (CIs). Principal component analysis (PCA) [20] with varimax-normalized rotation was applied to cut the number of variables (which significantly correlated with HOMA-IR) in several significant factors. The criterion for factor extraction was its value > 1, and factor loadings > 0.5, and both were used for inclusion of variables. Finally, the number of factors was fixed at 3. This analysis revealed the scores for significant factors, which were used in the subsequent Mann-Whitney U test to estimate the difference between factor groups related to lower vs. higher HOMA-IR values (i.e., < 2.5 vs. ≥ 2.5). P-values < 0.05 were considered statistically significant. Statistical analysis was carried out using IBM SPSS Statistics version 22 software (IBM Corp., United States).
Results
Adolescent girls with HOMA-IR ≥ 2.5 had higher BMI and WC than girls with HOMA-IR < 2.5 (Table I). Moreover, they had significantly higher hsCRP, RBP4, transferrin, sTfR, and ferritin levels.
Table I
General demographic and laboratory data in adolescent girls
| Parameter | HOMA-IR < 2.5 | HOMA-IR ≥ 2.5 | P-value |
|---|---|---|---|
| Adolescent girls, no. | 40 | 20 | |
| Age [years] | 18 (17–19) | 18 (16–19) | 0.535 |
| Weight [kg] | 64.5 (60.0–70.5) | 78.5 (68.5–96.0) | 0.002 |
| Height [cm] | 169 (166–173) | 168 (165–177) | 0.900 |
| BMI [kg/m2] | 22.6 (20.1–25.5) | 27.5 (25.2–31.5) | 0.001 |
| WC [cm] | 79.0 (73.5–87.0) | 96.0 (87.5–103.5) | < 0.001 |
| Glucose [mmol/l]* | 5.05 ±0.37 | 5.29 ±0.63 | 0.066 |
| Total proteins [g/l] | 73 (71–74) | 73 (70–74) | 0.624 |
| hsCRP [mg/l] | 0.44 (0.23–0.91) | 1.10 (0.56–2.05) | 0.002 |
| RBP4 [mg/l] | 28 (26–32) | 35 (29–41) | 0.004 |
| Fe [μmol/l] | 19.5 (13.2–25.1) | 12.6 (6.9–17.4) | 0.051 |
| Transferrin [g/l]* | 2.53 ±0.35 | 2.80 ±0.39 | 0.008 |
| sTfR [mg/dl]* | 12.08 ±2.37 | 14.60 ±3.91 | 0.003 |
| Ferritin [μg/l] | 23.8 (19.7–30.8) | 36.2 (20.0–40.9) | 0.047 |
| sTfR/ferritin index | 0.49 (0.35–0.61) | 0.37 (0.32–0.63) | 0.355 |
| sTfR/log ferritin index | 8.47 (7.35–10.32) | 9.10 (7.75–11.46) | 0.259 |
| Insulin [IU/ml] | 4.05 (3.40–6.80) | 16.15 (13.90–24.00) | < 0.001 |
| HOMA-IR | 0.90 (0.78–1.53) | 3.44 (3.09–5.95) | < 0.001 |
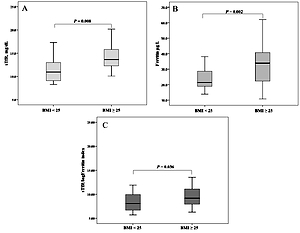
Furthermore, when girls were divided according to BMI, we observed significantly higher levels of sTfR and ferritin, as well as sTfR/log ferritin index in the overweight/obese group (i.e., BMI ≥ 25 kg/m2) (p = 0.008, p = 0.002, p = 0.036, respectively), compared to normal weight counterparts (i.e., BMI < 25 kg/m2) (Figure 1).
Figure 1
Iron status markers in normal weight (BMI < 25 kg/m2) and overweight/obese adolescent girls (BMI ≥ 25 kg/m2)
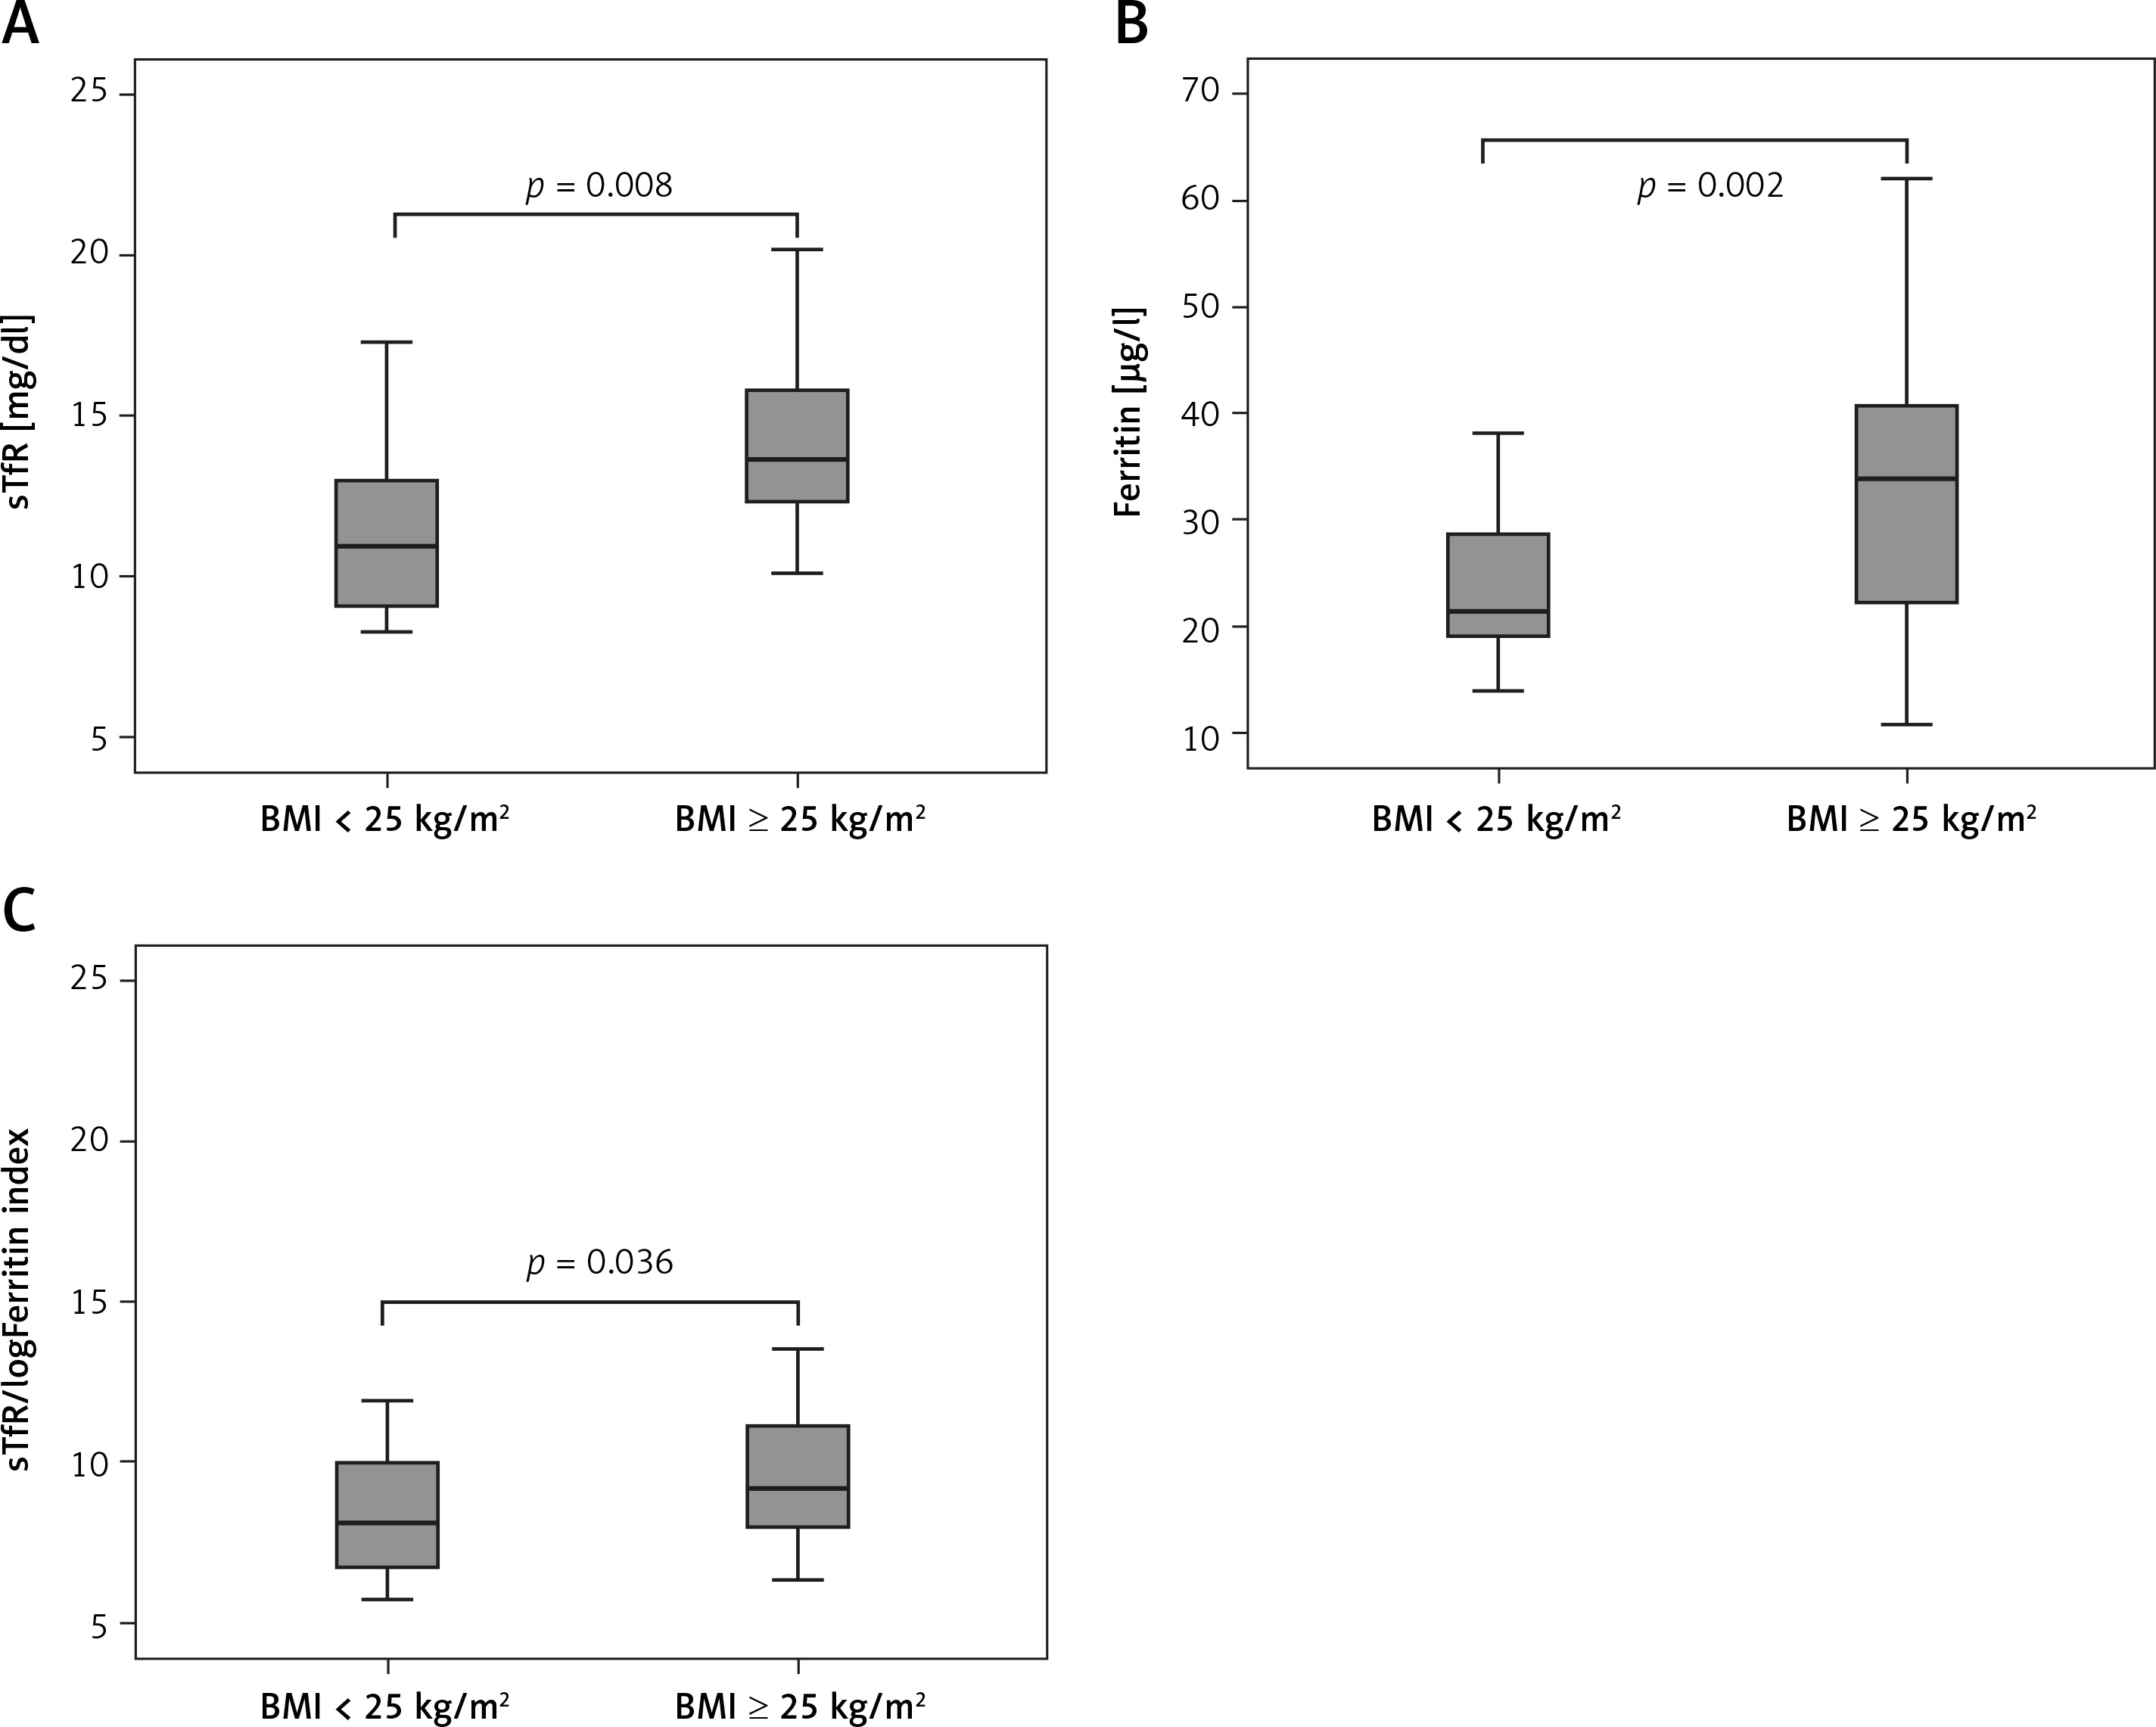
In contrast, no significant difference in transferrin and sTfR/Ferritin index between these groups was observed (data not presented).
Correlation coefficients given in Table II revealed significant positive correlations between HOMA-IR and weight, BMI, WC, glucose, hsCRP, RBP4, sTfR, and ferritin.
Table II
Correlation coefficients of HOMA-IR with tested markers in examined female adolescents
We further evaluated the ability of inflammation and iron status markers to discriminate between HOMA-IR groups (Table III). Predictors that were significantly correlated with HOMA-IR in Spearman’s correlation analysis were tested by binary regression analysis. Ferritin, sTfR, hsCRP, and RBP4 were significant predictors of higher HOMA-IR (Table III). Nagelkerke R2 [21] revealed that each predictor in univariate analysis (hsCRP, RBP4, sTfR, and ferritin) could explain the variation in HOMA-IR by 19.5%, 24.1%, 19.0% and 13.5%, respectively. Additionally, independent associations of predictors of HOMA-IR by multivariate regression analysis were assessed. Firstly, we performed an adjustment for WC as a marker highly related to HOMA-IR (Model 1). Only sTfR levels remained positively associated with higher HOMA-IR. Finally, all predictors and WC were included in Model 2. sTfR retained its independence in the prediction of higher HOMA-IR. Explained variation of Model 2 in HOMA-IR was close to 50%.
Table III
Univariate and multivariate binary logistic regression analysis for the associations of laboratory data and HOMA-IR in female adolescents
PCA was performed to obtain groups of a smaller number of factors related to the same level of variability. It extracted the larger number of biomarkers which significantly correlated with HOMA-IR.
This analysis emphasized 3 different factors explaining 66% of variance of the tested parameters (Table IV). The largest percent of variance (38%) was shown by the obesity-inflammation related factor with positive loadings of WC and hsCRP. The second factor explained 17% of the variation and consisted of iron homeostasis parameters (i.e., transferrin and sTfR, both with positive loadings), and the adipokine-acute phase protein related factor explained 11% of the variation (i.e., RBP4 and ferritin, both parameters with positive loadings).
Table IV
Principal component analysis of extracted factors connected with HOMA-IR
Mann-Whitney U test enabled us to estimate the difference between factor groups related to lower vs. higher HOMA-IR values. Our analysis showed that the obesity-inflammation related factor and adipokine-acute phase protein related factor significantly differentiated between lower and higher HOMA-IR values (Table V).
Table V
Mann-Whitney U test for the difference between factor groups related to higher HOMA-IR values
Discussion
As far as we know, the current study is the first to investigate the mutual influence of adipokine (i.e. RBP4), inflammation biomarker (i.e. hsCRP), and iron homeostasis indices on HOMA-IR to get a better insight into the IR status through multiple different pathways. Moreover, it is one of the few to examine iron homeostasis parameters in relation to IR (as determined with HOMA-IR) in an exclusively late adolescent population.
Univariate analysis in our current study revealed that ferritin, sTfR, hsCRP, and RBP4 were significant predictors of HOMA-IR (Table III). However, after multivariate regression analysis, only sTfR levels were independently correlated with HOMA-IR. This relationship was independent of obesity status, since adjustment for WC was performed (Table III, Model 1).
Our results of the relationship between sTfR and HOMA-IR are in accordance with several studies in European adult populations [9, 10]. The meta-analysis of Liu et al. [11] that included 12 cohort and case-control studies showed that higher serum ferritin level was related to the risk of type 2 diabetes, whereas sTfR/ferritin ratio was inversely associated with the risk of type 2 diabetes. Similar findings (i.e., an inverse relationship between sTfR/ferritin level and HOMA-IR) were obtained in Austrian adolescent girls, but not in boys of similar age [12].
Despite the relatively small sample size in our study, we included only normal weight and overweight/obese girls of a narrow age range (between 16 and 19 years) who reported no other diseases, as well as no medications, tobacco or alcohol use. Therefore, we aimed to diminish any potential confounding factors that might have an influence on inflammation level and IR. In contrast, a study conducted in a young population with obesity and with a smaller sample size than ours reported no difference in sTfR levels between patients with impaired glucose tolerance/type 2 diabetes and the corresponding control group [13]. The authors of the mentioned study presumed that the degree of obesity, rather than impaired glycemia, is the determinant of sTfR levels in circulation.
However, in a recent large cohort of Chinese children and adolescents between 7 and 18 years of age, except for ferritin, no difference in sTfR and transferrin levels between overweight/obese and non-obese children was reported. Interestingly, these markers of iron homeostasis (i.e., transferrin and sTfR) were negatively associated with the risk of dyslipidemia in the examined youngsters [14]. Another earlier study that encompassed Chinese children and adolescents of a similar age range as the latter one reported that higher serum transferrin was positively associated with HOMA-IR, but no such relationships between HOMA-IR and ferritin or sTfR levels were found. Surprisingly, they found an inverse association between sTfR and glycated hemoglobin (HbA1c) [22].
Similarly, a study that included Korean children also reported no association of serum sTfR and ferritin levels with HOMA-IR [23].
Although ours is the first study to report an independent association between sTfR and HOMA-IR in the adolescent population, our results are comparable with those in adults. Namely, in a cohort of adults with obesity, it was found that increased sTfR levels are related to an increased risk for type 2 diabetes occurrence [24]. Indeed, a relationship between polymorphisms of transferrin receptor genes (rs3817672, 210AG, S142G) and type 2 diabetes was found [25]. Moreover, Suárez-Ortegón et al. [9] in a relatively large sample of Croatian population found no association between sTfR and metabolic syndrome components, except for HOMA-IR. Similarly, the results of the study of Huth et al. [10] in a large sample of German adults reported an association between sTfR and HOMA-IR, suggesting that high insulin levels might cause higher sTfR. In line with this, a significant decrease in sTfR levels in parallel with reversing insulin resistance after an exercise program in obese women was reported [26]. In addition, it was found that upregulation of erythropoiesis and the consequent increase in sTfR were influenced by insulin [27].
To further clarify the association between obesity-related inflammation and iron homeostasis indices with IR, we included in the analysis hsCRP and RBP4, biomarkers that are increased in the obese state [28, 29]. Indeed, we reported their independent association with HOMA-IR in the current study. When we included all predictors (hsCRP, RBP4, ferritin, and sTfR, as well as WC) in the multivariate regression analysis, sTfR still retained its independence in the prediction of HOMA-IR (Table III, Model 2). The PCA in our study revealed 3 group factors related to HOMA-IR. The largest percent of variance (38%) was shown by the obesity-inflammation related factor (i.e., WC and hsCRP), followed by the second factor, the iron homeostasis parameters related factor (i.e., transferrin and sTfR), which explained 17% of the variation and the third, the adipokine-acute phase protein related factor (i.e., RBP4 and ferritin), which explained 11% of the variation (Table IV). However, only the first (i.e., WC and hsCRP) and the third group factor (i.e., RBP4 and ferritin) showed significant difference between HOMA-IR < 2.5 and HOMA-IR ≥ 2.5 (Table V). On the other hand, among the 3 examined iron status biomarkers (i.e., ferritin, transferrin and sTfR), transferrin was the weakest predictor of HOMA-IR. This may explain why the iron homeostasis parameter related factor (which included the joint effect of transferrin and sTfR) did not differentiate between HOMA-IR < 2.5 and HOMA-IR ≥ 2.5.
HsCRP and ferritin levels are regarded as acute-phase reactants, which are found to be higher in the obesity-related inflammatory state [15, 28, 30]. In line with this, a positive association between sTfR and CRP was reported previously [31]. Another possible explanation of our findings might involve serum levels of hepcidin (i.e., a liver- and adipose tissue-derived acute phase reactant), which are increased in obesity [15]. Since hepcidin regulates iron homeostasis, it is speculated that its increased expression in obesity inhibits iron absorption in the intestine and mobilization from stores in the liver, with consequent reduced iron levels in the circulation and increased iron stores [15]. The proposed mechanism is that obesity-induced inflammation enhances the expression of hepcidin through the interleukin-6-signal transducer and activator of transcription-3 pathway [32], thus reducing iron levels and consequently increasing ferritin and sTfR in circulation [15].
Discordant results in previous studies, in addition to the variation in sample size, gender distribution, and ethnic background, might also be attributed to different assays for measurement of sTfR and other iron homeostasis markers (e.g., immunoturbidimetry, immunonephelometry, electrochemiluminescence assays) [9, 10, 32]. Since no assay standardization for sTfR exists and regarding the presence of its different cut-off levels, the interpretation of sTfR in clinical practice is limited [33, 34]. Therefore, a better understanding of the factors that modulate sTfR is of great importance in future studies.
Besides the small sample size and cross-sectional nature of this study, there is another limitation that needs to be mentioned. Namely, like many previous studies, we were limited in the dietary intake assessment, since it could affect, at least in part, iron stores and examined iron homeostasis markers. However, we excluded many bias factors that could influence inflammation status, as previously mentioned. Further studies with a larger sample size and both genders included, as well as with a longitudinal design, are needed to validate our results and to examine the causal relationship between the indices of iron homeostasis and insulin resistance. Better insights into the pathophysiological processes of iron deficiency status and obesity-related disturbances are needed to find the most reliable therapeutic approach to the consequences of obesity.
In conclusion, this is the first study to examine the mutual influence of adipokine (i.e., RBP4), an inflammation biomarker (i.e., hsCRP), and iron homeostasis indices on HOMA-IR. It is also the first one in the adolescent population to report a relationship between sTfR and HOMA-IR, as a surrogate marker of insulin resistance. This relationship is independent of obesity (as determined by WC). Moreover, factorial analysis showed that the obesity-inflammation related factor (i.e., WC and hsCRP) and adipokine-acute phase protein related factor (i.e., RBP4 and ferritin) showed significant difference between HOMA-IR < 2.5 and HOMA-IR ≥ 2.5.