Introduction
Kidney transplantation is the preferred treatment for end-stage kidney disease [1]. Long-term graft survival remains a major challenge in renal transplantation despite advancements in short-term outcomes. A key modifiable factor that greatly influences graft survival is medication non-adherence (MNA) [2, 3]. MNA is widely recognized as a major contributor to graft loss, rejection, and mortality in renal transplant recipients [4]. Younger age, depression, low health literacy, and complex medication regimens contribute to MNA [2, 4, 5].
Smartphone addiction (SPA) is characterized by compulsive smartphone use despite negative consequences, impairing self-regulation and cognitive function [6]. SPA is linked to mental health issues such as anxiety and depression, as well as physical effects such as sleep disruption and increased sedentary behavior [6–9]. Severe SPA disrupts executive functions, including time management, attention, and impulse control, which are essential for medication adherence [10–12].
Psychological and socioeconomic factors are well-recognized contributors to MNA, yet the influence of modern digital behaviors, such as excessive smartphone use, remains largely unexplored. Existing research primarily highlights the short-term benefits of smartphone applications in promoting medication adherence through structured interventions. However, these interventions often lose effectiveness over time, and their long-term impact remains unclear [2, 13].
Evidence suggests that SPA and MNA share overlapping behavioral mechanisms. Based on these insights, we propose that SPA may be a risk factor for MNA in renal transplant recipients. This cross-sectional study provides the first investigation of the association between SPA and MNA in renal transplant recipients.
Material and methods
Participants
This cross-sectional study was conducted at the Gazi University Faculty of Medicine Transplant Outpatient Unit between July and October 2024 and included only renal transplant recipients. Participants were consecutively recruited during routine clinic visits, and all eligible individuals were invited to participate.
The inclusion criteria required participants to be over 18 years of age, under follow-up as renal transplant recipients for at least 12 months, own a smartphone, have adequate cognitive capacity to complete the questionnaires and provide informed consent.
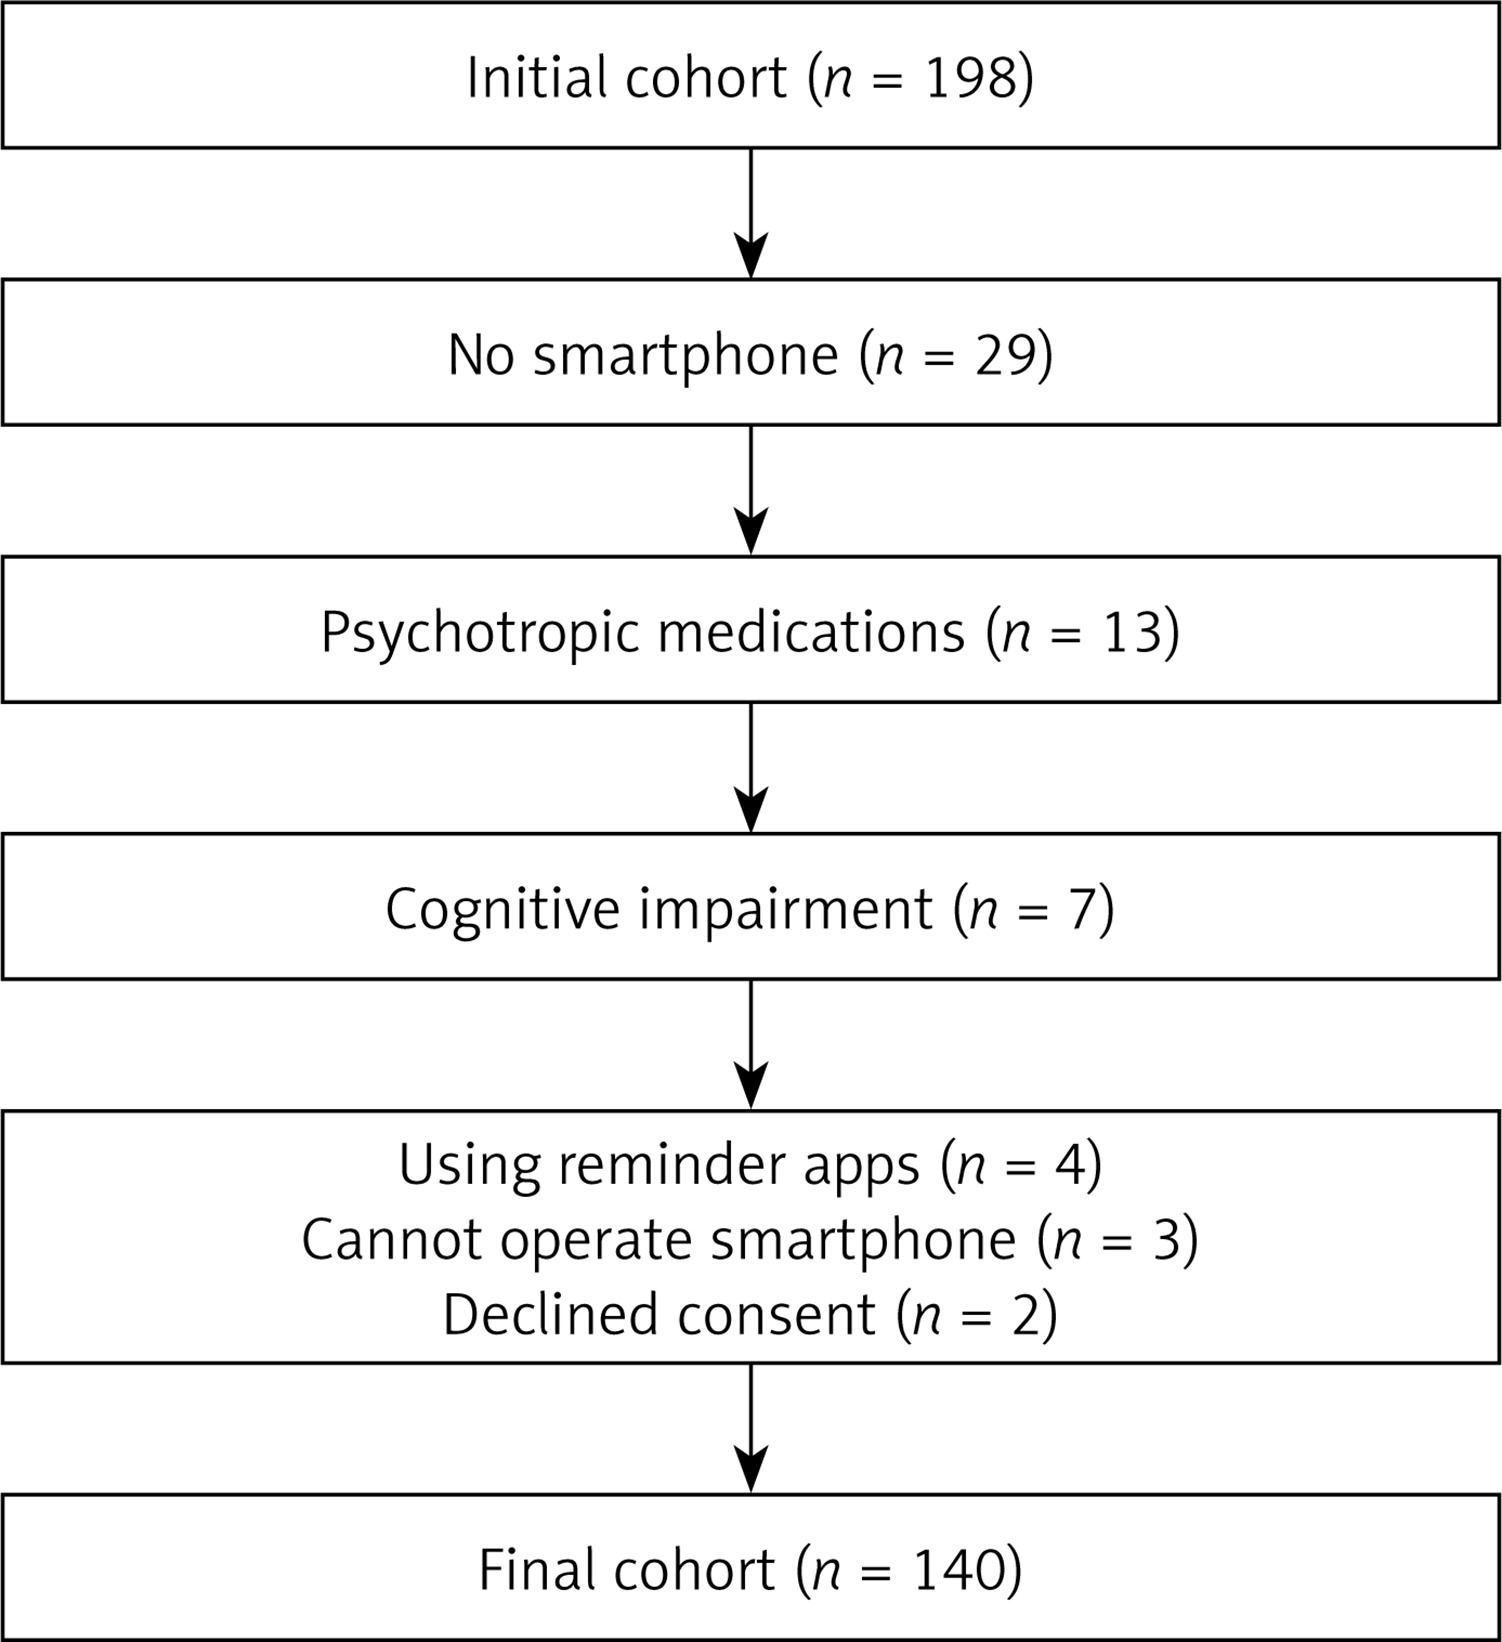
Exclusion criteria included individuals under 18 years, those declining informed consent, non-smartphone users or those unable to operate a smartphone independently, patients with cognitive impairments or mental health conditions preventing questionnaire completion, current use of medication reminder apps, and individuals prescribed psychotropic medications, including but not limited to antidepressants, antipsychotics, benzodiazepines, or mood stabilizers, which may affect cognitive function. The recruitment process is presented in a flowchart (Figure 1).
Data collection
Demographic and clinical data, including age, gender, marital status, literacy level, economic status, donor type (living or deceased), transplant type (preemptive or non-preemptive), dialysis vintage for non-preemptive transplants, history of rejection, comorbidities, current creatinine, estimated glomerular filtration rate (eGFR, CKD-EPI 2021), immunosuppressive therapy (IS) burden, and total pill burden, were extracted from patient charts. Complete data were available for all variables.
Smartphone addiction was assessed using the Smartphone Addiction Scale-Short Version (SAS-SV), developed by Kwon et al. in 2013 as a shorter version of the original scale [14]. The SAS-SV consists of 10 items, each scored up to 6 points, with higher scores indicating a greater risk of smartphone addiction. The scale has been validated for the Turkish population [15]. This study used the cohort‘s mean score as the cut-off for addiction risk. Participants‘ weekly screen times (hours) were retrieved from their smartphones as another measure of addiction or misuse. Weekly screen time was dichotomized using the cohort mean to create high and low exposure groups for statistical analysis.
Adherence to immunosuppressive therapy was evaluated using the Immunosuppressant Therapy Adherence Scale (ITAS), adapted for transplant recipients by Chisholm et al. in 2005 [16]. The ITAS consisted of four questions assessing adherence behavior over the past 3 months, with response categories of 0%, 1–20%, 21–50%, and over 50%. Scores range from 0 to 12, where higher scores indicate better adherence. The scale was validated for Turkish populations by Madran et al. [17]. Although the original ITAS scoring classifies only a score of 12 as full adherence, alternative categorizations classify 12 as perfect adherence, 10–11 as acceptable adherence, and 0–9 as non-adherence [18]. This alternative scoring was adopted in this study, as minor deviations in adherence are frequent among transplant recipients and may not impact clinical outcomes [19]. Furthermore, the original scoring approach potentially overestimates non-adherence, whereas this adjusted categorization accurately reflects adherence patterns, as highlighted by Promraj et al. [20].
Terminology
Terminology for smartphone-related behaviors remains inconsistent, with terms such as excessive use, problematic use, and addiction often used interchangeably [21, 22]. This paper uses smartphone addiction (SPA) as an umbrella term for these related concepts.
Statistical analysis
Data were analyzed using SPSS v22.0. Descriptive statistics included means and standard deviations for continuous variables and frequencies and percentages for categorical variables. The Shapiro-Wilk test assessed normality. For group comparisons, independent t-tests or Mann-Whitney U tests were applied to continuous variables, while χ2 tests were used for categorical variables, with Bonferroni‘s correction for post-hoc evaluations if needed. Pearson‘s correlation was used for normally distributed variables and Spearman‘s correlation for non-normal data. Correlation strength was classified as weak (< 0.3), moderate (0.3–0.7), or strong (> 0.7) [23]. A p-value < 0.05 was considered significant.
Univariate analyses evaluated associations between potential predictors and MNA. Variables with p < 0.1 in univariate analysis were entered into the multivariate logistic regression model to identify independent predictors of MNA and SPA. Adjusted odds ratios (ORs) and 95% confidence intervals (CIs) were reported for significant associations.
The sample size was calculated using Cochran‘s formula, based on an estimated 10% prevalence of smartphone addiction among renal transplant recipients and a 5% margin of error. With a 95% confidence level, the required sample size was 138 participants, ensuring sufficient power to detect associations.
This cross-sectional study was reported in accordance with STROBE guidelines.
Results
Patient characteristics
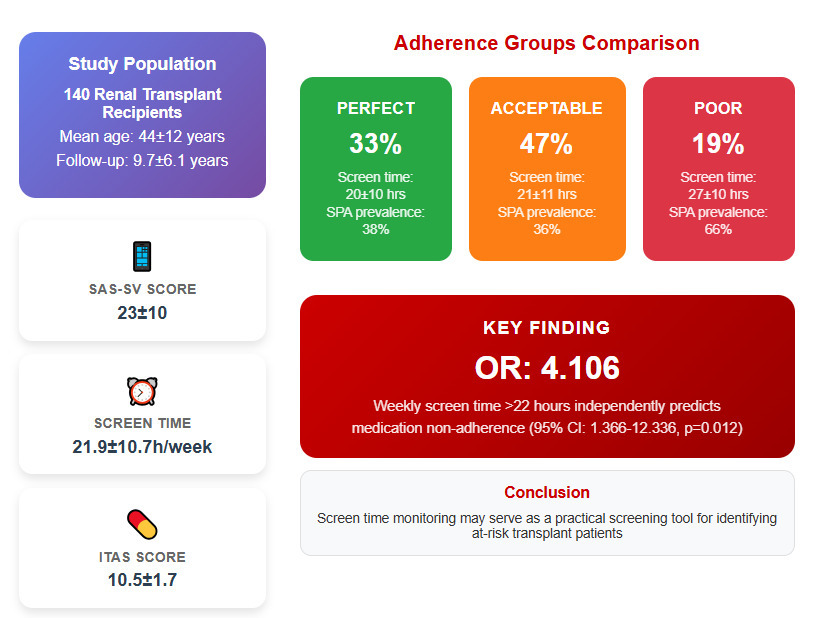
The study included 140 renal transplant recipients, with a mean age of 44 ±12 years. The majority were male (60%) and married (72.9%). Educational levels varied, with 48.6% having a university degree or higher, 39.3% completing middle or high school, 11.4% attending elementary school, and 0.7% being illiterate. The income distribution was 25.7% low, 47.9% middle, and 26.4% high.
Hypertension was the most common comorbidity, affecting 67% of participants. Diabetes mellitus was present in 17%, while 7% had post-transplant diabetes. Coronary artery disease affected 10% of patients, and 22.9% were active smokers (Table I).
Table I
Patient characteristics
Transplant characteristics and medication burden
Most transplants were from living donors (79.3%), with 26.4% being preemptive. The mean duration of renal replacement therapy prior to transplantation was 4.9 ±4.6 years, while the average post-transplant follow-up period was 9.7 ±6.1 years.
Eleven (7.9%) patients had undergone a second transplant, and 17.1% had experienced rejection episodes. The mean daily immunosuppressive pill burden was 7 ±2 pills, with a total daily pill burden of 11 ±4. The mean serum creatinine level was 1.36 ±0.74 mg/dl, and the mean eGFR was 69.0 ±24.2 ml/min (Table II).
Table II
Transplant-related patient characteristics
| Characteristic | Results |
|---|---|
| Donor type (living/deceased) | 111/29 (79.3/20.7%) |
| Preemptive transplantation (yes) | 37 (26.4%) |
| Years of RRT before transplant* | 4.9 ±4.6 (1–20) |
| Transplant duration | 9.7 ±6.1 (1–32) |
| Second transplant (yes) | 11 (7.9%) |
| History of rejection episode | 24/116 |
| Immunosuppressive pill burden** | 7 ±2 (3–14) |
| Total pill burden** | 11 ±4 (5–28) |
| Creatinine [mg/dl] | 1.36 ±0.74 |
| eGFR (CKD-EPI 2021) [ml/min] | 69.0 ±24.2 |
Smartphone usage patterns and adherence levels
The mean SAS-SV score was 23 ±10, with 42% scoring above this threshold, indicating a higher risk of smartphone addiction. Weekly screen time averaged 21.9 ±10.7 h, with 40% exceeding 22 h per week. Social media was the primary use of smartphones for 59% of participants, followed by entertainment and education, at 17% each (Table III).
Table III
Smartphone addiction and drug adherence scores
| Characteristic | Results |
|---|---|
| SAS-SV score | 23 ±10 (10–56) |
| SAS-SV score | |
| > 23 | 60 (42%) |
| ≤ 23 | 80 (58%) |
| Weekly screen time on phone [h] | 21.9±10.7 |
| Weekly screen time on phone [h] | |
| > 22 | 57 (40%) |
| ≤ 22 | 83 (60%) |
| Most common use of smartphone* | |
| Entartainment | 25 (17%) |
| Gaming | 7 (5%) |
| Social media | 83 (59%) |
| Education | 25 (17%) |
| ITAS score | 10.5±1.7 |
| ITAS score* | |
| 12 (perfect adherence) | 47 (33%) |
| 10, 11 (acceptable adherence) | 66 (47%) |
| ≤ 9 (non-adherence) | 27 (19%) |
Regarding medication adherence, the mean ITAS score was 10.5 ±1.7; 33% of participants showed perfect adherence, 47% showed acceptable adherence, and 19% were classified as non-adherent (Table III).
Demographic and transplant-related factors across adherence groups
As shown in Table IV, demographic factors, including age, sex, marital status, educational level, and income, did not differ significantly across adherence groups (all p > 0.05). While the proportion of unmarried participants was higher in the poor adherence group compared to the other groups, this difference was not statistically significant.
Table IV
Demographic, transplant, and clinical characteristics by adherence group
Transplant-related characteristics, such as donor type, history of rejection, preemptive transplantation, and duration of renal replacement therapy or transplant follow-up, were similarly distributed across all adherence groups. Clinical parameters, including immunosuppressive pill burden, total pill burden, serum creatinine levels, and eGFR, also showed no significant differences between the groups (all p > 0.05).
Smartphone addiction and screen time by adherence level
SAS-SV and weekly screen time both demonstrated significant differences across adherence groups. The poor adherence group had a higher mean SAS-SV score (28 ±10) compared to the perfect (22 ±9) and acceptable adherence groups (22 ±11), with post-hoc analysis revealing significant differences between the poor and perfect adherence groups (p = 0.039) as well as between the poor and acceptable adherence groups (p = 0.018).
A significantly higher proportion of patients in the poor adherence group exceeded the SAS-SV threshold score of 23 (66% vs. 38% in the perfect and 36% in the acceptable adherence groups, p = 0.020).
Weekly screen time was also significantly elevated in the poor adherence group (27 ±10 h) compared to the perfect (20 ±10 h, p = 0.021) and acceptable adherence groups (21 ±11 h, p = 0.024). Additionally, 74% of patients in the poor adherence group reported screen time exceeding 22 h per week, in contrast to 34% in the perfect adherence group and 31% in the acceptable adherence group (p < 0.001) (Table V). Spearman‘s correlation analysis revealed a weak but significant inverse association between medication non-adherence levels and SAS-SV scores, weekly screen time, and related variables (Table VI).
Table V
Smartphone addiction and usage patterns by adherence group
Factors influencing medication non-adherence
Univariate analysis identified several significant predictors of MNA. Higher SAS-SV scores were inversely associated with adherence (OR = 0.947, 95% CI: 0.911–0.985, p = 0.006), as was weekly screen time (OR = 0.949, 95% CI: 0.915–0.986, p = 0.006). Participants with SAS-SV scores above 23 were significantly more likely to exhibit MNA (OR = 3.381, 95% CI: 1.393–8.204, p = 0.007), while those with weekly screen time exceeding 22 h showed the strongest association (OR = 5.869, 95% CI: 2.278–15.117, p < 0.001).
In multivariate analysis, only weekly screen time exceeding 22 h remained a significant independent predictor of MNA (Model 2: OR = 4.106, 95% CI: 1.366–12.336, p = 0.012). Other variables, including age and marital status, lost significance after adjustment (Table VII).
Table VII
Univariate and multivariate analysis of factors influencing MNA
Discussion
This study is the first to demonstrate that SPA is associated with MNA in renal transplant recipients, with objectively measured screen time emerging as a stronger predictor than self-reported addiction scores. Although SPA cannot be the sole determinant of MNA, our findings highlight its role as a behavioral factor that warrants further study.
Patients with poor adherence exhibited significantly higher weekly screen time and SAS-SV scores. In univariate analysis, both SAS-SV scores and weekly screen time were associated with MNA; however, in multivariate models, only weekly screen time > 22 h remained a significant independent predictor (OR = 4.106, p = 0.012), whereas SAS-SV scores lost statistical significance (p = 0.206). This finding highlights that screen time, rather than perceived addiction, may be a more reliable predictor of adherence. A similar distinction was demonstrated by Anderl et al., who showed that logged screen use more accurately predicted psychosocial outcomes than self-reported estimates [23].
Correlation analysis reinforces these findings, demonstrating weak but statistically significant negative associations between adherence levels, SAS-SV scores (r = –0.181, p = 0.032), and weekly screen time (r = –0.197, p = 0.020). These findings reinforce that MNA is multifactorial rather than driven by a single behavioral determinant [2].
Younger age is frequently cited as a risk factor for non-adherence, particularly among adolescents and young adults [10, 24–26]. Among adolescents and young adults, non-adherence has been reported to account for 44% of graft losses and 23% of late acute rejection episodes [2, 25]. Our study, which included only adults, did not support this association, likely due to the absence of younger participants. It is possible that the association between younger age and non-adherence would be more pronounced in a cohort including adolescents.
The role of demographic and transplant-related factors, including donor type, rejection history, preemptive transplantation, and pill burden, in MNA remains debated, with conflicting evidence in the literature [27–30]. In our study, these variables did not significantly differ between adherence groups, suggesting that traditional clinical risk factors alone may not fully explain MNA in our cohort.
The prevalence of MNA in the literature ranges from 10% to 60%, influenced by specific questionnaires, criteria, and populations examined [2, 5, 28, 31, 32]. The consistent results observed in two studies conducted in our country support the validity of our findings, with 23% of patients being classified as non-adherent [27, 29].
SPA has been associated with cognitive impairments in attention, impulse control, time management, and structural brain changes in some studies [11, 12, 33–35]. These cognitive disruptions could lead to missed medication doses, particularly in patients with complex regimens. Additionally, excessive smartphone use disrupts sleep patterns, possibly impacting adherence [9, 36, 37].
A key strength of this study is the use of objectively recorded screen time rather than relying solely on self-reported SPA measures. According to Judice et al., self-reported screen time underestimates actual usage by over 70 min daily, reinforcing the need for objective metrics [38]. Prior research indicates a strong association between increased screen time and negative behavioral health outcomes, supporting screen time as a relevant behavioral marker in adherence research [39, 40]. However, although screen time offers an objective measure, it does not differentiate between productive (e.g., educational or medically relevant) and unproductive (e.g., social media or gaming) use [41]. Future studies should incorporate app-specific tracking to better capture these distinctions.
Some studies suggest that e-health applications can improve medication adherence; however, their long-term effects on clinical outcomes remain uncertain [42]. Hartch et al. demonstrated that a medication adherence app significantly enhanced adherence and self-efficacy among medically underserved adults with chronic illnesses, although they stated that their approach‘s impact on long-term clinical outcomes was not established [13]. Only 4 out of 198 (≈2%) of our initial cohort reported using applications to enhance medication adherence (Figure 1). We believe omitting these patients did not have any impact on our results. However, further trials may show the help of apps in renal transplant recipients.
The low percentage of medication app users (≈2%) in our cohort is primarily a function of age and educational demographics, as digital health tool adoption typically requires structured interventions rather than spontaneous uptake. Research demonstrates that only 2.6% of adults aged 62+ use medication reminder apps, with older patients showing significantly lower adoption rates [43]. Furthermore, patients with chronic diseases paradoxically show lower app adoption rates (6.6%) compared to healthy individuals (38.9%), despite greater need for medication management tools [44]. This suggests that structured digital health interventions with demographic-specific support may be necessary to overcome adoption barriers in transplant populations.
Mitigation strategies for SPA, including behavioral interventions, structured usage plans, and controlled smartphone use, could help reduce its negative impact. Studies show both successful and unsuccessful interventions [45]. Olson et al. implemented a nudge-based approach – such as disabling notifications, setting the screen to grayscale, and keeping phones out of reach – that reduced problematic smartphone use and screen time in the short term; however, long-term adherence and effects on depression diminished over time [46].
Smartphone-based adherence interventions have shown promising but variable results: the SMASK (Smartphone Medication Adherence Saves Kidneys) trial’s pilot phase showed improved immunosuppressive adherence from 56% to 92% and reduced mean systolic blood pressure by 12 mm Hg. However, no subsequent reports have confirmed the durability of these gains [47]. A recent meta-analysis of 12 randomized trials involving 1 234 renal transplant recipients rated overall evidence as low quality due to high methodological heterogeneity, small sample sizes, and short follow-up and determined that the current evidence remains inconclusive [48]. Key barriers include fragmented IT systems, inconsistent digital literacy, and scarce long-term data. Implementing phased, small-scale pilots with dedicated teams and standardized metrics can address logistical challenges. Future multicenter randomized controlled trials with longer follow-up on hard outcomes are needed to validate durability and clinical impact [49].
One of the primary strengths of this study is its pioneering nature, as it is among the first to explore the relationship between SPA and MNA in renal transplant recipients, providing a valuable foundation for future research. Additionally, using validated scales for assessing both SPA and MNA enhances the reliability of the findings. A notable strength is the inclusion of weekly screen time as an objective, device-recorded metric, reducing reliance on potentially biased self-reported data.
This study has certain limitations that must be considered when interpreting the results. The cross-sectional design does not allow for causal inference and temporal directionality, making it unclear whether excessive smartphone use drives MNA or pre-existing behavioral tendencies contribute to both. Future longitudinal studies are needed to clarify the casuality of this relationship. Additionally, psychiatric comorbidities were not systematically assessed. While we excluded patients using psychotropic medications, undiagnosed conditions such as depression and anxiety could still have influenced smartphone use and adherence behaviors. Further research incorporating validated psychiatric assessments is warranted.
Furthermore, while screen time serves as an objective measure of smartphone engagement, it does not differentiate between productive (e.g., educational) and non-productive (e.g., excessive social media) use. Future studies should explore which specific smartphone behaviors contribute most to MNA. The weekly screen time threshold of 22 h was established using our population‘s mean, as no validated clinical thresholds exist for smartphone screen time in this context. This population-specific approach may limit generalizability, as optimal cut-offs may vary across different patient demographics and geographic regions. Although we checked for formal psychiatric diagnoses and previous medication history, we did not have the resources to conduct face-to-face psychiatric evaluations for each patient, which is a limitation of our study. Future research should incorporate systematic psychiatric assessments to better understand these potential confounding factors.
As this was a single-center study with an acceptable number of subjects, the findings may not be generalizable to all transplant populations, emphasizing the need for larger, multicenter, and longitudinal investigations.
In conclusion, this study highlights excessive smartphone use, particularly prolonged screen time, as a novel behavioral risk factor for MNA in renal transplant recipients. Incorporating screen time monitoring into routine transplant follow-up may provide a scalable method for identifying at-risk patients. Our findings suggest that routine screen time tracking could be a practical, low-burden screening tool in transplant follow-up. Given the increasing reliance on smartphones, future research should explore interventions that balance the benefits of mobile health tools with the risks of excessive digital engagement. Integrating SPA management into post-transplant care may represent an important yet overlooked strategy for improving long-term graft survival.