Introduction
Diabetes, a chronic disease, affects around 537 million adults globally and is expected to exceed 600 million by 2030, with type 2 diabetes accounting for about 90% of cases [1]. Diabetes mellitus (DM) comprises a group of chronic metabolic disorders characterized by high blood glucose levels, leading to various complications over time. Untreated DM can cause damage to blood vessels, nerves, tissues, and organs [2]. Epidemiological studies have highlighted the significant roles of genetics and lifestyle in the development of type 2 DM [3–5]. Factors such as physical inactivity, poor diet, smoking, and high body mass index contribute to the rising prevalence of diabetes. Additionally, emerging research suggests that environmental pollutants, such as perfluoroalkyl and polyfluoroalkyl substances, along with other endocrine-disrupting compounds, may impact the progression of diabetes [6].
PFASs are extensively utilized in a wide range of commercial applications, including surfactants, lubricants, and flame-retardant foams [7], due to their exceptional stability and hydrophobic and oleophobic properties. Some PFASs are also employed as polymers in various industrial and consumer products, such as waterproof coatings on textiles and non-stick coatings on kitchenware. However, PFASs are recognized as persistent organic pollutants (POPs) because of their prolonged environmental presence and resistance to degradation [8–11]. They have been found in water sources, soil, plants, animals, and humans. Human exposure to PFASs can occur through different pathways, with the main one being contact with contaminated drinking water or food [11, 12]. Several studies have indicated a potential link between PFAS chemicals, such as perfluorooctanoic acid (PFOA), perfluorooctane sulfonatfe (PFOS), and others, and various adverse health effects, including preeclampsia, altered aminotransferase levels, elevated blood lipids, reduced antibody responses to vaccines, and low birth weight. However, the causality of these associations remains to be established [13]. Gui et al. conducted a systematic review and meta-analysis of epidemiological evidence, revealing that PFAS exposure is associated with increased risk of type 2 diabetes mellitus. They specifically noted a parabolic dose-response relationship with PFOA exposure [14]. While the association between polychlorinated biphenyls (PCBs) and type 2 diabetes risk has been extensively studied over the years, the levels of PCBs in the environment and human body are gradually decreasing. As a result, there have been limited investigations into the relationship between PFASs and diabetes. Therefore, analyzing the relationship between mixed exposure to PFASs and diabetes is of significant importance.
Our study utilized data from the NHANES spanning from 2003 to 2018. To examine the association between five PFAS concentrations and diabetes, we employed a weighted multivariate logistic regression model. Prior to analysis, both ln transformation and quartile transformation were applied. Additionally, we utilized the WQS regression model to assess the relationship between mixed PFAS exposure and diabetes, allowing us to identify the specific PFAS that were more influential in the context of diabetes. To estimate the ‘mixture effect’ relationship between PFAS exposure and diabetes, we employed the quantile g-computation model. Our investigation aimed to contribute new epidemiological evidence to the field by exploring the relationship between mixed PFAS exposure and the risk of diabetes.
Material and methods
Study population
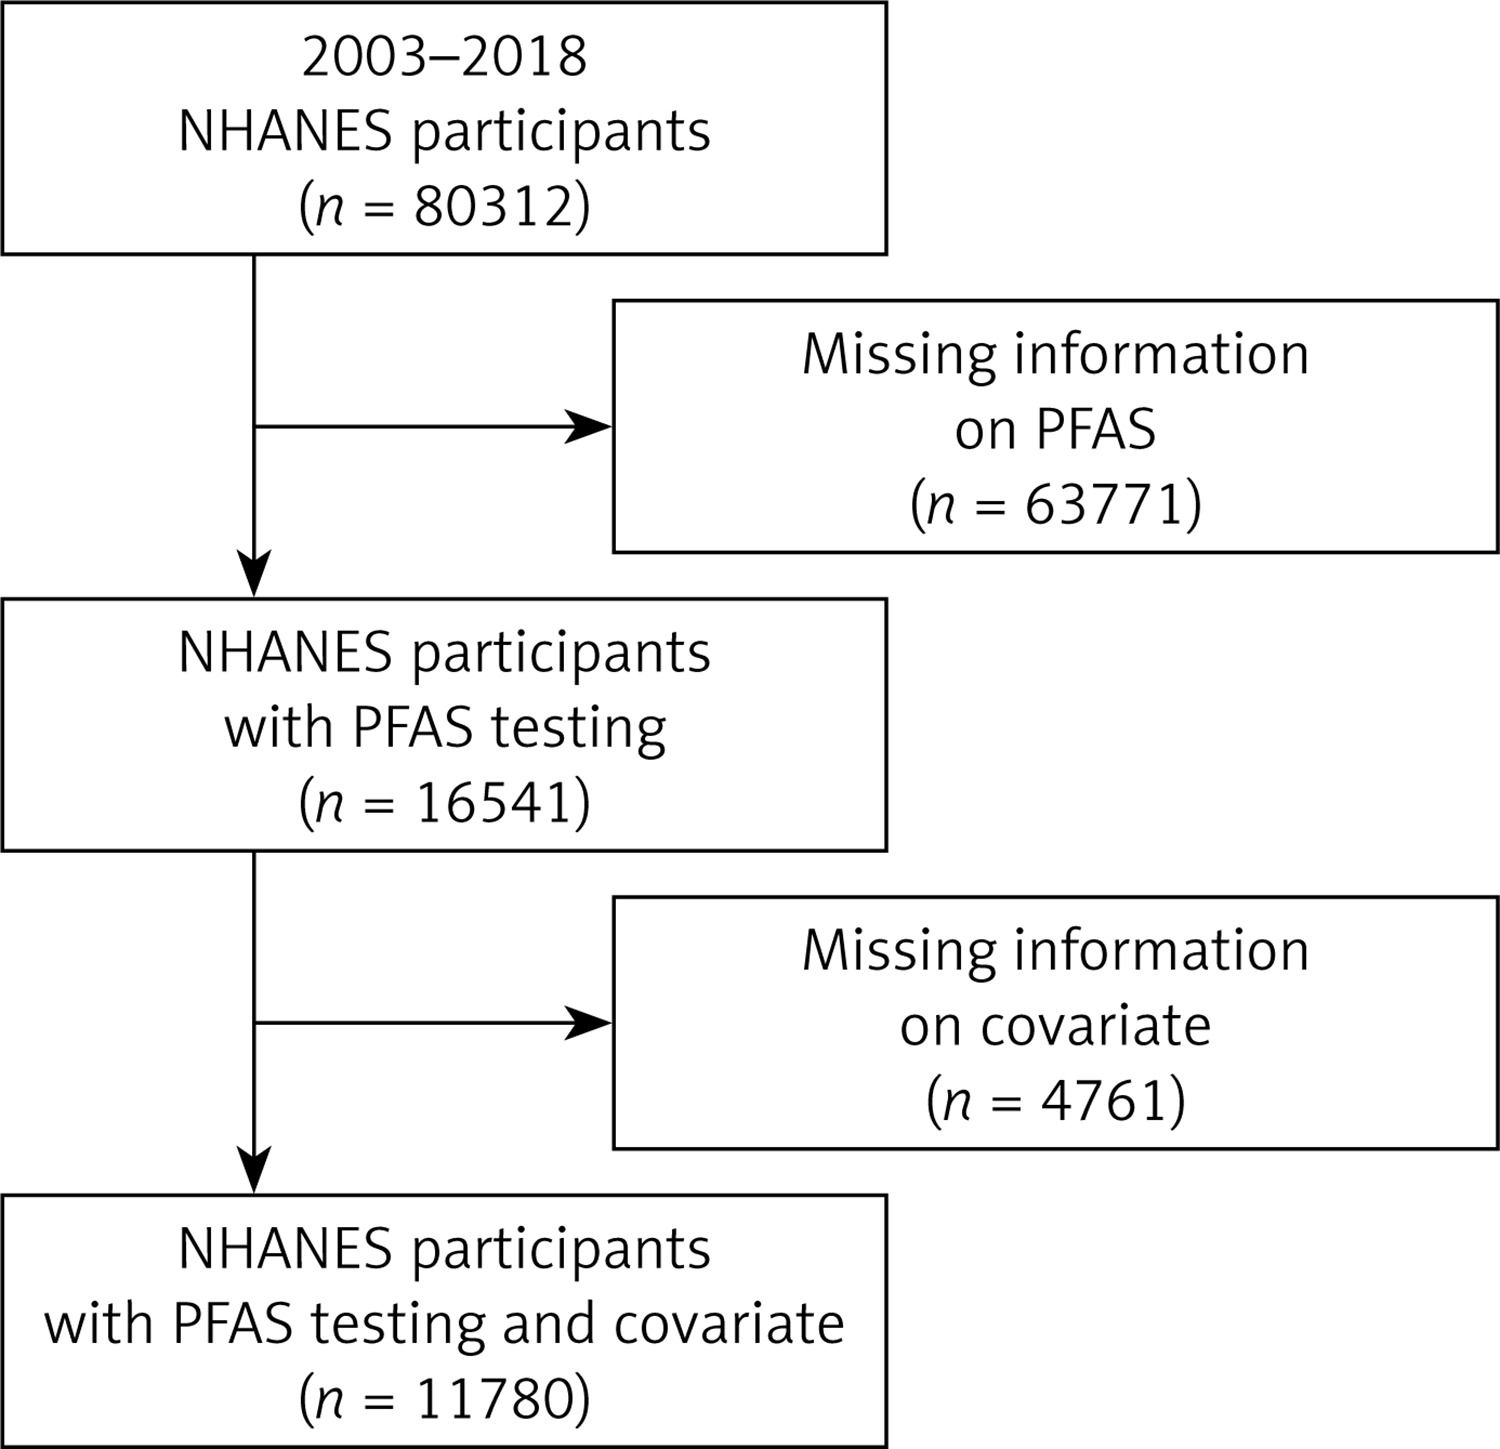
The NHANES is a cross-sectional study conducted in the United States since the 1960s to assess the health and nutritional status of individuals, including children and adults. Approval was obtained from the Ethical Review Board of the National Center for Health Statistics, and informed consent was secured from all participants. Data from publicly available sources, spanning from 2003 to 2018, were collected for this study. A total of 80,312 participants were initially included, with 63,771 excluded due to missing PFAS level information. Of the remaining 16,541 participants with PFAS measurements, 4,761 were further excluded for missing covariates. Fortunately, no outcome variables were missing. Ultimately, 11,780 participants were included in the final analysis, all of whom had complete information on both PFAS measurements and covariates. Further details on participant identification can be found in Figure 1.
Definition of diabetes
Diabetes diagnoses were made by medical professionals, and information on diabetes status was collected through a questionnaire. Participants aged 20 years or older were asked if they had ever been diagnosed with diabetes by a doctor or healthcare professional. Positive responses to this question were used to identify individuals with diabetes in the survey.
Pollutant measurement
PFASs have become extensively utilized and have been found in various environmental sources, including water and organisms [15–17]. Humans can come into contact with PFASs through inhalation, skin exposure, and consuming contaminated food. Once in the body, PFASs initially circulate in the bloodstream and undergo metabolic changes, leading to the production of metabolites that can accumulate in specific organs and trigger toxic responses, such as endocrine disruption [18, 19]. In this research, blood samples from participants were analyzed for five specific PFASs: perfluorodecanoate (PFDeA), perfluorohexane sulfonate (PFHxS), 2-(N-methyl-perfluorooctane) sulfonamido acetate (Me-PFOSA-AcOH), perfluorononanoate (PFNA), and perfluoroundecanoate (PFUA). These PFASs were identified as persisting in the environment from 2002 to 2018 using high-performance liquid chromatography coupled with tandem mass spectrometry (MS/MS). When the limit of detection (LOD) for a chemical was below 50%, the LOD logarithm/2 method was used to calculate the corresponding data, as 86% of the chemicals met this criterion. To ensure quality, procedural blanks and spiked samples were included in each batch of samples to monitor potential contamination and analytical performance. Detection limits were set for each PFAS analyte, and measurements below these limits were processed using the NHANES LOD/2 method, a standard practice for handling non-detectable values in environmental exposure assessment.
Covariates
A comprehensive review of the relevant literature was conducted to identify potential covariates associated with exposure to perfluoroalkyl and PFAS and the risk of diabetes. The selected covariates were categorized as either continuous or categorical variables. Continuous variables included age, family poverty index ratio (PIR), annual household income, and BMI. Categorical variables encompassed gender (male, female), race (Mexican American, other Hispanic, non-Hispanic white, non-Hispanic black, other race – including multiracial), education (less than ninth grade, grades 9–11 (including grade 12 without a diploma), high school/GED or equivalent, college or AA degree, associate’s degree or above, denial, don’t know), and marital status (married, widowed, divorced, separated, never married, living with a partner).
Statistical analysis
Descriptive statistics were used to summarize the demographic characteristics of the participants and concentrations of biomarkers. Urine creatinine was not needed as a correction factor since it is a laboratory measure of blood and does not require urine dilution. Categorical variable data were presented as the number of cases (percentage) and underwent χ2 testing. Non-normal continuous variable data were presented as the median (interquartile range) [M (Q1, Q3)], and analyzed using the Wilcoxon rank sum test. Normal continuous variable data were presented as mean ± standard deviation, and analyzed using the independent sample t-test. A natural log transformation (ln transformation) was applied to PFAS to establish a normal distribution. Spearman’s correlation was used to assess the relationships between chemicals.
A weighted multivariate logistic regression model was utilized to investigate the correlation between natural logarithm (ln) transformed and quartile transformed chemical concentrations and the incidence of diabetes. In order to assess the relationship between combined chemical exposure and diabetes, as well as to pinpoint the key chemicals influencing the occurrence of diabetes, a WQS regression model was employed. The WQS model is a statistical method that assesses the impact of each component of environmental exposure on the overall effect using a weighted index. This model has been widely used in evaluating the effects of exposure to mixtures [20]. The WQS model calculates quantiles for chemicals and assigns individual weights based on their relative importance within the mixture, facilitating the identification of potentially harmful substances.
The study utilized the quantile g-computation model to investigate the association between chemicals and diabetes by evaluating the ‘mixture effect. Quantile g-computation is a unique method for analyzing combined environmental exposures, as it estimates the parameters of marginal structural models and offers causal effect estimates. This model predicts the anticipated change in potential outcomes if a simultaneous intervention is implemented for all exposures, potentially while considering confounding factors. Accurate estimates of the true effect can be achieved through quantile g calculations when the assumptions of exchangeability, causal consistency, positivity, no interference, and correct model specification are met. Statistical analysis was performed using R3.4.3, with a two-sided p-value below 0.05 considered statistically significant [21].
Note: Due to the high proportion of samples with LOD ≤ 50%, they were not excluded from the study population. Instead, these samples were adjusted by dividing them by 2, and then missing values of independent variables were excluded. The NHANES protocol was approved by the NCHS research ethics review board, and all participants provided informed consent.
Results
Baseline characteristics of the study population
A total of 11,780 participants were included in this study for statistical analysis. The general characteristics of the study population can be found in Table I. Among these participants, 1,452 were diagnosed with diabetes, representing a prevalence of 12.32%. The remaining 10,329 participants were diagnosed as non-diabetic, accounting for 87.68% of the sample. Statistical analysis indicated significant differences in age, race, education level, marital status, family income, BMI, and diabetes status between patients with and without diabetes (p < 0.05). However, there was no significant difference in gender between the two groups (p > 0.05).
Table I
Population characteristics of diabetes in adults from the US National Health and Nutrition Examination Survey 2002–2018
Distribution of chemical exposure and its association
The nuclear density distribution was analyzed for all five chemicals, and the results are illustrated in Supplementary Figure S1. Supplementary Figure S1 shows that PFUA displays three distinct peaks, while PFNA, monohydroxy polyfluoroalkyl substances (MPAH), PFHxS, and perfluoroalkyl ether acids (PFAeA) each show a single prominent peak.
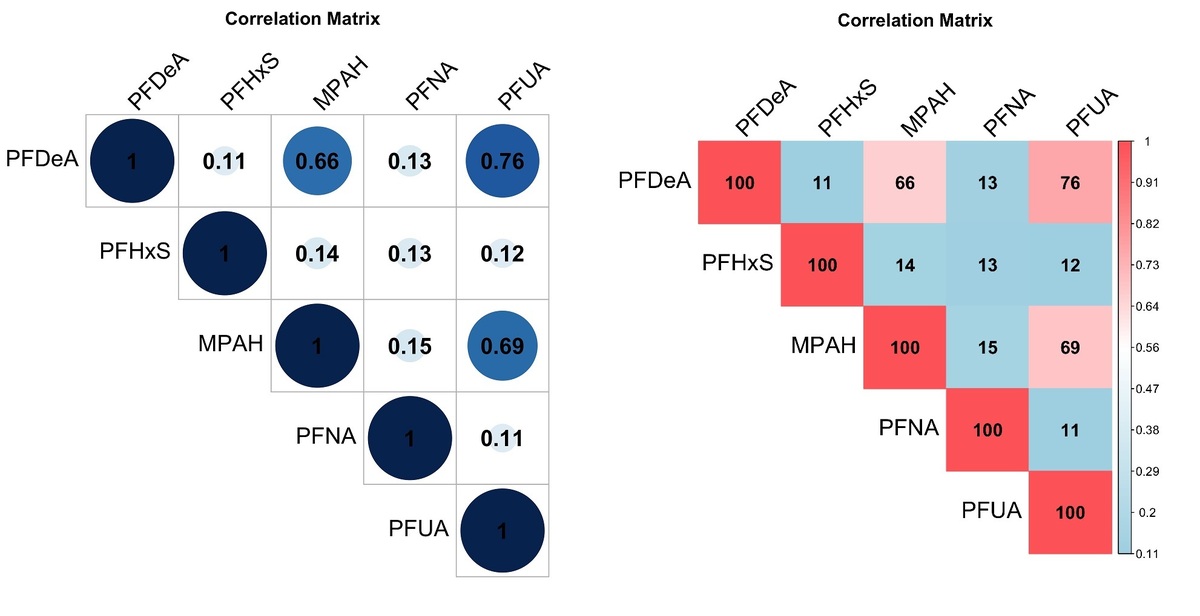
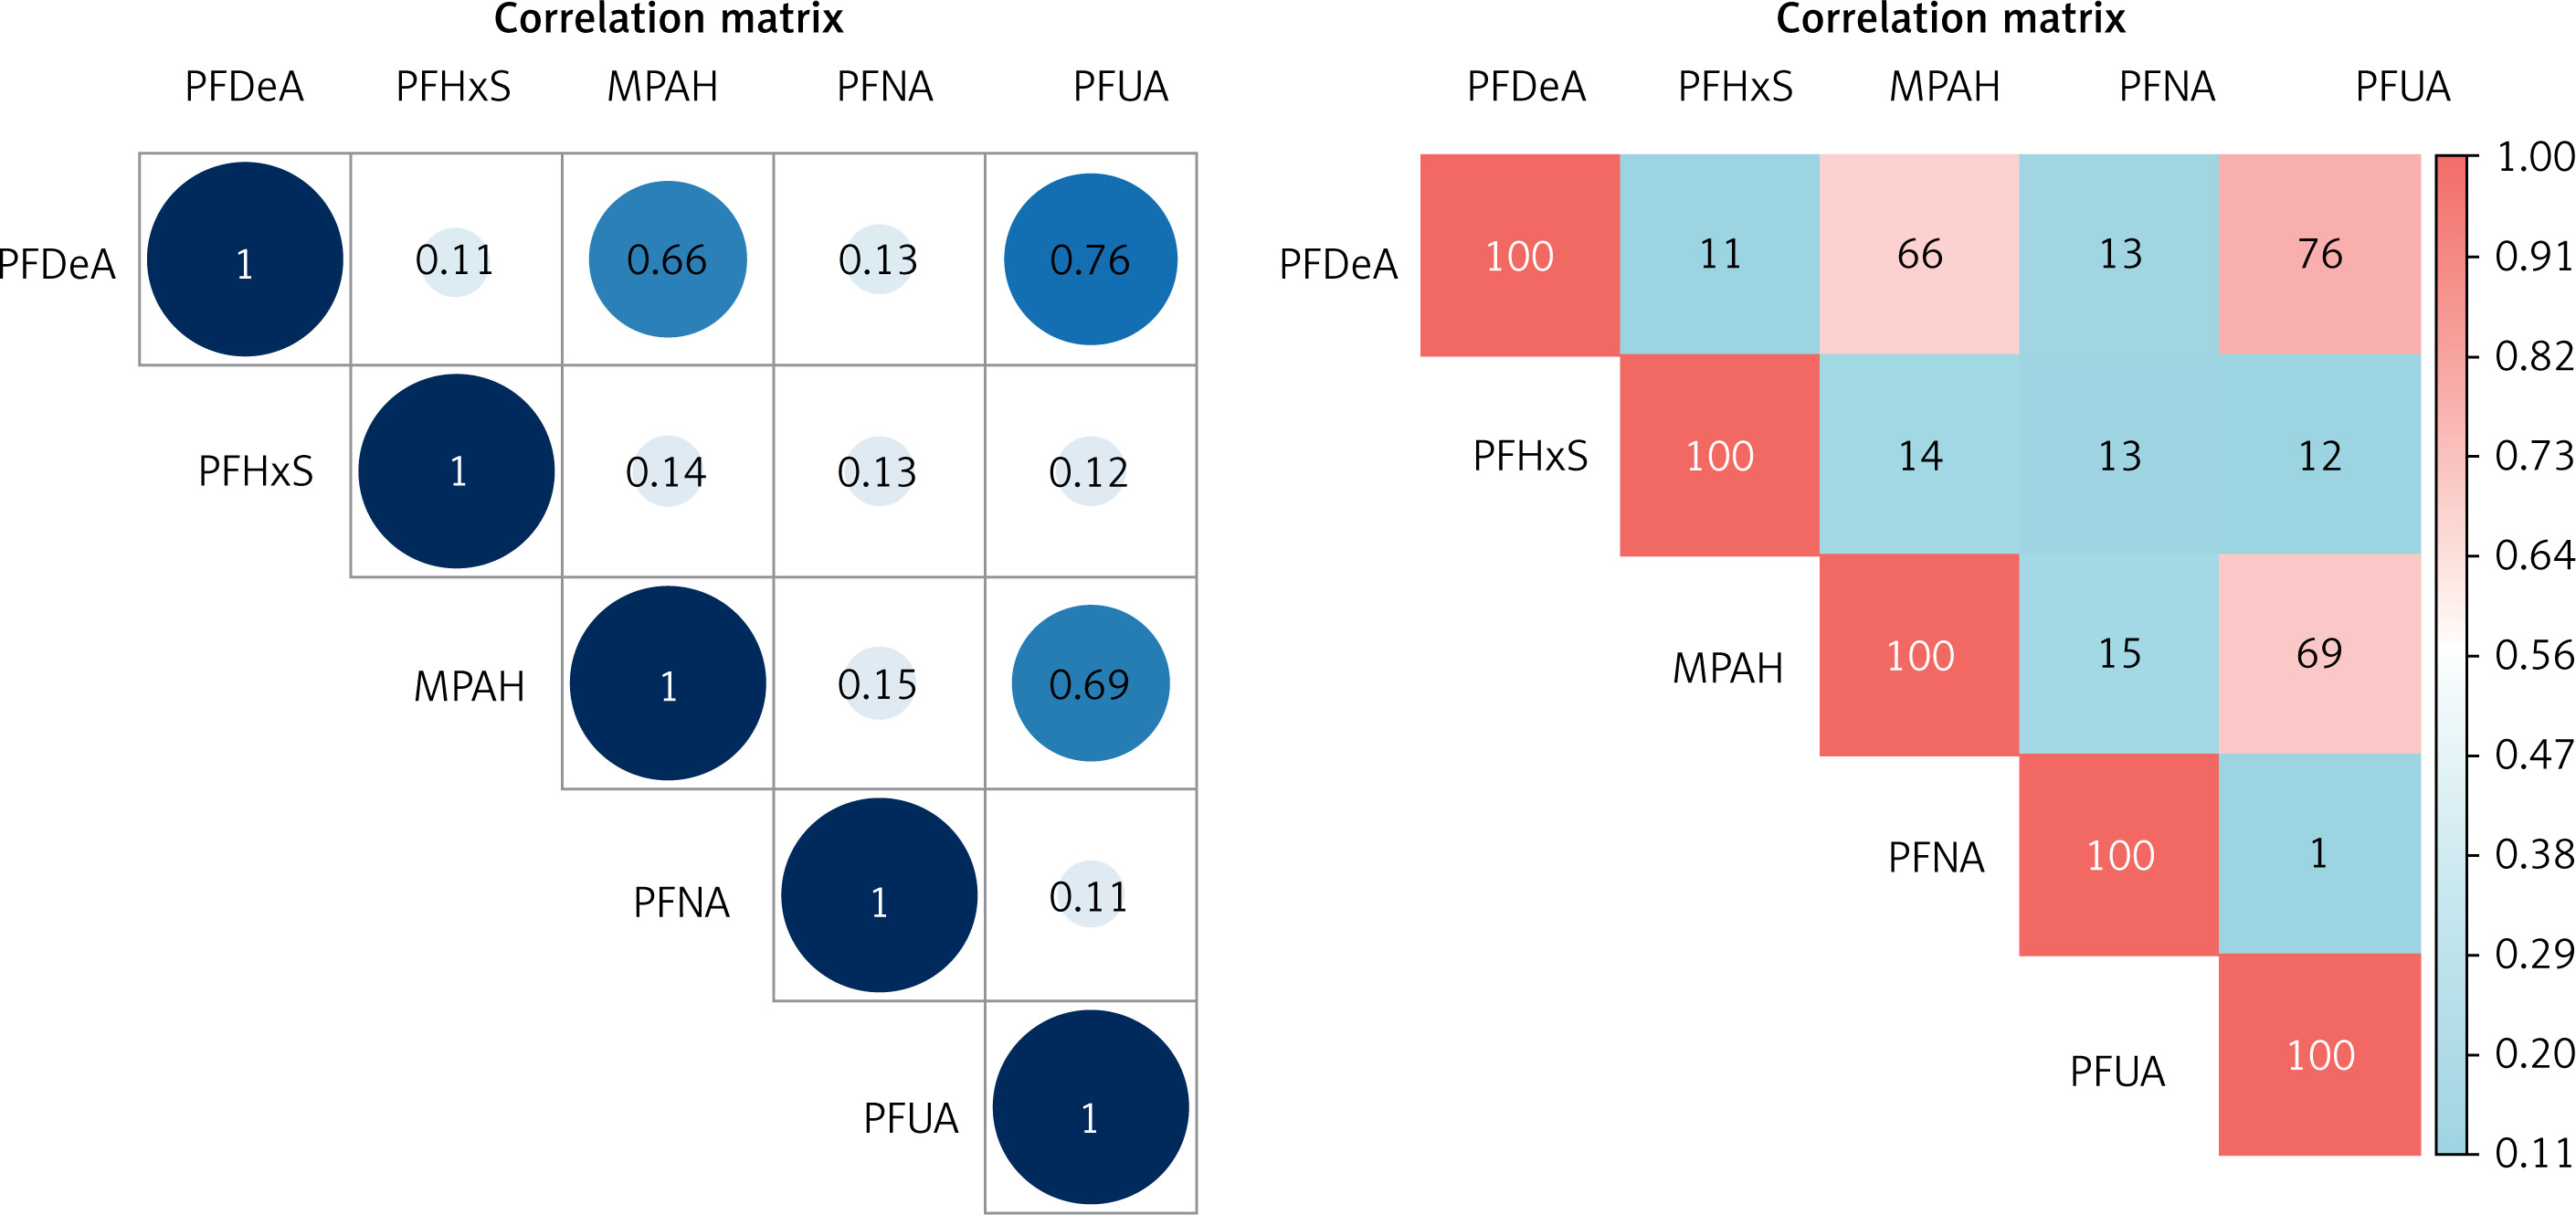
A Spearman correlation analysis was conducted to investigate the relationship between the measured values of the five chemicals, as shown in Figure 2. The results indicated that the correlation coefficient between PFUA and PFDeA was the highest at 0.76, suggesting a strong positive correlation. Furthermore, the correlation coefficient between PFUA and MPAH was 0.69, and that between PFDeA and MPAH was 0.66, both showing significant positive correlations. On the other hand, the correlation coefficients for the remaining chemicals were below 0.2, indicating either a very weak correlation or no correlation at all. This suggests the possibility of high collinearity among the variables, necessitating the use of multivariate logistic regression to evaluate and confirm the collinearity.
Weighted generalized linear regression
Univariate logistic analysis was conducted using three models, each adjusted for specific covariates. The results are presented in Supplementary Tables SI–SIII. Model 1 included adjusted covariates of gender and age. Model 2 expanded on this by including additional covariates such as race, PIR, education level, and BMI. Lastly, Model 3 incorporated sex, age, race, PIR, education level, BMI, marital status, and annual household income as adjusted covariates.
None of the five chemicals showed a significant odds ratio (OR) for diabetes in all three models (p > 0.05). Specifically, in the adjusted Model 3, the highest quartile (Q4) of PFDeA, PFHxS, and PFNA had values above 1, but none were statistically significant (p > 0.05). However, it is important to note that the lack of significance could be due to the small sample size and imbalance in the distribution of disease and non-disease populations in the study. Therefore, the lack of significance in this study should be interpreted with caution, as it may be influenced by these factors.
In the multivariate weighted logistic regression models, all five chemicals showed a variance inflation factor (VIF) of less than 10, suggesting no multicollinearity among them (Table II). The OR of PFNA on the outcome was calculated to be 1.14 (0.91, 1.43) in the multivariate weighted logistic regression model. Nevertheless, this relationship was not deemed statistically significant (p = 0.25).
Weighted quantiles and regression (WQS)
In the positive constraint model of the WQS, the coefficient for the chemical mixture index showed a weak association with diabetes (OR = 1.02), which was not statistically significant. However, strong correlations between the chemical mixture index coefficient and diabetes were observed in Model 1, Model 2, and Model 3 after adjusting for relevant covariates (Model 1: OR = 1.77, Model 2: OR = 1.83, Model 3: OR = 1.83). The results are presented in Supplementary Table SIV. Similarly, in the unadjusted model of the negative constraint in the WQS, the OR was 1.98, but it was not statistically significant (p > 0.05). However, after adjusting for covariates, a robust association between the chemical mixture index and diabetes was evident in Model 1, Model 2, and Model 3 (Model 1: OR = 1.87, Model 2: OR = 1.90, Model 3: OR = 1.90). These findings are summarized in Supplementary Table SV.
The first model (Model 1) considered two covariates: gender and age. The second model (Model 2) included a wider range of covariates, such as gender, age, race, PIR, education level, and BMI. Finally, the third model (Model 3) integrated additional covariates, including sex, age, race, PIR, education, BMI, marital status, and annual household income.
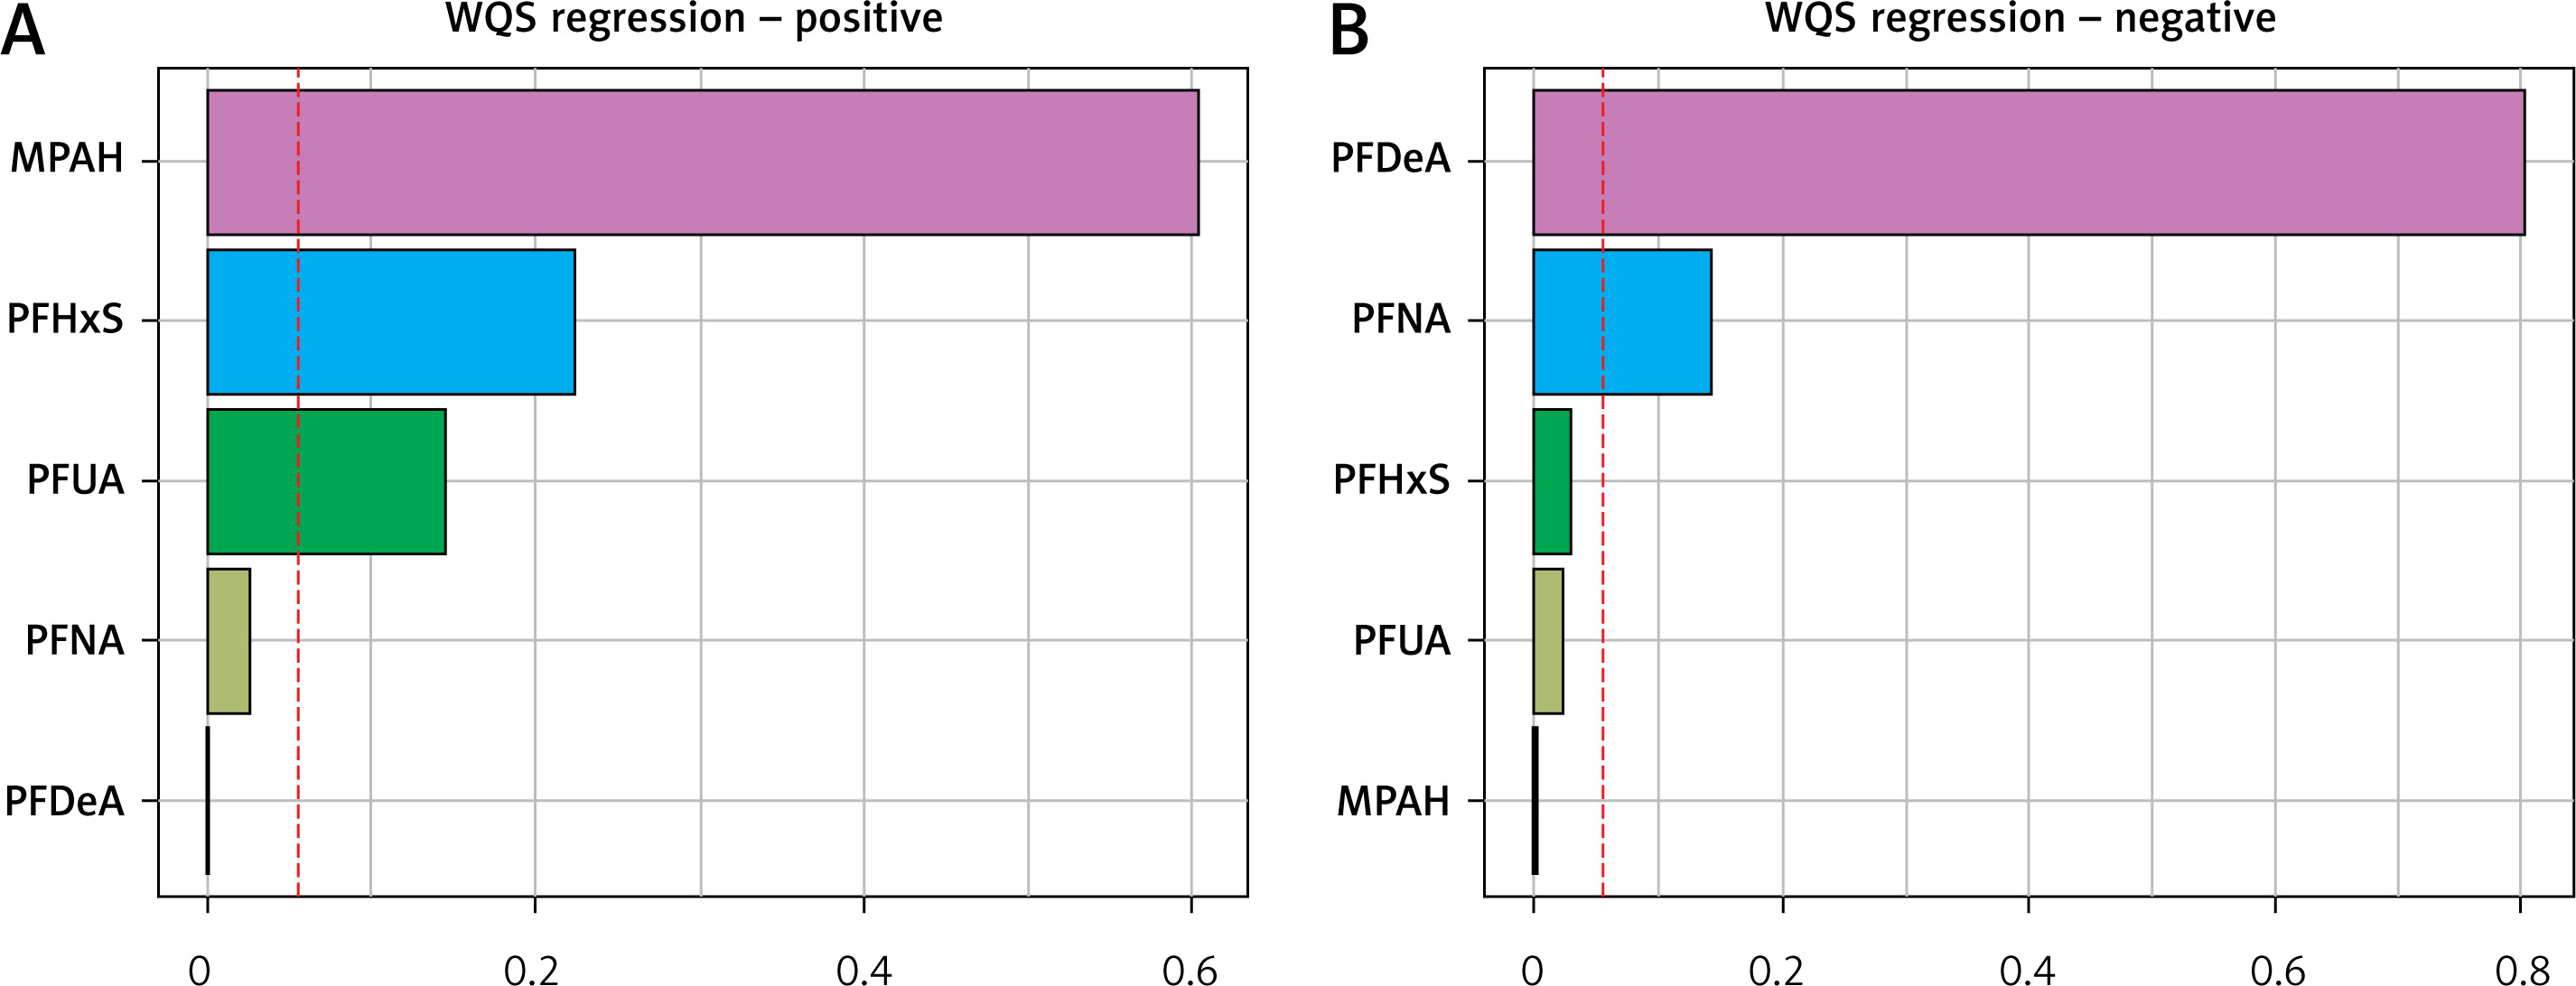
In the positive constraint model of WQS, the substances MPAH, PFHxS, and PFUA are considered to be relatively significant, with weights exceeding 1/18 each. Similarly, within the negative constraint model of WQS, both PFDeA and PFNA are deemed to be relatively important, with weights surpassing 1/18 for each chemical. For more detailed information, see Figure 3.
Quantile g-computation “mixture effect” evaluation
For further information on the use of binary results in Q g-comp using the Q g-comp.no boot function, please refer to Supplementary Table SVI. The Q g-comp.boot function produces a marginal OR. It is important to understand that introducing nonexposed covariates, such as confounders, into the model will result in estimations of these parameters that are not equivalent. This is because the OR is non-collapsible. Marginal parameters offer estimates of population-average exposure effects, which are typically more interpretable and meaningful than conditional odds.
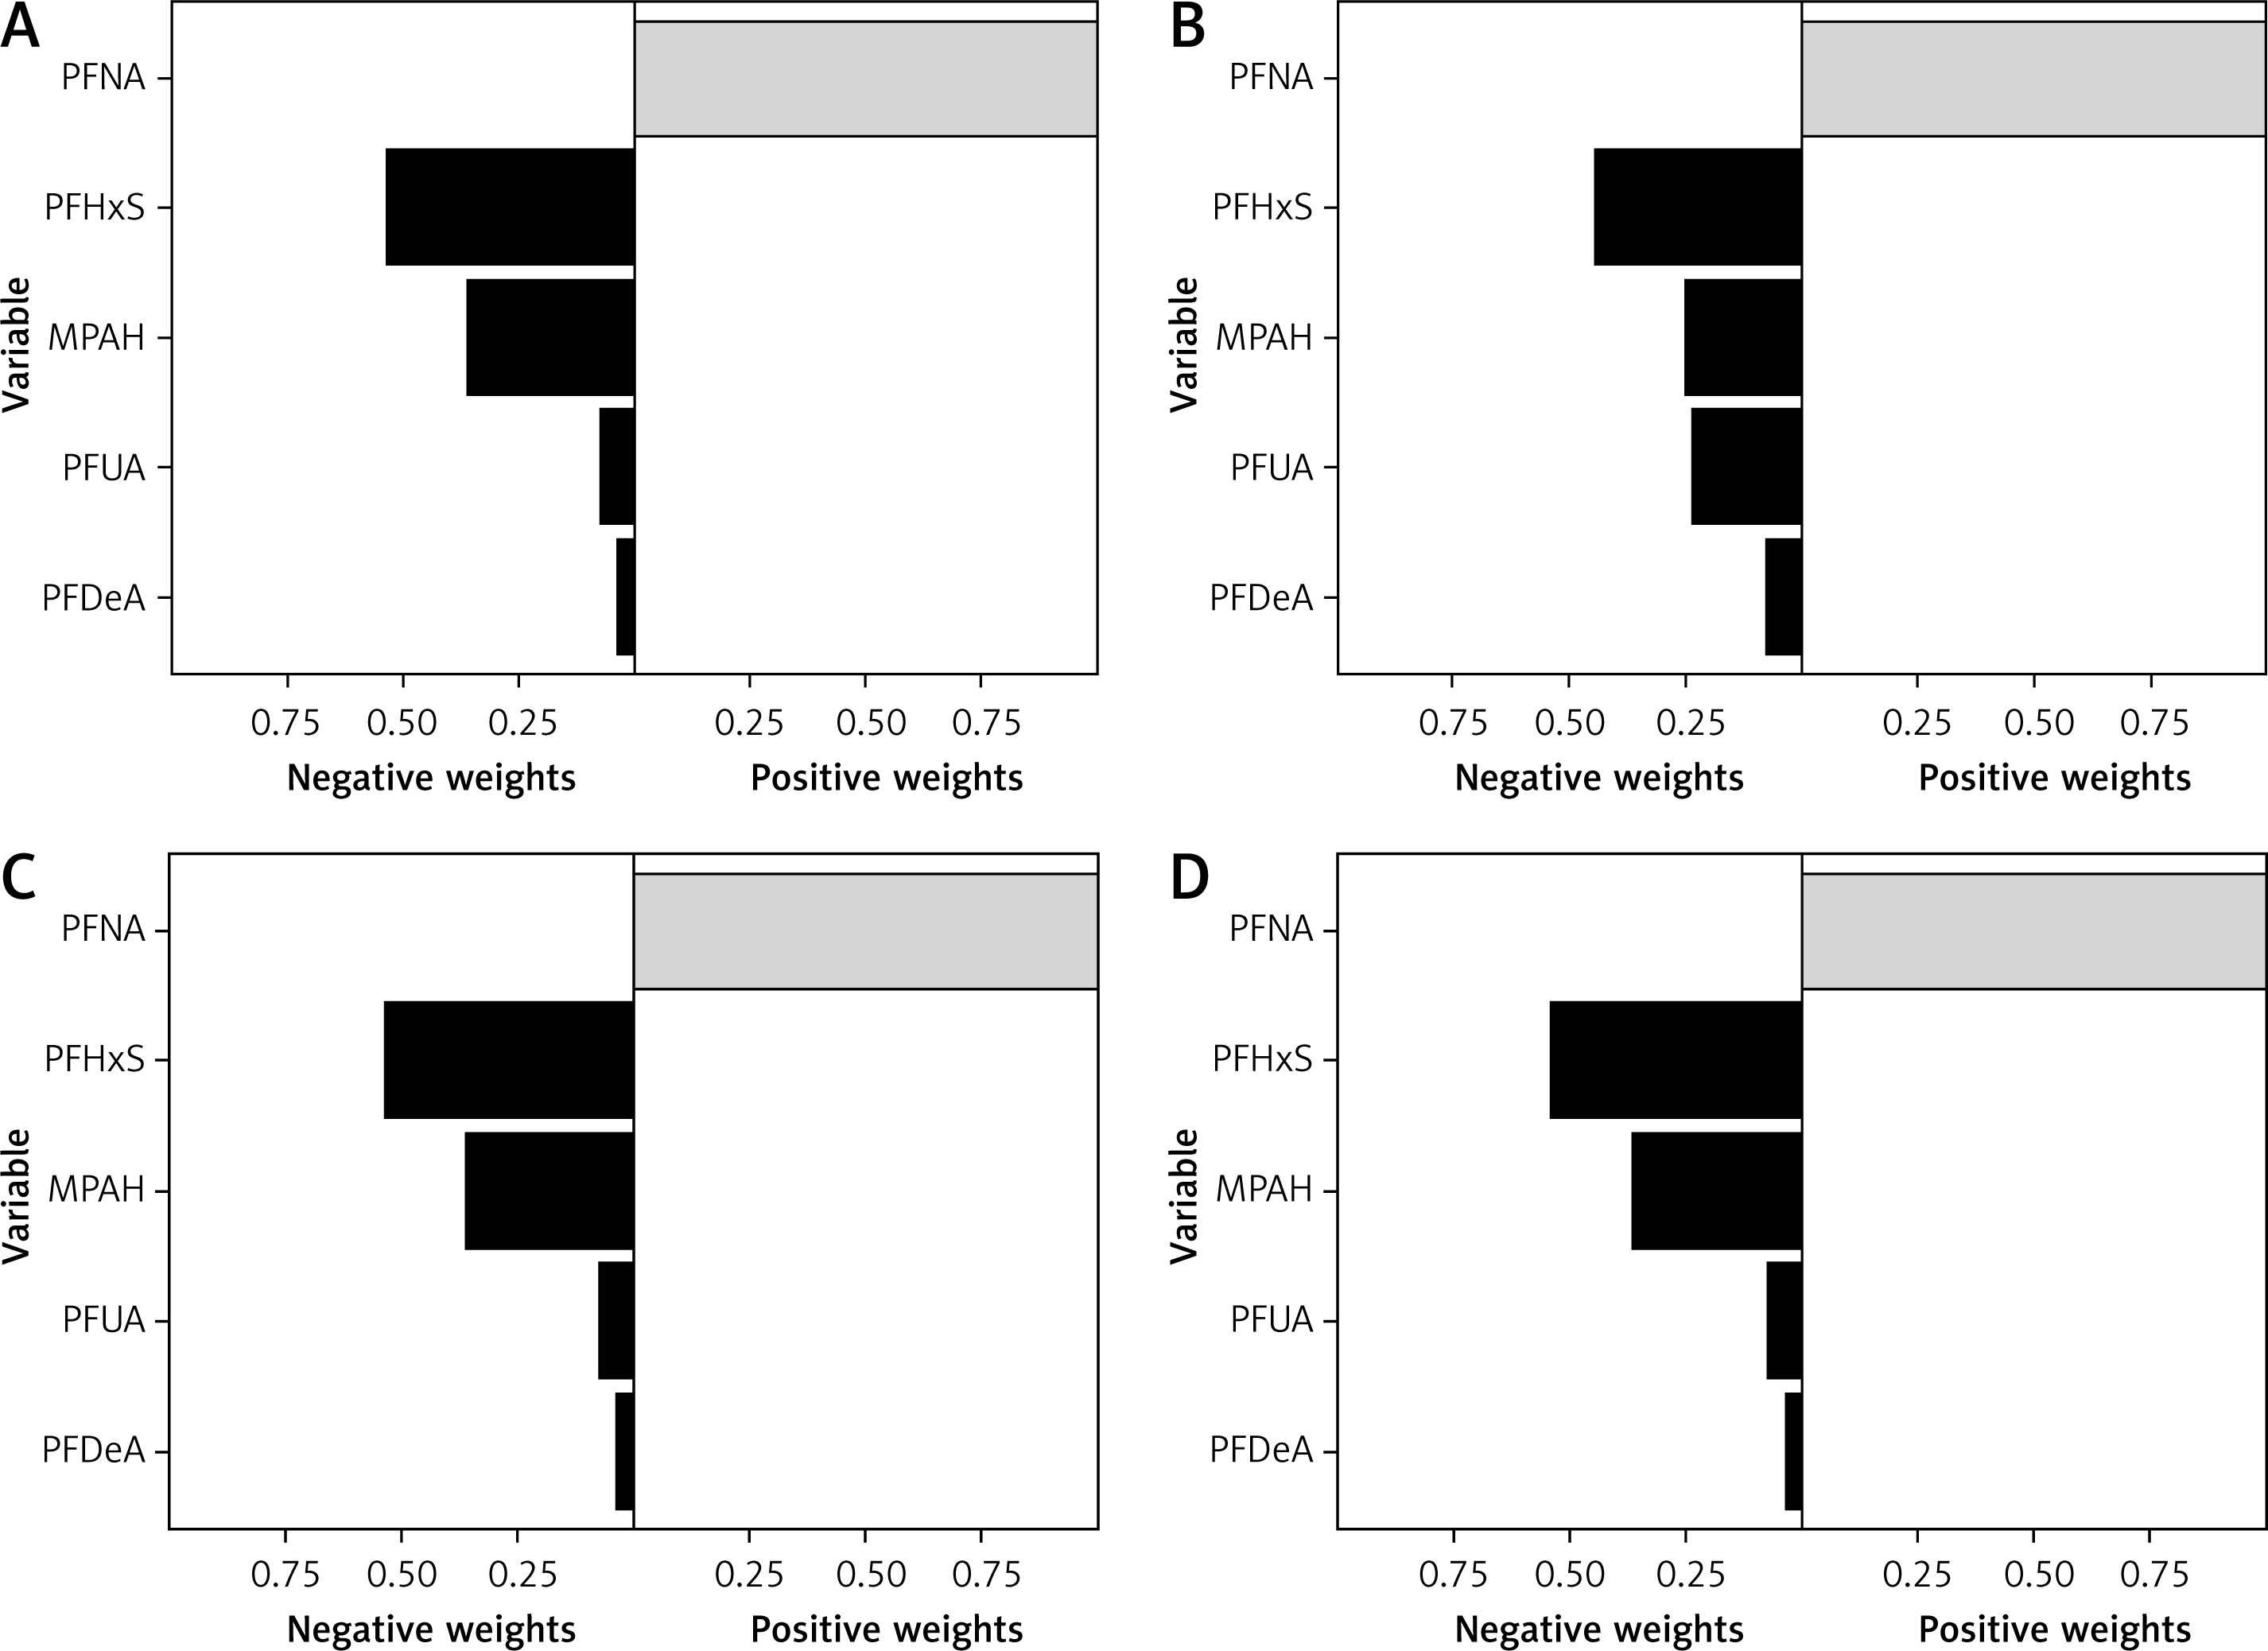
Further adjustments to the covariates were made using Model I, Model II, and Model III. The results of these adjustments are illustrated in Figure 4, showcasing four different models (1: no adjustment; 2: Model one; 3: Model two; 4: Model three) and their impact on the overall effect for each exposure. It is important to highlight that the constraints imposed on the weights in the WQS model may lead to biased estimations of the effects. In contrast, the Q g-comp model allows for weights to shift in different directions, indicating the potential for some exposures to be beneficial while others may be harmful. This flexibility also addresses sampling variation that can occur with small or medium-sized samples. Within the Q g-comp model, the weights represent the proportion of effects aligning in the same direction, although in certain instances, they may correspond to a smaller or larger proportion compared to the overall ‘mixed’ effect. Notably, Figure 4 illustrates that the combined exposure effect of PFNA on diabetes is positive in all four models, while exposure to the other four chemicals shows negative effects.
Figure 4
Q G-computation weights for the four models. A – Model I; B – Model II; C – Model III; D – Model 4
Nonlinearities in the data were addressed using Qg-comp and Qg-comp. BOOT methods were applied to develop a model that included an interaction term and quadratic terms for each predictor of chemical exposure. By simultaneously accounting for the nonlinear effects of all exposures, a distinct nonlinear trend in the overall exposure effect was observed, as shown in Supplementary Figures S2 and S3. Importantly, the smoothed regression line aligns with the confidence interval of the marginal linear model, indicating consistency. Additionally, it is clear that the OR for the prevalence of PFAS and diabetes increases steadily with each quantile change.
Discussion
This study utilized a large sample of data to investigate the potential link between mixed exposure of serum perfluoroalkyl and PFAS and diabetes. The statistical analysis of 11,780 participants, revealing a diabetes prevalence of 12.32%, uncovered patterns in the baseline characteristics of the study population. The analysis brought to light a strong positive correlation between PFUA and PFDeA, indicating a potential high collinearity between these PFAS chemicals. This finding underscores the need for further investigative research that could have significant implications for environmental health policies and understanding of endocrine disorders. Additionally, the weighted quantile sum regression analysis, after adjusting for covariates, demonstrated a robust association between the chemical mixture index and diabetes in all models. This suggests a complex, potentially non-linear relationship between PFAS exposure and diabetes, offering new insights that could guide future epidemiological studies and risk assessment models. The findings indicate that PFAS exposure may be associated with an elevated risk of developing diabetes, particularly showing a positive correlation between mixed exposure of PFNA.
The association between PFAS exposure and diabetes is still a topic of debate in the research community, with no consensus reached yet [22]. However, several studies have shown a positive correlation between serum PFAS levels and elevated blood glucose indicators in individuals with type 2 diabetes [23, 24]. For example, Cardenas et al. analyzed participants in the Diabetes Prevention Program (DPP) from 1996 to 1999 and found that high PFOS and PFOA levels were linked to increased insulin resistance (HOMA-IR) at baseline. They also found associations between high PFOS and PFOA levels and elevated HOMA-β, fasting proinsulin, and glycated hemoglobin A1c (HbA1c) levels at baseline. Yet, the follow-up survey revealed a weak correlation between PFAS exposure and these blood glucose indicators [24]. In a separate study in Tianjin, China, involving individuals aged 19–87 years, it was discovered that a 1% increase in serum PFOA and PFNA concentrations was significantly associated with higher fasting plasma glucose levels, while a 1% increase in PFAS, perfluorohexanoic acid (PFHxA), and PFHxS was linked to higher HbA1c levels [25].
Some studies have suggested a potential positive link between serum PFAS levels and an increase in diabetes measures, while others have found no significant or inverse associations. To investigate this correlation more closely, Liu et al. conducted an analysis using NHANES data from 2013 to 2014. Their findings indicated that branched-chain PFOS and linear PFOA were significantly linked to a reduction in fasting plasma glucose. However, no notable association was observed between PFAS and 2-hour plasma glucose (GTT), insulin levels, or HOMA-IR [26]. In a similar study, Nelson et al. analyzed NHANES data from 2003 to 2004 to investigate the relationship between PFAS (including PFOA, PFNA, PFOS, and PFHxS) and insulin resistance. Their analysis, however, did not identify any significant association [27].
Numerous studies have explored the link between PFAS and diabetes occurrence, with results varying based on the specific PFAS compounds investigated. Lundin et al. analyzed the diabetes prevalence in individuals with high PFOA exposures between 1947 and 1997. Their findings indicated a heightened risk of diabetes and diabetes-related mortality in those with moderate exposures, while no notable correlation was observed at low or high exposures [28]. Conversely, some other studies have documented either no significant association or an inverse association between PFAS exposure and type 2 diabetes risk [29–31].
Recent investigations into the pathophysiology of chemically induced diabetes, particularly related to PFAS exposure, have revealed potential mechanisms. Studies indicate that PFAS could disrupt endocrine function, specifically insulin signaling pathways, leading to insulin resistance, a precursor to type 2 diabetes [32]. PFASs tend to accumulate in the liver, a crucial organ in glucose regulation, where they may disrupt glucose metabolism and insulin sensitivity [33]. Additionally, PFAS exposure has been associated with changes in lipid metabolism, which is closely linked to insulin resistance. The precise molecular pathways through which PFASs cause these effects are still being studied but could involve the modulation of nuclear receptors and interference with hormone secretion and function [34]. This disruption of metabolic and endocrine pathways may contribute to the development of diabetes, emphasizing the importance of further research into the specific biological mechanisms underlying PFAS-induced metabolic dysregulation.
The study benefits from using NHANES data in the United States, which offers a sizable and representative sample, and from serologically detecting five PFAS chemicals for subsequent statistical analysis, ensuring result reliability. However, there are limitations. Firstly, the cross-sectional nature of the NHANES data used in this study hinders establishing temporal or causal associations between mixed PFAS exposure and diabetes risk. Secondly, diabetes pathogenesis is intricate, with potential confounding factors such as genetics, diet, and lifestyle not considered in the analysis. Additionally, PFAS chemicals undergo adsorption-partition reactions with environmental media upon entry into the environment, leading to the generation of various metabolites upon entering the human body. Some of these metabolites interact with biological macromolecules, causing toxic effects such as growth, reproductive, and endocrine toxicity. Despite this, the study did not investigate the potential impact of PFAS metabolites on diabetes prevalence. Hence, future research should explore the link between chemical metabolites and diabetes risk, as well as the physiological mechanisms connecting mixed PFAS exposure and diabetes risk.
In conclusion, the results showed no evidence of multicollinearity among the five PFAS chemicals studied. It is important to highlight that PFAS compounds have been proposed to potentially increase the risk of diabetes. Furthermore, a positive correlation was found between PFNA and the combined exposure effect on diabetes.