Introduction
Crohn’s disease (CD) and ulcerative colitis (UC) are idiopathic, inflammatory processes predominantly affecting the gastrointestinal tract, recognized as inflammatory bowel disease (IBD). In general, the course of IBD is chronic and lifelong, with episodes of exacerbations and remissions. Approximately 20–30% of children with CD already have complications at the time of initial diagnosis, i.e. structuring and/or penetrating disease [1]. Similarly, the course of UC in children is more severe compared to adult patients with more frequent exacerbations, hospitalizations and the need for colectomy [2]. 10% of all CD patients and 15–20% of all UC cases are particularly at risk of an unfavorable outcome due to long-term exposure to pathogenic factors such as malnutrition, anorexia, and chronic inflammation [2, 3]. The goal of treating children with IBD is to achieve rapid and sustained remission, cure mucosal lesions, ensure quality of life, and avoid adverse drug reactions. For this reason, patients with pediatric IBD require an individualized approach based on reliable predictors of good and poor treatment outcomes. A number of clinical, laboratory, and endoscopic parameters are being analyzed for their usefulness in assessing the course of IBD in children. According to current guidelines, the combination of fecal calprotectin (fCal) and C-reactive protein (CRP) is better than fCal alone in the evaluation of children with CD [4]. What is more, fCal assessed at 14 weeks after initiation of biological treatment in children with CD was a predictor of clinical remission and endoscopic healing after 1 year of treatment with infliximab (IFX) [5]. The Pediatric Crohn’s Disease Activity Index (PCDAI), as another marker studied, did not predict the need for steroid treatment at week 12 when assessed at disease onset [6].
Treatment regimens for IBD in children have changed significantly over the decades. First remission induction therapy in UC depends on disease activity and includes 5-aminosalicylic acid (5-ASA) or steroids. On the other hand, in patients with CD, until 2020, the type of treatment to induce remission also depended on the severity of the disease, and now relies on the presence of prognostic factors for poor disease outcome, and when these are absent, exclusive enteral nutrition (EEN) or steroids are used. When remission is achieved, then maintenance treatment is used as 5-ASA in UC or thiopurine in CD as monotherapy or in combination with partial enteral nutrition/exclusion diet. If treatment fails, escalation therapy with monoclonal antibody against tumor necrosis factor α (anti-TNF-α) is recommended as the first choice in children. Based on current guidelines, consideration of early anti-TNF-α therapy applies to CD patients with severe growth retardation, failure to achieve remission after induction therapy, deep colonic ulceration, stenotic and penetrating disease at diagnosis, and severe perianal disease. In pediatric patients with UC, biological therapy is dedicated to chronically active or steroid-dependent UC uncontrolled by 5-ASA and thiopurines and a second-line treatment for acute, severe UC [2, 7, 8]. Nowadays, there is a growing body of literature in both children and adults in which anti-TNF-α treatment is more effective when given earlier in the course of the disease (“top-down” strategy) [9–11]. In adult studies, the CALM and REACT trials, which enrolled patients with active CD, found that earlier escalation to anti-TNF-α therapy resulted in fewer major adverse outcomes than treatment with conventional step-up strategies [12]. Moreover, recent data did not show biomarker utility (CRP and fCal) assessed at diagnosis in treatment choice, and top-down treatment was suggested as a standard of care for patients with newly diagnosed active CD [13]. Despite a growing amount of data on the benefits of a “top-down” strategy, no data on non-invasive prognostic markers for the early use of biological therapy in children with IBD are available.
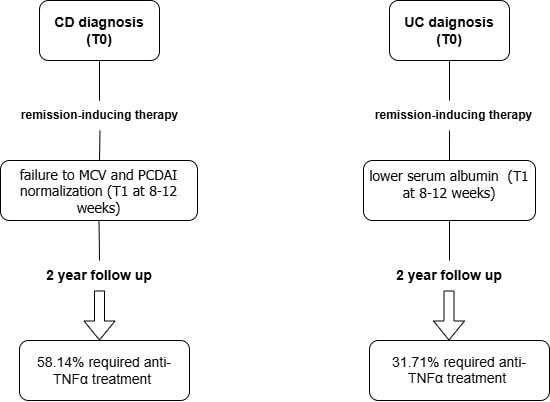
The purpose of this study was to identify predictors of the progressive course of CD and UC requiring treatment escalation (anti-TNF-α) at 2-year follow-up, based on clinical, biochemical, and endoscopic parameters assessed at initial diagnosis and during early follow-up. In this study, a progressive course of IBD was defined as one that required a stepwise approach with definitive use of anti-TNF-α during the first 2 consecutive years of disease.
Material and methods
Patients’ characteristics and study design
We retrospectively analyzed the clinical, laboratory, radiological, and endoscopic data of children with IBD diagnosed and treated at our department between 2015 and 2021. Due to the need for 2-year follow-up of patients in our department, the maximum age of inclusion in the study was 16 years. The diagnosis of IBD was made based on European Society for Pediatric Gastroenterology, Hepatology and Nutrition (ESPGHAN) guidelines [14]. For the purpose of the study, two assessment time points were chosen: at the time of diagnosis (T0) and 8–12 weeks after diagnosis and remission-inducing treatment (T1).
Both the biochemical parameters and clinical disease activity were evaluated at two time points. Among laboratory parameters, complete blood count, CRP, erythrocyte sedimentation rate (ESR), albumin, ferritin, and fCal were assessed in all participants according to standard laboratory practice. Normal laboratory values for selected parameters were: WBC 4–10 × 109/l, neutrophil count 1500–7000 × 109/l, Hb 12–15 g/dl, MCV > 75 fl, PLT 150–450 × 109/l, CRP < 5 mg/dl, ESR < 20 mm/h, albumin > 3.5 g/dl, ferritin > 30 mg/dl and fCal < 200 µg/g.
Disease activity was assessed according to the PCDAI in children with CD and defined as: remission < 10 points, mild disease 10–27.5 points, moderate disease 30–37.5 points, and severe disease > 40 points. The Pediatric Ulcerative Colitis Activity Index (PUCAI) was used in children with UC and rated as: remission (< 10 points), mild (10–34 points), moderate (35–64 points) or severe (> 64 points) [15–17].
Data obtained during colonoscopy, which was performed only at the time of diagnosis (T0), were also used for analysis. The phenotype of CD and UC was assessed using the Paris classification. In UC it was assessed as: E1 – proctitis, E2 – distal to splenic flexure colitis, E3 – extensive, distal to hepatic flexure and E4 – pancolitis [18]. CD type was evaluated as follows: age at diagnosis (A), disease location (L), disease behavior (B) and growth retardation (G) [9]. The Mayo Endoscopic Scale was used for UC children assessed as: 0 – normal colonic mucosa, 1 – erythema, decreased vascular pattern, mild friability, 2 – marked erythema, erosions, no vascular pattern, friability, 3 – ulceration, spontaneous bleeding [15, 19]. Endoscopic assessment of CD activity was performed using the Simple Endoscopic Scale for CD (SES-CD), which evaluates the size of ulcers, the ulcerated surface, the endoscopic extension, and stenosis, with each item being scored by segment on a scale from zero to three. Patients with active moderate to severe forms of the disease unresponsive to conventional treatment were eligible for biological therapy. Patients who developed side effects during conventional treatment were deemed eligible for biologic treatment after other therapeutic options were exhausted. Once the diagnosis was made, the patients were treated according to current recommendations for that time [2, 7, 8, 20, 21].
For the next 2 years, patients were followed up at the same medical center where the initial diagnosis was made. The entire cohort was then divided into two groups according to the course of the disease, i.e. Group I with stable disease without intensification of therapy for two-year follow-up and Group II with progressive complications requiring biological drugs (anti-TNF-α) during 2-year follow-up. Children diagnosed with IBD received appropriate induction treatment, and in UC it was 5-ASA in combination (n = 32) or without steroids, and in CD it was exclusive enteral nutrition (EEN) with (n = 10) or without steroids. In Group II all outcomes analyzed at T1 were taken before the initiation of biological therapy. Exclusion criteria included other autoimmune comorbidities, perianal lesions (fistula or abscess) in CD cases at the time of diagnosis, as well as parental and patient noncompliance with medication, changing the residence, and significant data gaps (Supplementary Figure S1).
Statistical analysis
Statistical tests, calculations and graphics were performed using Statistica software. Continuous variables were summarized as median (range) and compared using the Mann-Whitney U test; categorical variables were presented as number and percentage and compared using the χ2 test. Both tests involved comparing patients in Groups I and II at the same time point (T0 or T1). The paired Wilcoxon rank sum test was used to assess statistical differences within the same groups at T0 and T1. A paired Wilcoxon rank sum test was also used to compare the effect sizes (R) of different variables. Interpretation values for R were 0.1 and < 0.3 as a small effect, > 0.3 and < 0.5 as a moderate effect, and ≥ 0.5 as a large effect. The diagnostic value of biomarker concentrations was estimated using receiver operating characteristic (ROC) curve analysis. Cut-off values were selected to calculate sensitivity, specificity, and accuracy of indicators based on the maximization criterion of Youden’s J statistic. Spearman’s correlation test was used to analyze the correlations between variables assessed at T1. Odds ratio (OR) and 95% confidence intervals (95% CI) for factors associated with biological treatment were calculated using both univariate and multivariate logistic regression. Following the rule of 10 per factor in the multivariate regression analysis, power was sufficient to account for 2 variables in patients with UC and 2 variables in patients with CD. All candidate variables were initially evaluated using univariate logistic regression. Variables that demonstrated statistical significance were subsequently entered into a multivariable logistic regression model. A significant area under the curve (AUC) value for the model was > 0.7. p < 0.05 was considered statistically significant.
Results
Between 2015 and 2021, the total number of IBD diagnoses in our department was 148, including 56 children with CD and 92 children with UC. Twelve patients did not meet the inclusion criteria for the study. The demographic and clinical characteristics of the study groups are summarized in Supplementary Table SI.
Ultimately, 54 children with CD (median age: 14 years, males: 59.26%) and 82 children with UC (median age: 14 years, males: 43.9%) were included in the study (Supplementary Figure S1). Almost half of children with CD (48.15%) received anti-TNF-α therapy including infliximab (IFX) or adalimumab (ADA) compared to one third of children with UC treated with IFX (31.71%). The median time from diagnosis to initiation of biological treatment was 6 months in CD cases and 8 months in UC cases.
Patients with CD
At the time of diagnosis (T0)
The demographic, clinical, laboratory, and endoscopic data of Groups I and II are shown in Table I. The groups did not differ in terms of BMI, while discrepancies in the values of clinical, laboratory, and endoscopic parameters were noted at T0. Group I consisted mainly of boys, and the patients were older than those in Group II. Mild CD activity assessed by PCDAI was more frequently observed in Group I (71.42% vs. 34.62%, p = 0.007), while severe activity was more frequently observed in the group of patients who received biologic treatment during the 2-year follow-up (50.00% vs. 14.29%, p = 0.005). At the time of diagnosis, patients from Group II had higher ESR, PLT, PLT/albumin ratio, PCDAI, and SES-CD and lower Hb and MCV compared to Group I. PLT > 450 × 109/l, Hb < 12 g/dl and MCV < 75 fl were observed in more children in Group II than in Group I (Table I). In addition, children with ileocecal localization of disease (L3) significantly often required anti-TNF-α treatment during the 2 consecutive years (50.00% vs. 14.30%, p = 0.004). Induction treatment and results of other laboratory and radiological findings were comparable in both groups (Table I).
Table I
Comparison of demographic parameters and selected clinical parameters at the time of diagnosis of CD between the group not requiring biological treatment (Group I) and the group requiring such treatment (Group II) during 2 years of follow-up
[i] BMI – body mass index, pc – percentile, ESR – erythrocyte sedimentation rate, CRP – C-reactive protein, WBC – white blood count, PLT – platelet count, Hb – hemoglobin, MCV – mean corpuscular volume, fCal – fecal calprotectin, PCDAI – Pediatric Crohn’s Disease Activity Index, SES-CD – simple endoscopic score for Crohn’s disease, L1 – distal 1/3 ileum, L2 – colonic, L3 – ileocolonic, B1 – non-stricturing, non-penetrating, B2 – stricturing, G0 – no evidence of growth delay, G1 – growth delay, MRI – magnetic resonance imaging, EEN – exclusive enteral nutrition, pc – percentile, T0 – at diagnosis, T1 – 8–12 weeks after diagnosis.
At 8–12 weeks after diagnosis and remission-inducing treatment (T1)
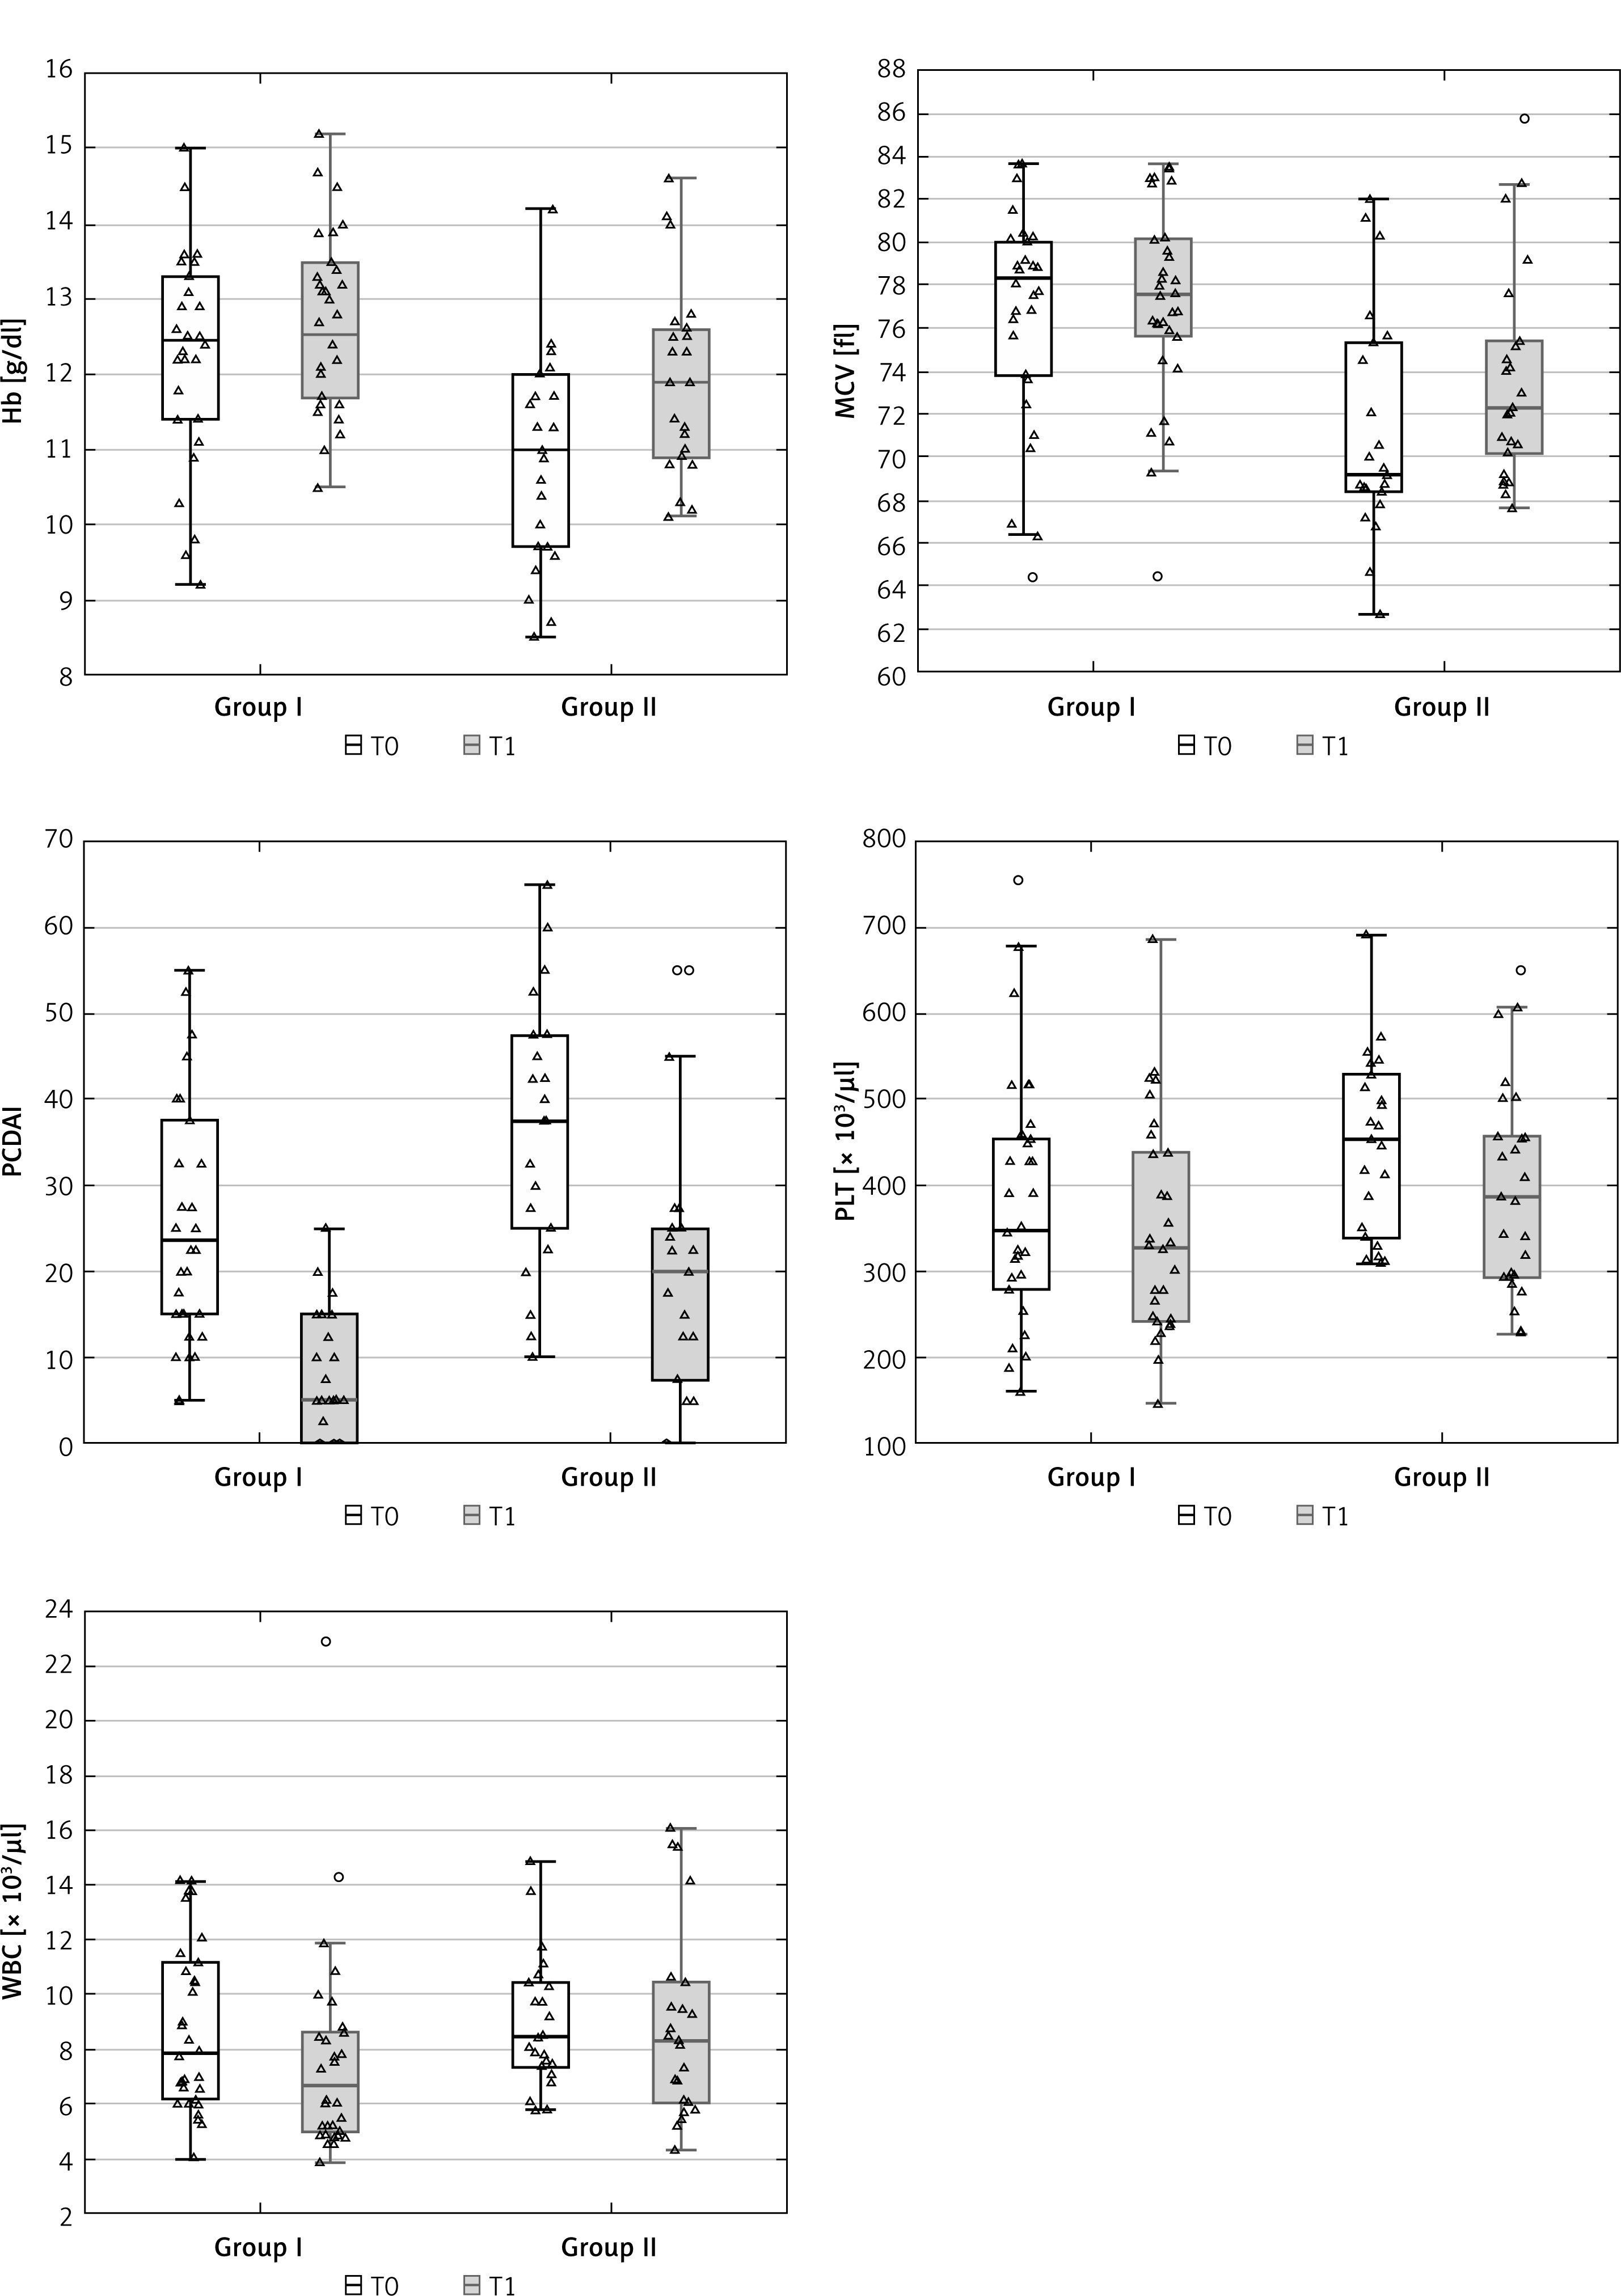
Despite the trend toward normalization of clinical and laboratory parameters after the induction treatment in children with CD, significant differences were observed in several biochemical parameters between Groups I and II after 8–12 weeks of follow-up (Table I, Supplementary Table SII, Figure 1). Severe disease, based on PCDAI score, was noted in 3 (about 12%) children from Group II despite the treatment. Significantly higher ESR, CRP, PLT/albumin, PCDAI, and lower Hb, MCV, and albumin were observed in Group II compared to Group I. Moreover, significantly more children in Group II had CRP > 5 mg/dl (57.69% vs. 21.43%, p = 0.006), ESR ≥ 20 mm/h (53.87 vs. 25.00%, p = 0.03), Hb < 12 g/dl (50.00% vs. 28.57%, p = 0.01) and MCV < 75 fl (61.54% vs. 25.00%, p = 0.007) despite significant improvements of these outcomes based on calculated size effect (Supplementary Table SII). Only the results for fCal and neutrophil count showed no significant changes in Group II compared to Group I. However, the result for the neutrophil count was on the verge of statistical significance (Table I, Supplementary Table SII). We decided to evaluate whether abnormal results of more than one marker could be more often observed in Group II (Table I). For the analysis we choose PCDAI > 10, CRP > 5 mg/dl and MCV < 75 fl based on the results of regression analysis and AUC from ROC analysis presented below (due to the presence of ESR and albumin in the PCDAI, both parameters were not included in the regression analysis). It should be noted that the combination of two markers was not useful in differentiating patients who will require biologic treatment in the next 2 years. However, only 1 (3.57%) patient from Group I had abnormal results for the three markers simultaneously (PCDAI, Hb, and MCV), in contrast to 9 patients from Group II (34.62%) (p = 0.003) (Table I).
Figure 1
Biochemical and clinical parameters (median, range) assessed at T0 (white box) and T1 (green box), which showed significant diagnostic utility in differentiating CD patients in Group I from Group II
Due to the possible effect of steroids on WBC and neutrophil count values, patients receiving steroids from Groups I and II were compared, with no significant differences observed in the values of the parameters (data not shown).
Among patients who required anti-TNF-α treatment within 2-year follow-up, 14 (56.00%) children received it within the first 6 months of diagnosis. There were no significant differences in clinical presentation or additional test results between the groups receiving biological treatment within and after 6 months (data not shown).
ROC analysis
ROC analysis was performed to select the best marker for predicting the need for treatment intensification in the next 2 years (Table II). At T0 the best diagnostic value with AUC > 0.7 was obtained for Hb (AUC = 0.773; sensitivity 87.0%; specificity 64.5% with a cut-off of 12.1 g/dl) and MCV (AUC = 0.763; sensitivity: 82.6%; specificity: 71.0% with a cut-off of 75.6 fl), PCDAI (AUC = 0.706, sensitivity 65.2%, specificity 66.7% with a cut-off 30 points) and SES-CD (AUC = 0.714; sensitivity = 73.9%; specificity = 67.7% with a cut-off of 11 points). At T1 the best differentiation markers were ESR (AUC = 0.794; sensitivity: 82.6%; specificity: 67.7% at a cutoff point of 17 mm/h), CRP (AUC = 0.754; sensitivity: 65.2%; specificity: 80.06% at a cutoff point of 5.08 mg/dl), Hb (AUC = 0.717; sensitivity: 87.0%; specificity: 51.6% at a cutoff point of 12.8 g/dl), MCV (AUC = 0.725; sensitivity: 78.3%; specificity: 74.2% at a cutoff point of 75.4 fl), albumin (AUC = 0.775; sensitivity: 73.9%; specificity: 90.3% at a cutoff point of 4.23 g/dl) and PCDAI (AUC = 0.788; sensitivity: 60.9%; specificity: 86.7% at a cutoff point of 17.5).
Table II
Analysis of diagnostic performance of selected parameters (significantly differentiating Groups I and II) as predictors of anti-TNF-α treatment within 2 years of CD diagnosis
[i] AUC – area under the curve, SE – standard error, C.I. – confidence interval, ESR – erythrocyte sedimentation rate, CRP – C-reactive protein, PLT – platelet count, Hb – hemoglobin, MCV – mean corpuscular volume, fCal – fecal calprotectin, PCDAI – Pediatric Crohn’s Disease Activity Index, SES-CD – simple endoscopic score for Crohn’s disease, T0 – at diagnosis, T1 – 8–12 weeks after diagnosis.
Spearman correlation
Spearman correlation was used to evaluate collinearity of the PCDAI and laboratory parameters assessed in T1. The following significant correlations were observed: CRP and ESR (R = 0.57, p = 0.002), CRP and neutrophil count (R = 0.47, p = 0.001), CRP and PCDAI (R = 0.54, p = 0.004), ESR and PLT (R = 0.52, p = 0.007), ESR and albumin (R = –0.66, p < 0.001), ESR and PCDAI (R = 0.48, p = 0.01), Hb and albumin (R = 0.44, p = 0.02), PLT and WBC (R = 0.63, p < 0.001), PLT and fCal (R = 0.50, p = 0.02), WBC and neutrophil count (R = 0.82, p < 0.001).
Univariate and multivariate analysis
Parameters that were significantly associated with the need for anti-TNF-α therapy in CD patients shown in the univariate regression model are listed in Table III. The best multivariate regression model, with an AUC = 0.86, was noted for PCDAI and MCV (Table III). Considering the components of PCDAI, ESR, CRP, and albumin were not analyzed. PCDAI had a stimulating effect on the risk of treatment intensification (OR = 1.122, 95% CI: 1.034–1.217), while an increase in MCV levels reduced this risk (OR = 0.803, 95% CI: 0.671–0.960) (Table III).
Table III
Univariate and multivariate analyses yielding independently significant predictors of eventual anti-TNF-α use during the first 2 consecutive years of CD
Patients with UC
At the time of diagnosis (T0)
Demographic parameters, PUCAI, and endoscopic findings revealed no significant differences between Groups I and II (Table IV). Analysis of serum and stool markers determined at T0 showed only significant higher ESR levels in children requiring anti-TNF-α treatment. In addition, more children in Group II had CRP > 5 mg/dl (46.15% vs. 19.64%, p = 0.01), PLT > 450 × 109/l (30.77% vs. 14.29%, p = 0.03) and Hb < 12 g/dl (61.54% vs. 32.14%, p = 0.01). Induction treatment was comparable in both groups.
Table IV
Comparison of demographic parameters and selected clinical parameters at the time of diagnosis of UC between the group not requiring biological treatment (Group I) and the group requiring such treatment (Group II) during 2 years of follow-up
[i] BMI – body mass index, ESR – erythrocyte sedimentation rate, CRP – C-reactive protein, WBC – white blood count, PLT – platelet count, Hb – hemoglobin, MCV – mean corpuscular volume, fCal – fecal calprotectin, PUCAI – Pediatric Ulcerative Colitis Activity Index, 5-ASA-5 – aminosalicylic acid, pc – percentile, T0 – at diagnosis, T1 – 8–12 weeks after diagnosis.
At 8–12 weeks after diagnosis and remission-inducing treatment (T1)
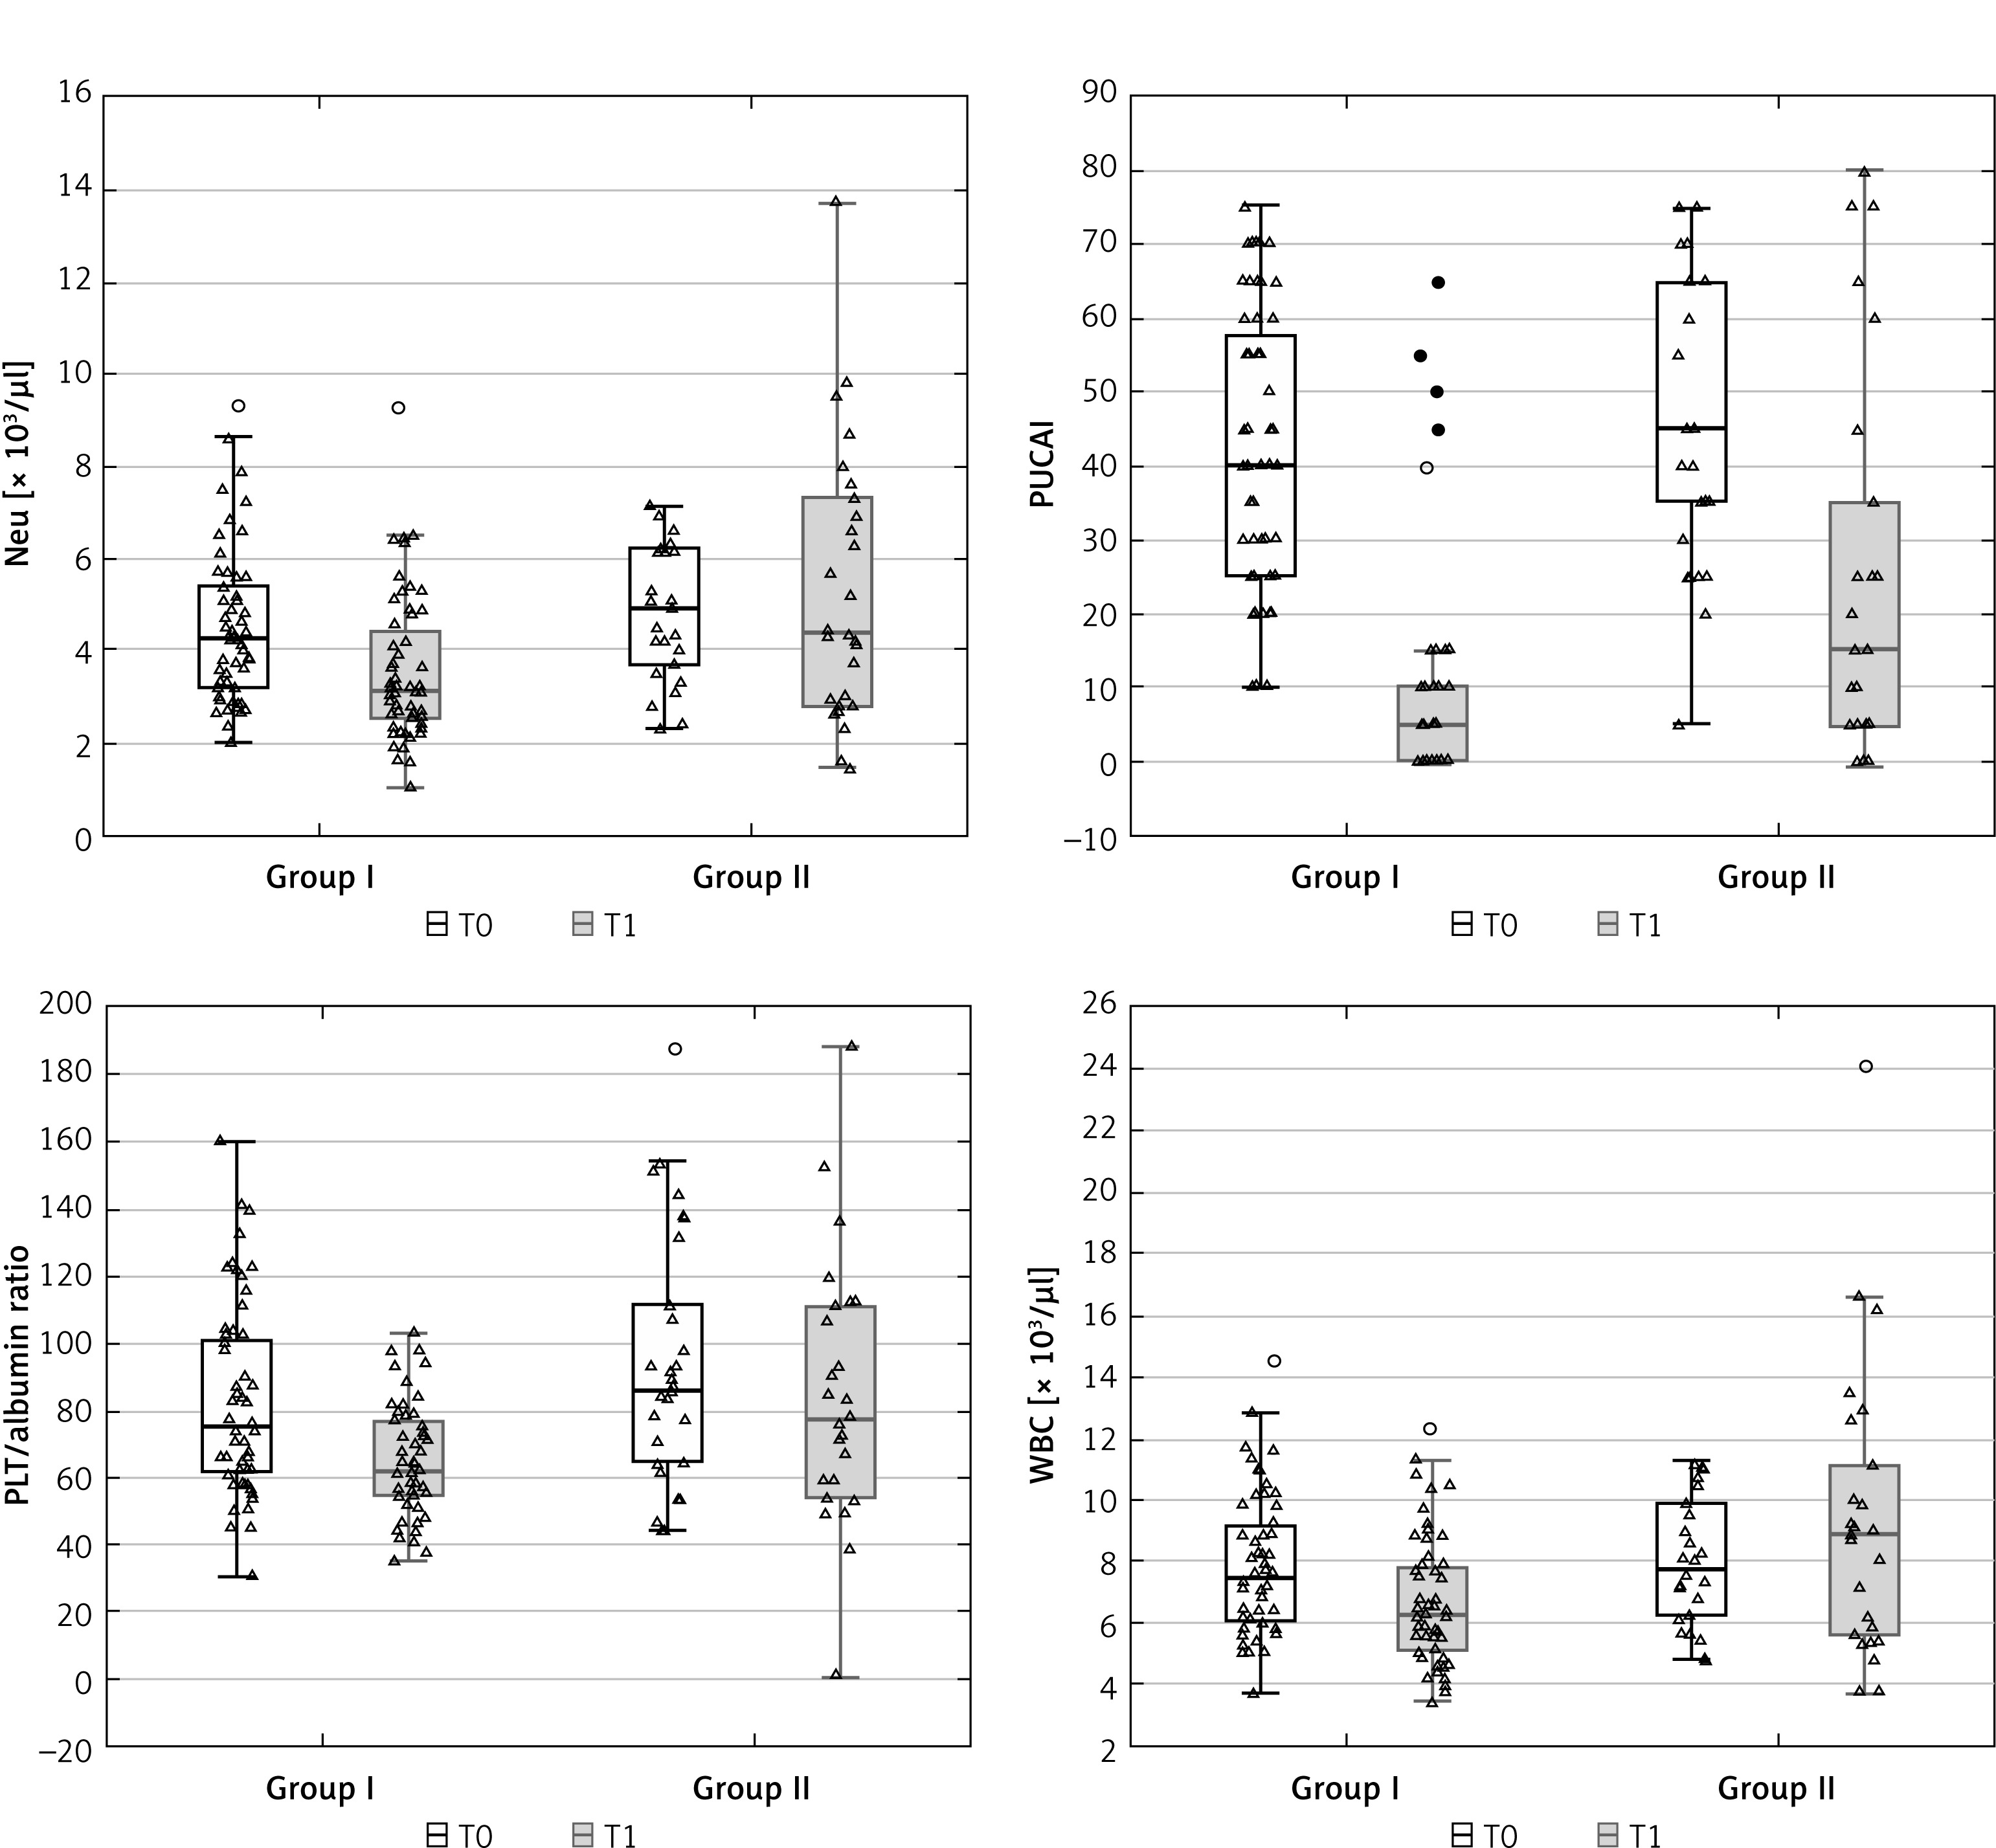
In contrast to T0, more differences between Group I and II in clinical and laboratory parameters were observed at T1 (Table IV, Supplementary Table SIII, Figure 2). Significant differences in ESR, WBC, neutrophil count, PLT, Hb, MCV, albumin, PLT/albumin ratio, fCal, and PUCAI were noted. Because of the effect of systemically administered steroids on WBC and neutrophil counts, patients receiving steroids in Groups I and II were compared; no significant differences in WBC or neutrophil counts were observed between the two groups (p > 0.05) (data not shown). In Group I, significant improvements of most serum markers (CRP, WBC, neutrophil count, albumin) and fCal and PUCAI with a large R (≥ 0.5) were noted. In contrast, in Group II, significant improvements in results at moderate R were observed only for PLT, ESR, and PLT/albumin ratio, while no significant normalization was observed for CRP, WBC, neutrophil count, Hb, MCV, albumin, and fCal. In Group II, significantly more children had WBC > 10 × 109/l (30.77% vs. 8.93%, p = 0.02), Hb < 12 g/dl (61.54% vs. 17.86%, p < 0.001), MCV < 75 fl (23.08% vs. 7.14%, p = 0.04) and fCal > 200 µg/g (84.62% vs. 57.14%, p = 0.02). PLT count > 450 × 109/l was noted in 30.77% of patients in Group II, while this abnormality was not found in Group I. Moreover, clinical remission was achieved by 67.86% of children in Group I (p = 0.005). Severe disease according PUCAI was noted in 15.38% of children requiring biological treatment over the following 2 years. It is worth noting that no patient in Group I had a severe course of disease at T1. We then performed a combination analysis of the best parameters based on AUC value (PUCAI > 10, PLT/albumin ratio ≥ 83.22 and Hb < 12 g/dl) to see how many patients had more than one abnormal marker result. In contrast to patients in the CD group, only ROC analysis was relied on due to the borderline statistical significance obtained in the regression model. Then, among the parameters with the highest AUC, those whose cut-off point was not within the normal laboratory range were selected. The presence of three abnormal (PUCAI > 10 + PLT/albumin ratio ≥ 83.22 + Hb < 12 g/dl) markers was significantly more frequent in children with progressive disease (p = 0.002). Other clinical and laboratory findings were comparable between groups (Table IV).
Figure 2
Biochemical and clinical parameters (median, range) assessed at (T0) and (T1), which showed significant diagnostic utility in differentiating UC patients in Group I from Group II
Twelve (46.15%) children with UC were treated with biological therapy within the first 6 months of diagnosis. The only parameter differentiating the group with early (within the first 6 months after diagnosis) and late (within 7–24 months after diagnosis) induction of anti-TNF-α treatment was a lower albumin concentration at T0 in the first subgroup (4.18 vs. 4.36, p = 0.04; data not shown).
ROC analysis
To assess the discriminatory diagnostic ability of the markers, the AUC value was calculated for T0 and T1 (Table V). The only parameter that achieved statistical significance at T0 was ESR (AUC = 0.640; sensitivity = 96.2%; specificity = 30.4% with a cut-off point of 8 mm/h). At T1, the best diagnostic markers with AUC > 0.7 were albumin (AUC = 0.769; sensitivity = 88.5%; specificity = 60.7% with a cut-off point of 4.58 g/dl), Hb (AUC = 0.761; sensitivity = 57.7%; specificity = 89.3% with a cut-off point of 11.3 g/dl) and PUCAI (AUC = 0.739; sensitivity = 57.7%; specificity = 83.9% with a cut-off of 15 points).
Table V
Analysis of diagnostic performance of selected parameters (significantly differentiating Groups I and II) as predictors of anti-TNF-α treatment within 2 years of UC diagnosis
[i] AUC – area under the curve, SE – standard error, CI – confidence interval, ESR – erythrocyte sedimentation rate, WBC – white blood count, PLT – platelet count, Hb – hemoglobin, fCal – fecal calprotectin, PUCAI – Pediatric Ulcerative Colitis Activity Index, T0 – at diagnosis, T1 – 8–12 weeks after diagnosis.
Spearman correlation
Spearman correlation was used to evaluate collinearity of the PUCAI and laboratory parameters assessed in T1. The following significant correlations were observed: WBC and PLT (R = 0.66, p < 0.001), WBC and Hb (R = –0.47, p = 0.02), WBC and neutrophil count (R = 0.85, p < 0.001), WBC and albumin (R = –0.47, p = 0.02), PLT and Hb (R = –0.60, p = 0.001), PLT and MCV (R = –0.49, p = 0.01), PLT and neutrophil count (R = 0.65, p < 0.001), PLT and albumin (R = –0.41, p = 0.04), PLT and ESR (R = 0.50, p = 0.009), Hb and MCV (R = 0.43, p = 0.03), Hb and neutrophil count (R = –0.41, p = 0.04), Hb and albumin (R = 0.64, p < 0.001), neutrophil count and albumin (R = –0.45, p = 0.02), CRP and ESR (R = 0.47, p = 0.02), CRP and PUCAI (R = 0.55, p = 0.003), ESR and fCal (R = 0.40, p = 0.04), PUCAI and fCal (R = 0.52, p = 0.007), PUCAI and albumin (R = –0.43, p = 0.03).
Univariate and multivariate analysis
We observed that certain parameters were significant in univariate analyses, as shown in Table VI. The best multivariate regression model, with an AUC = 0.86, was noted for albumin and neutrophil count (Table VI). In a multivariate logistic regression model, predictors of treatment intensification with biological therapy were higher neutrophil count (OR = 1.38, 95% CI: 1.017–1.873) and lower albumin concentration (OR = 0.117, 95% CI: 0.016–0.862) assessed after remission-inducing treatment.
Table VI
Univariate and multivariate analyses yielding independently significant predictors of eventual anti-TNF use during the first 2 consecutive years of UC
Discussion
Our study showed that evaluation of commonly used clinical and laboratory parameters within the first 8–12 weeks of diagnosis could be helpful to select patients with progressive IBD who will require close monitoring of the course of the disease and early escalation of therapy with anti-TNF-α monoclonal antibody. To the best of our knowledge, there are only a few published studies dedicated to analyzing markers useful in predicting the progressive course of IBD requiring anti-TNF-α treatment in pediatric patients at the time of diagnosis and after treatment initiation [6, 22–25]. We compared children with CD as well as UC separately. In addition, patients in other studies were evaluated at different time points (3–20 months assessed during the use of various therapeutic regimens, including biological treatment). In our study, the time of follow-up was clearly defined as 8–12 weeks from the moment of diagnosis, after remission-inducing treatment, but before the initiation of anti-TNF-α therapy. We observed that assessment of readily available biochemical parameters used in daily clinical practice in the first few weeks of treatment can predict which patients will require close monitoring in subsequent months of disease and earlier escalation of treatment.
Considering the studies involving children with CD, we found anti-TNF-α treatment in almost 50% of patients, similar to the observation by Olbjørn et al. [22]. Olbjørn et al. evaluated ESR, CRP, and fCal at diagnosis and after 12–24 months of biologic treatment. A high ESR at diagnosis was identified as a predictor of further biologic treatment, as in our study. Moreover, we noted higher PLT and PCDAI and lower Hb and MCV in this group of patients. In our study, results after 8–12 weeks showed that more than half of the patients who required biologic therapy at 2-year follow-up had elevated CRP and ESR, compared to only a quarter of patients in the other group. Abnormal results for PCDAI (including ESR and albumin), MCV, and CRP were noted in about 35% of patients who received intensified treatment, compared to about 4% of patients who did not require intensified treatment. In addition, the multivariable regression analysis showed the significant value of PCDAI and MCV as predictors of risk of intensification of treatment in the next 2 years. The low MCV is related to deficiency anemia, often seen in children with IBD [26, 27]. To the best of our knowledge, MCV has not been evaluated in published studies in the first months of disease as a predictor of poor outcome of IBD. In addition, low Hb (< 12 g/dl) at time T1 was found in less than 4% of children in the group without CD progression in the next 2 years and no concomitant abnormal PCDAI, CRP, and Hb values were observed in this group. As mentioned previously, the combination of fCal and CRP is better than fCal alone in the evaluation of children with CD [7]. In our study, we did not include fCal in the analysis due to its lack of normalization after 8–12 weeks of treatment. Turner et al. found that fCal decreases irrespective of treatment (steroids or exclusive enteral nutrition) within 8 weeks of starting treatment in both CD and UC, indicating that assessing fCal over a shorter period may not be helpful in clinical practice [28]. Furthermore, Levine et al. observed a reduction in fCal in 23–50% of children with CD regardless of the type of initial therapy (steroids, EEN, 5-ASA) [6]. Similarly, Matuszczyk et al. reported a reduction in fCal < 250 µg/g in less than one-third of children with CD after 12 weeks of treatment of CD with an exclusion diet combined with partial enteral nutrition [29]. Our results suggest that finding still abnormal PCDAI (> 10), CRP (> 5 mg/dl) and MCV < 75 fl results at the follow-up time point is more useful in predicting which patients will require close monitoring. More studies are needed to assess the usefulness of the combinations of different factors in daily clinical practice
Regarding children with UC, only a few publications are available that focus on early markers of poor prognosis of the disease and the need for biological therapy [24, 25]. Among our patients, nearly 32% required biological treatment within two consecutive years. At the time of diagnosis, only ESR values significantly differentiated the study groups. Hyams et al. noted that factors leading to escalation of therapy included low levels of Hb, vitamin D3, and eosinophil counts in rectal biopsy specimens at the time of diagnosis [24]. On the other hand, Gasparetto et al. noted that children with severe UC (requiring biologic treatment and/or major surgery within 18 months) had lower albumin and Hb values at diagnosis compared to mild disease [25]. In contrast, ESR values did not differ significantly between patient groups [25].
Interestingly, in our study, more differences in assessed parameters between the groups requiring and not requiring biological treatment were found after 8–12 weeks of remission-inducing treatment. The group with UC progressing despite treatment had significantly higher values of PUCAI and most inflammatory parameters (ESR, PLT, fCal) and lower levels of albumin, Hb, and MCV after 8–12 weeks compared to the group not requiring biological treatment. Although PUCAI scores decreased over 8–12 weeks of follow-up in both groups, clinical remission (PUCAI < 10) was achieved by the majority of children in the group without biological treatment, while there were a few cases with severe disease in the other group. Similar results were obtained by Gasparetto et al., who noted that the clinical assessment with PUCAI of patients 3 months after diagnosis is important for predicting the severity of the disease [25]. They observed that clinical remission without steroids, as well as PUCAI assessed at month 3 of the disease, are the most reliable clinical predictors of long-term remission in children in subsequent years. However, no laboratory parameter was evaluated during follow-up in this study, making it impossible to compare most of our results. In our study, significantly lower fCal values at T1 were observed in children not requiring biologic treatment. However, it should be noted that less than half of the patients had fCal < 200 µg/g. Perhaps the reasons for the lack of normalization of fCal in our study were the measurement of fCal too soon after the inclusion of remission-inducing treatment and the more severe form of the disease at the time of diagnosis. It is now emphasized that the goal of treating patients with IBD is not only to achieve clinical remission, but also mucosal healing, which is a long-term process [30]. Therefore, monitoring fCal over a longer period seems to be more important. The use of multivariate regression analysis in our study revealed that the high predictive value of weak improvement in albumin levels after 2–3 months may be associated with a higher risk of a more severe disease course requiring treatment with TNF-α inhibitors. However, it should be noted that in the ROC analysis, the cut-off point for albumin differentiating both study groups was 4.58 g/dl, which is within the normal laboratory range. Moreover, the albumin values were within normal laboratory limits in the majority of patients at the follow-up time point. Perhaps in the group of children with UC, different normal values of albumin should be considered. To the best of our knowledge, published studies have not assessed the usefulness of albumin assessed 8–12 weeks after diagnosis of UC to the need for treatment intensification. The only study, by Hyams et al., reported that a higher baseline albumin level of 1 g/dl in the < 12 age group could indicate remission without CS 12 weeks after diagnosis in children with UC [31]. In adults, the positive value of the neutrophil-to-albumin ratio in determining the response to IFX treatment and long-term maintenance of remission has been observed. Higher peripheral neutrophil counts compared to healthy controls were positively correlated with the severity of endoscopic lesions according to the Mayo score [32, 33]. However, in both studies, the neutrophil to albumin ratio was assessed just before IFX was included (up to 1 week earlier). Finally, we determined the usefulness of a combination of two or three selected clinical and laboratory markers (PUCAI, Hb and PLT/albumin ratio) in predicting which UC patients would require anti-TNF-α treatment, and the results were comparable to the CD group (PCDAI, MCV, and CRP).
The most important outcome of our study was to demonstrate the usefulness of common biochemical parameters assessed after 8–12 weeks of remission-inducing treatment in predicting which patients with CD or UC will require close monitoring in subsequent years of disease and more rapid intensification of treatment. To date, only a few studies in the pediatric population have focused on outcomes not only at the time of diagnosis, but also at specific time points. Another strength of this study is that our department was the main pediatric endoscopy center with histopathological examination in northeastern Poland, diagnosing all IBD in children in recent years, and all patients remained under monitoring until the age of 18. It should be noted that the markers we are analyzing are readily available and inexpensive. The present study also has some limitations. First, the small number of participants does not allow us to generalize our results and reduces statistical power. The number of patients included in the study was low due to the time frame and monocentric nature of the study. We recognize that our results may be subject to errors of omission (type II error) and did not interpret non-significant results as underlying a true null difference. Another limitation is the retrospective analysis, which involves potential errors. Further research without these limitations would be useful.
In conclusion, our results suggest that the assessment of patients’ clinical and routine biochemical parameters, not only at the time of diagnosis, but also shortly after initial remission-inducing treatment, is a promising benchmark for predicting the course of the disease over the next 2 years. In a multivariate regression model, the risk of anti-TNF-α therapy in patients with CD was associated with failure to normalize MCV and PCDAI after remission-inducing treatment. In contrast, in patients with UC, higher albumin levels reduced this risk of such therapy. Further studies in a larger group of patients are needed to confirm the usefulness of the markers we analyzed. Perhaps long-term studies of new genetic, serological, or microbiological markers would provide more information about the course of the disease [34, 35].