It is generally known that tumor and venous thromboembolism (VTE) are interrelated. VTE, a primary reason for death, can take place in about 20% of terminally ill patients [1]. The connection of tumors with arterial thromboembolism (ATE), as opposed to VTE related to cancer, has only lately been proven. For ischemic stroke, tumor is one of the known sensitive markers [2–4]. Tumor sufferers get a 2-fold greater chance of having an ischemic stroke within the initial 0.5 years following their medical assessment [2]. Compared to controls, strokes in tumor sufferers are typically more painful and deadly, and relapse more frequently [5].
By illustration, D-dimer, a nonspecific fibrin breakdown product, is a widely used marker for VTE in the clinic [6]. Multiple risk indicators and markers have also been found for tumor-induced VTE. According to the Optimal Anticoagulation Strategy In Stroke (OASIS)-Cancer study, extracellular matrix components and neutrophil extracellular trap formation (NETosis) are seen in high serum levels in tumor and ischemic stroke patients than controls [7, 8]. However, the repeatability and universality of the aforementioned indicators might restrict their potential efficacy.
Soluble P-selectin (sPsel) has drawn interest as a biomarker for both VTE and ATE. It is a member of the selectin family of cell-adhesion molecules, which is expressed on platelets and endothelial cells and mediates cell interaction, and it stimulates the formation of thrombin and fibrin, which indicates proangiogenic characteristics and a thrombogenic state [9]. Elevated sPsel serum contents are seen to be highly linked with VTE in case-control studies of non-tumor VTE patients and healthy participants without a diagnosis of vein or artery thrombosis [10]. sPsel was again demonstrated to be a significant predictor for recurring VTE in the prospective observational research [11]. Additionally, tumor sufferers had an increased probability of developing ATE when their sPsel contents were raised [12]. Moreover, chemotherapy and other anti-cancer treatments will lead to increased levels of sPsel and deep vein thrombosis (DVT) [13].
This meta-analysis aimed to compile the latest information on the role of sPsel in the identification of tumor-related thrombosis, specifically VTE and ATE.
The meta-analysis complies with the standard of Preferred Reporting Items for Systematic Reviews and Meta-Analyses (PRISMA) [14]. We have supported a copy of the PRISMA checklist.
We performed a literature search through the following databases: PubMed, Cochrane Central databases, Web of Science, EMBASE, Ovid, and Chinese BioMedical (CBM) Literature Database (Sinomed), China national knowledge infrastructure (CNKI) and Wanfang databases for studies until February 22, 2022.
Keywords included: “cancer,” “P-selectin” and “thromboembolism” and the following were also used: (“cancer” OR “neoplasms” OR “tumor*”) AND (“P-selectin” OR “CD62P Antigens”) AND (“venous thromboembolism” OR “pulmonary embolism” OR “artery thromboembolism” OR “stroke” OR “infarction”). The references of relevant studies and review articles were also checked to identify additional studies. The systematic review protocol and search strategy were registered online (PROSPERO: CRD42022319435). Two authors (Z.X.L and Z.C) evaluated the titles and abstracts respectively to summarize the full manuscript.
Inclusion criteria: 1) tumor sufferers; 2) studies reported sPsel levels in both the cancers with thrombosis group and the cancer group quantitatively and qualitatively; 3) odds ratios (ORs), relative risk (RR) or hazard ratios (HRs) with 95% confidence intervals (CIs); 4) age more than 18 years; 5) the sample size; 6) sPsel contents with determined values; and 7) full text is available. Exclusion criteria: 1) conference abstracts, editorials, reviews, letters, case reports, or nonclinical studies; 2) languages other than English and Chinese.
By separately reviewing paper titles and abstracts, two authors (Z.X.L and Z.C) screened publications that might qualify. A second screening based on a detailed rundown was then conducted. Additionally, the aforementioned two authors separately collected the information. The retrieved data were then verified for quality and completeness by a new author (M.Z). In the event of a disagreement during the collection and analysis process between two separate authors, Z.Y.H was consulted as a third author. The articles’ first author’s name, publishing year, location, nationality, and study population were all taken out (a population less than 100 was defined as a small sample, and greater than or equal to 100 was defined as a large sample), age, gender, design, tumor types and sPsel levels in two groups (Table I). If the included studies provided data of median and range or median and interquartile range, the data were transformed to mean and standard deviation using an online computing tool (http://www.math.hkbu.edu.hk/~tongt/papers/median2mean.html) [15, 16].
Table I
The characteristics of included studies
| Study | Ethnic origin | Design | Prospective or retrospective | Size | Case/control | P-selectin [ng/ml] (case/control) | Age (case/control) [years] | Gender (male/ female) | Solid/hematological (case/control) | Effect size | Local/ Metastatic | Quality assessment |
|---|---|---|---|---|---|---|---|---|---|---|---|---|
| Castellón Rubio V.E. | Non-Asian | Cohort | Prospective | 90 | 18/72 | (35.29 ±17.86)/(8.53 ±8.17)a | 56 (52–62)/ 63 (58–69) | NA/NA | 18/0 72/0 | HR = 66.4, 95% CI: 8.7–506.69, p < 0.001 | M0/M1 2/16 M0/M1 15/57 | 9b |
| Cihan Ay | Non-Asian | Cohort | Prospective | 687 | 44/643 | (48.17 ±21.00)/ (42.42 ±14.33)a | 62 (48–66) NA | NA NA | 596/91 40/4 NA | HR = 2.6, 95% CI: 1.4–4.9, p = 0.003 | NA | 9b |
| Elmoamly S. | Non-Asian | Cohort | Prospective | 171 | 12/159 | (28.88 ±26.57)/(26.1 ±22.37) | 45 (23–61) 50 (18–-81) | 5/7 NA | 0/12 0/159 | NA | NA | 7b |
| Li Kun | Asian | Case-control | Retrospective | 58 | 28/30 | (71.25 ±51.06)/ (42.98 ±43.08) | NA NA | NA NA | 28/0 30/0 | NA | L/M 5/23 L/M 9/21 | 5b |
| Malaponte G. | Non-Asian | Cohort | Retrospective | 385 | 64/321 | (75.8 ±32.3)/(55.4 ±22.5) | (64 ±10) (62 ±9) | 35/29 150/171 | 56/8 287/34 | NA | L/M 29/35 L/M 181/140 | 5b |
| Riedl J. | Non-Asian | Case-control | Retrospective | 393 | 131/262 | (45.98 ±22.04)/ (39.21 ±14.54)* | 63 (54–69) 61 (51–67) | 76/55 141/121 | 116/15 232/30 | HR = 2.27, 95% CI: 1.39–3.70, p = 0.001 | L/M/U 36/49/46 NA | 8b |
| Schorling R.M. | Non-Asian | Cohort | Prospective | 72 | 6/67 | (54.31 ±34.28)/ (48.71 ±19.70)a | 62 (56–72) NA | NA | 10/0 90/0 | NA | L/M 1/9 NA | 9b |
| Xiao X. | Asian | Case-control | Retrospective | 61 | 30/31 | (70.92 ±50.48)/(43.13 ±42.78) | NA | NA | 30/0 31/0 | NA | L/M 8/22 L/M 10/21 | 6b |
| Xin S.Z. | Asian | Cohort | Prospective | 29 | 3/26 | (128.49 ±8.18)/(112.62 ±10.31) | NA | NA | 3/0 26/0 | NA | NA | 7b |
| Zhong X. | Asian | Case-control | Retrospective | 63 | 20/43 | (31.46 ±17.13)/(13.51 ±7.43) | 54.5 ±12.8 53.3 ±11.7 | 12/48 25/18 | 20/0 43/0 | NA | I + II/III + IV 15/5 I + II/III + IV 33/40 | 6b |
| Fernandes L.F.B. | Non-Asian | Cross-sectional | Prospective | 117 | 44/73 | (33.6 ±23.35)/(20.40 ±6.92) | NA | 32/30 38/78 | 44/0 73/0 | OR = 3.385, 95% CI: 1.396–8.208, p = 0.007 | NA | 7c |
| Navi B.B. | Non-Asian | Cross-sectional | Prospective | 100 | 50/50 | (43.54 ±25.95)/ (35.42 ±13.74)a | 69 (60–76) 68 (58–74) | 24/26 24/26 | 50/0 50/0 | OR = 7.2, 95% CI: –3.9–18.3 | NA | 9c |
| Setiawan | Asian | Cohort | Prospective | 40 | 5/35 | (138.65 ±81.51) /(73.5 ±14.92)a | 42 (20–59) 49 (21–71) | 2/3 20/15 | 5/0 2/33 | RR = 1.02, 95% CI: 0.98–11.05, p = 0.260 | L/M 2/3 L/M 21/14 | 9b |
| Grilz E. | Non-Asian | Cohort | Prospective | 1883 | 48/1835 | (44.64 ±15.06)/NAa | 66 (60–69) NA | 37/11 NA | 44/4 NA | HR = 1.8, 95% CI: 1.2–2.8, | L/M/U 19/14/15 NA | 9b |
| Thaler J. | Non-Asian | Cohort | Prospective | 141 | 24/117 | (49.94 ±20.65)/NAa | 54 (44–64) NA | 19/5 NA | HR = 2.71, 95% CI: 1.34–5.78, p = 0.006 | NA | 9b | |
| Obermeier | Non-Asian | Cohort | Prospective | 795 | 56/739 | (48.71 ±20.47)/ NAa | 62 (53–66) NA | 33/23 NA | 48/8 NA | HR = 1.61, 95% CI: 1.00–2.58), p < 0.05 | L/M/U 11/23/22 | 9b |
a Data were expressed as mean ± SD according to https://www.math.hkbu.edu.hk/~tongt/papers/median2mean.html.
According to the Newcastle-Ottawa Scale (NOS), the prospective and case-control studies’ performance was measured. Patient selection (0–4 points), comparability (0–2 points), and effectiveness were the 3 main areas included in the NOS (0–3 points). Studies with a NOS score of ≥ 6 were deemed to be of excellent standard. The Agency for Healthcare Research and Quality (AHRQ)’s 11-item criteria were used to evaluate the methodological quality of cross-sectional studies. If a question was responded with “NO” or “UNCLEAR”, the element received “0” score; if “YES”, “1” score. Low, moderate, and high-quality articles referred to 0–3, 4-7, and 8-11, respectively.
For sPsel levels and a composite assessment of RR with 95% CI, the data were displayed as mean difference (MD) and 95% CI. By combining the collected OR/RR/HR as probability assessments, RR was determined. Given the heterogeneity among multiple studies, we opted for a random-effects model as opposed to a fixed-effects model. Forest plots were used to display results graphically.
For subgroup assessment, heterogeneity was assessed using the I2 statistic, with a value of 25–49% representing low heterogeneity, 50–75% moderate heterogeneity, and > 75% high heterogeneity. A Z test was used to examine the consequences, and the suitable statistical threshold was chosen to be p < 0.05. Review Manager 5.4.1 and Stata SE16.0 were used for all analyses. A sensitivity analysis was conducted to assess the stability of pooled results. The presence of publication bias was further tested using Begg’s test.
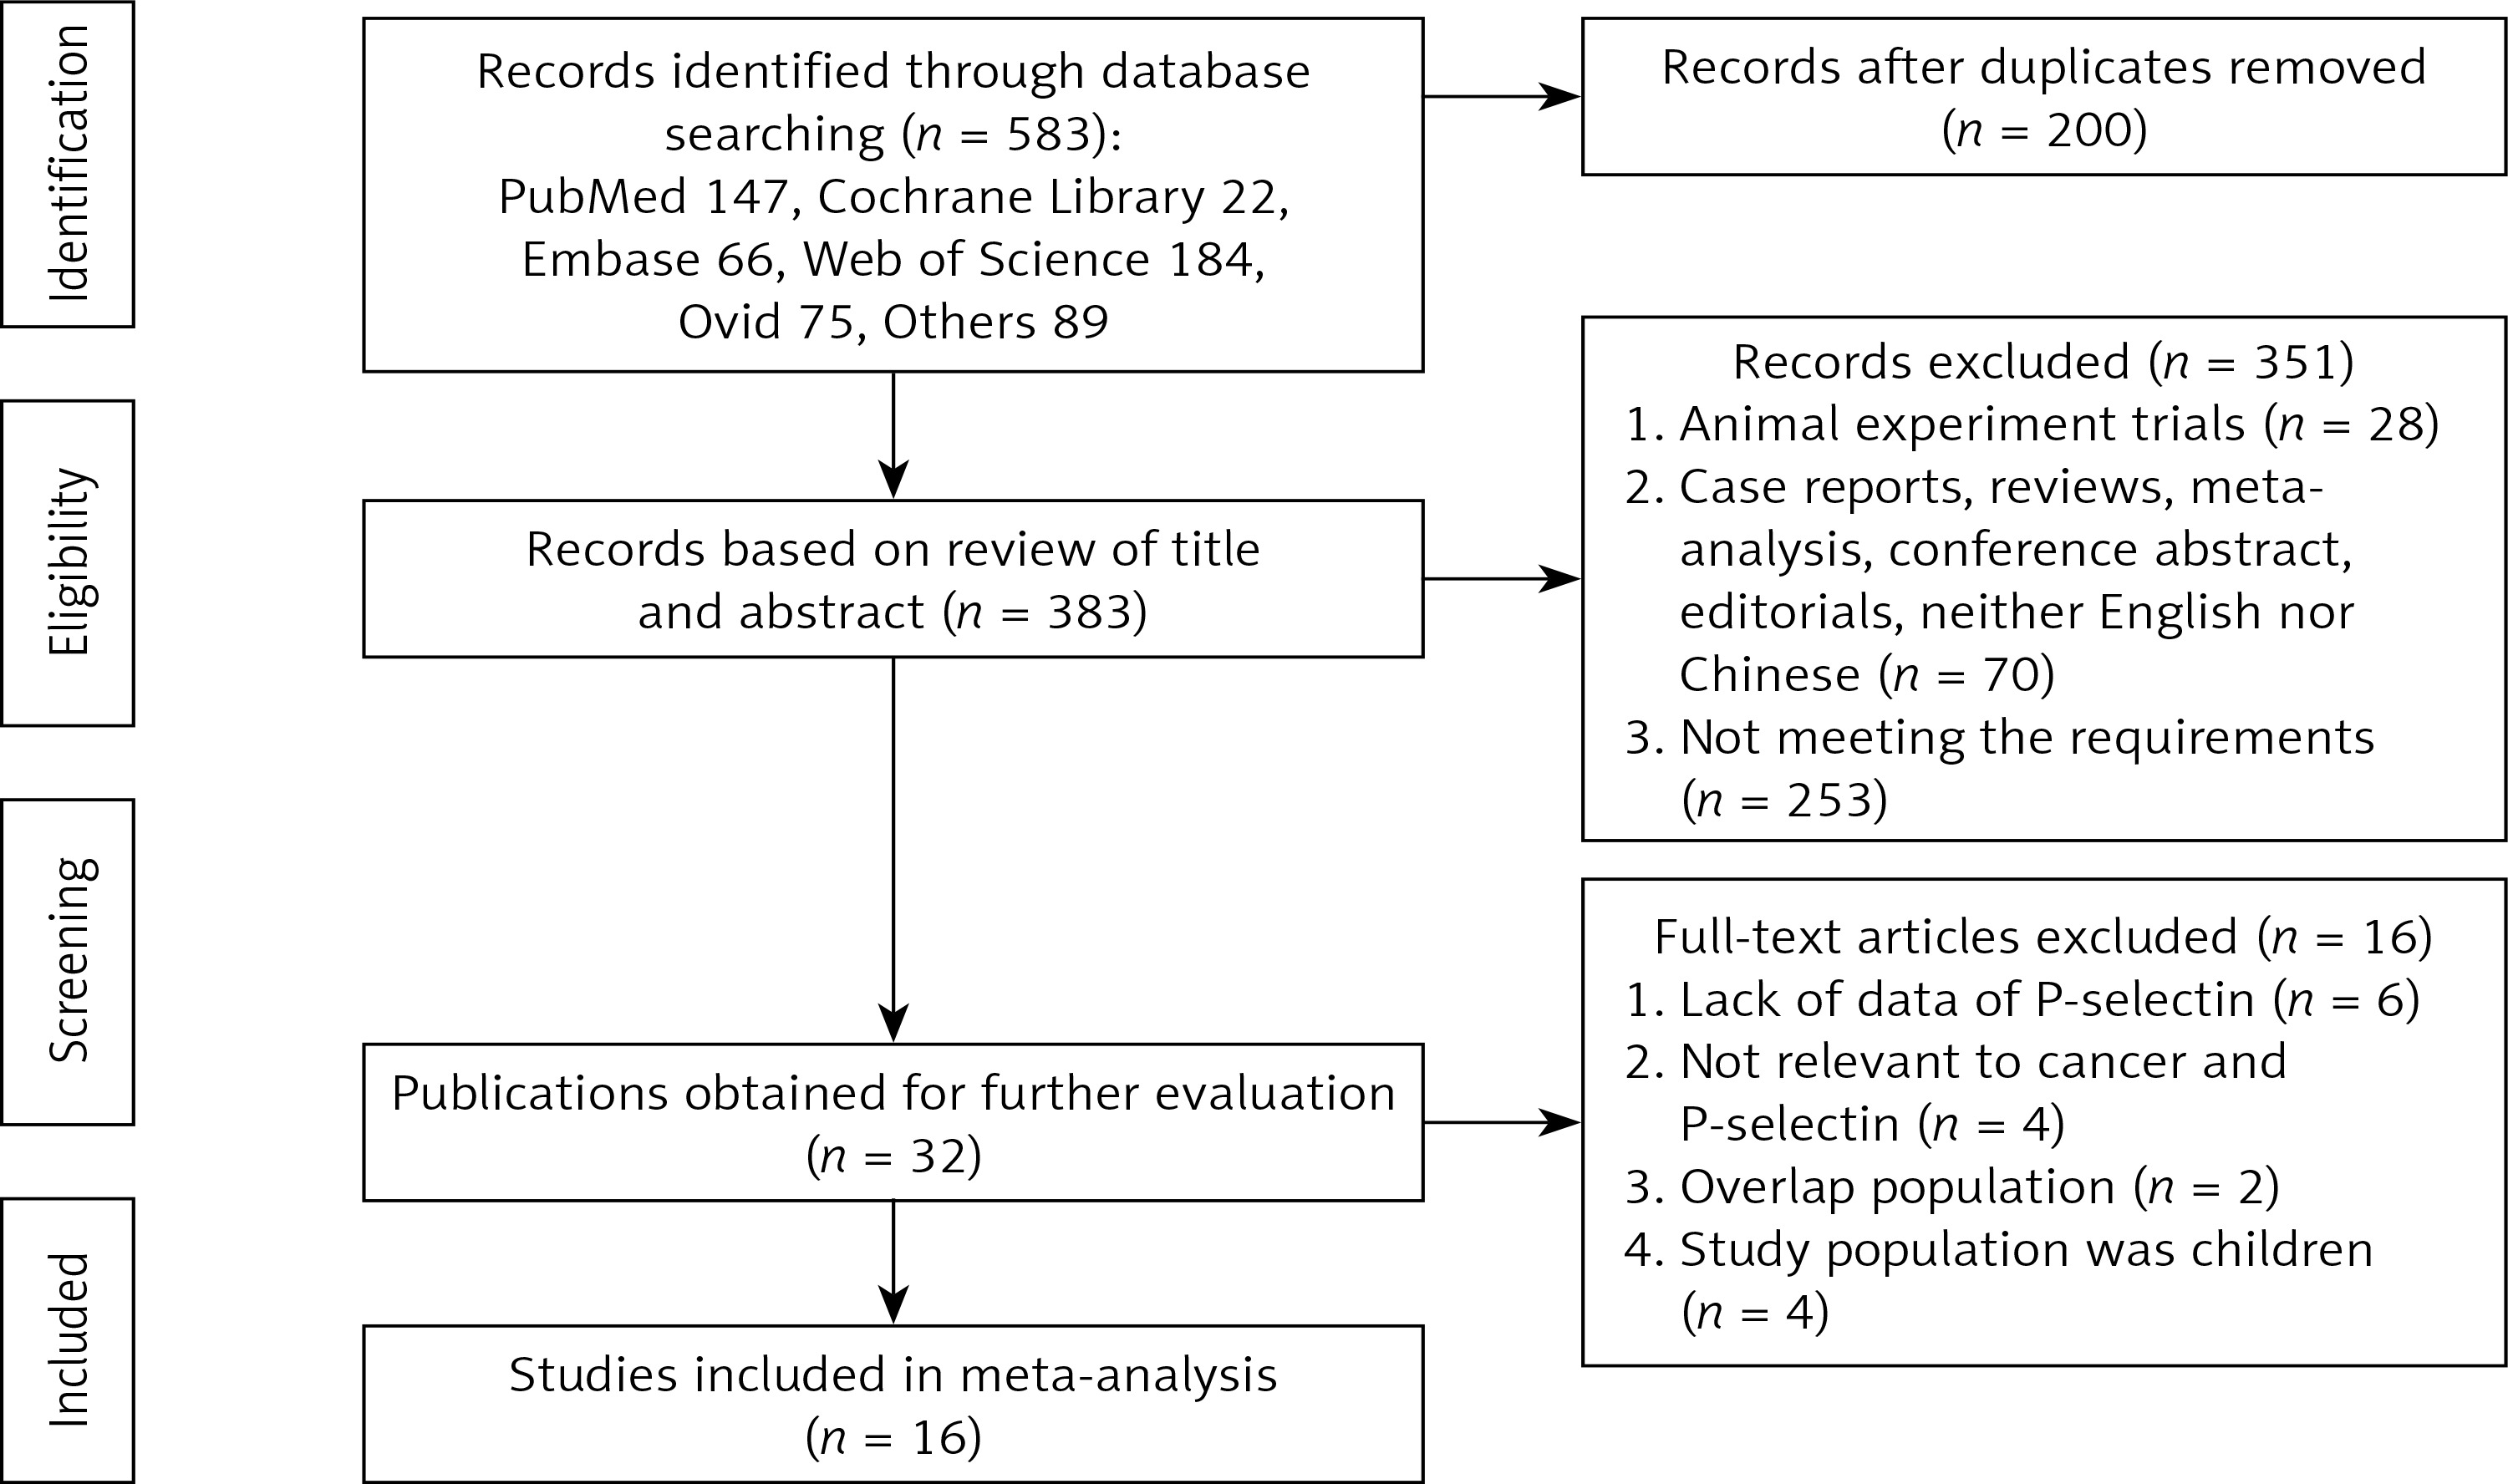
Totally, 16 studies involving 455 cancer-associated thrombosis patients and 1812 cancer patients were enrolled (Figure 1).
All of the selected articles were assessed for methodological quality. The quality score of each study was presented in Table I. Eleven studies were of high quality [13, 17–31], one study was of moderate quality [20] and two studies were of low quality [21, 29].
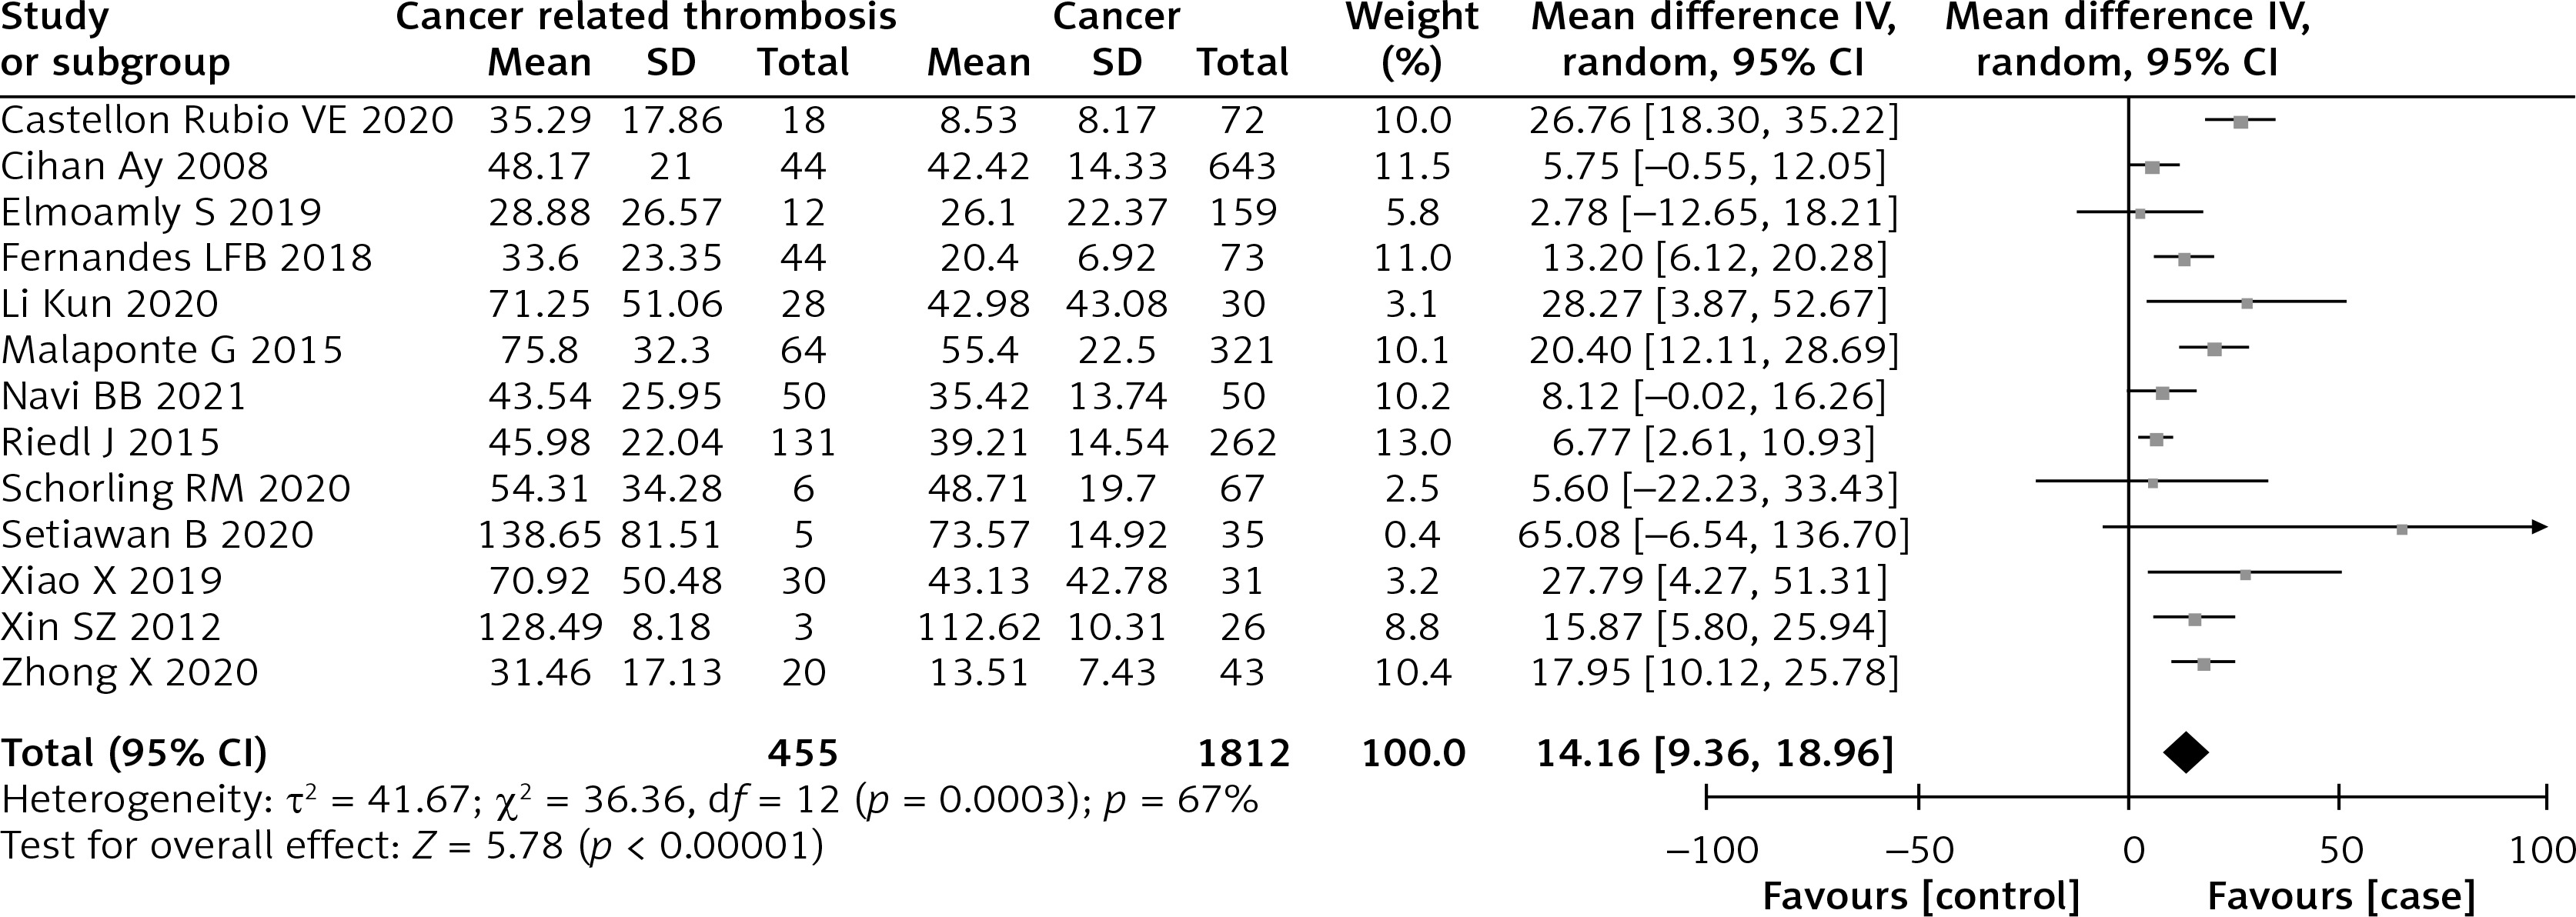
The pooled data exhibited that sPsel contents in cancer-associated thrombosis sufferers were conspicuously raised than in cancer sufferers (MD = 14.16, 95% CI; 9.36–18.96, I² = 67%, p = 0.0003) (Figure 2). Subgroup analyses did not show significant differences regarding the study design, tumor types, neoplasm staging or quality. Ethnic origin and sample size had a significant effect on the heterogeneity. Stratified by the ethnic origin, the level of sPsel of the Asians was higher than that of the non-Asians (MD = 18.75, 95% CI: 12.96–24.53 vs. MD = 10.90, 95% CI: 5.41–16.38, p = 0.05; I2 = 68%, p = 0.0002, random effect model). Meanwhile, the heterogeneity (I2) of the small study population (n < 100) group decreased to 8% after performing subgroup analysis with sample size, and it suggested that sample size probably was another bias of heterogeneity.
Figure 2
Forest plot for sPsel contents among cancer-associated thrombosis sufferers and cancer sufferers
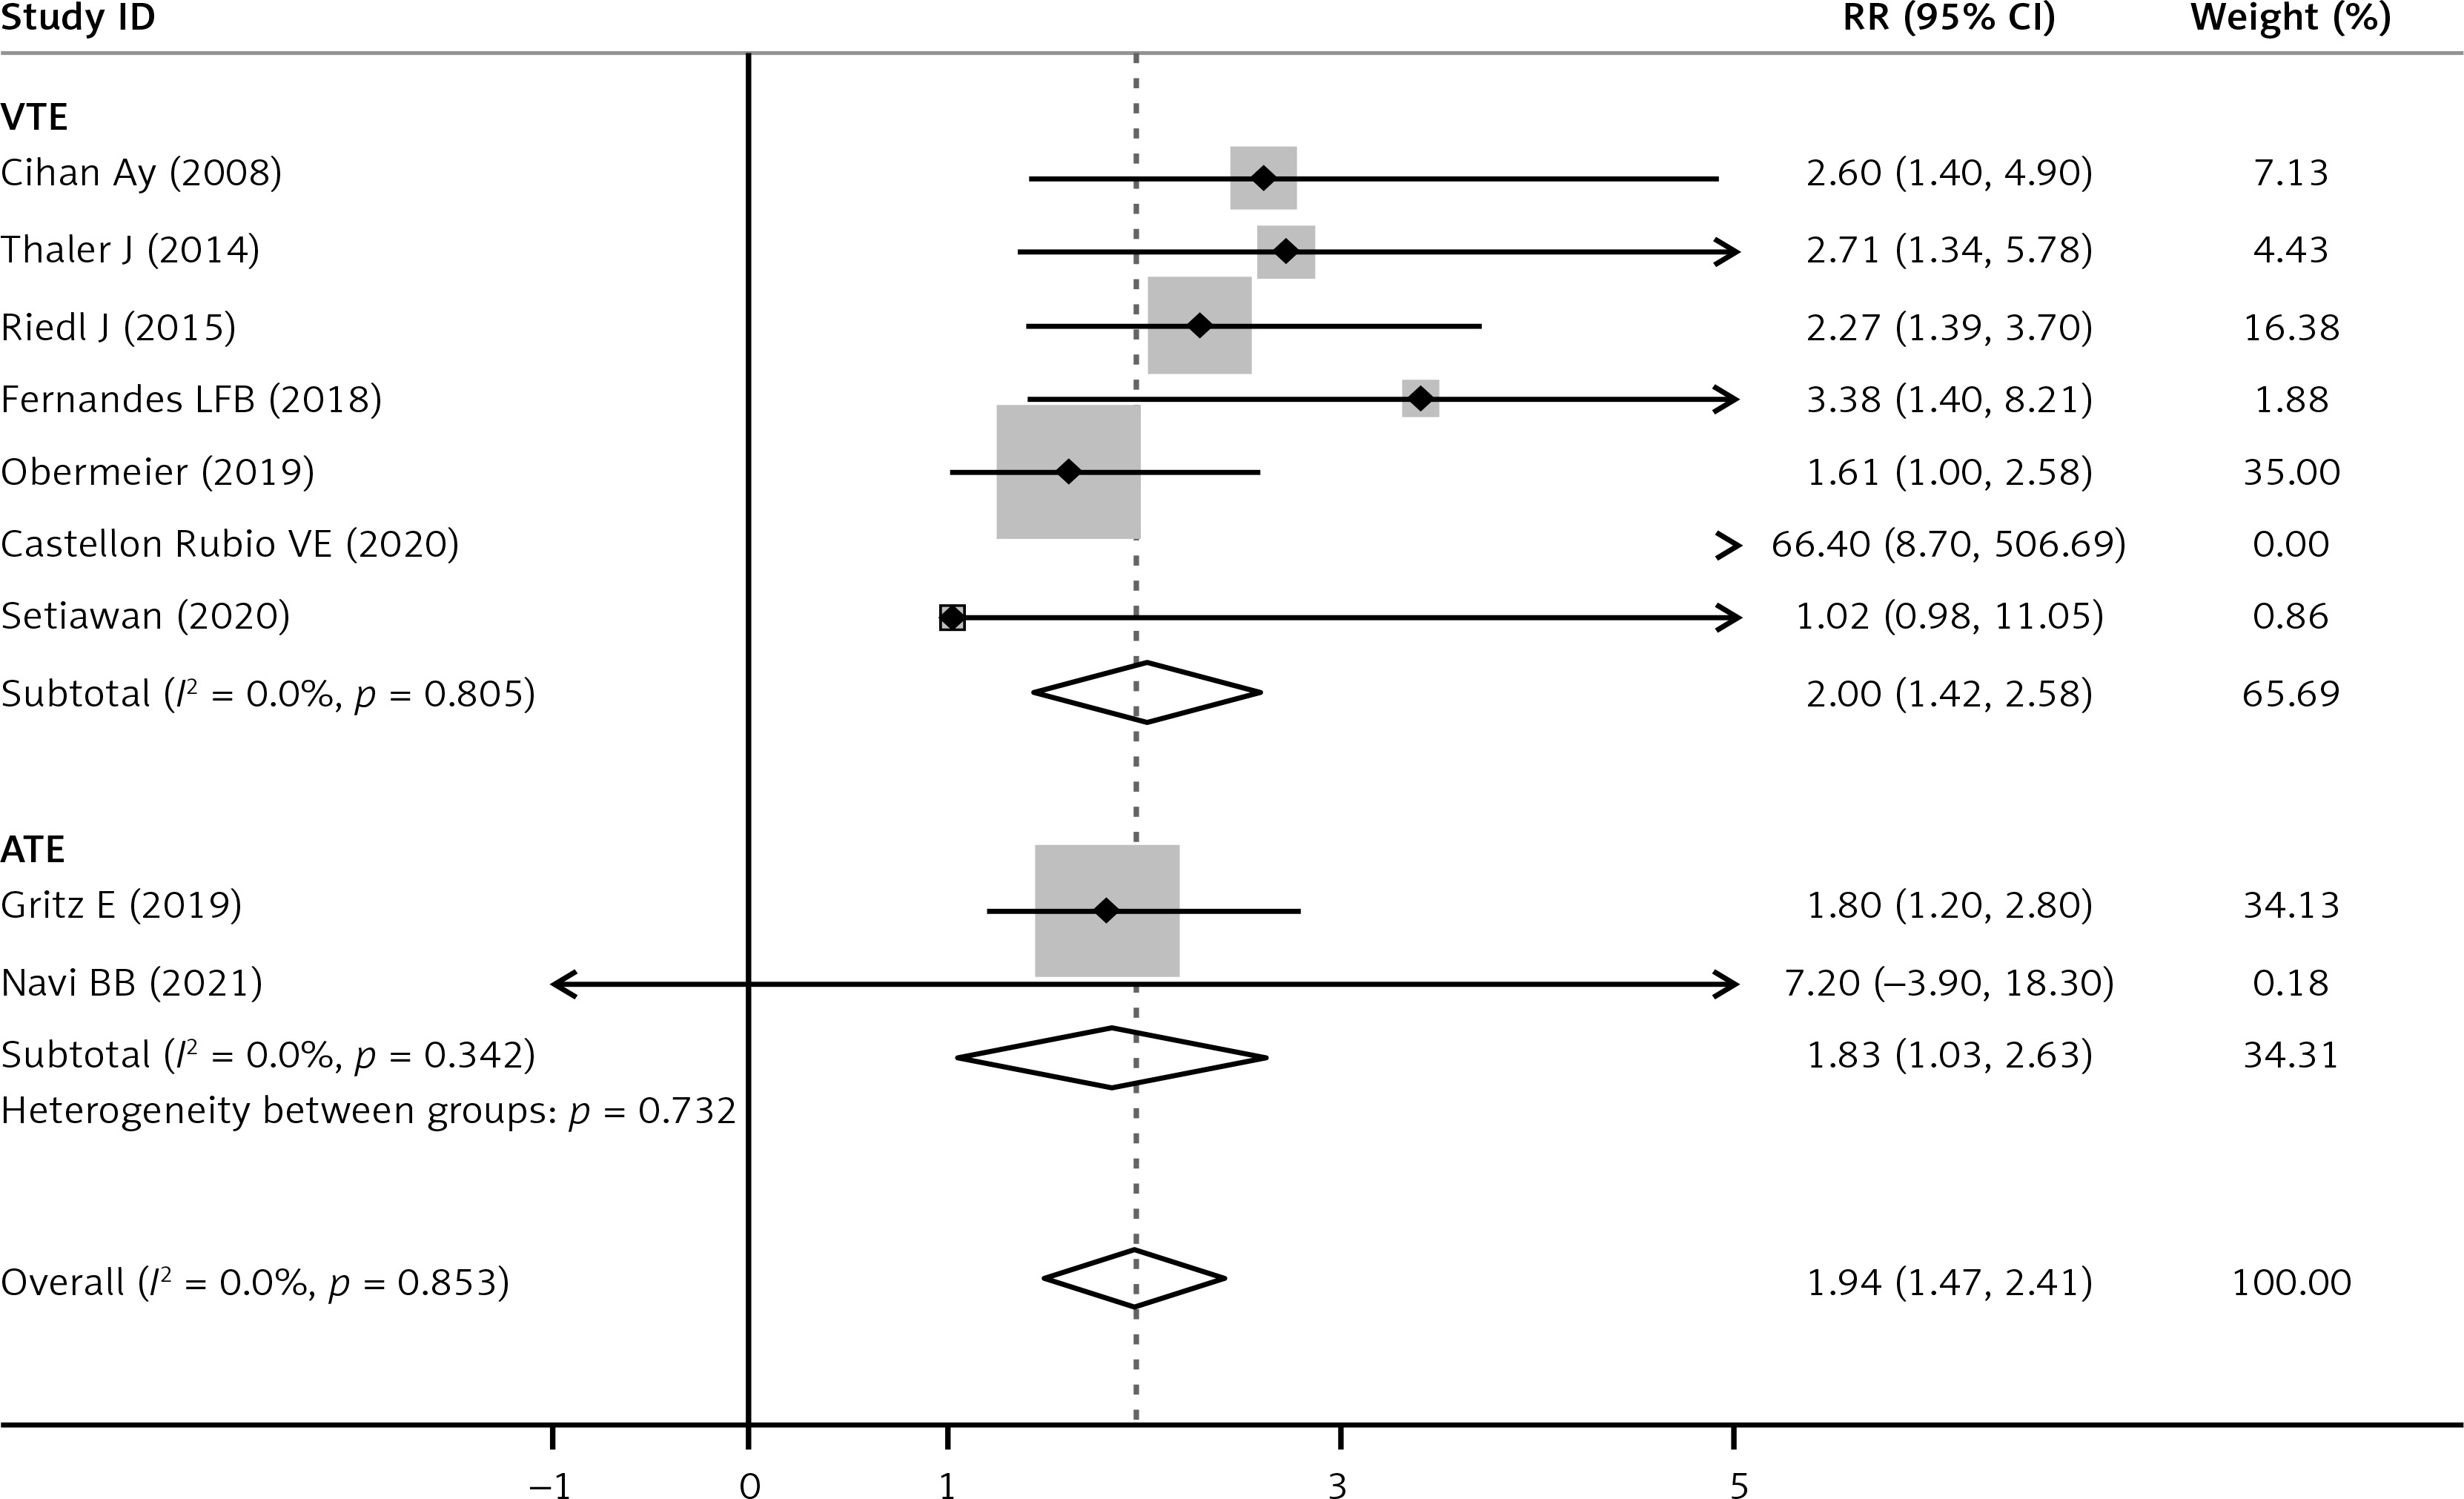
The sPsel level was significantly increased after cancer patients developed thrombosis (pooled RR = 1.94, 95% CI: 1.47–2.41, p < 0.001; I2 = 0%, p = 0.853, fixed effects model, Figure 3). As shown in Table II, there was no significant difference of sPsel level between cancer-associated VTE and ATE when subgroup analysis was based on the type of thromboembolism. sPsel was higher in VTE (RR = 2.00, 95% CI: 1.42–2.58, p < 0.001) and ATE populations (RR = 1.83, 95% CI: 1.03–2.63, p < 0.001, Figure 4), without between-study heterogeneity (p = 0.732).
Table II
Results of a meta-analysis of subgroups
Figure 3
Forest plot of RR for pooled outcome comparisons between cancer-associated thrombosis patients and cancer patients
RR – relative risk, CI – confidence interval
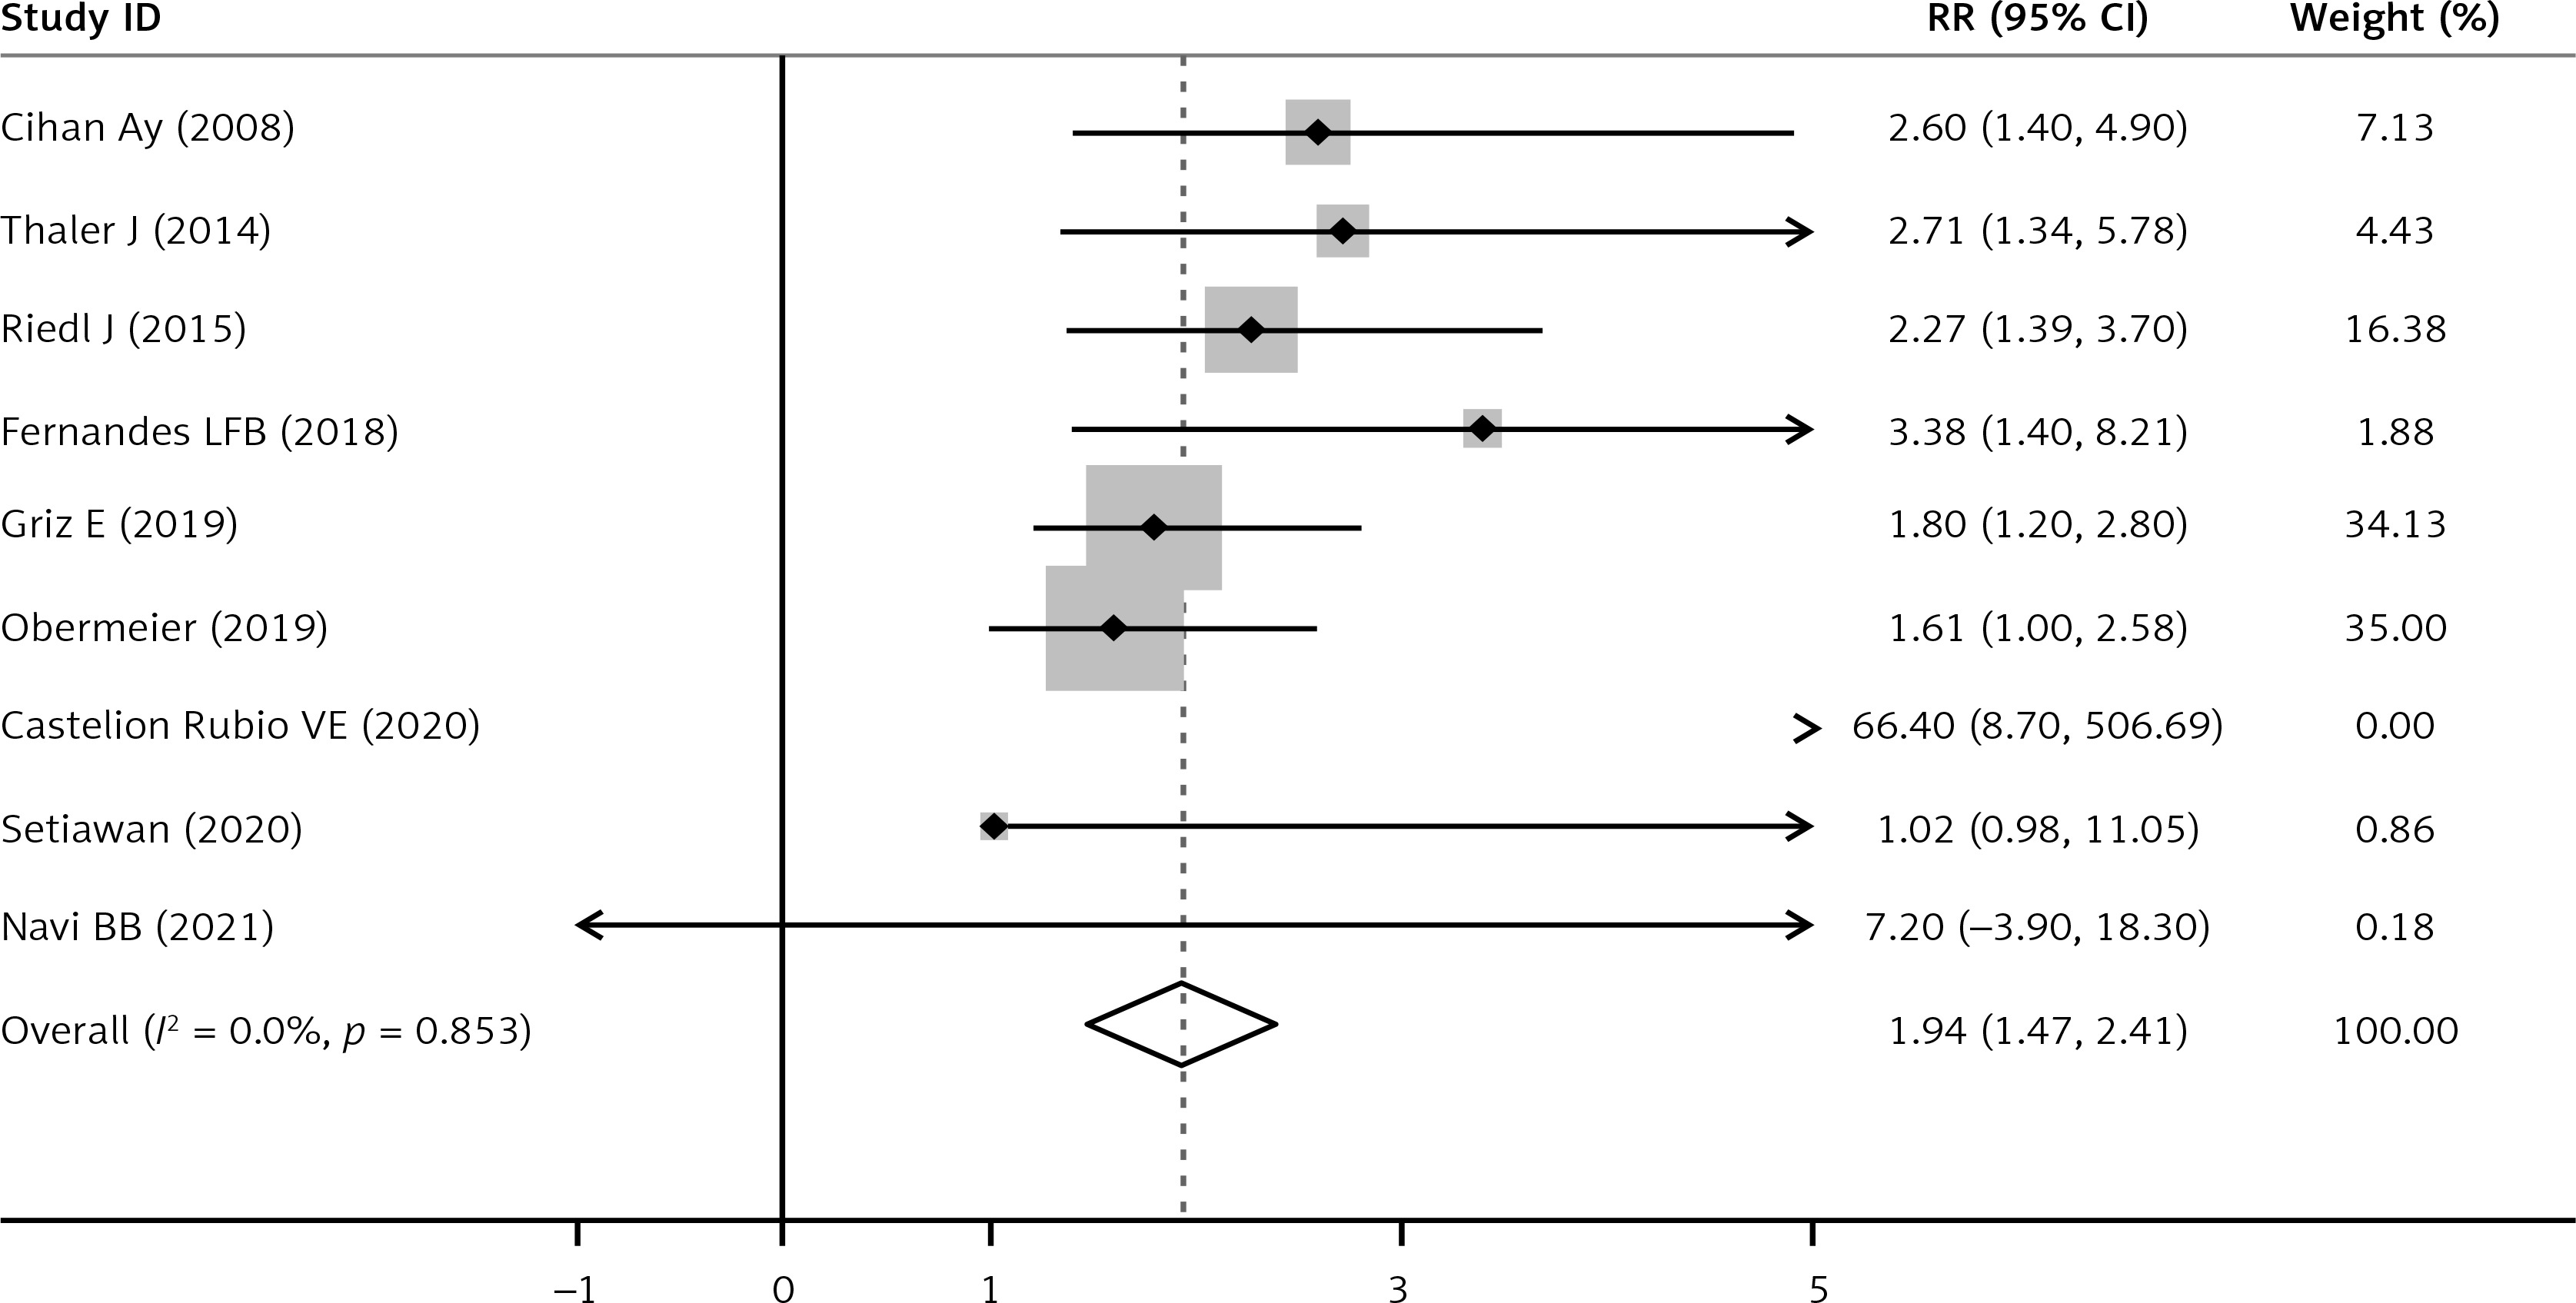
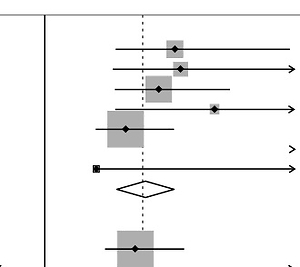
Figure 4
Forest plot according to RR of sPsel for VTE and ATE sufferers with their controls. Relative risk (RR), Confidence interval (CI), soluble P-selectin (sPsel), venous thromboembolism (VTE), artery thromboembolism (ATE)
The deletion of any research did not change the pooled outcomes notably. Publication bias was tested by Begg’s test, and the results showed that P-selectin (p = 0.849) and pooled RR (p = 0.081) had no publication bias.
Cancer induces a 7-fold risk of VTE [32]. In contrast, cancer-related ATE has been just recently established. The etiopathogenesis of thromboembolism in tumor sufferers appears to be multifactorial. Once more, tumor formation, development, expansion, and migration are encouraged by tumor cells’ capacity to connect with and stimulate the hemostatic system and coagulation [33].
In thrombosis, infection, and the development and progression of cancer, P-selectin facilitates the adherence of platelets and tumor cells [12]. P-selectin and its primary counter-interaction receptors cause the production of procoagulant microscopic particles and promote the creation of thrombus and fibrin [12]. Additionally, P-selectin has been shown to promote surface-dependent thrombin production on monocytes and tissue factor expression [32]. It is interesting to note that tumor cells can boost the production of P-selectin on platelets, endothelial cells, macrophages, and monocytes [33]. Thrombin, its fractions, or other variables that cause a hypercoagulable condition may stimulate platelets, elevating sPsel [11].
According to C’s study (based on data from the CATS database), elevated plasma sPsel contents substantially reflect VTE in tumor sufferers [17]. Patients who are at a higher risk of VTE may be identified by measuring sPsel at the time of tumor diagnosis. Deterministic markers have only been examined in a small number of prospective trials in tumor and stroke patients. Arterial thrombosis is largely influenced by activated platelets. Bielinski et al. [34] revealed that elevated sPsel contents forecasted a 1.8-fold elevation in the probability of coronary heart disease in non-cancer individuals.
To our knowledge, we reported the first systematic review and meta-analysis of a specific level of sPsel in cancer-associated thrombosis, including VTE and ATE, published to date. Our study indicated for the first time that sPsel may be a risk factor for cancer patients with VTE or ATE.
The previous meta-analysis performed by Constantine first reviewed that the sPsel was significantly elevated in patients with VTE and it was a plasma biomarker that may help in the diagnosis of VTE [35]. The specific levels of sPsel were still unclear in patients with cancer-associated VTE and ATE. We conducted a pooled assessment of 16 studies. The results of this meta-analysis, synthesizing evidence of levels of sPsel from 455 CAT patients and 1,882 cancer patients from 13 types of studies indicated that sPsel contents were markedly raised in tumor sufferers associated with VTE and ATE. Mean sPsel contents were 1.94, 2.00, and 1.83 times higher in tumor sufferers with thrombosis, with VTE, and with ATE, respectively, compared to cancer patients.
Cancer-associated thromboembolism (ATE) has been just recently established [2–4]. There is a relationship of sPsel with ATE in tumor sufferers [13] or controls [36, 37]. Otherwise, another study [22] revealed that all hematological biomarkers except P-selectin were prominently raised in the tumor and stroke sufferers than tumor sufferers. Multiple linear regression models showed that tumor and stroke sufferers were dramatically related to higher D-dimer, but not P-selectin. So, it is controversial about levels of P-selectin in cancer-associated ATE. In our meta-analysis, cancer-associated ATE has a higher level of sPsel than cancer patients, suggesting sPsel is probably related to cancer-associated ATE.
Population-based subgroup analysis showed that the level of sPsel was significantly higher in Asian cancer patients with thrombosis than that in non-Asians. Besides, Bielinski’s study [34] observed ethnic heterogeneity in the association of P-selectin and the risk of coronary heart disease. Moreover, Asians had a decreased heterogeneity (Table II), indicating ethnics might be the possible source of heterogeneity. Additionally, the research design may not affect the results in the subgroup assessment. The outcome showed no difference among case-control studies, cohort studies and cross-sectional studies, but the cross-sectional study subgroup had a lower heterogeneity (Table II), which might be the possible source of heterogeneity. Meanwhile, in view of prospective or retrospective studies, there was no significant difference, either. Many studies have shown that raised plasma sPsel content notably influences solid tumors [17, 18, 25–27, 31, 38, 39], but few are about hematological tumors. Interestingly, inhibition of platelet activation can prevent the accumulation of P-selectin in cancer cells and reduce the growth and metastasis of tumors in vivo [40]. In Elmoamly’s cohort study, the serum P-selectin level in hematological tumors was not associated with VTE (p = 0.9) [19]. Besides, there was no difference in P-selectin level between local and metastatic cancer patients, possibly resulting from the insufficient sample size. When studying quality as a subgroup, heterogeneity (I2) of low/moderate quality group decreased to 0%, which indicates study quality may be a source of heterogeneity, needing more high-quality studies in the future.
This study has some limitations ineluctably in this meta-analysis. First, the sample size is probably a potential modifier in subgroup analysis. Second, low-quality studies including uncontrolled nature and quite a bit of bias may affect the reliability of the results reflecting methodological drawbacks of the eligible studies. Third, some studies might not be included on account of the unavailable full-text or incomplete data, such as a low absolute number of arterial events.
Future relevant studies may need to focus more on the study population in large-sample and multi-centers around the world. Besides, studies aiming at levels and diagnosed efficiency of sPsel in cancer-associated ATE (stroke, infarction, etc.) instead of VTE are needed. Moreover, high-quality studies and diagnostic clinical trials of sPsel in tumor sufferers associated VTE or ATE are urgently required to identify patients at high risk of thrombosis earlier and guide treatment.
All in all, we showed sPsel as a good indicator for cancer-associated VTE or ATE. Asian cancer patients may have a higher level of sPsel than non-Asians, indicating a genetic difference of sPsel. Evaluation of sPsel may be for monitoring and conduct of early and prompt identification for cancer-associated thromboembolic diseases.