Introduction
Fetal insulin secretion (expressed as C – neonatal peptide level) is related to maternal glycemic state, correlates positively with increased fetal adiposity and weight, and is associated with delivery by cesarean section and neonatal hypoglycemia [1, 2]. Pedersen’s hypothesis published in 1954 linked maternal hyperglycemia and fetal hyperglycemia. The latter leads to pancreatic β-cell hypertrophy, hyperinsulinemia, increased fetal fat deposition, and neonatal hypoglycemia [3]. This hypothesis was confirmed in previous studies that demonstrate glucose as a significant stimulus of β-cell replication in fetal and adult life [4]. Increased fetal β-cell mass has been reported during pregnancy in mild experimental diabetic rats [5].
A multicenter, randomized trial that assessed the postnatal outcome of prenatal treatment for mild gestational diabetes reported a significant reduction in fetal weight, neonatal fat mass, large for gestational age, macrosomia, shoulder dystocia, cesarean delivery, and hypertensive disorders [6], presumably as a consequence of better glycemic control. During the fetal period, the development of the pancreas is critical since abnormal shapes of the pancreas may be related to congenital malformations [7].
The prenatal literature regarding imaging of the fetal pancreas is scarce, with most reported malformations focused on structural malformations while the normal reference range centile was reported previously by our group [8, 9].
The relationship between maternal diabetes and fetal pancreas growth during pregnancy was not reported in the literature.
The present study aimed to assess the effect of glycemic control treatment in pregestational diabetes mellitus (PGDM) and gestational diabetes mellitus (GDM) mothers on the fetal pancreas size compared to the normal population.
Material and methods
A cross-sectional, prospective study was conducted at the Ultrasound Units at the Chaim Sheba Medical Center, Tel-HaShomer, and Maccabi Health Services in Beer Sheva, Israel.
Both local ethics committees approved the study protocol (Maccabi Health Services approval number 2012052 and Sheba Medical Center approval number 7516-09-SMC). Informed consent was obtained from all patients.
The study group included pregnant women carrying a singleton fetus between 19 and 38 weeks of gestation.
Definition of GDM and PGDM was established according to the Israeli Society of Obstetrics and Gynecology criteria.
GDM: 1) fasting glucose value above 125 mg/dl. 2) 1 h 50 g oral glucose challenge test (OGTT) glucose value above 200 mg/dl. 3) Fasting and 3 h 100 g OGTT, blood glucose level above 95, 180, 155, and 140 mg/dl, respectively. Pre-gestational diabetes was based the diagnosis before conception of type 1 or type 2 diabetes mellitus.
Additional inclusion criteria were: (1) accurate dating, based on the first-trimester sonographic crown-rump length measurement; (2) absence of fetal malformations; 3) follow-up at an endocrinology-maternal-fetal-medicine clinic.
Exclusion criteria were: (1) problematic imaging of the pancreas in situations such as morbidly obese women (BMI > 35 kg/m2), anterior fibroids; (2) consistent anterior position of the fetal back.
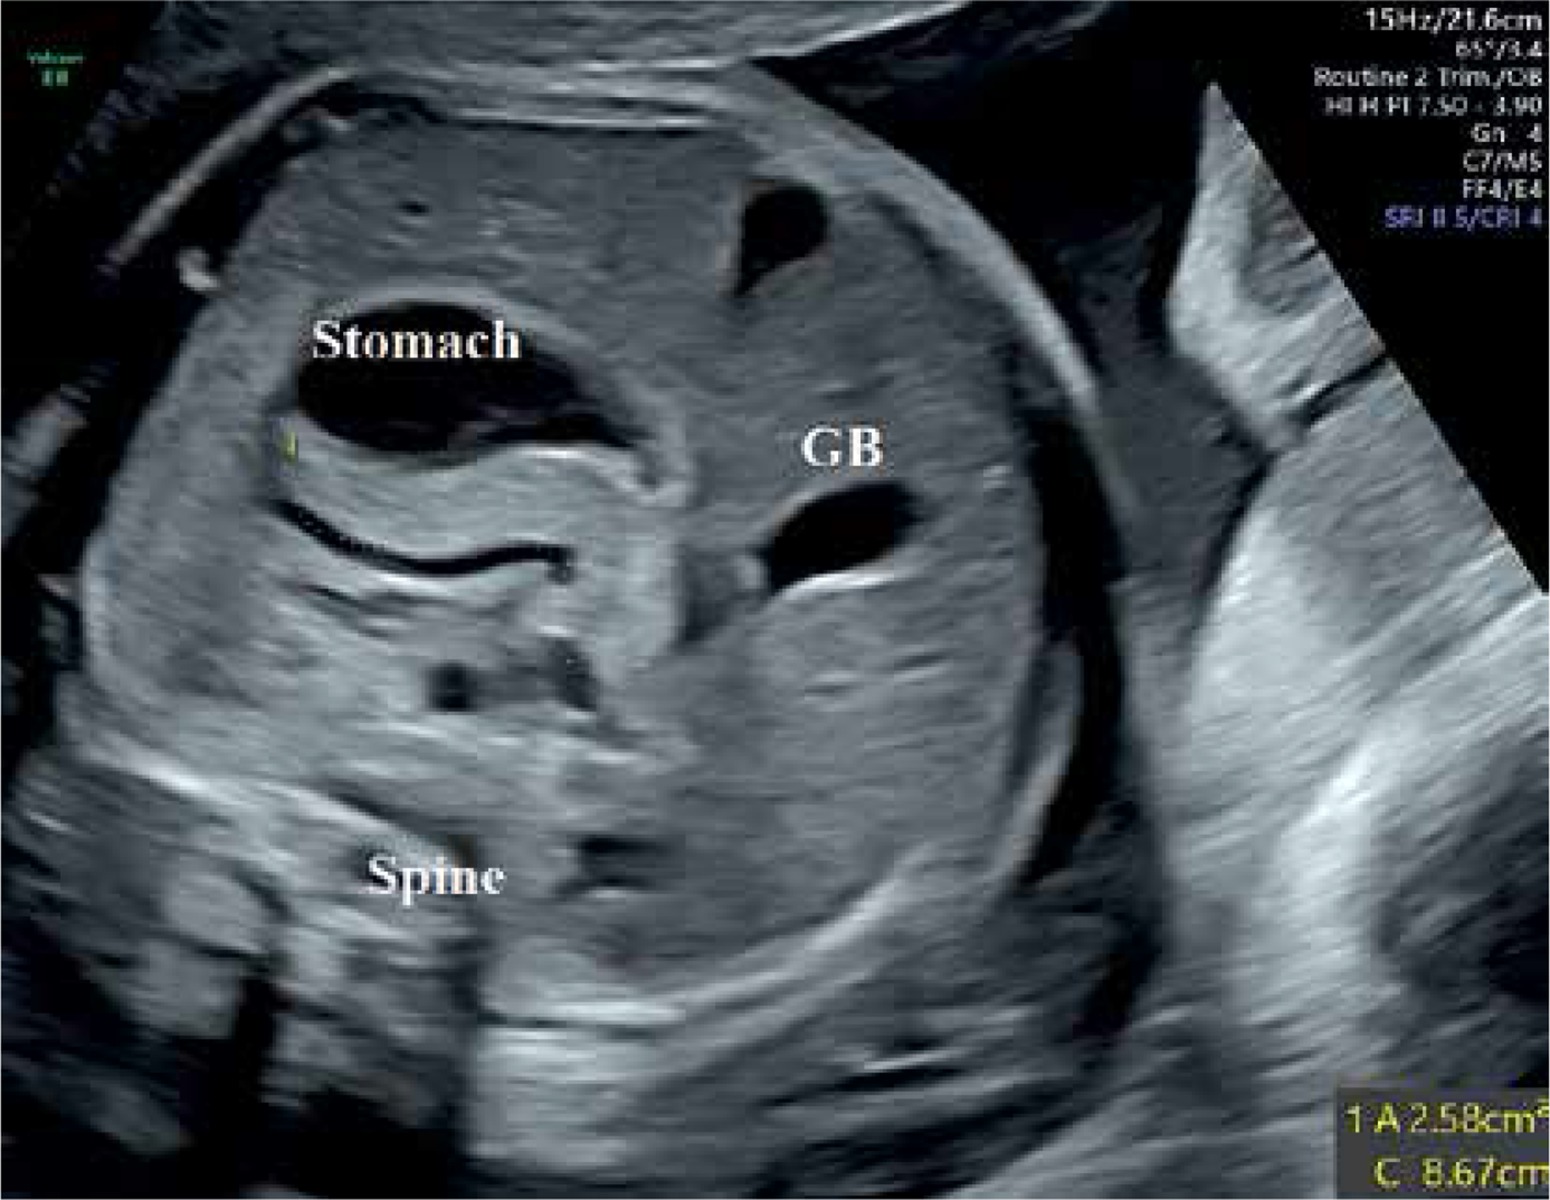
Technical details regarding the imaging of the fetal pancreas circumference (PC) were described by us elsewhere [8]. In brief, the best reproducible abdominal plane is the backdown transverse plane at the stomach and liver level. The pancreas is identified as an elongated, echogenic structure, lying between the stomach above and the aorta and vertebral spine medially and below. After freezing the image, the circumference is measured from the left caudal edge (tail) to the right ventral edge (head) using the free-hand trace function. The pancreas is mildly hyperechoic in comparison to the fetal liver (Figure 1).
Figure 1
Fetal pancreas imaging: The best angle of imaging of the fetal pancreas is rather narrow. It consists of a transverse, antero-posterior abdominal section, at the level between the stomach and the spine-aorta-IVC complex
The mean of two measurements served for calculation and analysis.
Each patient was examined once during the study period. All measurements were obtained by two experienced examiners (Y.G and K.Z). Examinations were performed using a commercially available, Voluson 730 Expert, E8 or E10 expert machine (GE Medical Systems, Kretz Ultrasound, Zipf, Austria), equipped with an abdominal 4–8 MHz curvilinear transducer.
Statistical analysis
Statistical analyses were performed using SPSS statistical package version 20 for Windows (IBM SPSS, New York, NY) and Microsoft Excel 2016 software (Microsoft Corp, Richmond, CA). All tests were two-tailed, and a p-value of < 0.05 was considered statistically significant.
For statistical purposes, the study group was sub-divided for GDM PGDM mothers.
The modeled mean and standard deviation (SD) of the fetal pancreas circumference were calculated per week of gestational age (GA), according to the method published by Altman and Chitty [10] and Royston et al. [11]. Using the regression model as functions of gestational age of the raw data (y = a + b × GA + b1 × GA2 + b2 × GA3). The r 2 statistic was also studied to assess the best quality of fit. The modeled mean diabetic PC was plotted over the normal pancreas reference range.
For each week of gestation, the Z score was calculated to quantify the difference (in SD) between the mean predicted PC of fetuses of mothers with and those without DM.
The estimated fetal weight centiles (EFWC) were calculated according to the Israeli birthweight nomograms [12]. The relationship between EFWC and PC was examined, analyzing the correlation between them and the regression along with pregnancy.
Results
Ninety-one GDM and thirty-four PGDM mothers were included in the study. Within the GDM group, glycemic control was achieved following lifestyle modifications in 14 (15.4%) women and the remaining patients by either insulin or oral hypoglycemic agents. Insulin treatment was provided to all of the patients in the PGDM group, 28 of them (82.3%) by an insulin pump.
Mothers with gestational diabetes
Fetal PC raw data demonstrated a significant positive correlation with AC, EFW and GA (Pearson correlation coefficient = 0.802, 0.762, 0.764, p < 0.001). Regression analysis revealed a significant r 2, although lower than the respective cubic polynomial curve in the non-diabetic mothers’ fetuses as was found in our previous study [7] (Table I). A trend of decreased regression slop was demonstrated with in this group during the third trimester (Figure 2).
Table I
Pancreas circumference of diabetic mothers: correlation and regression analysis with abdominal circumference (AC) and estimated fetal weight (EFW) and gestational age (GA)
Figure 2
Fetal pancreas circumference of gestational diabetic mothers (92 cases): raw data are plotted on the normal predicted 5th–50th–95th centiles reference range throughout pregnancy. Polynomial cubic regression r2 = 0.682, p < 0.001
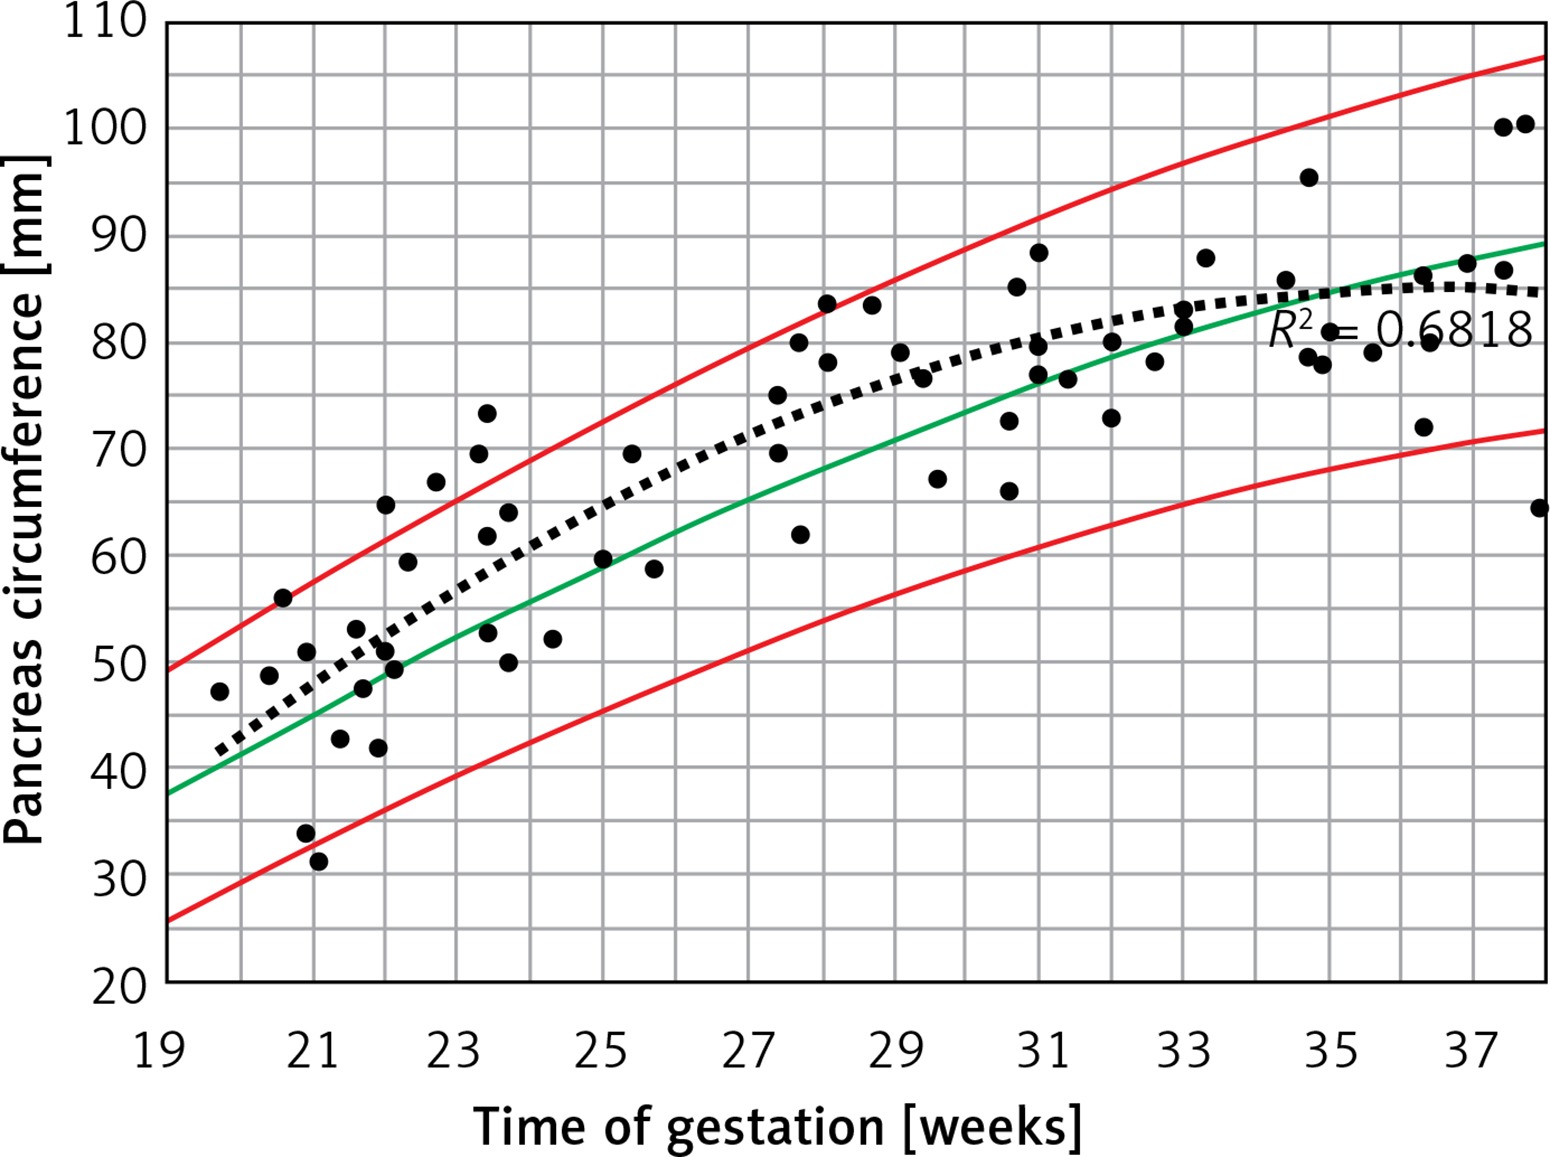
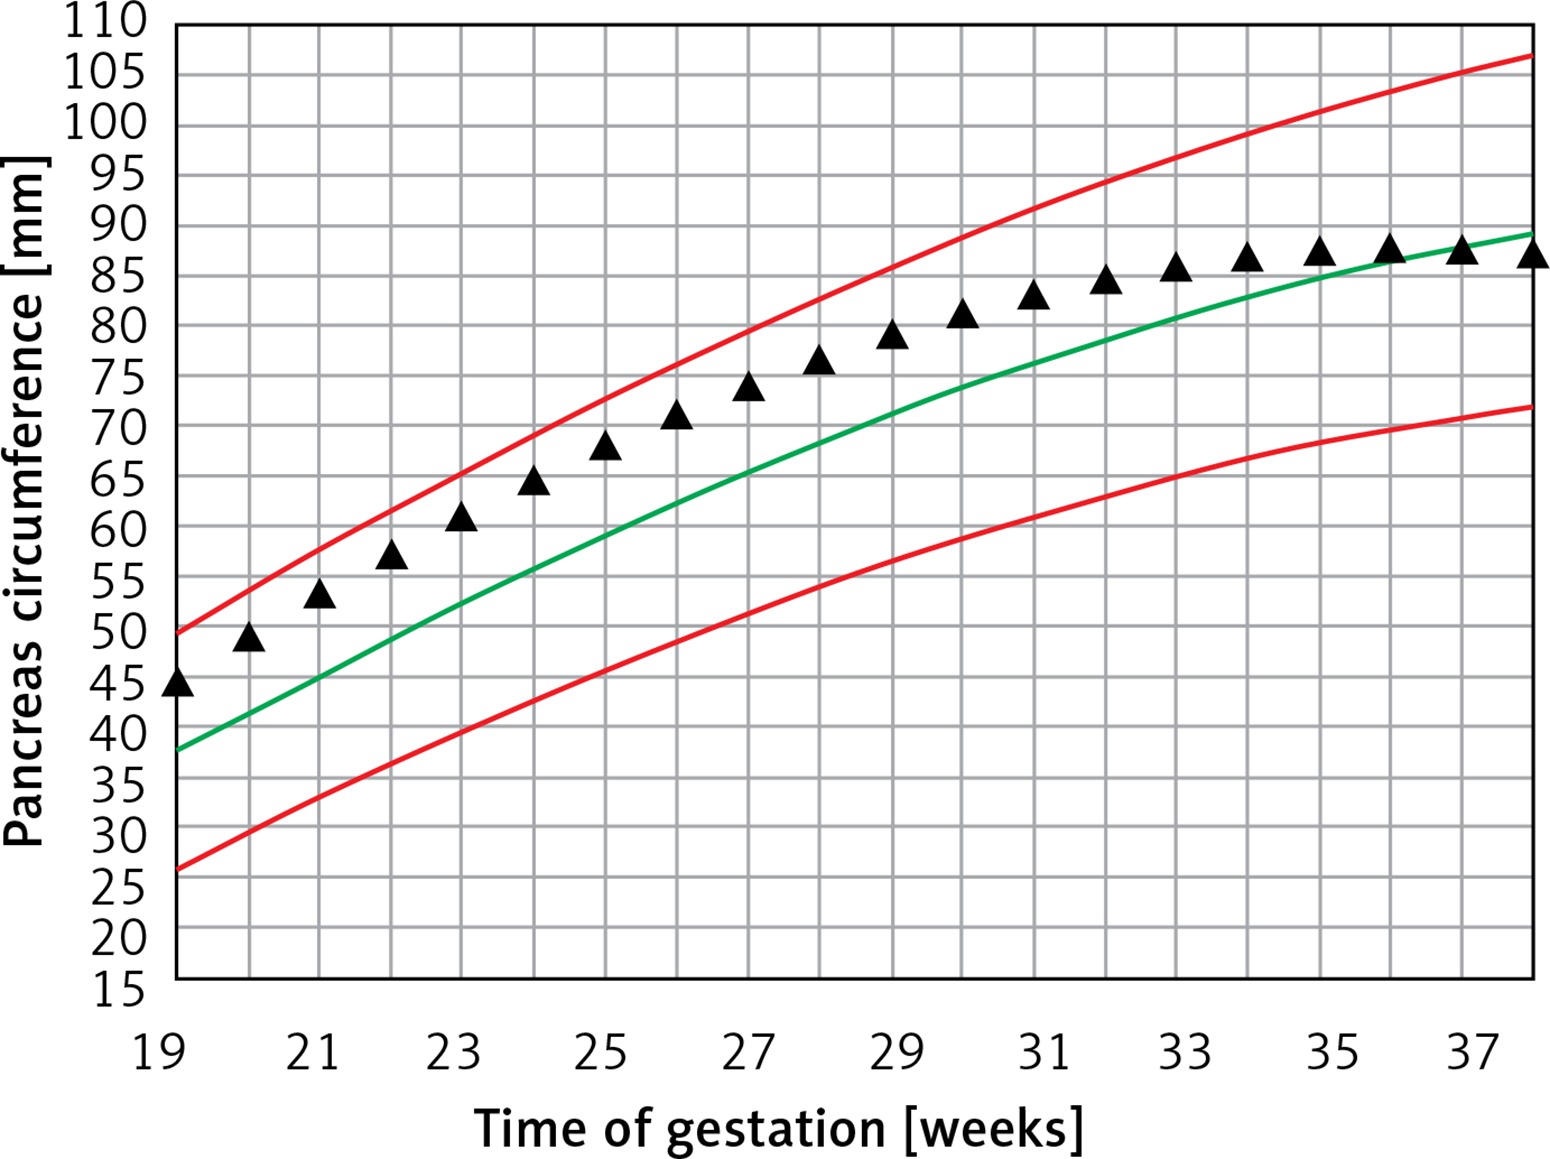
Figure 3 demonstrates the mean predicted PC for a given week of gestation plotted on the normal reference range. The GDM PC is in the upper centile range until approximately 30 weeks of gestation and then declines towards the mean at 35 weeks of gestation.
Figure 3
Fetal pancreas circumference of mothers with gestational diabetes: mean predicted values (black triangles), for a given week of gestation, plotted on the normal predicted PC 5th–50th–95th centiles
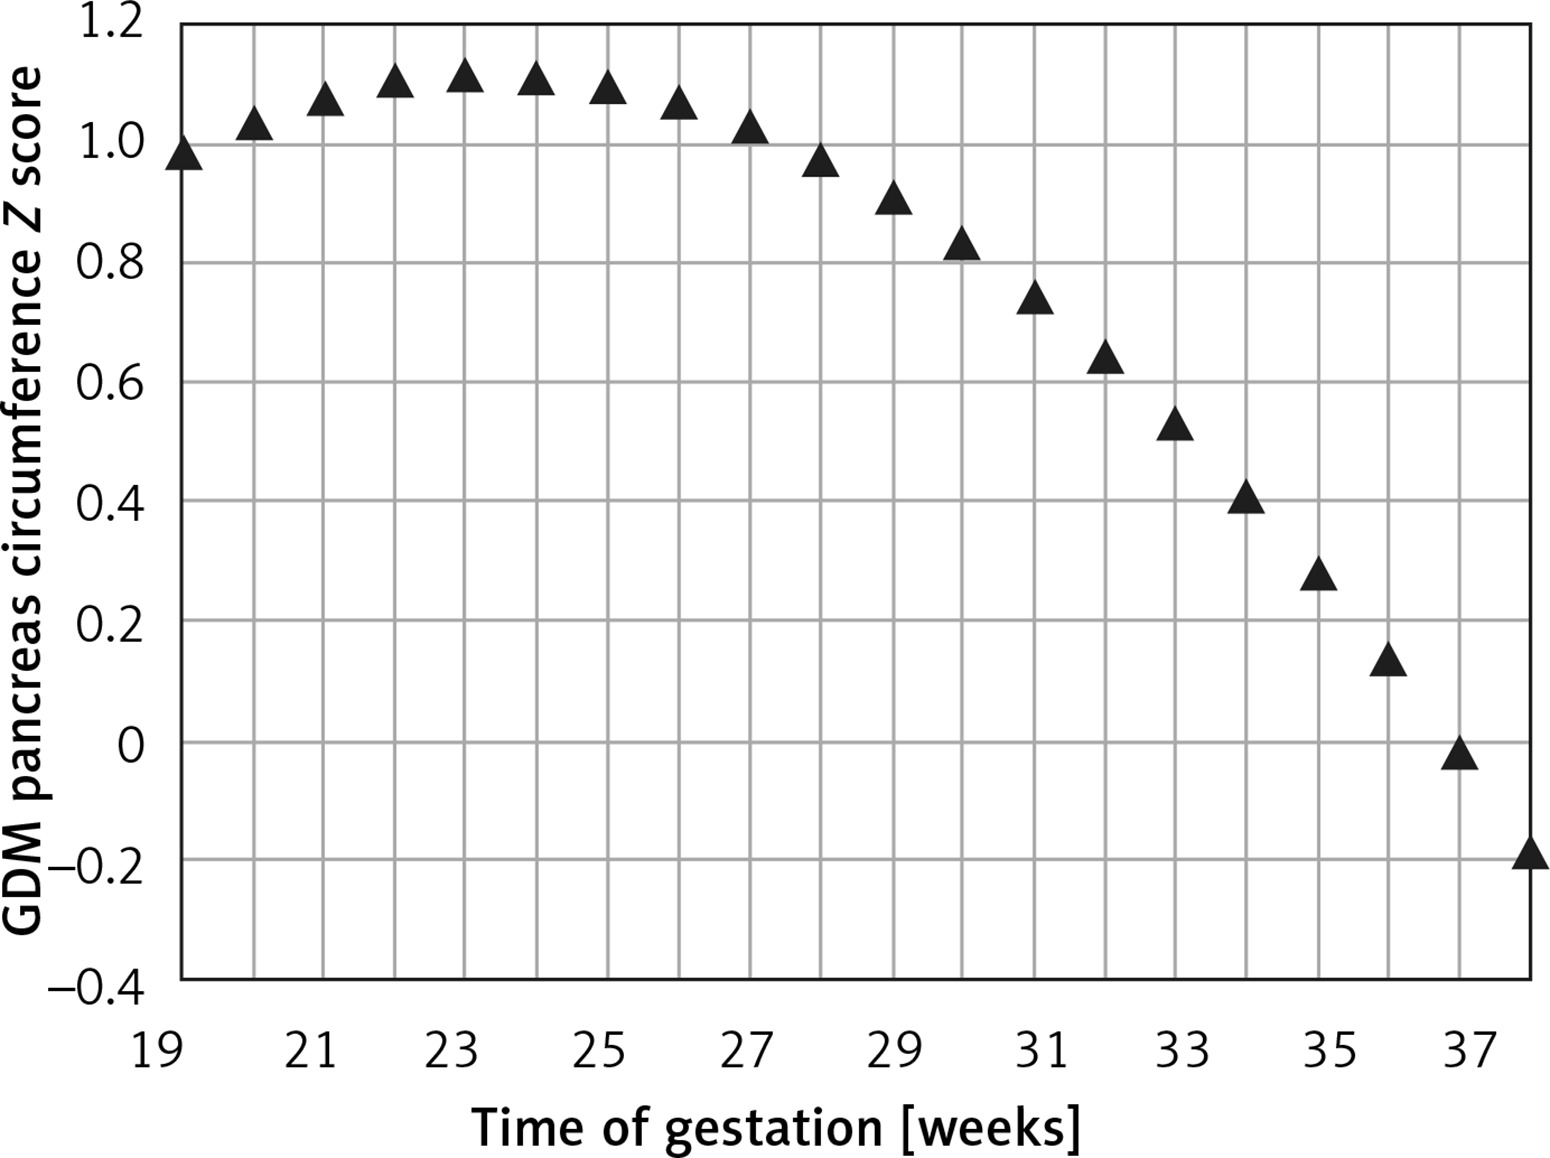
The mean Z score between the predicted GDM and the normal predicted PC for each week of gestation (PCGDM-PCN/PCN SD) was 0.74 ±0.41. It peaks at around 24 weeks of gestation (1.1) and decreases gradually afterward (2.1436 – 0.2792 × GA – 0.006 × GA2) until a value of 0 at 37 weeks (Figure 4).
Figure 4
Fetal pancreas circumference of gestational diabetic mothers: the Z score difference between the predicted mean fetal pancreas circumference (PC), for a given week of gestation, and the respective predicted values in non-diabetic mothers, throughout pregnancy
The PC correlated positively and significantly with EFWC (Pearson correlation coefficient 0.277, p = 0.018); regression analysis revealed a non-significant increase (cubic r2 = 0.078, p = 0.219).
Mothers with pre-gestational diabetes
Fetal PC raw data significantly correlated with AC, EFW, and GA (Pearson correlation coefficient = 0.817, 0.681, and 0.710 respectively; p < 0.001). Cubic regression analysis revealed a significant r2 for the above-mentioned biometric parameters, but they were lower for EFW and GA than the GDM group (Table I).
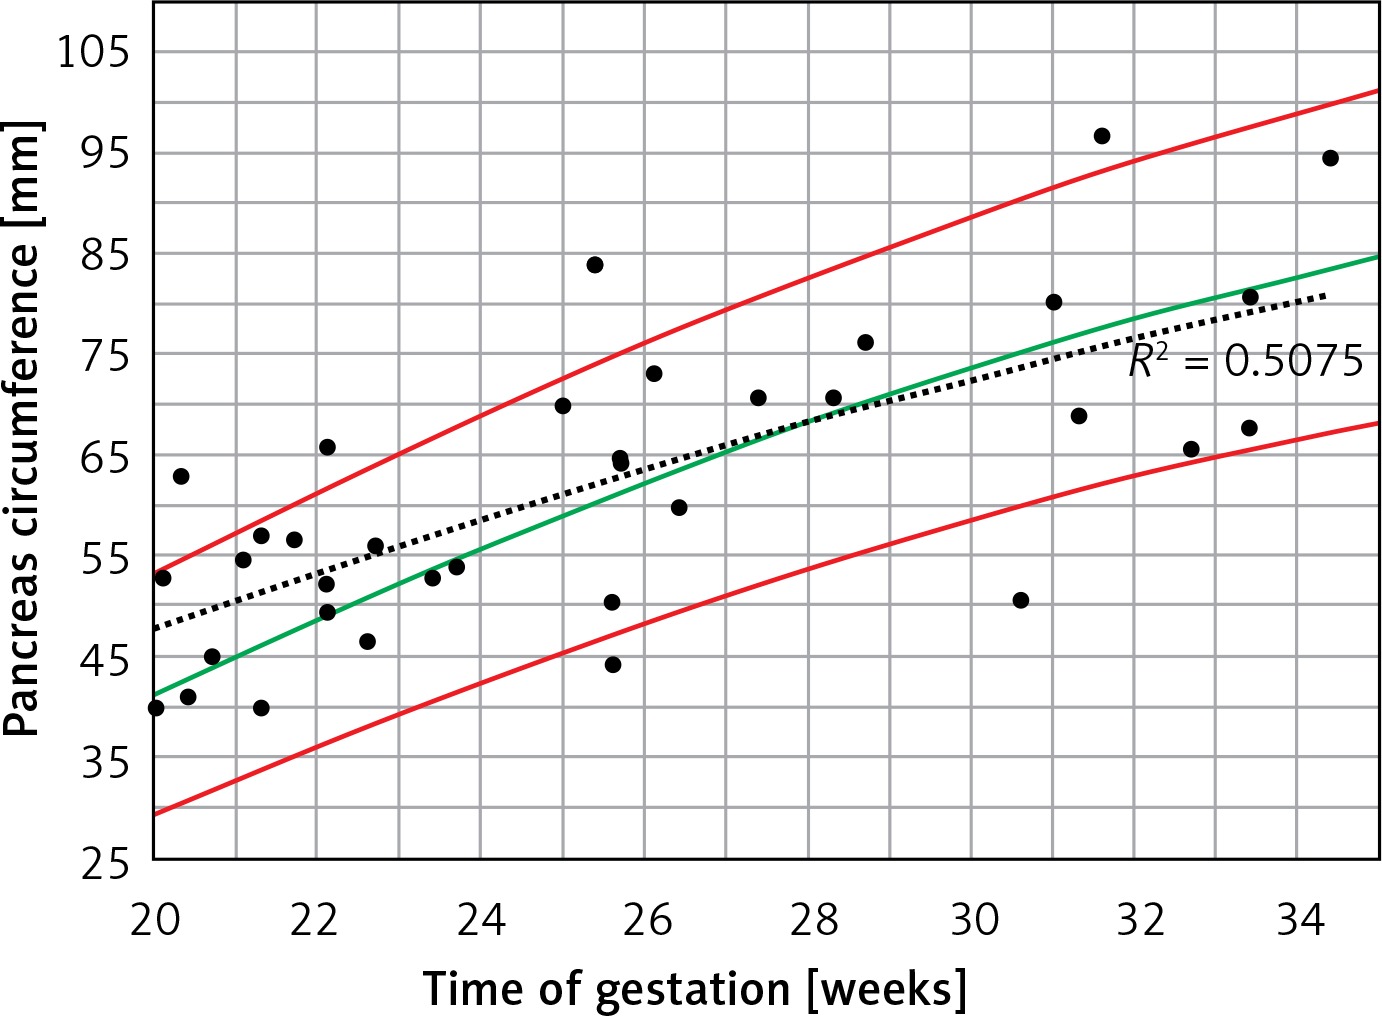
When the raw PC data of PGDM mothers were plotted on the normal 5th–95th centiles predicted reference range (Figure 5), a curve similar to the normal 50th centile with a wide dispersion on both sides was demonstrated (r2 = 0.508, p < 0.001).
Figure 5
Fetal pancreas circumference of pre-gestational diabetic mothers (35 cases): raw data plotted on the normal predicted 5th–50th–95th centiles reference range throughout pregnancy. Polynomial regression r2 = 0.508, p < 0.001
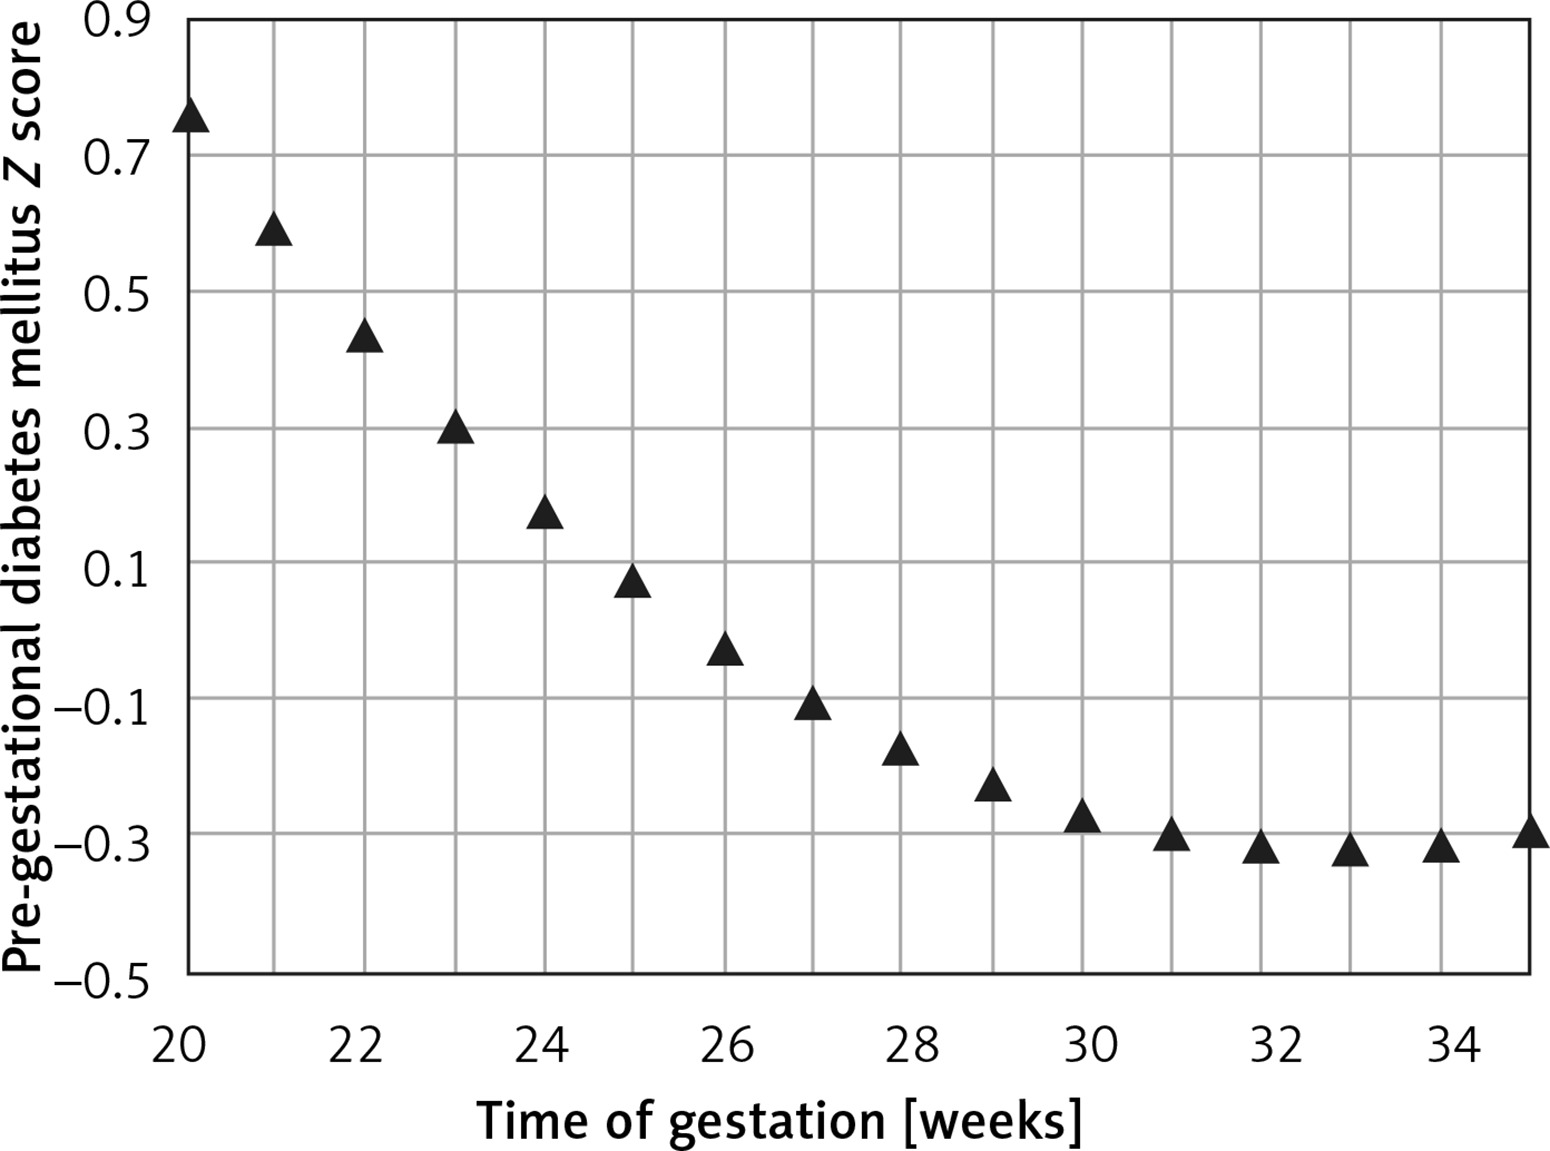
The mean predicted PC for a given week of gestation (Figure 6) demonstrated a regression trend regarding the normal reference range. The mean Z score per week of gestation constantly decreased with the progression of pregnancy. It was positive until around the 25th week of gestation and then presented negative values towards term (Figure 7).
Figure 6
Fetal pancreas circumference of pre-gestational diabetic mothers: mean predicted values (black triangles), for a given week of gestation, plotted on the normal predicted 5th–50th–95th centiles
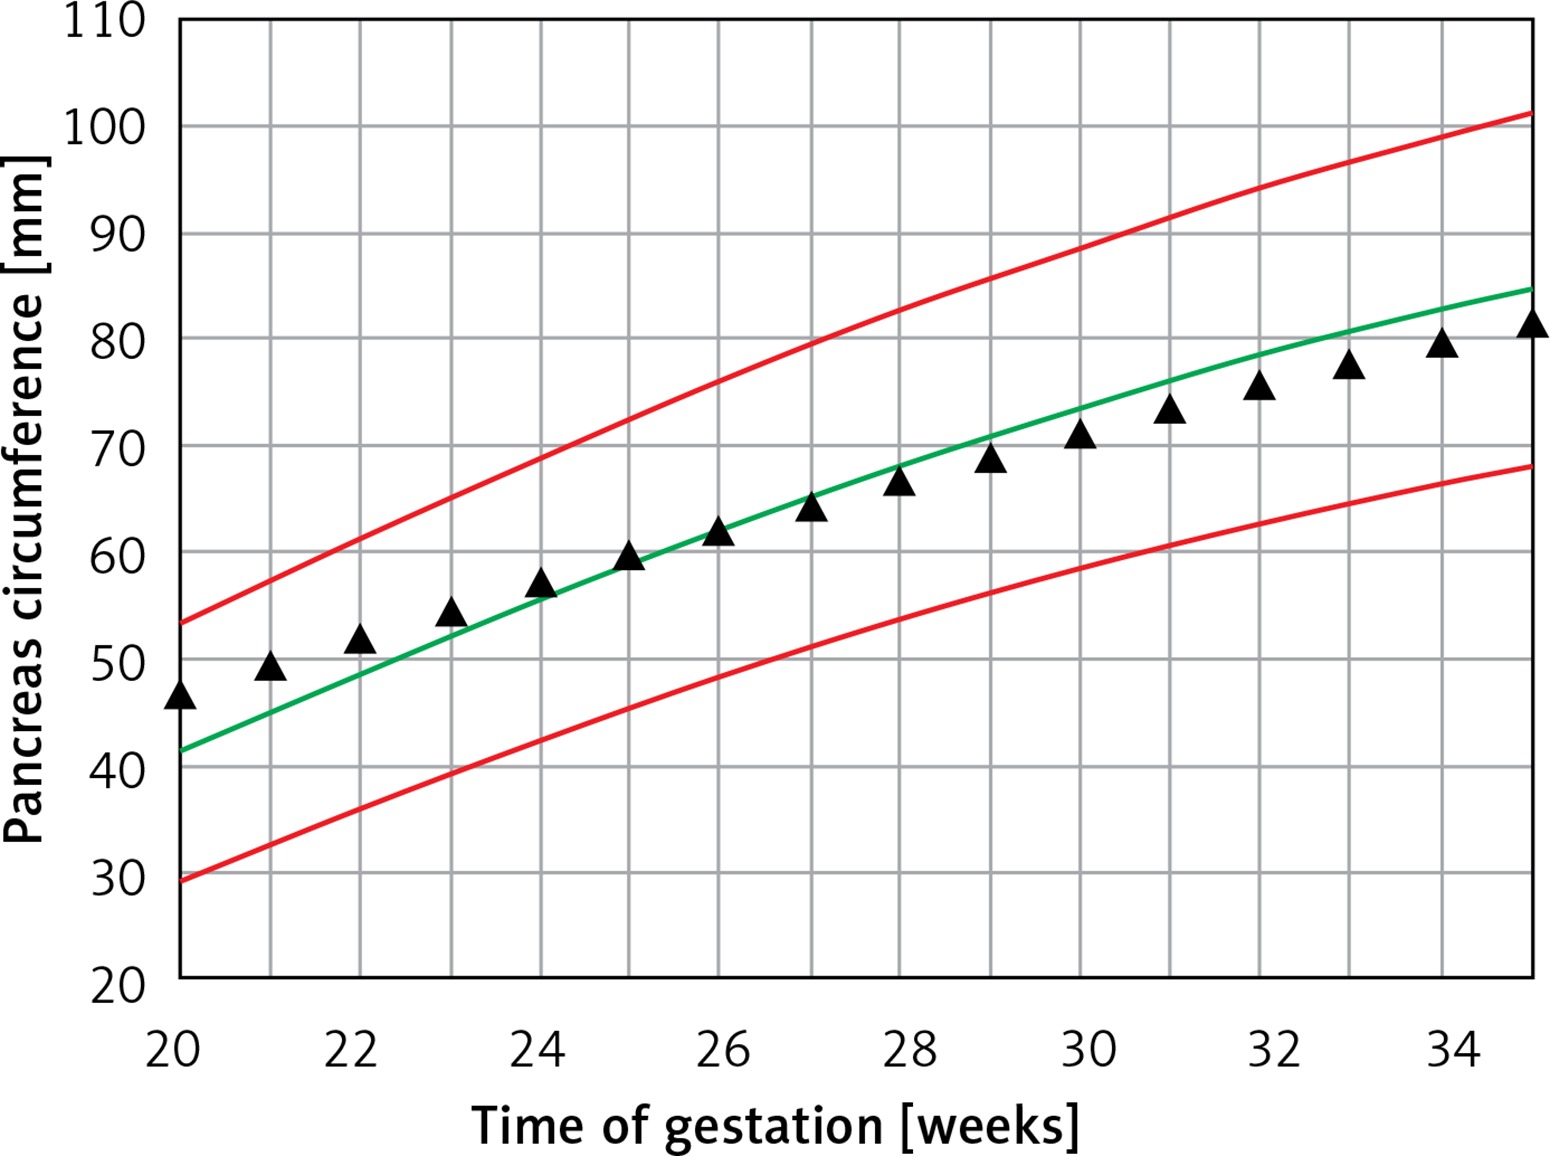
Figure 7
Fetal pancreas circumference of pre-gestational diabetic mothers: the Z score difference between the predicted mean fetal pancreas circumference (PC), for a given week of gestation, and the respective predicted values in non-diabetic mothers, during pregnancy
The PC did not correlate significantly with EFWC (Pearson correlation coefficient 0.156, p = 0.446). Regression analysis revealed a non-significant increase (cubic r2 = 0.026, p = 0.741).
Discussion
In this study we detected a correlation between glycemic control treatment, pancreas size, and gestational age. This correlation supports Pedersen’s hypothesis and may serve as an indirect method for assessing the effect of maternal hyperglycemia on the glucose-insulin environment within the fetal compartment. This relation is also concordant with previous animal studies demonstrating an increased pancreatic size in a mild hyperglycemic fetal environment [5].
In the PGDM group, the fetal pancreas size did not differ compared to non-diabetic women, and the EFWC demonstrated a non-significant increase to around the 50th centile. These findings might be related to optimal pre-conceptional glycemic control by an insulin pump.
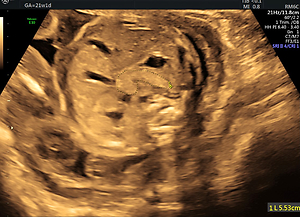
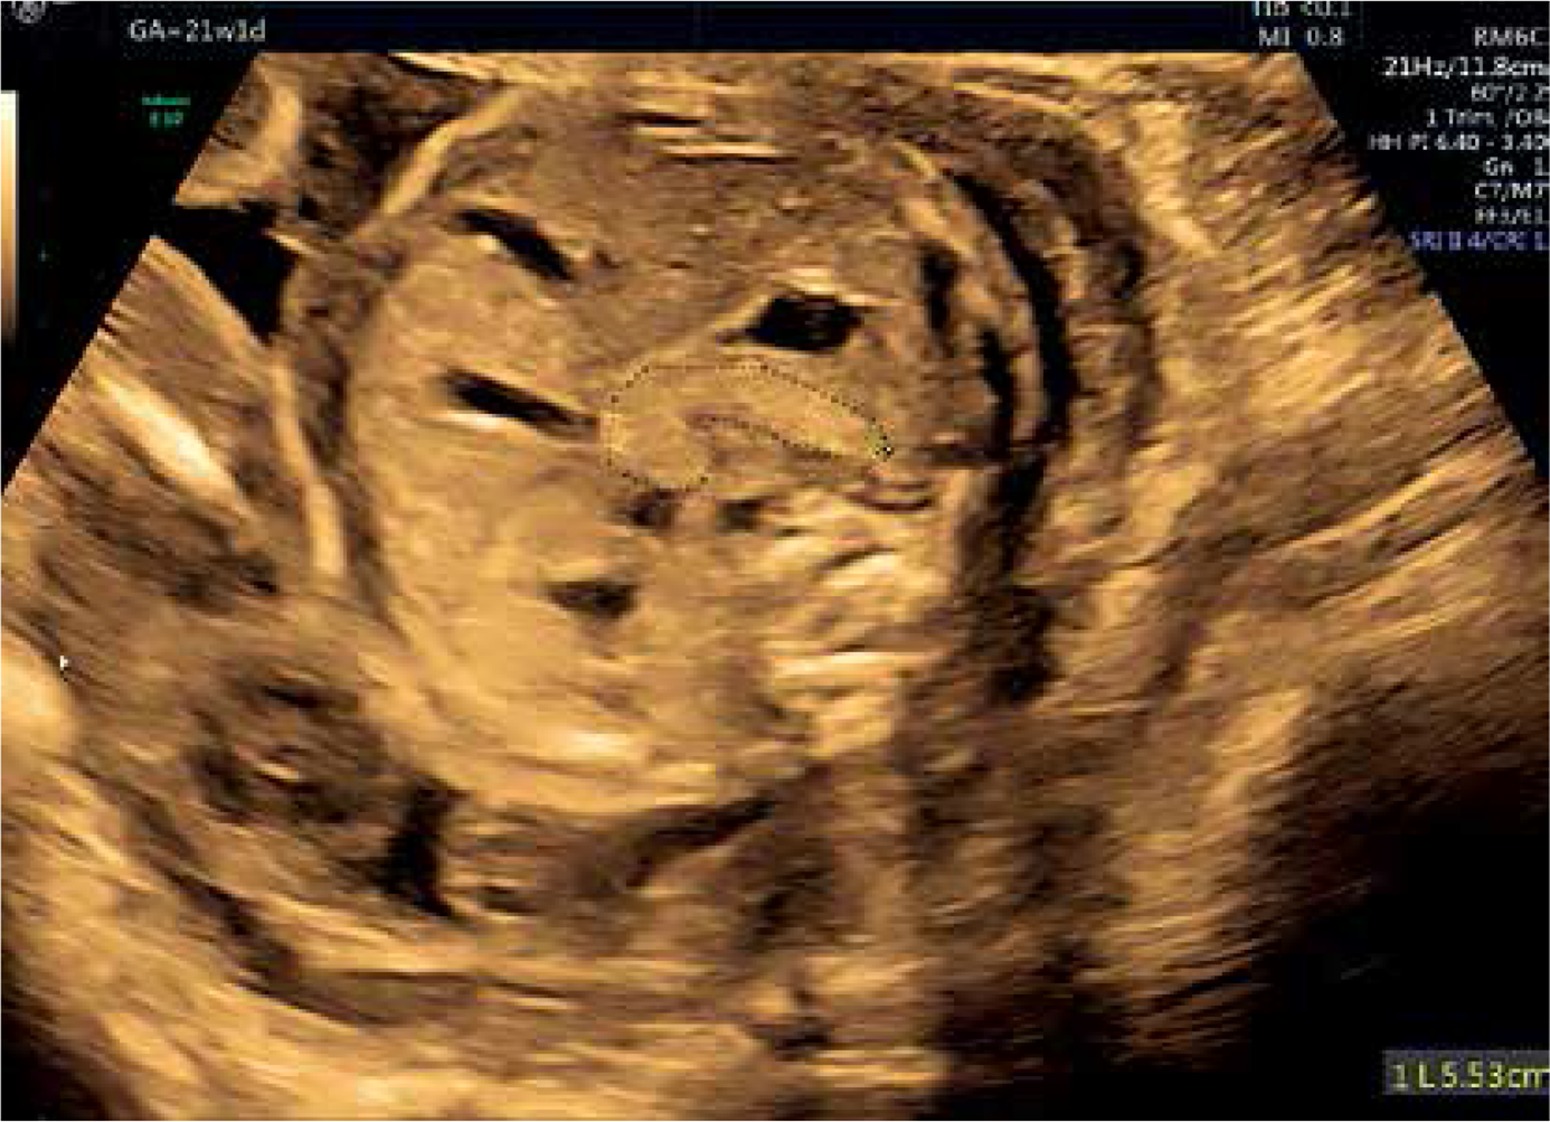
In both the PGDM and GDM mothers, the mean EFWC was below the 90th centile for gestational age. Strict blood glucose control could link this observation, as all patients were followed at the endocrinology/maternal-fetal-medicine clinic by a multidisciplinary team, thereby avoiding fetal hyperglycemia, pancreatic and fetal overgrowth. In both groups, the Z score of PC decreased with duration of pregnancy, presumably as the consequence of the treatment and good glycemic control. As opposed to PGDM, GDM patients are usually diagnosed following glucose screening tests performed during the late second trimester. Therefore, the fetus is exposed to higher glucose levels over a longer time, leading to increased pancreatic size. This observation was demonstrated in routine second-trimester ultrasound of a pancreas measured above the 95th percentile for gestational age in whom diabetes was later confirmed (Figure 8).
Figure 8
Image of the mildly hyperechogenic pancreas measured above 95th percentile for gestational age at 21 weeks in a patient diagnosed 4 weeks later with GDM
Visualization of the fetal pancreas with ultrasound is best achieved towards the end of the second trimester [9]. Hatice et al. observed that not only the shape but also the hyperechogenicity of the pancreas was significantly and positively associated with GDM risk. Hyperechogenic pancreas was significantly and positively associated with an increased GDM risk by 29.8 times compared to the grade 1 isoechogenic group [13].
Maternal diabetes during pregnancy is the common path of two mechanisms: 1) insufficient pre-gestational maternal insulin production and 2) gestational diabetes due to insufficient insulin production in response to the diabetogenic hormones, especially human placental lactogen, leading to glucose intolerance and hyperglycemia. As a consequence of maternal hyperglycemia a higher quantity of glucose is transferred to the fetus, resulting in fetal pancreas β-cell hypertrophy leading to elevated insulin production, glucose utilization and fetal adiposity. Severe neonatal morbidity such as fetal shoulder dystocia, fractures, nerve palsy and even death were reported to be closely related to fetal weight [14].
Two randomized control trial [6, 15] and a Cochrane systemic review [16] concluded that treatment during pregnancy, either by dietary modifications or by insulin or oral hypoglycemic agents, is associated with reduced fetal growth as expressed by fetal weight, large for gestational age (greater than the 90th percentile for gestational age) or macrosomia (greater than 4 kg), and a consequent decreased incidence of serious perinatal complications in comparison to the untreated group.
Gestational diabetes is one of the most common metabolic complications in pregnancy and, therefore, negatively impacts the structure and maturation of cells, tissues, and organs in the fetus and later in the newborn.
The relationship between maternal glycemic state and fetal pancreas growth during pregnancy has not been reported thus far. Thus this preliminary observation regarding fetal pancreas size in diabetic mothers may be a pioneering study for larger prospective studies in the field of gestation diabetes and fetal pancreas response to glycemic control.
Our study has some limitations: 1) Measurement of the fetal pancreas is highly dependent on fetal position and maternal habitus. The sub-group of morbidly obese diabetic women might be underrepresented in our study as visualization might be challenging in these patients. 2) There was no longitudinal follow-up or subgroup analysis based on the type of diabetes and the type of antidiabetic drugs, which is the challenge for further investigations.