Introduction
The tumor microenvironment (TME) has been widely implicated in tumorigenesis. It harbors many components that interact with tumor cells through the circulatory and lymphatic systems to influence the development and progression of cancer [1]. The immune cells are important constituents of the tumor stroma and critically take part in carcinogenesis in elimination, equilibrium and escape of cancer immunoediting processes [2]. Growing evidence suggests that the cross-talk between cancer cells and immune cells ultimately results in an environment that fosters or inhabits tumor growth and metastasis [3]. Therefore, the examination of the immune components of TME is essential for evaluations of cancer prognosis and treatment response.
Tertiary lymphoid structures (TLSs) are ectopically aggregated nascent lymphoid structures within tissues in non-lymphoid organs and characterized by high endothelial venules (HEVs) [4]. The structure and function of the TLSs are highly similar to those of secondary lymphoid organs (SLOs) such as segregated T and B cell zones, presence of follicular dendritic cell networks, HEVs, and specialized lymphoid fibroblasts and have mechanisms to support local adaptive immune responses toward locally expressed antigens [5]. Recently, the presence of TLSs has been identified in many solid organ tumors, and it was reported to be closely related to the long-term survival of cancer patients [6, 7]. Current studies indicated that TLSs can improve the immunotherapy effect for cancer patients [8, 9]. A successful anti-tumor immune response is always controlled by a complex series of interactions between tumor cells and immune cells [10, 11]. The TLSs in the TME are composed of a T cell-rich zone with mature dendritic cells (DCs) juxtaposing a B cell follicle with germinal center characteristics [12]. Therefore, the TLSs are involved in the presentation of neighboring tumor antigens to T cells by DCs and activation, proliferation and differentiation of T and B cells within the TME [13–15], which greatly affect tumor development and progression [16].
Tumor-infiltrating lymphocytes (TILs) are the major effectors encountering malignancy in the frontier of the TME [17, 18]. It is clear that the TILs are closely involved in the formation of the local immune microenvironment, anti-tumor immune response, and immunotherapy [19, 20]. However, TILs not only participated in the direct killing effect on tumors but also regulated the anti-tumor immune response and even impaired the anti-tumor response [21, 22]. Functional phenotypes of lymphocytes profoundly facilitate the exploration of TIL subsets in situ. Various combinations of TIL subpopulation detection panels have been reported. A study confirmed the densities of CD3+ T cells and cytotoxic CD8+ T cells in the tumor and the invasive margin with a clear evaluation value for immunotherapy and prognosis for patients with colon cancer [23]. FOXP3+ regulatory cells (Tregs), playing a critical role in immune tolerance and deficiency of anti-tumor immunity, were often used as a negative anti-tumor parameter [24]. In this study, we therefore mainly explored the TLSs’ relation with cytotoxic CD8+ T cell and FOXP3+Treg supplemented with activated CTLs (GrB+ T cell) and primed CD4+ T cells (OX40+ T cells, inducing cytokine production and maintaining the activity of T helper cells).
Preclinical and clinical data support the role of TLSs and TILs in modulating the anti-tumor immune function of the host active immune system [8, 21]. Structurally, TLSs are involved in the organization of immune cells in the TME and play a similar function to lymphoid organs by recruiting naive T and B cells to the tumor site through the related chemokines and cytokines, and exert their corresponding immune function [25]. The TILs are often exposed in the TME to interact directly with tumor cells. However, less attention has been paid to the relationship between the two important immune components: TLSs and TILs. Moreover, the localization and relationship between TILs and TLSs in gastric cancer (GC) have never been elucidated. Understanding the location, prognostic value of TLSs and TILs, and their relationship is of great practical significance to mobilize a variety of immune functions in the body and promote the synergistic anti-tumor effect of immune cells. Thus, we performed a comprehensive histological analysis of TLSs and TILs in the surgically resected GC tissue from a cohort of 147 GC patients, which is of great importance to provide new concepts and therapeutic directions for clinical immunotherapy of GC.
Material and methods
Patients and tissue specimens
Patients who were diagnosed with gastric adenocarcinoma and underwent GC resection surgery between January 2001 and December 2003 in the First Affiliated Hospital of XI’an Jiaotong University were included in this study. It was approved by the Medical Ethics Committee of the First Affiliated Hospital of Xi’an Jiaotong University.
Biopsy samples were collected from 180 patients with gastric adenocarcinoma who underwent subtotal or total gastrectomy with local lymphadenectomy at the Department of Pathology. All specimens were formalin-fixed, embedded in paraffin, cut into 4-µm-thick tissue sections, and stored at –80οC until use. Patients were incorporated according to the following criteria: 1. Pathological diagnosis was primary gastric adenocarcinoma; 2. Without preoperative chemotherapy or radiotherapy; 3. Retained paraffin-fixed tissue was sufficient, and the structure was clear; 4. Cases had complete medical records and follow-up information. Patients were followed up for 10 years; the survival time is from the date of surgery to the end of follow-up. A total of 147 cases were included in this study. The detailed information is described in Table I of our previous study (Supplementary Table SI) [26]. The survival time of patients was between 1 and 123 months, and the median survival time was 50.6 months.
Table I
Correlation analysis between TLSs and TILs
Immunohistochemical staining for displaying TLSs and TILs
The tissue samples were fixed in formalin and embedded in paraffin, and the paraffin blocks were sliced into 4 µm sections to conduct immunohistochemical (IHC) staining. Six serial sections of each paraffin-embedded tumor block were cut, one for H&E staining and five for IHC staining. The primary antibodies for TIL subsets were mouse monoclonal anti-human CD8 (DakoCytomation, Glostrup, Denmark; 1 : 100 dilution), granzyme B (Novocastra, Newcastle, UK; 1 : 100), OX40 (Novocastra; 1 : 30), FOXP3 (Abcam, Cambridge, UK; 1 : 50). The identification for the TLSs was the primary antibody to MECA-79 (1 : 300 dilution, Santa Cruz, California, USA), which recognizes sulfate-dependent carbohydrate epitopes of peripheral node addressin (PNAd) expressed in endothelial cells of HEVs. The IHC was performed as recommended by the manufacturer. The antigen retrieval was done by heat-induced epitope retrieval methods for 1 min and 30 s in citric buffer (pH 6.0). The detailed steps were the same as in our previous study [26]. Dako EnVision (DakoCytomation, Denmark) was used as the secondary antibody. Negative controls were done by omitting the primary antibodies. The tonsil tissue was used as positive controls.
Histological and immunohistochemical evaluation
The H&E-stained slides were reviewed by two pathologists (YLW and GJZ) to reconfirm the accuracy of the pathological data.
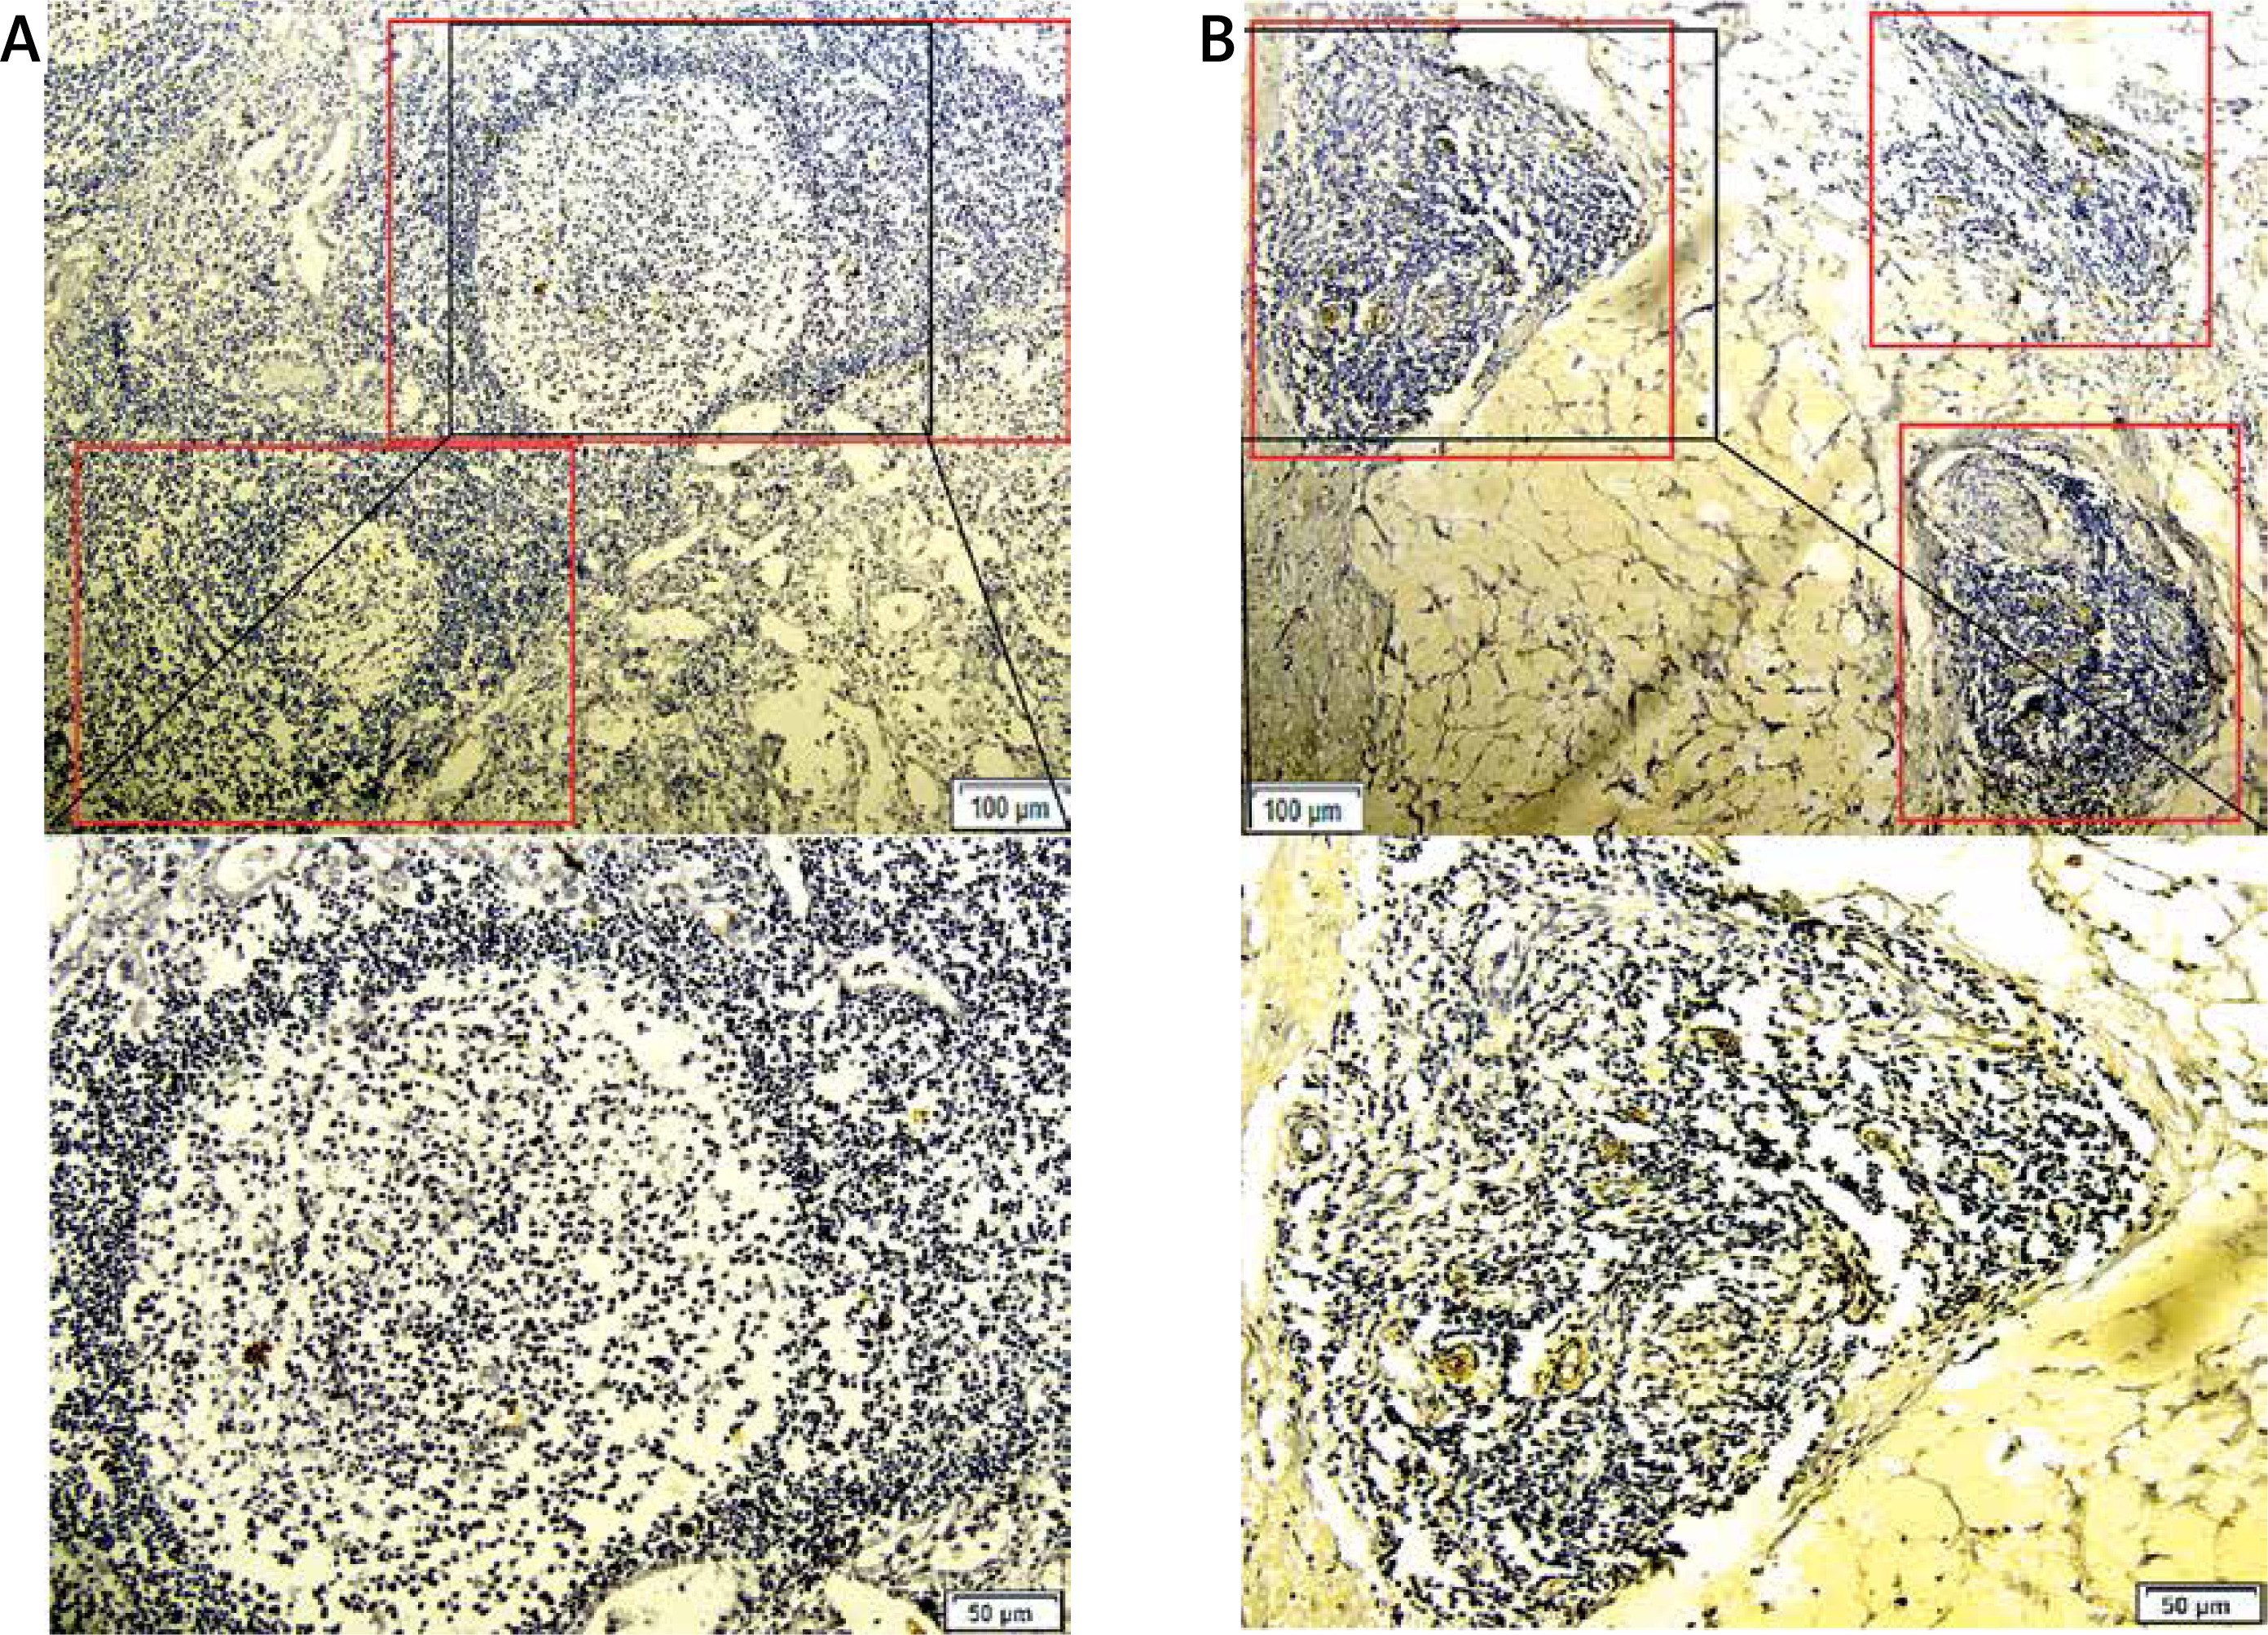
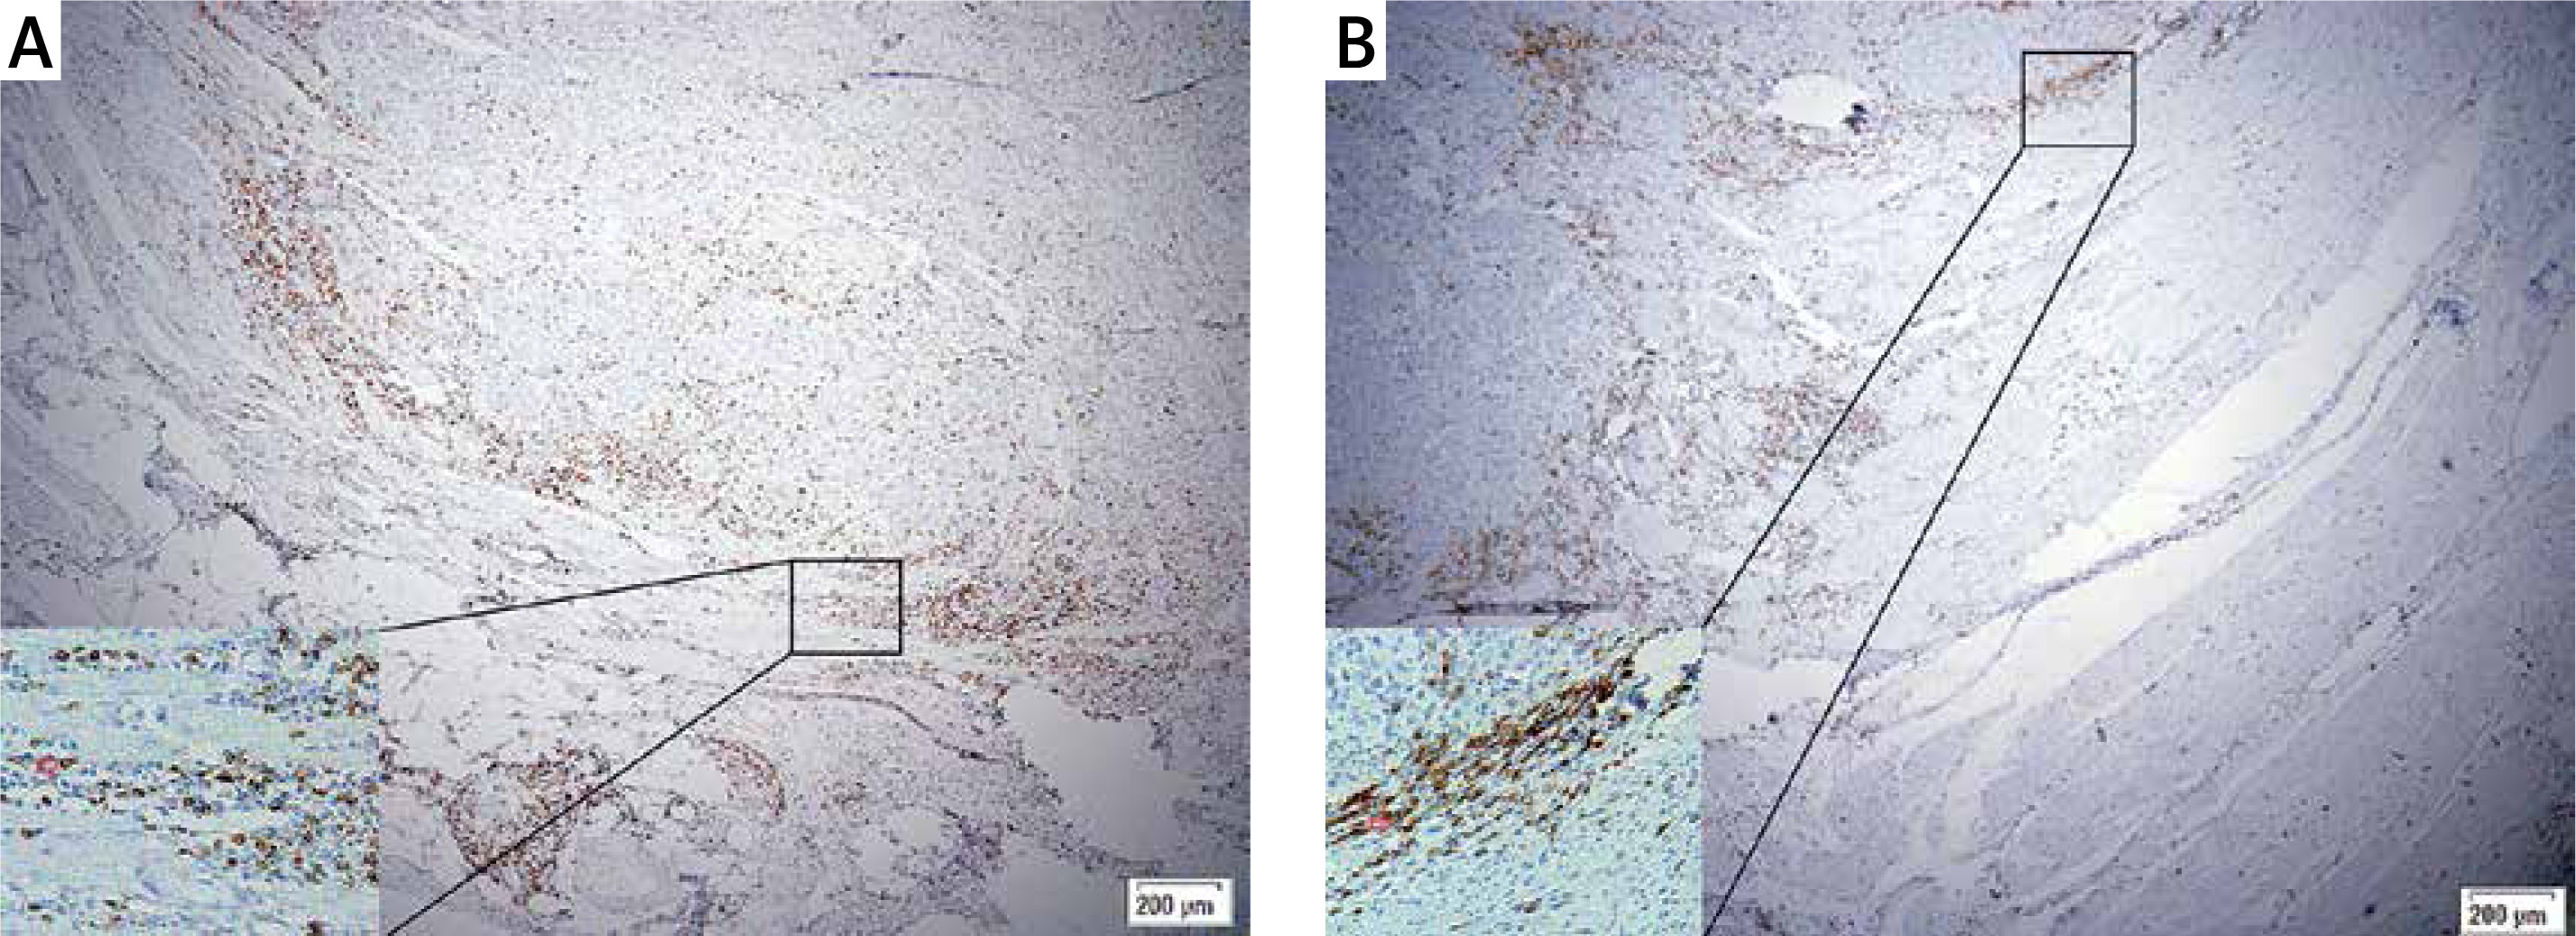
Evaluation of TLSs and TLSs classification. TLSs are characterized by B-cell follicles, T-cell zones, and specialized vessels known as HEVs. Referring to previous studies [27], the presence of MECA-79 positive HEVs identified among the ectopic lymphocyte aggregation area is defined as valid TLSs. Reference methods for the evaluation of spatial distributions of TLSs were based on a similar report on breast cancer [28]. We defined tumor-associated TLSs as either intratumoral TLSs (intra-TLSs) located within the tumor center, which is the interior of the solid tumor and enclosed by the tumor tissue in the invasive margin including the tumor parenchyma and stroma, or peritumoral TLSs (peri-TLSs) adjacent to the invasive margin of the GC tissue (Figure 1). The total number of TLSs is the sum of intra-TLSs and peri-TLSs. After the TLSs in the whole slides were counted, the cases were divided into TLSs-high and TLSs-low groups according to the median for further analysis.
Figure 1
Intratumoral-TLSs (intra-TLSs) (A) and peritumoral-TLSs (peri-TLSs) (B) in the GC tissue, respectively. A complete TLSs structure was rolled up by a red rectangle. The picture below which it corresponds, is a local amplification of the structure of TLSs
Evaluation of TILs and TILs classification. The distribution of TILs was approached in the tumor center, invasive edge, and within the TLSs, respectively. The numbers of labeled TILs were counted in 5 fields of the most positive cells by the classical counting method with the light microscope using an ocular grid at ×400 magnification [29]. Then the mean value for each vision of each case was calculated to represent the TIL density for this case of this region. Counting was performed twice for each slide by two viewers (NNZ and DPW). The mean value of TILs was taken for further analysis, and the cases were divided into TILs-high and TILs-low groups according to the median for further analysis. The TILs in the two regions were also named intra-TILs and peri-TILs, respectively, and the TILs in the TLSs were termed TLSs-TILs.
Statistical analysis
The SPSS software 13.0 (Chicago, IL) was used for statistical analysis. The t-test was used to analyze the discrepancy of TILs and TLSs in intratumoral and peritumoral regions. Pearson correlation analysis was used to evaluate the relation between TLSs and TILs in a different area. The LSD t-test was used to analyze the numerical superiority of the four types of TILs in TLSs and intratumoral and peritumoral regions. The survival rates were calculated by the Kaplan-Meier method, and differences were obtained by the log-rank test. Correlations between the TLSs and the TILs and other clinicopathological variables were determined by the χ2 test. Univariate and multivariate survival analyses were carried out by Cox proportional hazards models. The R programming language was adopted for the power analysis. All the analyses were 2-sided, and p < 0.05 was considered as statistically significant.
Results
Distribution of TLSs and TILs
Among the total 147 cases, 11 cases (7.48%) showed no TLSs in the intratumoral or peritumoral region, and there were 17 cases (11.56%) without peri-TLSs and 21 cases (14.29%) without intra-TLSs. The FOXP3+ and CD8+TILs were positively distributed in the intratumoral and peritumoral regions of all the cases (χ2 = 6.217, p = 0.102). Two cases in the intratumoral and 4 cases in the peritumoral region had a negative infiltration of OX40+ T cells. There were 7 cases without GrB+ T cells at the invasive margin, 5 cases without GrB+ T cells in the tumor center, and a total of 5 cases with a negative infiltration of GrB+ T cells.
The TLS distribution was significantly higher in the tumor invasive edge than the tumor center (intra-TLSs vs. peri-TLSs: 2.19 ±2.08 vs. 4.24 ±2.55, p < 0.001, power = 1.0). Similarly, the infiltrating density of CD8+ T cells and GrB+ T cells in the tumor infiltrating edge was significantly higher than in the tumor center (intra-CD8+ T vs. peri-CD8+ T: 11.40 ±6.59 vs. 13.23 ±6.07, p < 0.001, power = 1.0; intra-GrB+ T vs. peri-GrB+ T: 5.75 ±3.83 vs. 6.88 ±4.32, p = 0.018, power = 1.0; Figures 2 A, 3 A–D). The CD8+ T cells appeared to form a line of immune cell defense in the tumor-infiltrating edge (Figures 4 A, B). While the total number of TILs and the FOXP3+ T cells was statistically higher in the tumor center than the tumor-infiltrating edge (intra-TILs vs. peri-TILs: 24.73 ±10.96 vs. 21.81 ±9.53, p < 0.001, power = 1.0; intra-FOXP3+ T vs. peri-FOXP3+ T 12.88 ±6.66 vs. 9.31 ±5.89, p < 0.001, power = 1.0; Figures 2 A, 3 E, F), there was no significant difference in the distribution of OX40+ T cells in the two regions. The four types of TILs within the TLSs were obviously higher than the TILs in the intratumoral and peritumoral region (Figures 2 A, 3 G, H). Additionally, the average number of the four subsets of lymphocytes was CD8+>FOXP3+>GrB+>OX40+ T cells in descending order within the TLSs and 63.27% of cases were ranked in this order (Figure 2 B), indicating that the TLSs were enriched of the cytotoxic T lymphocytes. Moreover, TILs successively arranged in the intratumoral area were FOXP3+>CD8+>OX40+>GrB+ T cells with 60.54% of cases in this order, indicating that an immune suppressive microenvironment may exist in the tumor center. In contrast, CD8+> FOXP3+>GrB+>OX40+ T cells were in the peritumoral region with 61.22% of cases in this order, and the CD8+ T cells are far superior among the TILs in the peritumoral region and within the TLSs with statistical significance (Figure 2 B).
Figure 2
A – TLSs, the total number of TILs and the FOXP3+ T cells distributed significantly higher in the tumor center than the tumor invasive edge. While the CD8+ and GrB+ T cells in the tumor infiltrating edge were significantly higher than the tumor center. And the four type of TILs within the TLSs is obviously higher than the TILs in intratumoral and peritumoral region (n = 147). B – Number of the four subsets of lymphocyte in descending order was CD8+>FOXP3+>GrB+>OX40+ T cells within the TLSs, CD8+>FOXP3+>GrB+>OX40+ T cells in the peritumoral region, and the CD8+ T cells has a far superior among the TILs in peritumoral region and within the TLSs with statistical significance (n = 147), *p < 0.05, **p < 0.01
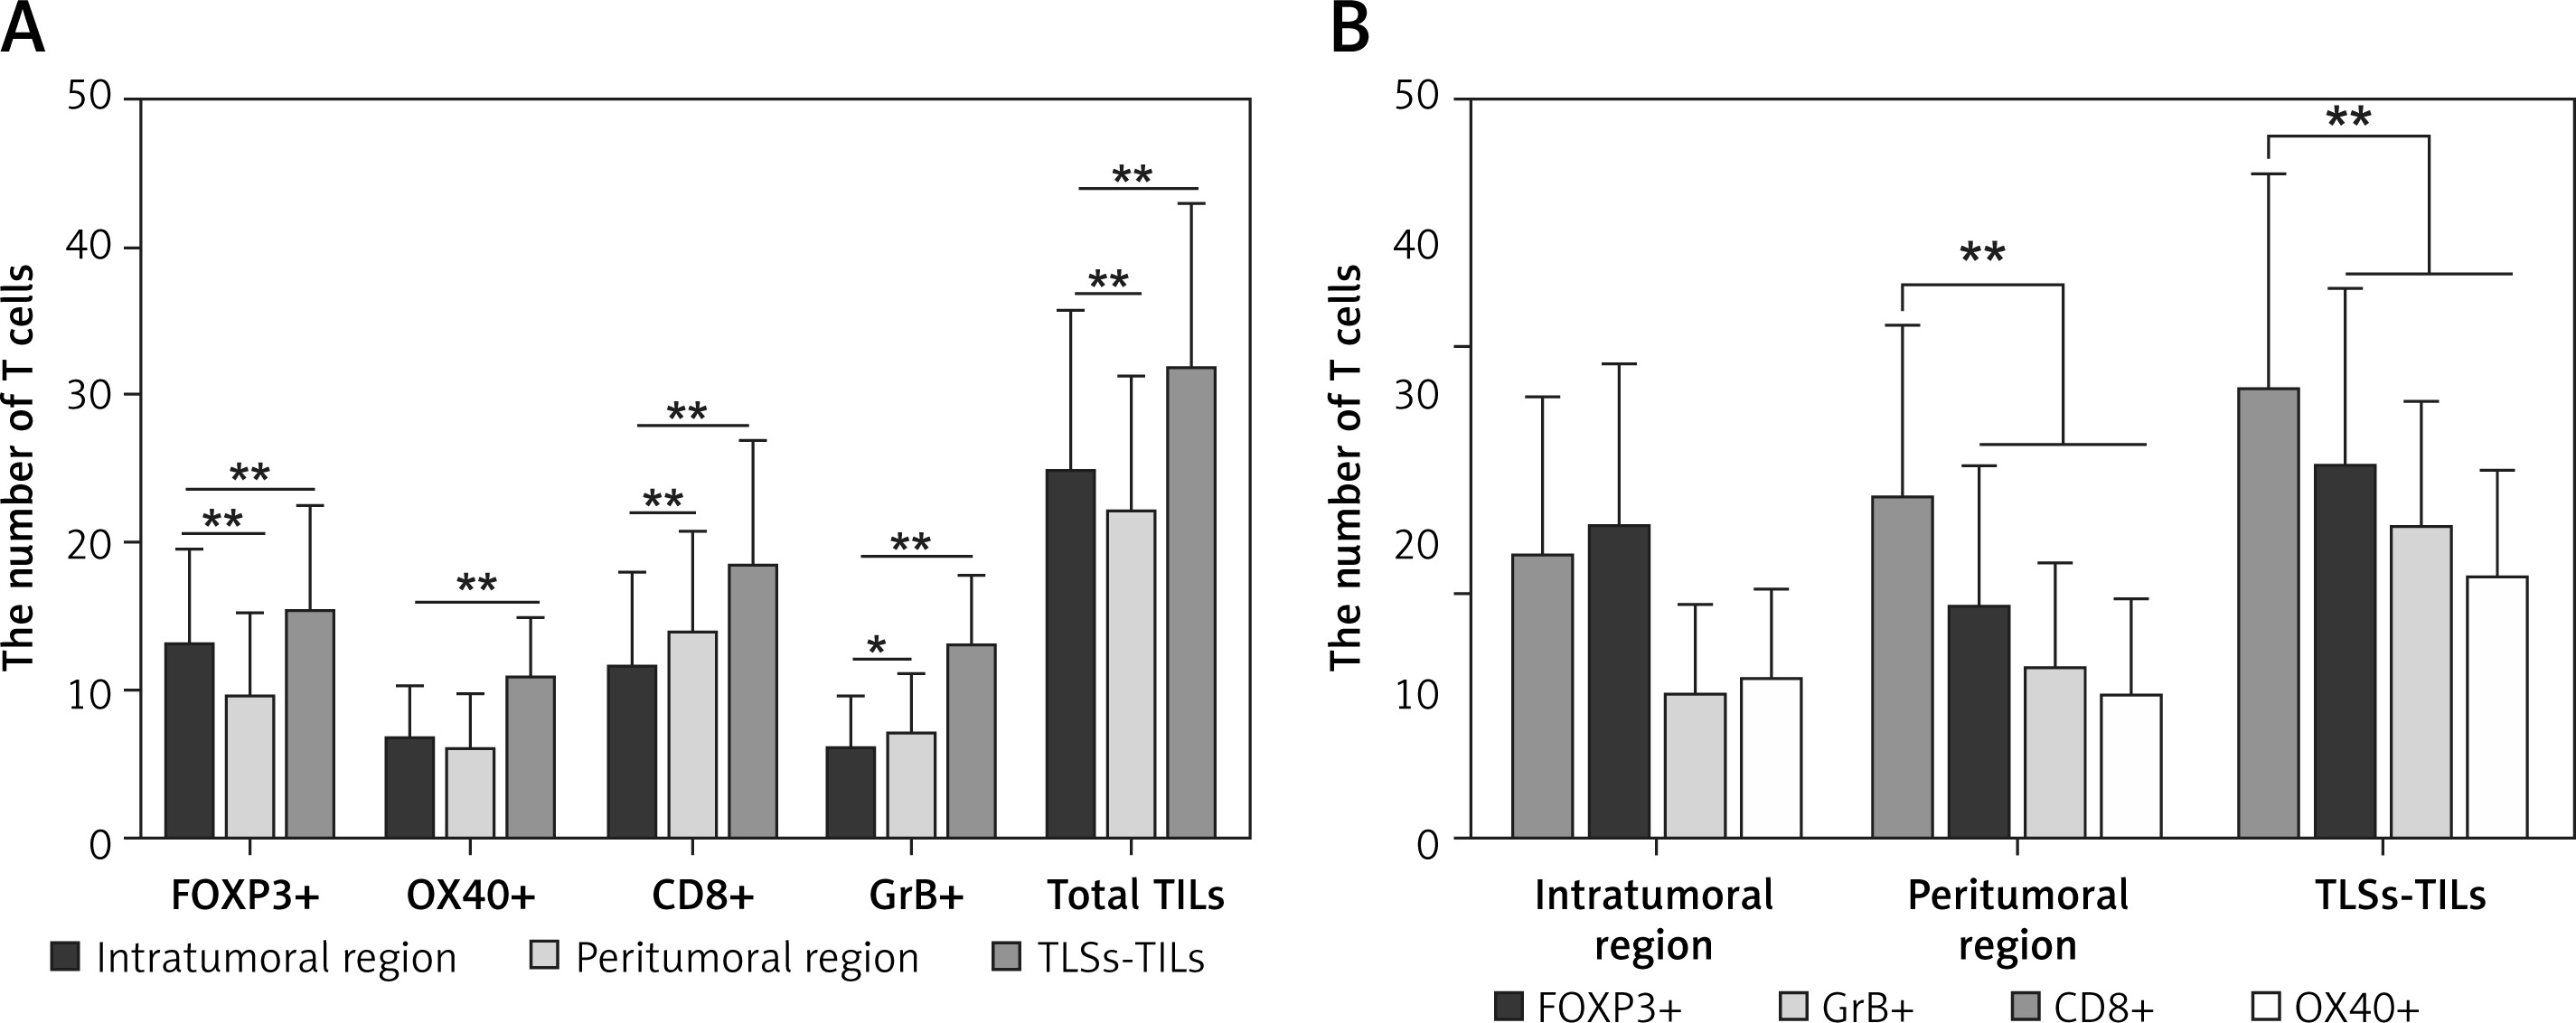
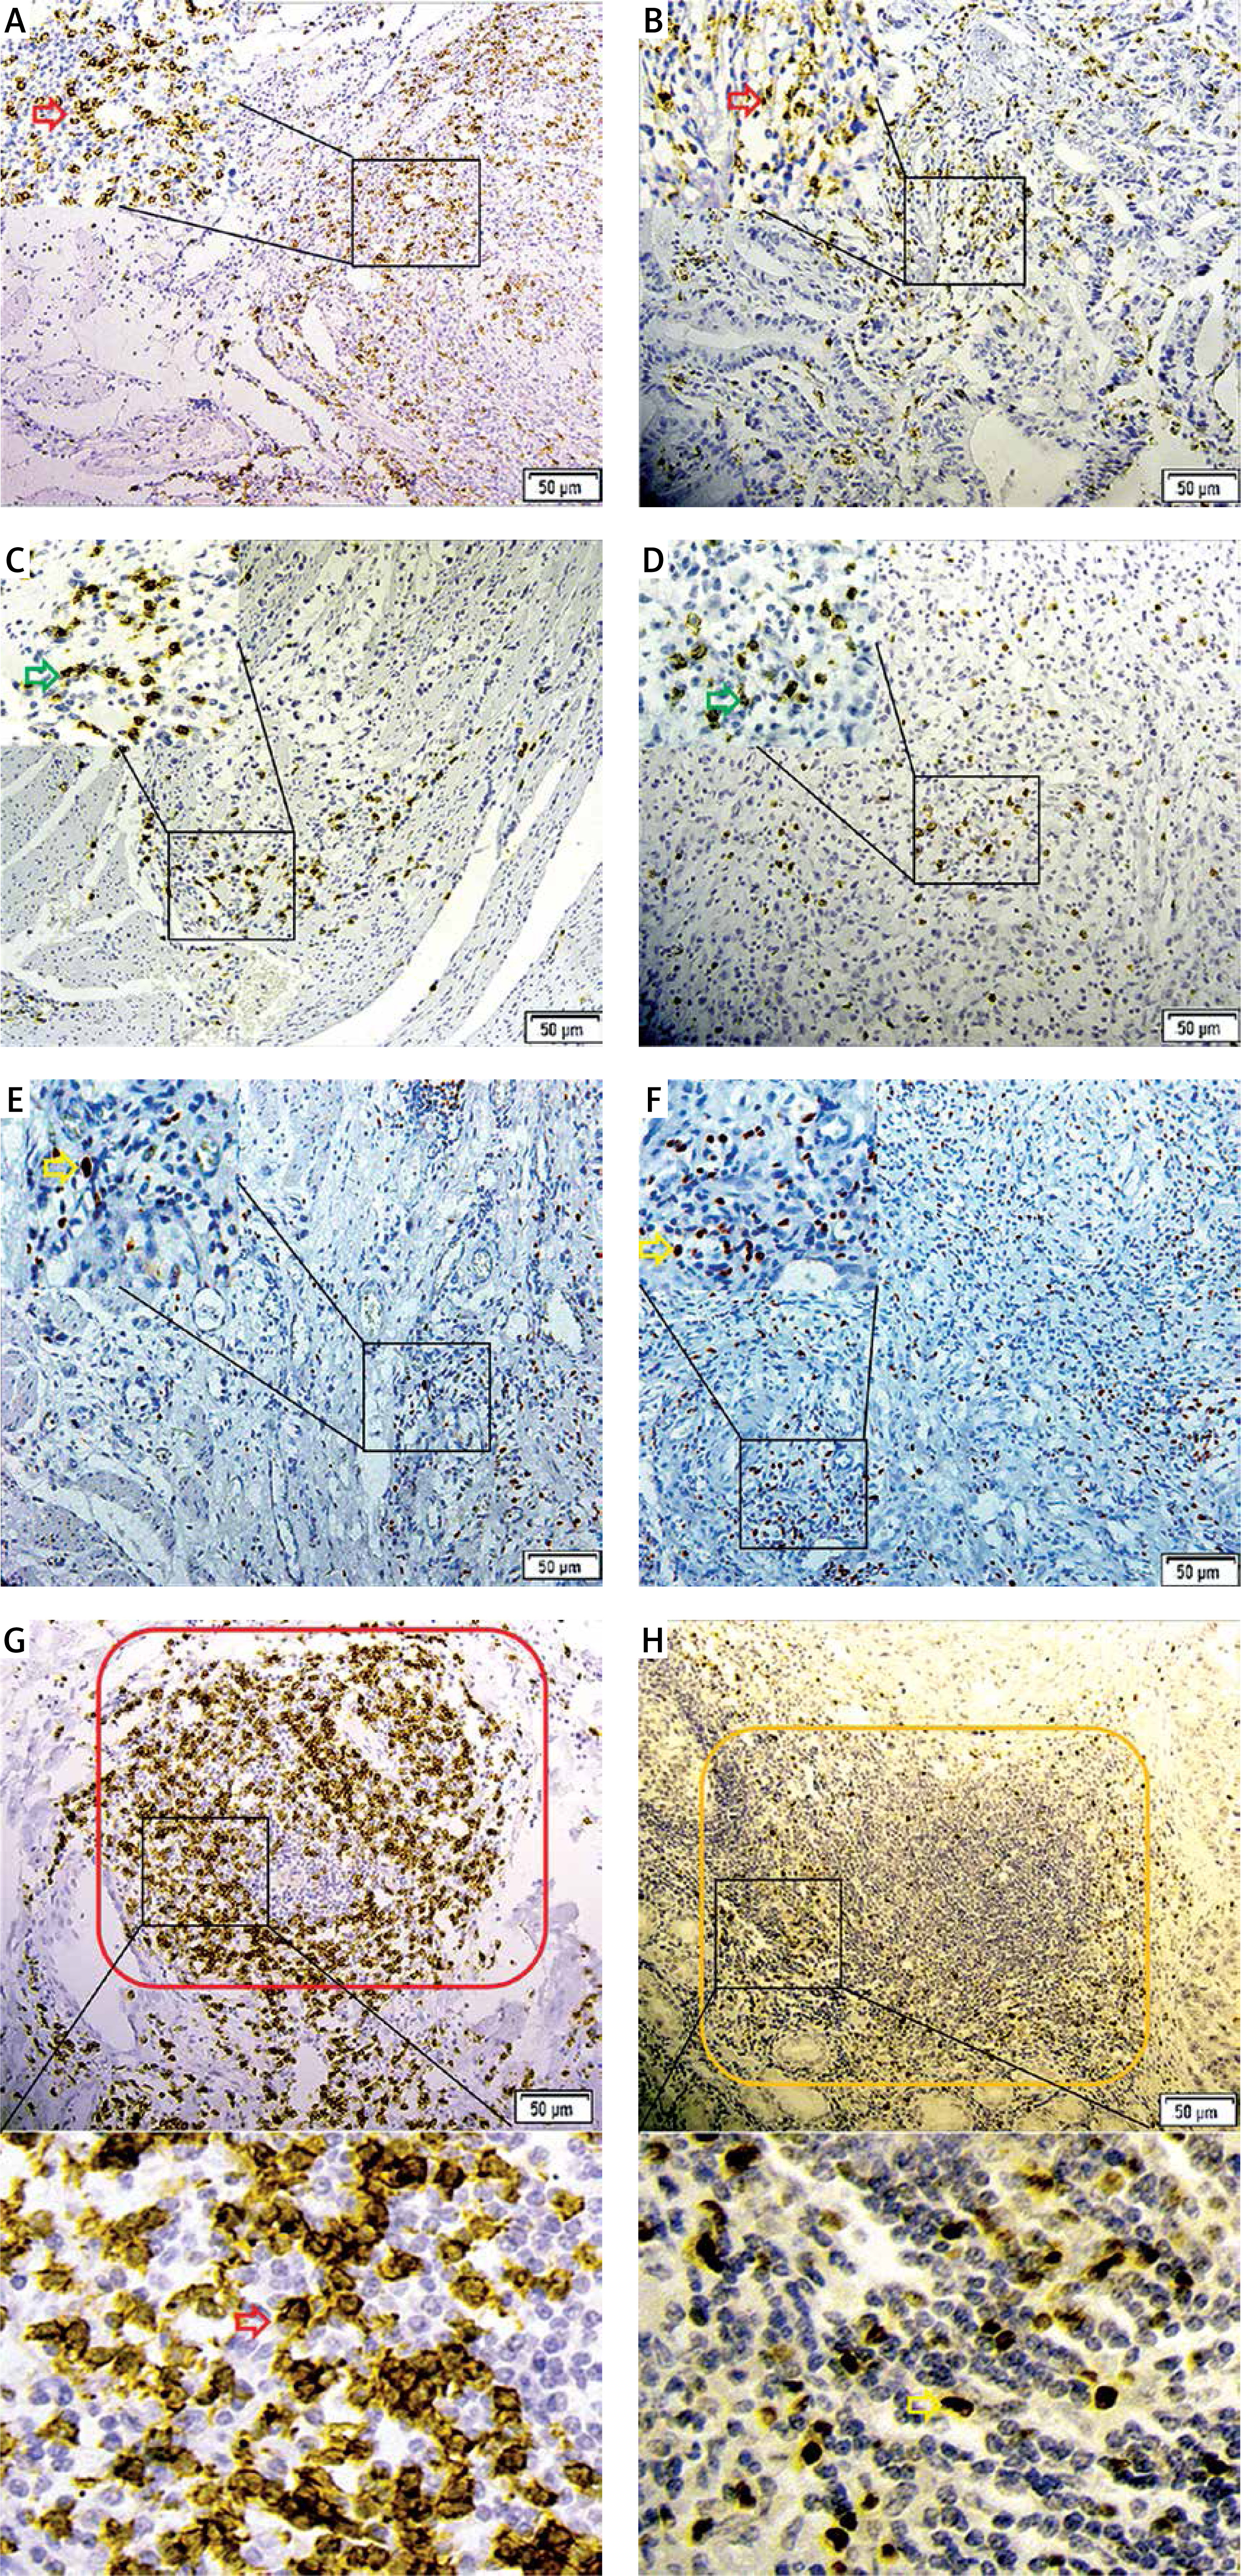
Figure 3
A, C, E – Distribution of CD8+ (red arrow), GrB+ (green arrow) and FOXP3+ T cells (yellow arrow) in the peritumoral region. B, D, F – their distribution in the intratumoral region. G and H showed the distribution of CD8+ (red arrow) and FOXP3+ (yellow arrow) T cells within the TLSs (rolled up by red and yellow rectangles respectively). The partial enlarged area was in the upper left corner of picture A–F, and below the picture G and H
There is a positive association between TLSs and TILs in gastric cancer
Correlation analysis showed that the intra-TLSs and peri-TLSs were negatively correlated with each other, though without statistical significance (r = –0.154, p = 0.062, power = 0.420). However, higher amounts of TLSs are always positively correlated with a larger number of TILs either in the location or in the immune type. The total numbers of TILs and CD8+ T cells in the intratumoral or peritumoral region and the intra-GrB+ T cells were positively related to the TLSs and with statistical significance (Table I).
High density of TLSs and TILs predicts a positive prognostic value of GC
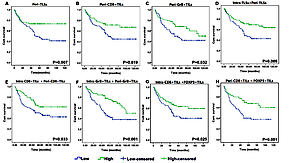
Higher numbers of peri-TLSs (p = 0.007), peri-CD8+ (p = 0.019) and peri-GrB+ T cells (p = 0.032) were significantly correlated with the favorable survival of GC patients (Figures 5 A–C). Additionally, independently of the location of TLSs and TILs, we found that the survival rate in patients with a higher frequency of TLSs (p = 0.009) and CD8+ (p = 0.033) and GrB+ T cells (p = 0.001) was significantly better than in those with a lower density of TLSs and TILs (Figures 5 D–F). Also, a higher density of TILs either in the intratumoral (p = 0.025) or peritumoral (p = 0.001) region always predicts better prognosis in GC, regardless of the subtype of TILs (Figures 5 G, H).
Figure 5
Kaplan-Meier survival analysis with log-rank test. Survival curves of the TLSs and TILs in different region with low and high density
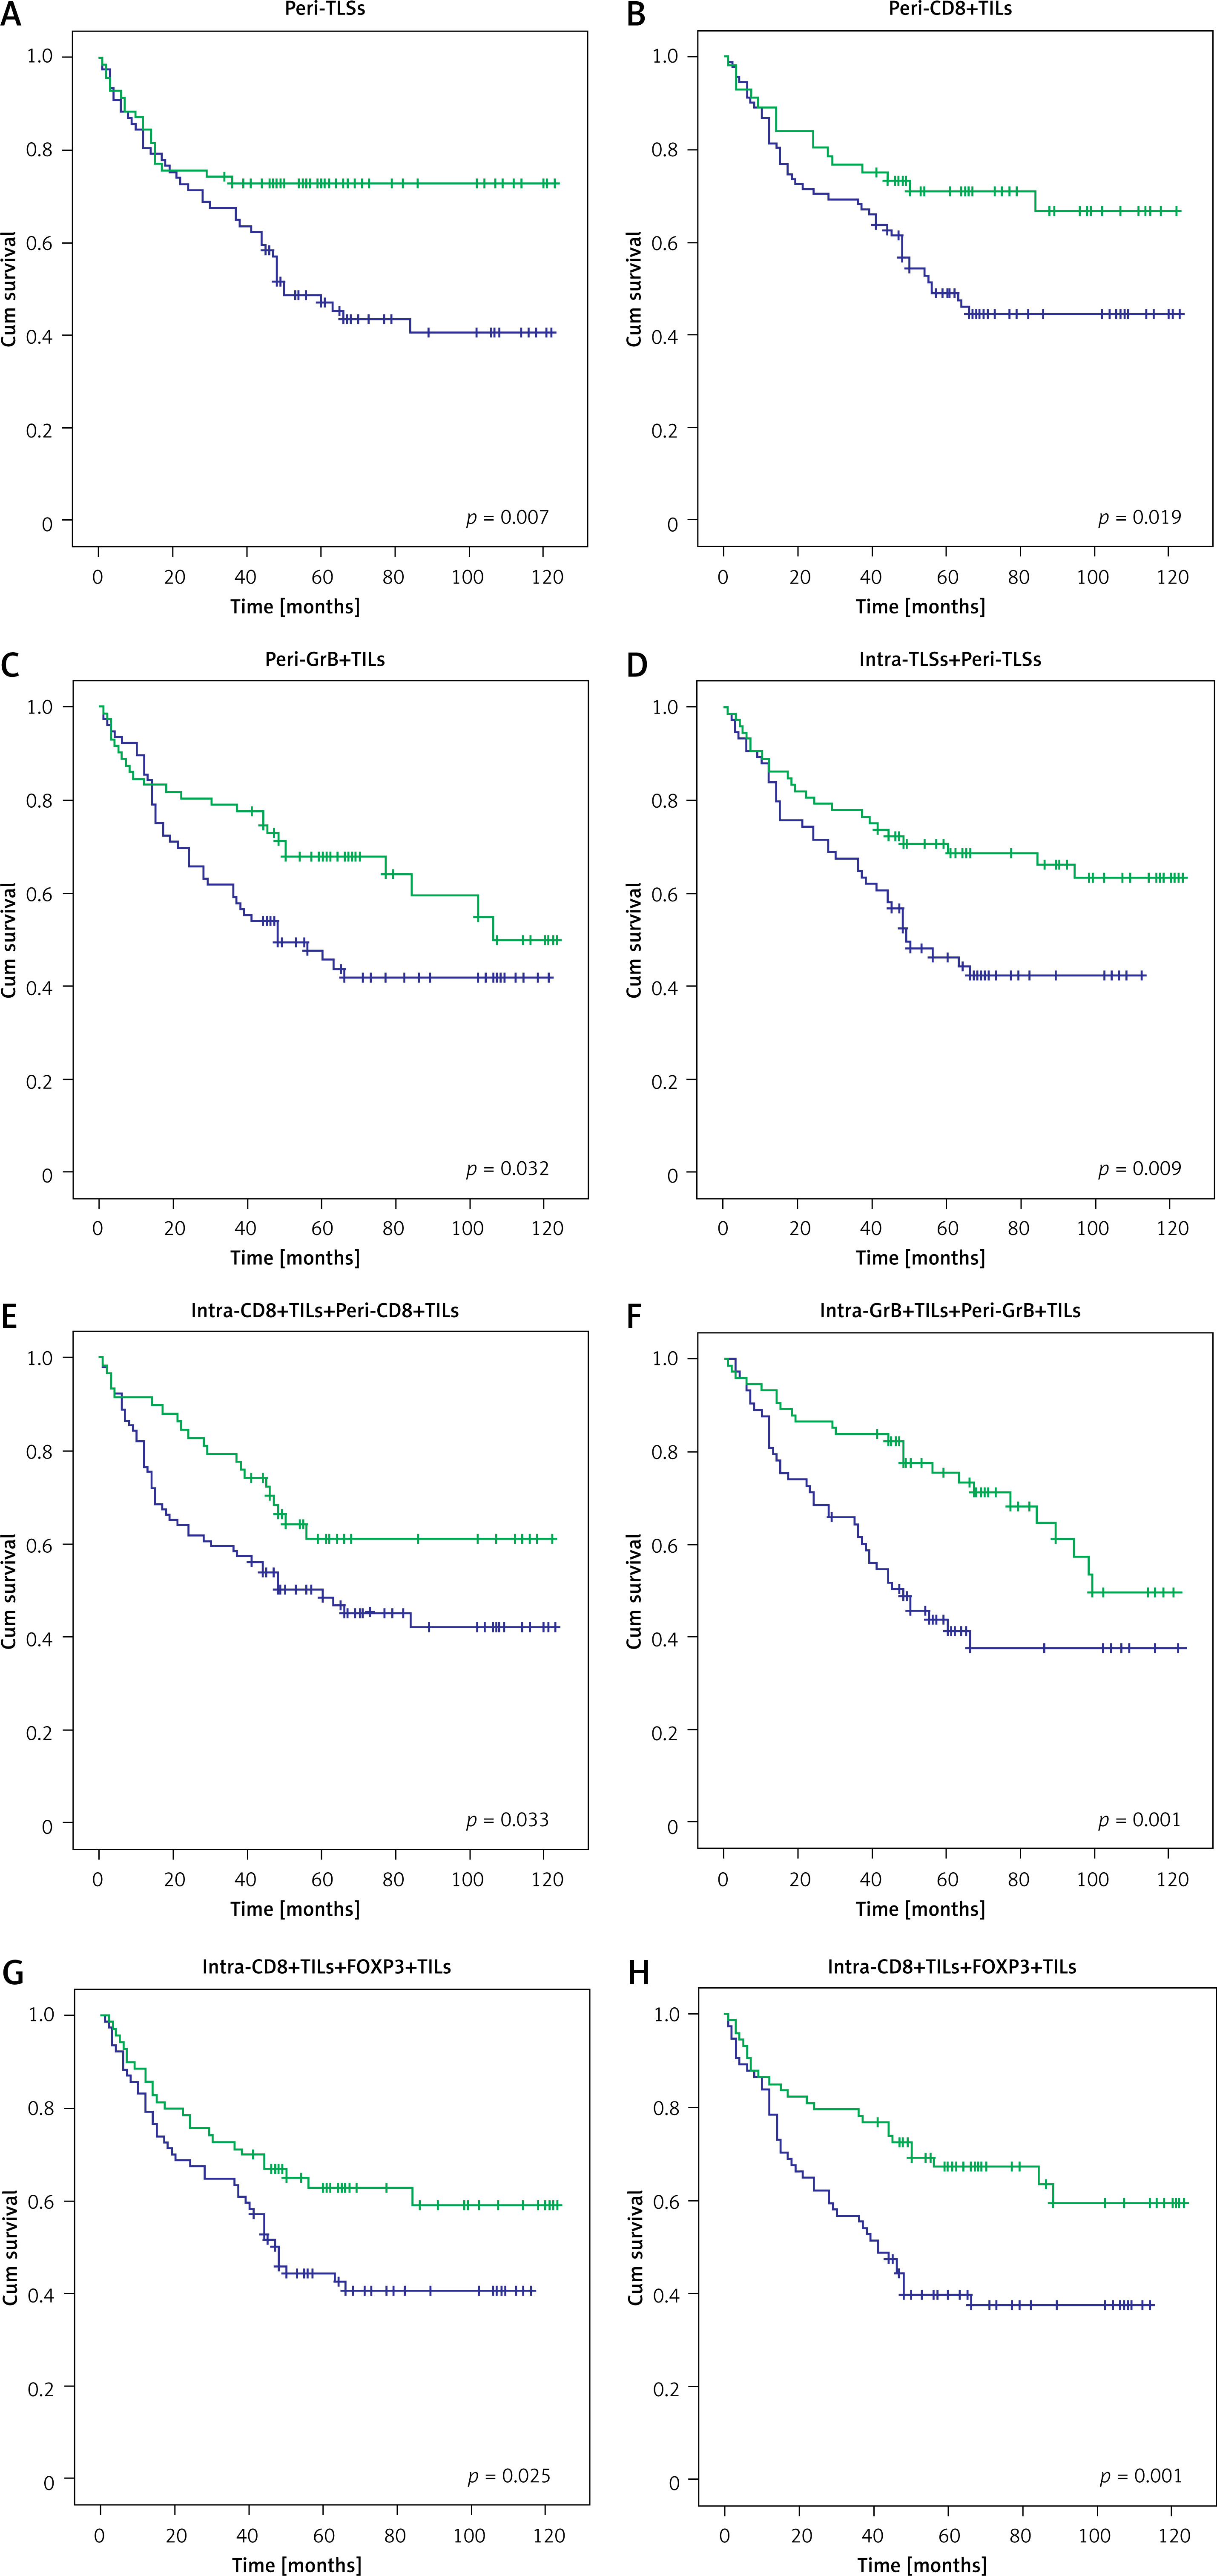
The Cox proportional hazards model was used to further assess the prognostic value of TLSs and TILs. As shown in Table II, on univariate analysis, the GC patients with lower numbers of TILs (F = 4.557, HR = 0.37; p = 0.008) and TLSs (F = 8.302, HR = 0.51; p = 0.001), older age (p = 0.009), and tumors with larger size (p = 0.023), positive lymph node metastasis (p < 0.001), later stage (p = 0.013), and of diffused or mixed type (p = 0.003) showed a significantly higher hazard ratio for a poor prognosis. Multivariate analysis (F = 153.434) revealed that only positive lymph node metastasis (p = 0.003), frequency of TLSs (p = 0.037) and density of TILs (p = 0.019) were independent prognostic predictor for GC patients.
Table II
Univariate and multivariate analysis of 10-year overall survival for GC patients
Association of TILs and TLSs with clinicopathologic parameters
Higher frequency of TILs and TLSs was often associated with favorable clinicopathologic parameters. Correlation tests showed that the tumor size was inversely correlated with the TLSs (r = –0.149, p =0.071, power = 0.439) and TILs (r = –0.286, p < 0.001, power = 0.943). Additionally, higher density of TILs was significantly associated with smaller tumor size (p = 0.001), negative lymph node metastasis (p = 0.009), and Lauren classification with an intestinal type (p = 0.002). Furthermore, a higher frequency of TLSs was significantly associated with younger age (p = 0.030), smaller tumor size (p = 0.037), negative lymph node metastasis (p < 0.001), and earlier clinical stage (p < 0.001) (Table III).
Table III
Association of TLSs and TILs with clinicopathologic parameters
Discussion
It has been verified that the TLSs could improve local immune responses by recruiting lymphocytes from the blood into tumor tissue [30]. TLSs are structurally characterized by the HEVs that function to recruit lymphocytes into the TME. Studies have shown that the expression of PNAd in HEVs facilitates the migration of lymphocytes from the blood vessel to the tumor tissue [31]. Also, high densities of HEVs correlated with increased naïve, memory, and activated effector memory T cell infiltration and T cell cytotoxicity in human primary solid tumors [32, 33]. In addition, significantly longer disease-free survival was observed in BCa patients with high-density HEVs than in those with low-density HEVs [34]. Thus, the lymph follicles with positive HEVs in the GC tissue were regarded as the TLSs in this study, and our study showed that a higher frequency of TLSs in GC predicts favorable prognosis no matter where they located.
Similar to the adaptive immune response in SLOs, the dendritic cells recognize, process, and present tumor antigens to the T cells, mediating the activation of T cells within the TLSs and attack the tumor cells directly in the TME [5, 25]. Previous studies have verified the different positional role of TILs and TLSs in predicting the prognosis for cancer patients [28, 35, 36]. Additionally, a study has demonstrated that TLSs are important sites for the initiation and/or maintenance of the local and systemic T- and B-cell responses against tumors [7]. Our study indicated that the TLSs were positively correlated with the CD8+TILs and their activated form (GrB+TILs) in GC tissue either in the intratumoral or peritumoral region, but without a significant relation with the CD4+TILs and FOXP3+TILs. It suggested that the TLSs might be the site for the T cell differentiation into the anti-tumor subtype.
A higher density of CD8+ and GrB+ T cells was also verified to be associated with a better outcome for GC patients. Additionally, the number of CD8+ T cells with cytotoxic effects was also significantly higher within the TLSs than FOXP3+ T cells with immunosuppressive effects. These results indicated that the formation of TLSs contributes to the differentiation and activation of T cells into an anti-tumor immunophenotype. Previous studies also verified the importance of TLSs in the initiation and/or maintenance of the local and systemic T and B cell responses against tumors [13, 14, 25]. It has been reported that the presence and density of TLS are mainly associated with Th1 and cytotoxic related cellular immune responses in breast, colorectal, lung and pancreatic cancers [25, 27, 37–39]. In addition, TLSs density were also associated with CD20+ B cells, and the size and density of B cell follicles or germinal centers are significantly correlated with good outcome in breast and lung cancer [13, 38]. Furthermore, in lung cancer and germ cell tumors, the presence of B cell follicles in TLSs promotes the activated mechanisms of germinal centers’ somatic hypermutation and class switch recombination, accompanied by generation of plasma cells [13, 40]. Thus, a high density of TLSs appears to be a good biomarker of the tumor immune microenvironment in which cellular and humoral immune reactions occur. Its favorable prognostic role has also been verified in many different cancer types, including oral squamous cell carcinoma [32], skin Merkel cell carcinoma [41], lung cancer [6, 13, 14], colorectal cancer [39], pancreatic cancer [26] and breast cancer [37, 38]. The present study showed that the TLS distribution was significantly higher in the tumor invasive edge than the tumor center. Similarly, the CD8+ T cells were also more abundantly distributed in the peritumoral than intratumoral region, and the CD8+ T cells were densely distributed within the TLSs. We discovered that the CD8+ T cells could form a palisading immune line at the edge of the tumor in many slides (Figures 4 A–B). Studies have reported that tumor cells may harbor some malignant biological behavior at the edge of tumor infiltration, such as poor differentiation, epithelial-mesenchymal transition, stemness differentiation, immune escape and metastatic potential [42, 43]. Tumor budding, an isolated single cancer cell or a cluster of up to five cells at the invasive front [44] are prone to evolving epithelial-mesenchymal transition, acquiring cancer stem cell biological potential and associated with distant metastasis and poor prognosis for cancer patients [42, 43]. A higher frequency of TLSs and CD8+ T cells in the tumor invasive margin may help to prevent the malignant evolution of cancer cells, and the TLSs can promote the proliferation, differentiation, and activation of CD8+ T cells and guide them to migrate to the tumor region [45, 46]. Therefore, a higher frequency of TLSs is associated with favorable biological indicators and prognosis in this study, which has also been verified by many other studies [6, 7]. Our work also revealed that the TLSs were an independent prognostic factor with a protective effect. However, the prognostic significance of the intratumoral and peritumoral TLSs in this study should be cautiously applied, although many studies also have emphasized the regional importance of immune component in the GC [35, 47]. Still, there is no exact definition of the peritumoral and intratumoral range of GC, so the prognostic role of different location of TLSs could also differ in different studies. Actually, earlier in 1996, Clemente et al. well documented the evidence of spatial variations in tumors [48]. It is important to recognize that the microenvironmental components vary significantly in different regions of the tumor tissue [49]. Interestingly, the CD8+ T cells and FOXP3+ T cells are oppositely distributed in the intratumoral and peritumoral region, and the FOXP3+ T cells have lower distribution in the tumor margin and within the TLSs, compared with the CD8+ T cells in the present study. A noteworthy study reported that the formation of TLSs and the number of CD8+ T cells within TLSs were increased after Treg cells were knocked out in lung cancer mice, and the cancer progression could be inhibited [50]. Another study also documented that Treg cell depletion can enable a self-amplifying loop of T-cell activation, promoting HEV development, T-cell infiltration, and, ultimately, tumor destruction [51]. The specific mechanisms between the Treg cells, CD8+ T cells, and TLSs may need to be further investigated.
In conclusion, TLSs can recruit ectopic infiltration of TILs to the GC tissue; simultaneously, the diversity of subtypes of TILs also provides a basis for TLS formation. The TLSs are mostly present in the peritumoral region of the GC tissue, and positively correlated with the infiltration density of CD8+ T cells and GrB+ T cells. GC with higher levels of TLSs and TILs predicts a favorable prognosis. Therefore, the formation of TLS indicates advantageous immune system function, and with a positive anti-tumor effect. TLS might be considered as a novel biomarker to stratify the overall survival risk of untreated GC patients.