Introduction
Osteosarcoma (OS) is a primary malignant bone cancer defined by tumor cells directly forming osteoid tissue, with an incidence of approximately 3.4 cases per million individuals annually [1]. Predominantly affecting young people, teenagers, and youngsters between the ages of 10 and 25, OS exhibits a higher incidence in males than in females [2]. Clinically, the hallmark symptom of OS is persistent local pain, often intensifying at night, and potentially accompanied by a palpable mass and restricted joint movement [3]. A malignant osteoid matrix among tumor cells is pathognomonic, facilitating diagnosis. Despite the use of various treatment modalities, including surgery and neoadjuvant chemotherapy, the outcomes remain unsatisfactory, with significant adverse effects [4]. To develop more effective therapeutic strategies for osteosarcoma, it is essential to uncover the molecular pathways driving its progression. Among them, autophagy, a biological process wherein damaged organelles and proteins are broken down and recycled, is now known to have a significant role in the development of tumors [5]. For instance, a study has demonstrated that apatinib can prevent OS growth by causing OS cells to undergo autophagy [6]. Another study highlighted that autophagy modulation could increase OS cell sensitivity to chemotherapeutic agents, thereby improving treatment outcomes [7]. These findings emphasize the complex function of autophagy in OS and imply that targeting this pathway could offer promising therapeutic strategies for this challenging malignancy.
The intricate regulation of tumor development and treatment response in cancer is governed by several key signaling pathways, with the mTOR and Stat3 pathways being particularly critical in OS [8]. The mTOR pathway, a key modulator of metabolism and cell development, frequently acts to promote tumor growth by inhibiting cellular processes that would otherwise suppress malignancy, such as autophagy [9]. In OS, mTOR activation has been associated with enhanced tumor cell proliferation and survival, as exemplified by studies showing that LHX2 promotes OS cell proliferation and metastasis through mTOR pathway activation [10]. Conversely, Stat3 is a transcription factor that governs expression of various genes involved in cell proliferation, survival, and immune responses [11]. Stat3 plays a large part in OS progression, and studies have shown that its activation can inhibit processes that would otherwise limit tumor growth, such as autophagy, thereby increasing OS cell survival and resistance to chemotherapy [12]. Moreover, the interplay between the mTOR and Stat3 pathways has been identified as a critical axis in OS, where simultaneous targeting of these pathways could induce tumor cell death through the reactivation of suppressed cellular processes [13]. These insights suggest that therapeutic strategies aimed at modulating the mTOR/Stat3 signaling axis hold promise for the treatment of this aggressive malignancy.
Ferroptosis, an iron-dependent form of regulated cell death driven by lipid peroxidation, is tightly regulated by cellular redox homeostasis and autophagy. Due to its unique mechanism of cell death compared to other types of cells, it has attracted widespread attention in cancer research [14]. Key features of ferroptosis include damage to the cell membrane, mitochondrial shrinkage, and inactivation of glutathione peroxidase 4 (GPX4), causing oxidative damage and the build-up of fatal reactive oxygen species (ROS) [15]. Recent studies highlight that autophagy contributes to ferroptosis through selective degradation of iron storage proteins (e.g., ferritin) and lipid droplets, thereby increasing intracellular free iron and peroxidized lipids [16]. In the context of OS, ferroptosis is emerging as a possible target for therapy. For example, bavachin has been shown to increase Fe2+ levels and ROS accumulation, reduce glutathione, and induce ferroptosis in OS cells [17]. Apolipoprotein E (APOE) is primarily known for its role in lipid metabolism. It is currently widely studied in neurodegenerative and cardiovascular diseases such as Alzheimer’s disease and atherosclerosis [18–20]. Recently, it has been linked to ferroptosis, revealing its broader significance in cancer biology [21]. Previous studies have indicated that the overexpression of APOE in gastric cancer is associated with increased malignant invasiveness enhanced invasion and lymph node metastasis [22]. Additionally, APOE appears to regulate intracellular antioxidant defenses, suggesting its potential role in modulating sensitivity to ferroptosis [23]. Nevertheless, the function of APOE in OS is still mostly unexplored. Given the limited research on APOE in OS, this study seeks to investigate APOE as a central gene in OS, particularly with ferroptosis, to uncover its potential as a therapeutic target.
This investigation aims to assess the function of APOE in the progression of OS, with a particular emphasis on its regulatory impact on ferroptosis, autophagy, and iron metabolism. In particular, the effects of APOE overexpression on key cellular processes, including migration, proliferation, invasion, and epithelial-mesenchymal transition (EMT), were investigated in OS cells. Furthermore, the interactions between APOE and the mTOR/Stat3 signaling pathway were investigated and evaluated for their effects on autophagy and ferroptosis in OS. Using in vitro cell models and in vivo mouse xenografts, this research aims to elucidate the molecular processes by which APOE regulates OS progression and evaluate its capacity as a target for therapy.
Material and methods
Weighted gene co-expression network analysis (WGCNA) for identification of the key gene module in OS
The GSE28424 dataset, obtained from the Gene Expression Omnibus (GEO; https://www.ncbi.nlm.nih.gov/geo/query/acc.cgi?acc=GSE28424), was utilized in this study. It includes 19 osteosarcoma (OS) samples and 4 normal bone samples as controls. All genes in the GSE28424 dataset were comprehensively analyzed using the WGCNA method. The gene co-expression network was created by the Bioinfo Intelligent Cloud website (https://www.bic.ac.cn/BIC/#/). To ensure a scale-free topological structure, the optimal soft threshold power was precisely adjusted to β = 16. After the network was constructed, the weighted adjacency matrix was converted into a topological overlap matrix (TOM) as a robust measure of network connectivity. Hierarchical clustering of the TOM was performed to obtain a dendrogram. In this structure, each branch (represented by different colors) represents a different gene module. The weighted correlation coefficient was used to merge gene fragments with similar expression paths into the relevant modules. Finally, we assessed the correlation between these gene modules and the clinical characteristics of OS to identify the primary section modules potentially associated with OS progression and prognosis.
Screening of differentially expressed genes (DEGs) and performing intersection analysis
DEGs were identified from the GSE28424 dataset utilizing the limma package in R (version 4.0). Gene expression fold changes (FC) greater than 2 were classified as up-regulated genes, while those with FC less than 0.5 were considered down-regulated genes. The criterion for statistical significance was established at p < 0.05. The R ggplot2 package (https://cran.r-project.org/package=ggplot2) was employed to visualize the DEGs. Subsequently, the Bioinformatics and Evolutionary Genomics website (http://bioinformatics.psb.ugent.be/webtools/Venn/) was used to conduct an intersection analysis between the key module genes identified from the WGCNA and all DEGs from the GSE28424 dataset, allowing for the identification of intersecting genes.
Protein-protein interaction (PPI) network construction and hub gene identification
The PPI network analysis of the intersection genes was performed by the Search Tool for the Retrieval of Interacting Genes (STRING: https://string-db.org/) website. The CytoHubba plugin (version 3.8.2) in Cytoscape was used to identify three key network modules using the Maximum Neighborhood Component (MNC), Maximum Clique Centrality (MCC), and Degree algorithms, and the top ten genes of the three algorithms were analyzed. Then, the genes in the three network modules were again subjected to intersection analysis using the Bioinformatics and Evolutionary Genomics website to obtain the key intersection genes. Then, the expression of these important crossover genes in normal and tumors was analyzed in the SangerBox database (http://sangerbox.com/), and the outcomes showed statistical significance when p < 0.05.
Cell culture
Cyagen Biosciences (Guangzhou, China) provided the human OS cell lines 143B, MG-63, SW1353, U2OS, SaOS-2, and the equivalent normal osteoblastic cell line HOB. The aforementioned cell lines were grown at 37°C in a humidified incubator with 5% CO2 in Dulbecco’s modified Eagle’s medium (DMEM; Sangon, Shanghai, China), supplemented with 10% fetal bovine serum (FBS; Sangon, Shanghai, China) and 100 U/ml penicillin/streptomycin solution (Sangon, Shanghai, China).
Cell transfection
At a density of 5×10⁵ cells per well, cells were seeded onto 6-well plates and cultured for 24 h. Upon reaching 70–80% confluence, cells were transfected with APOE overexpression vectors applying Lipofectamine 2000 (10 µl per well; Invitrogen, Shanghai, China) according to the manufacturer’s protocol. The negative control was an empty vector. The transfection mixtures were incubated for 20 min at room temperature and then incorporated into the culture dishes containing 143B and U2OS cells in serum-free medium. After 48 h of incubation, transfected cells received treatment with 10 µM 3-methyladenine (3-MA; Topscience, Shanghai, China), an autophagy inhibitor, for 24 h at 37°C. Cells were subsequently harvested for further experiments.
Quantitative real-time reverse transcription PCR (qRT-PCR)
Trizol reagent (Tiangen, Beijing, China) was applied to extract total RNA from cells and tissues under the manufacturer’s instructions. Agilent 2100 Bioanalyzer (Agilent, Shanghai, China) served to evaluate the quality of the RNA. Complementary DNA (cDNA) was synthesized from the isolated RNA using the PrimeScript RT reagent kit (Takara, Shanghai, China) according to the manufacturer’s instructions. Quantitative RT-PCR was conducted using Bio-Rad instruments (Bio-Rad, Shanghai, China) with SYBR Green reagent (TaKaRa, Dalian, China) in duplicate reactions. All qRT-PCR results were analyzed using 2–ΔΔCt values and normalized to glyceraldehyde-3-phosphate dehydrogenase (GAPDH), which served as the internal control. Primer sequences for amplification are shown in Tables I and II.
Table I
Primer sequences for in vitro qRT-PCR
Table II
Primer sequences for in vivo qRT-PCR
Western blot (WB) assay
Total protein was extracted from cells and tissues utilizing RIPA buffer (Beyotime, Shanghai, China). Protein Concentration Kits (Beyotime, Shanghai, China) were applied to calculate the protein concentration. Following a 5-minute boil at 98°C, total proteins from the samples were separated using 10% sodium dodecyl sulfate-polyacrylamide gel electrophoresis (SDS-PAGE) and moved to membranes made of PVDF (Beyotime, Shanghai, China). The primary antibodies were then incubated on the membranes for a whole night at 4°C after they had been blocked for 1 h at room temperature with 5% nonfat milk. The next day, secondary antibodies (Sanying, Wuhan, China) coupled with horseradish peroxidase (HRP) were incubated on the membranes for 1 h at room temperature. Protein bands were detected utilizing enhanced chemiluminescence (ECL) reagents (Beyotime, Shanghai, China) and visualized with the Image J software. The following primary antibodies were employed in this investigation: APOE (1 : 1000), N-cadherin (1 : 2000), E-cadherin (1 : 20000), Vimentin (1 : 2000), p-mTOR (1 : 2000), mTOR (1 : 5000), p-Stat3 (1 : 1000), Stat3 (1 : 2000), Beclin1 (1 : 1000), LC3B-1 (1 : 1000), LC3B-2 (1 : 1000), p62 (1 : 5000), TfR1 (1 : 1000), FPN (1 : 2000), GPX4 (1 : 1000), SLC7A11 (1 : 1000), and GAPDH (1 : 5000). All antibodies were sourced from Sanying (Wuhan, China).
Cell Counting Kit-8 (CCK-8) assay
Cell proliferation was measured using the CCK-8 kit (Yeasen, Shanghai, China). After being equally plated at a density of 1 × 10³ cells per well in a 96-well plate, the cells were grown for 1, 2, 3, 4, and 5 days. After that, 10 µl of CCK-8 reagent was added to each well. The optical density (OD) of each well at 450 nm was measured using a microplate reader (Bio-Rad, Shanghai, China) to investigate the viability of the cells.
Transwell assay
Transwell assays were conducted to assess the capacity of OS 143B and U2OS cells to invade and migrate. For the invasion assay, the upper chambers of Transwell plates (Corning, Shanghai, China) were pre-coated with 40 µl of Matrigel (BD Biosciences, Shanghai, China) and solidified for 30 min at 37°C. Each Transwell chamber had an upper chamber holding around 5 × 10⁴ cells suspended in 200 μl of DMEM media without FBS, and a bottom chamber holding 600 μl of DMEM containing 10% FBS. After incubation for 24 h at 37°C, cells were dyed with DAPI (Beyotime, Shanghai, China) for 15 min at 37°C and counted under an optical microscope (Nikon, Shanghai, China). For the migration assay, cells were seeded into Matrigel-uncoated upper chambers. The residual procedures were identical to those used in the invasion tests.
Flow cytometry
For apoptosis analyses, the cells were evaluated by flow cytometry using the Annexin V-PE/FITC apoptosis detection kit (Beyotime, Shanghai, China). The transfected 143B and U2OS cells were detached using trypsin-EDTA (Absin, Shanghai, China). The cells were cleaned with phosphate-buffered saline (PBS) following treatment. After that, the cells were again suspended in 1× binding buffer supplied with the Annexin V-FITC apoptosis detection kit. Each 100 μl cell suspension in binding buffer received 5 μl of propidium iodide (PI) and 5 μl of Annexin V-FITC. After giving the cells a gentle vortex, they were incubated for 30 min in the dark at room temperature. After staining, each sample received 400 μl of 1× binding buffer, for a total volume of 500 μl. A BD FACSCalibur flow cytometer (BD Biosciences, NJ, USA) was used to collect the data. For every sample, at least 10,000 occurrences were recorded. Flow cytometry data were examined using FlowJo software (FlowJo LLC, Oregon, USA).
Detection of ROS level
Intracellular ROS levels were measured with a ROS test kit (Jiancheng, Nanjing, China). 143B and U2OS cells that had been transfected were treated for 30 min at 37°C in the dark with the DCFH-DA fluorescent probe (Beyotime, Shanghai, China). To remove excess dye, the cells were rinsed three times with PBS after incubation. An excitation wavelength of 488 nm and an emission wavelength of 525 nm were employed to measure the fluorescence intensity, which is a good indicator of ROS levels, using a microplate reader (Bio-Rad, Shanghai, China).
Detection of superoxide dismutase (SOD)
The SOD level was determined via a SOD assay kit (Beyotime, Shanghai, China). The lysis buffer included in the kit was used to lyse OS cells. To extract supernatant and eliminate cell debris, cell lysates were centrifuged at 10,000 x g for 4°C. An assay kit for BCA protein (Beyotime, Shanghai, China) was employed to measure the protein content. With SOD assay buffer, protein samples were diluted. In accordance with the manufacturer’s proposals, SOD levels were assessed by a SOD test kit. Absorbance was measured at 450 nm using a microplate reader (Bio-Rad, Shanghai, China).
Measurement of glutathione (GSH)
A GSH assay kit (Jiancheng, Nanjing, China) was performed to quantify the GSH levels. The transfected 143B and U2OS cells were washed with cold PBS, and lysed in a GSH assay buffer provided with the GSH assay kit. After removing any debris from the cell lysates with a 10-minute, 10,000 × g centrifugation at 4°C, the supernatants were separated and saved for further examination. The GSH levels were detected by following the manufacturer’s protocol, which involves a two-step enzymatic reaction that converts GSH into a measurable form. A microplate reader (Bio-Rad, Shanghai, China) was utilized to quantify the absorbance at 405 nm.
Measurement of malondialdehyde (MDA)
The test kit for lipid peroxidation MDA (Jiancheng, Nanjing, China) was carried out to assess the MDA levels. Transfected 143B and U2OS cells were rinsed with ice-cold PBS, lysed using RIPA lysis buffer (Beyotime, Shanghai, China), and subjected to centrifugation at 10,000 × g for 10 min at 4 °C. To measure the amount of MDA and the concentration of protein, the supernatant was collected. The sample was then heated for 15 min in a mixture of 0.1 ml and 0.2 ml MDA solution. The absorbance at 532 nm was measured using a microplate reader (Bio-Rad, Shanghai, China) once the sample had cooled to room temperature.
Iron assay
The levels of Fe²+ and total iron were measured via an iron assay kit (Abcam, Shanghai, China). Cells were homogenized on ice in an iron assay buffer, and the supernatants were collected. To measure Fe²+ and total iron levels, samples were treated with iron buffer and an iron-reducing agent. The iron probe was added to each sample, and the mixtures were cultivated for 60 min at room temperature. A microplate reader (Bio-Rad, Shanghai, China) was used to measure the absorbance at 593 nm.
Mouse xenograft experiments
All animal experiments were conducted strictly in compliance with the policies and procedures authorized by the Ethics Committee of Zhongshan Hospital Minhang Branch, Fudan University (approval number: 2024-MHYY-534). Shulaibao Biotech (Wuhan, China) supplied male nude mice that were 4–5 weeks old. They were kept in standard laboratory conditions with unrestricted access to water and food. Two groups were arbitrarily selected for the mice (n = 6 per group): the Vector group, injected subcutaneously with 5 × 10⁶ 143B cells carrying a control vector, and the over-APOE group, injected with 5 × 10⁶ 143B cells overexpressing APOE. Injections were given on the right side of every mouse. Every week, the size and length of the tumors were measured utilizing calipers to track their growth. Tumor volume was computed with the following formula: Volume = (length × width²)/2. The mice were euthanized with 2% pentobarbital sodium (150 mg/kg) administered intraperitoneally after 4 weeks, following ethical guidelines. Tumors were excised, weighed, and captured on camera. After being removed, the tumors were quickly frozen in liquid nitrogen and kept for further examination at –80°C. All procedures were conducted in compliance with the principles of the 3Rs (replacement, reduction, and refinement) to ensure ethical experimentation.
Statistical analysis
The R programming language was used for statistical evaluation. Every experiment was conducted three separate times on its own. The data are expressed as mean ± SD. Two-tailed Student’s t-test was employed to compare the two groups. For comparisons among several groupings, one-way analysis of variance (ANOVA) followed by Tukey’s post-hoc test was employed. Statistical significance was established at p < 0.05.
Results
Identification of gene co-expression networks and modules
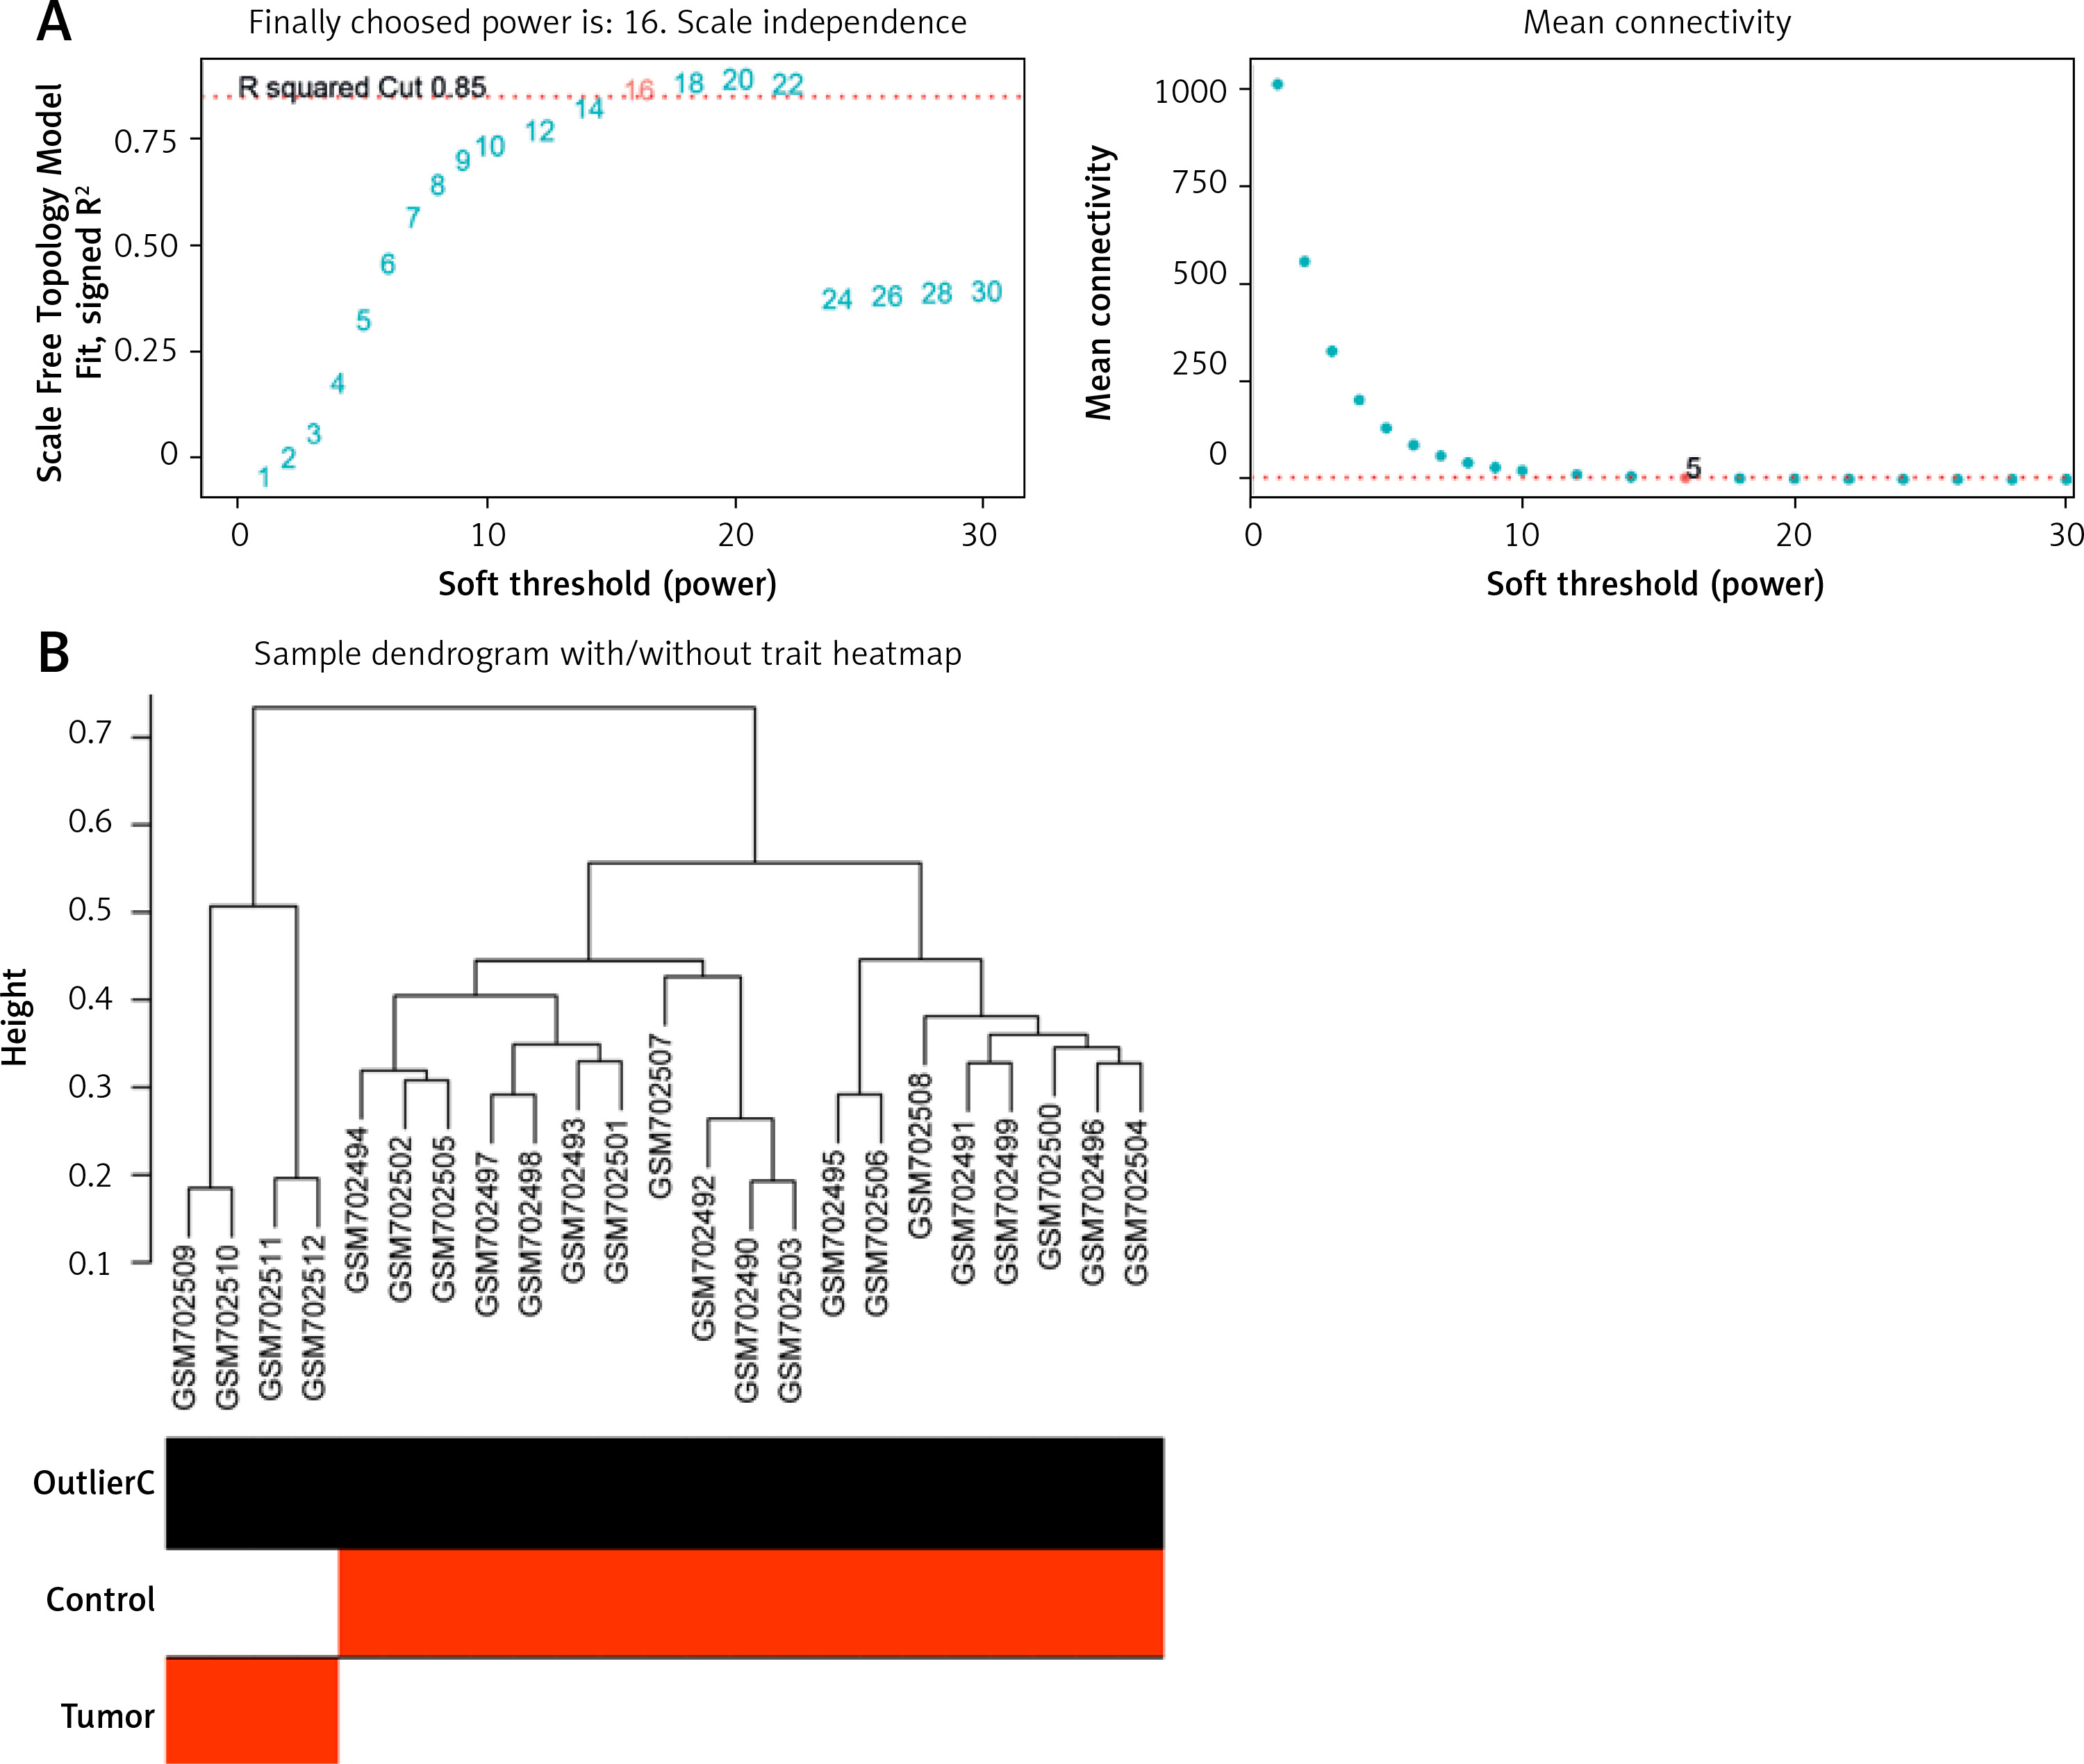
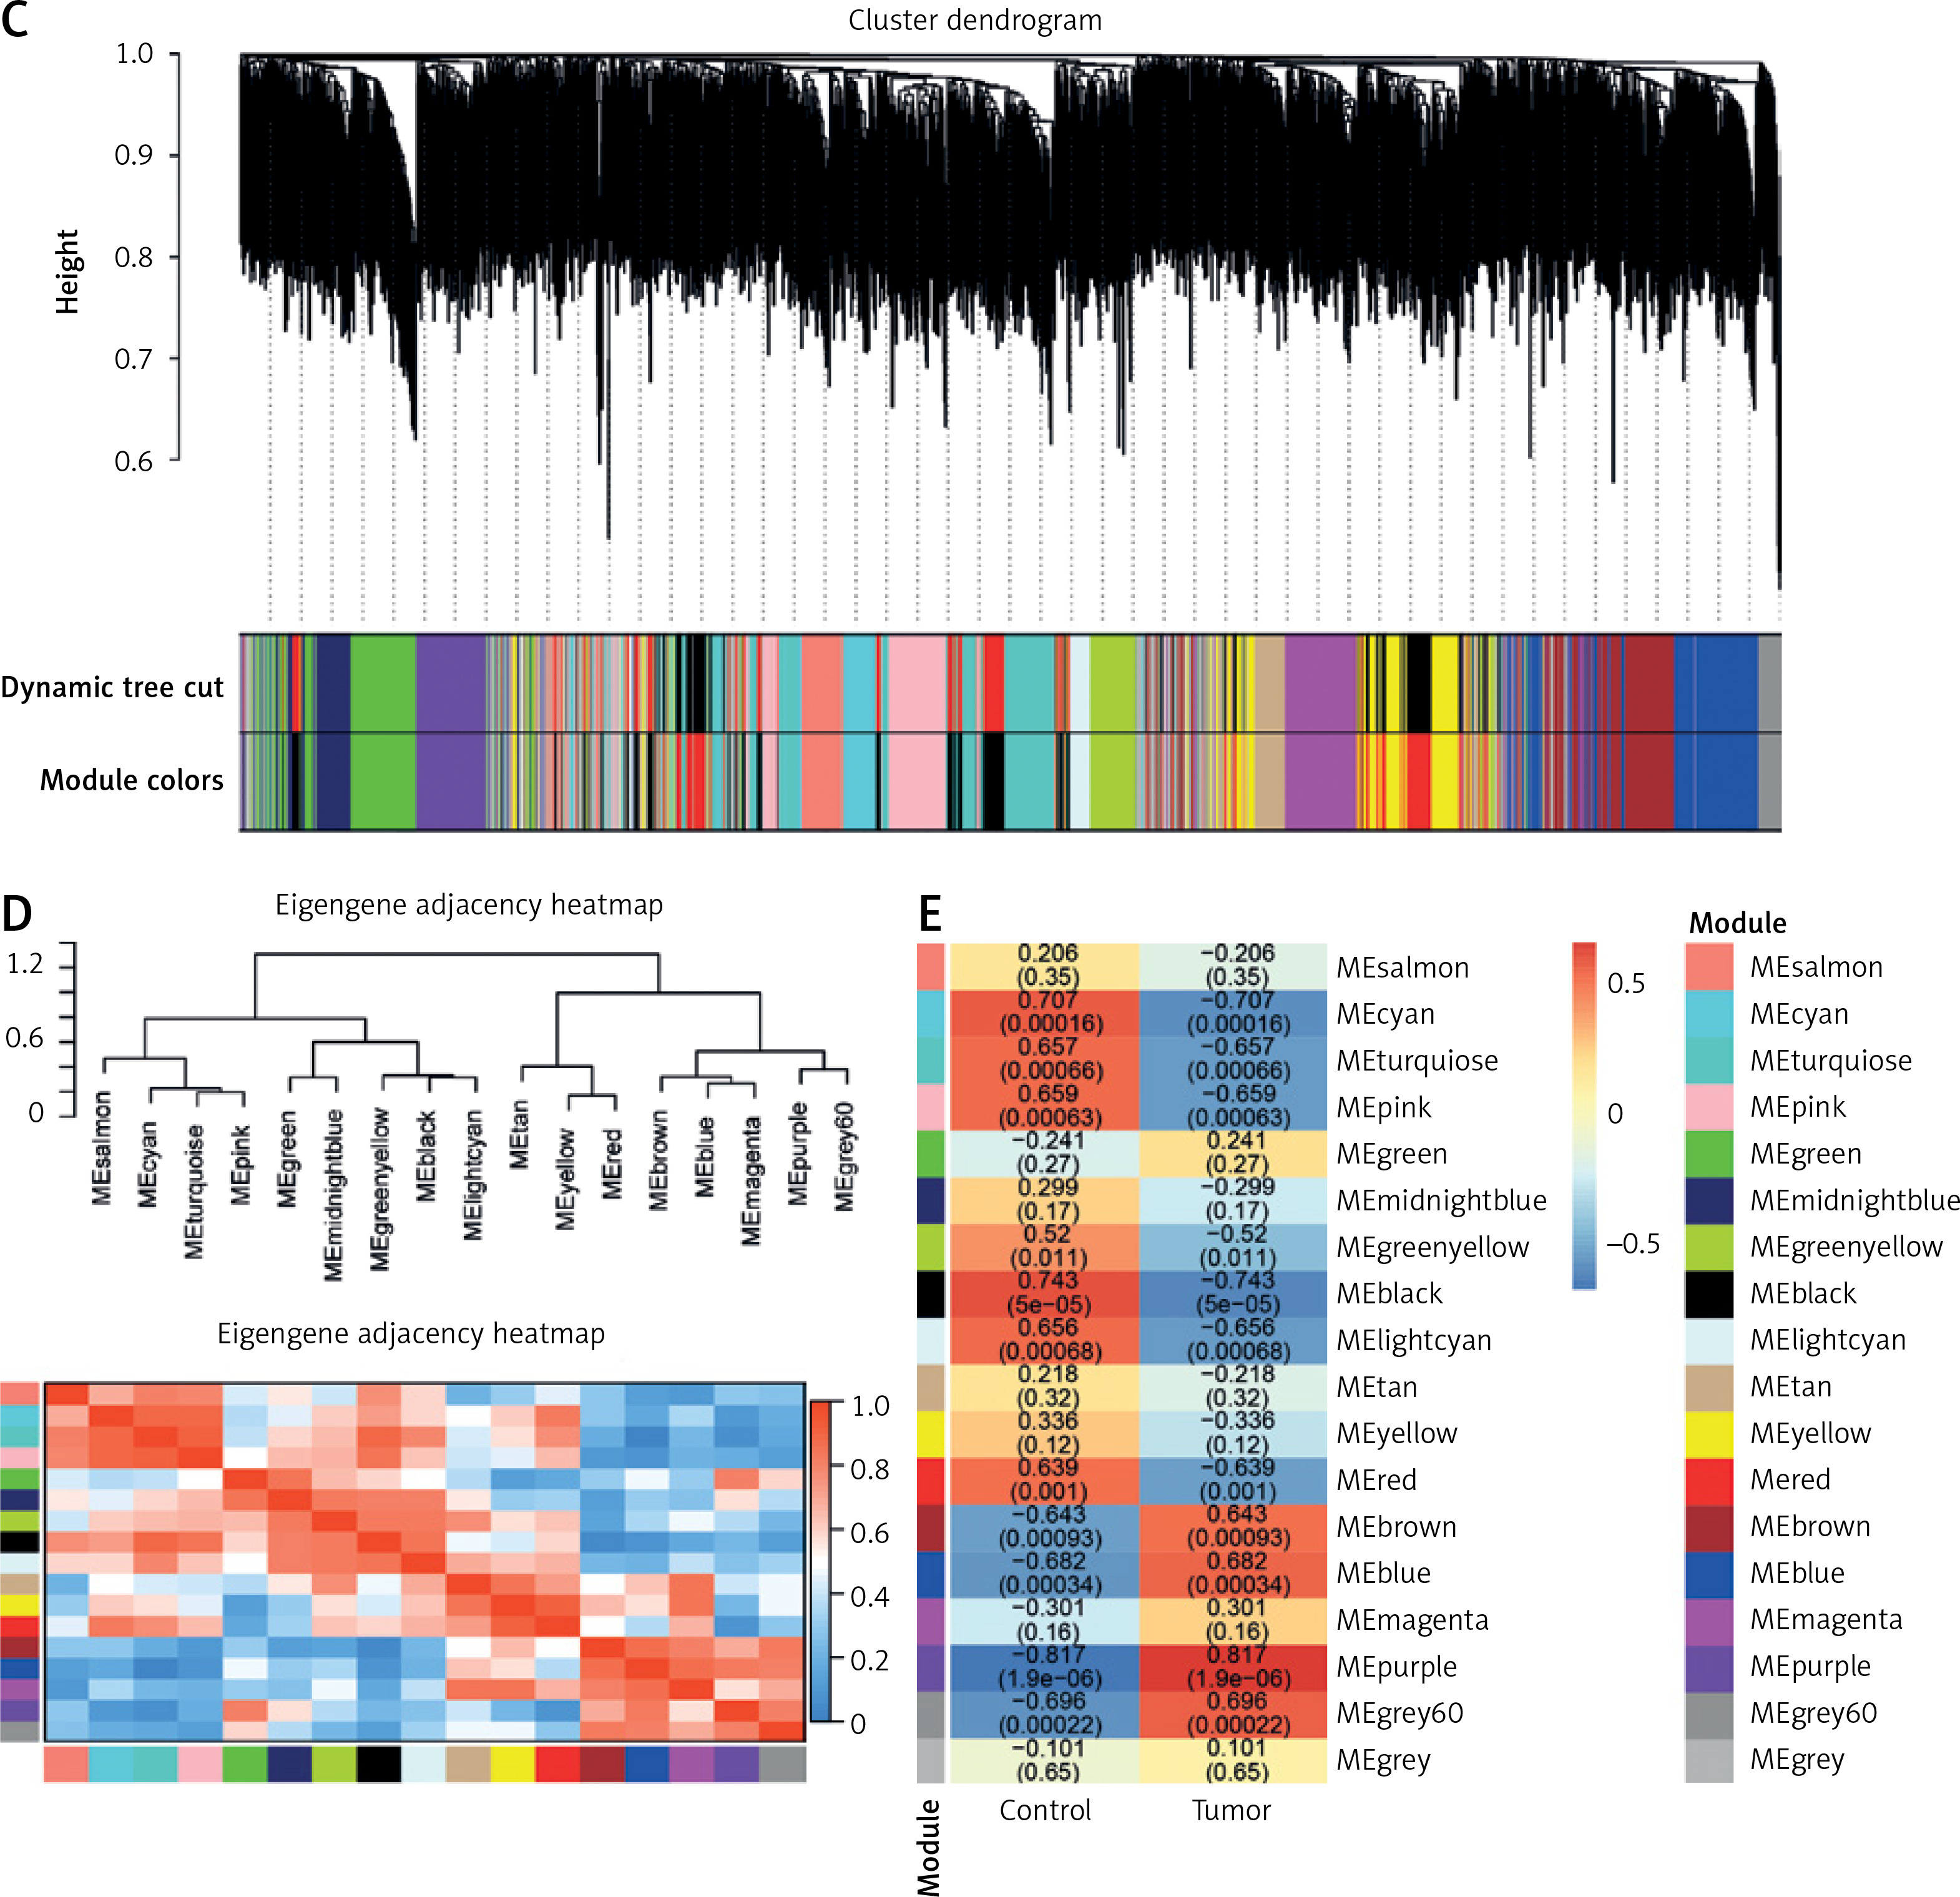
For a scale-free topological model fit, 16 was shown to be the ideal soft threshold power (Figure 1 A). The dendrogram of the GSE28424 samples showed no outliers (Figure 1 B). Based on their patterns of co-expression across samples, genes were categorized into several modules, and every module was assigned a different color (Figure 1 C). To unravel the connections among these identified modules, the characteristic gene adjacencies were carefully examined (Figure 1 D). Among the different modules, the purple module and the samples have a correlation value of 0.817, indicating a significant relationship (Figure 1 E). This significant correlation emphasizes the potential biological relevance of the genes within the cyan module to the GSE28424 dataset.
Figure 1
Weighted correlation network analysis (WGCNA) of samples from OS and control groups. A – Analysis of network topology for soft threshold power. The figure above shows the scale-free topology model fit. The horizontal red line indicates the chosen cutoff of 0.85 for the scale-free topological fit index. The bottom figure shows the average connectivity as a function of soft-threshold power. B – Sample dendrogram and trait heatmap. The upper panel is a hierarchical clustering dendrogram of the samples based on the expression data. The bottom panel indicates the classification of samples into osteosarcoma (OS) and Control groups C – Clustered dendrogram of genes. Different colors represent different gene modules. D – The eigengene dendrogram and eigengene adjacency heatmap. Colors represent the adjacency between module eigengenes, with red indicating high adjacency and blue indicating low adjacency. E – Heatmap of the module-trait relationships. The values in the cells represent the correlation coefficients and the corresponding p-values in parentheses
Identification of key genes in OS through PPI network analysis and determination of the hub gene
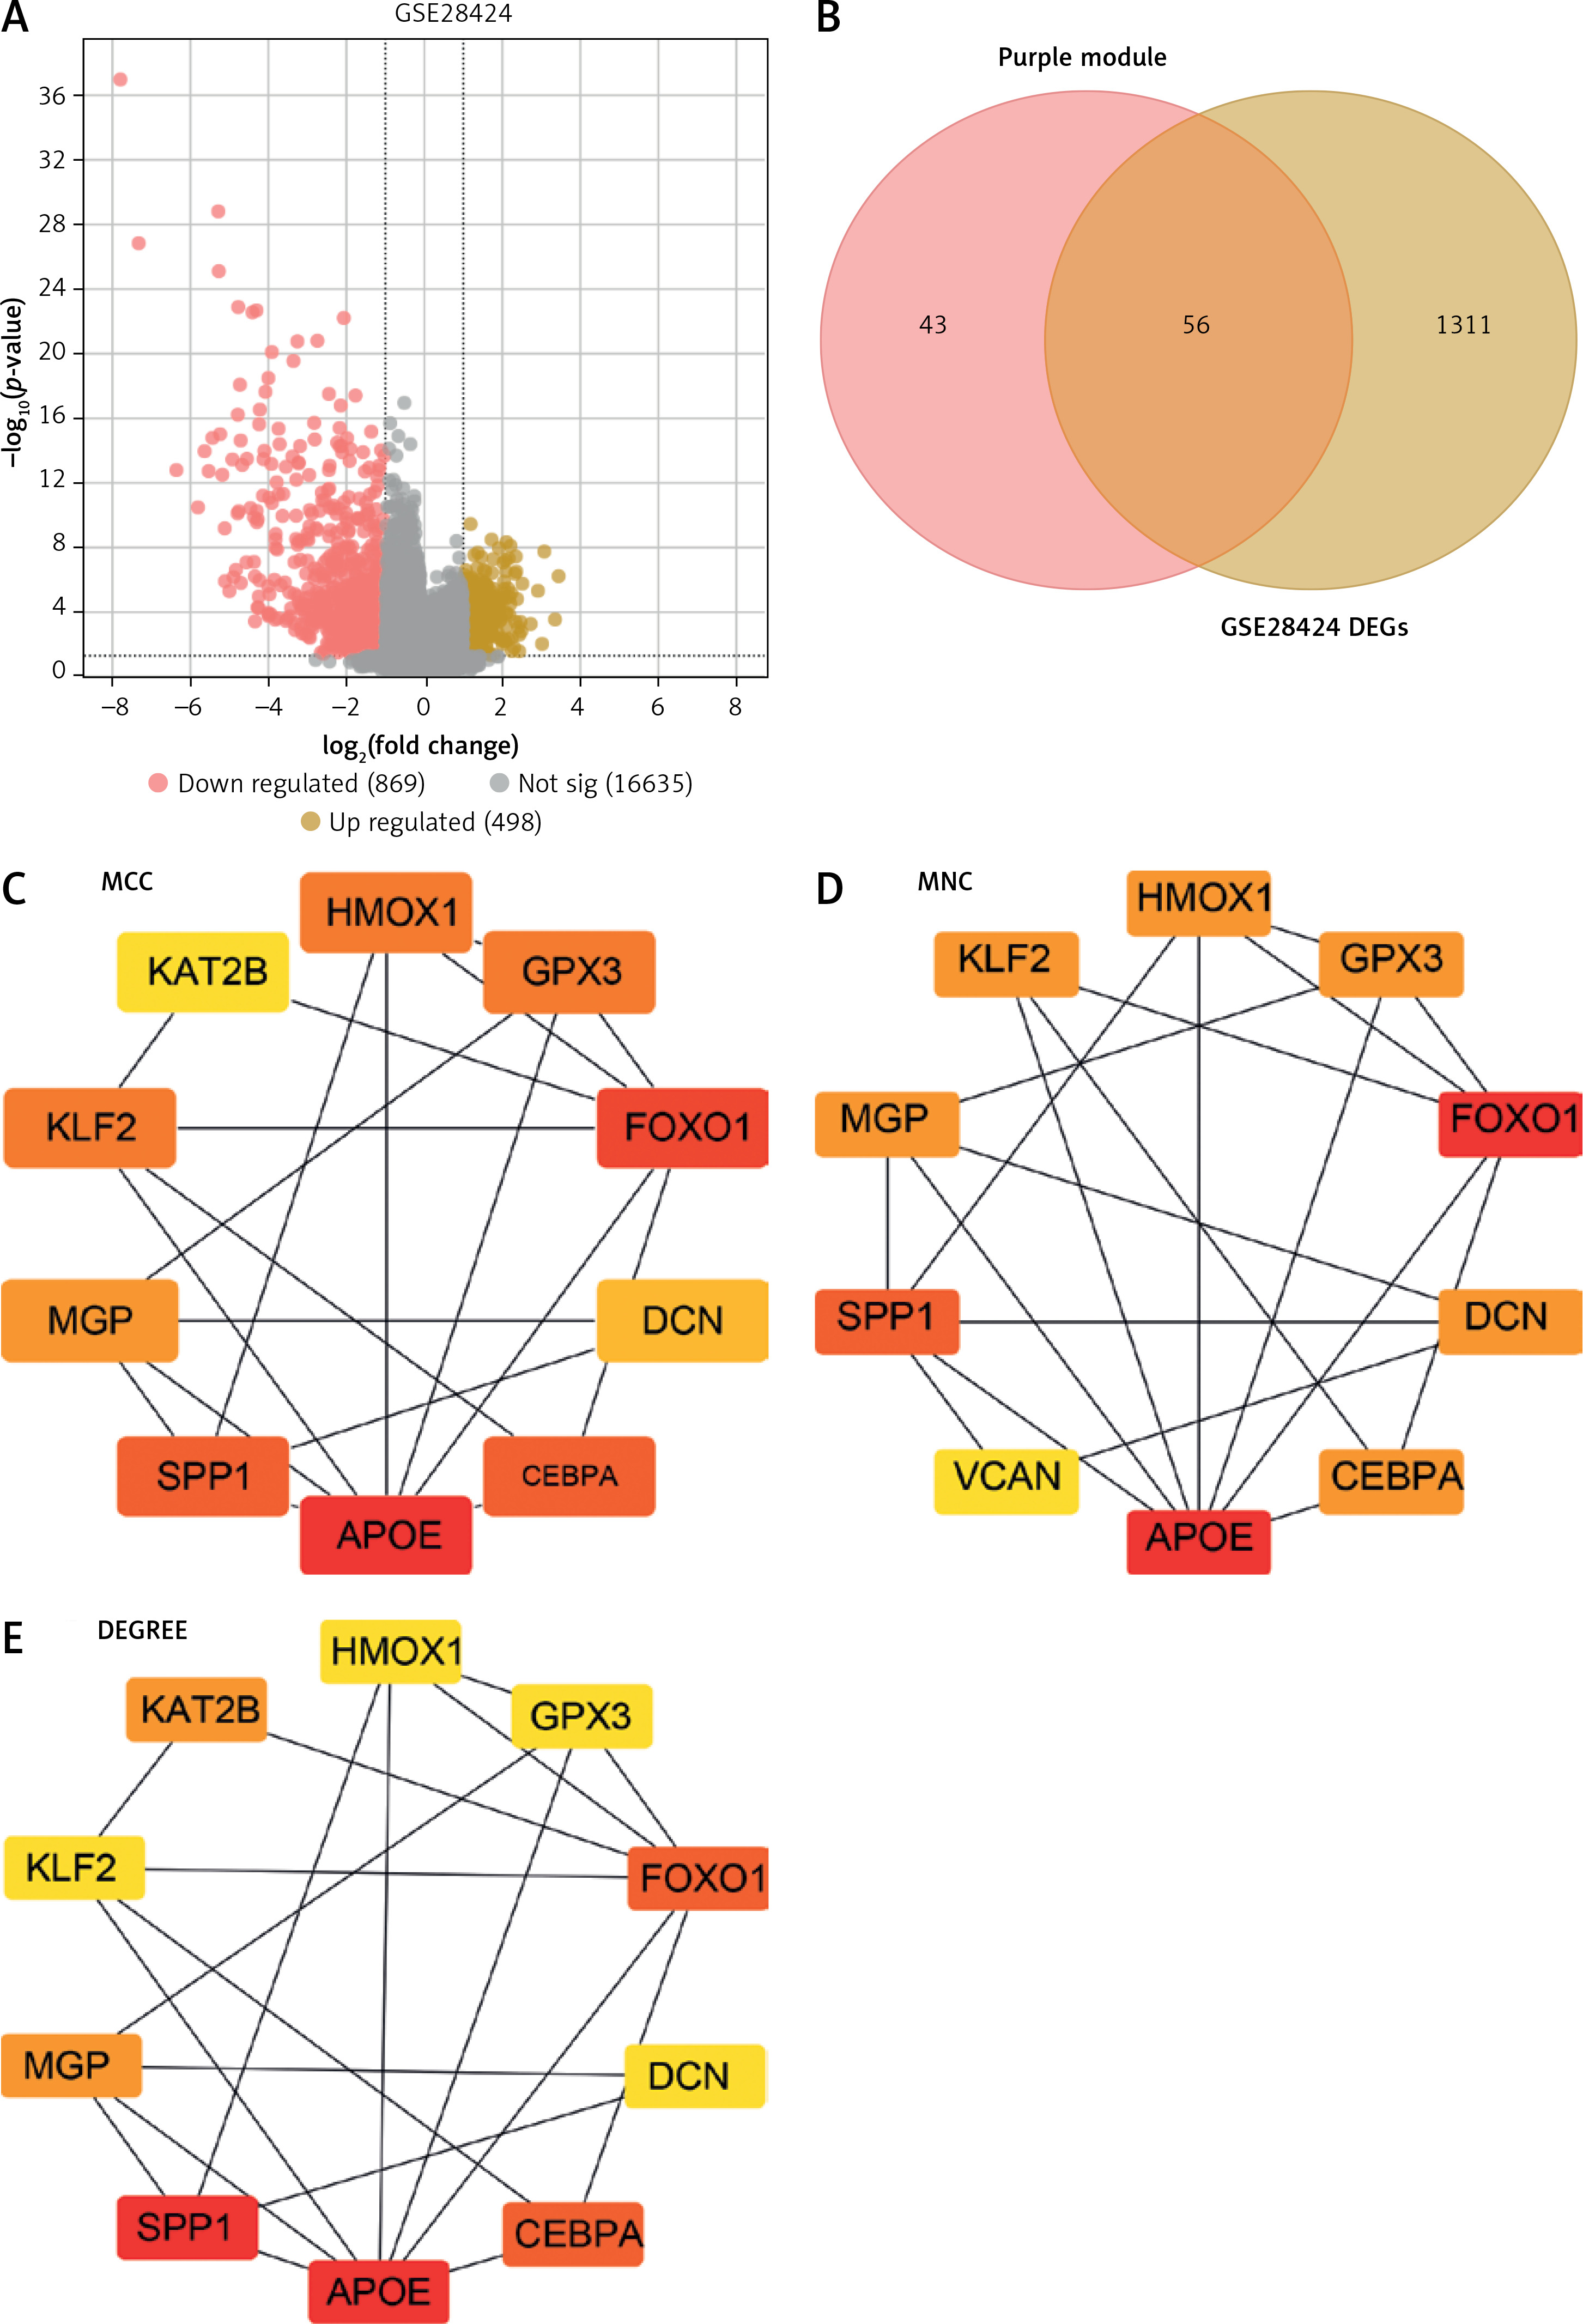
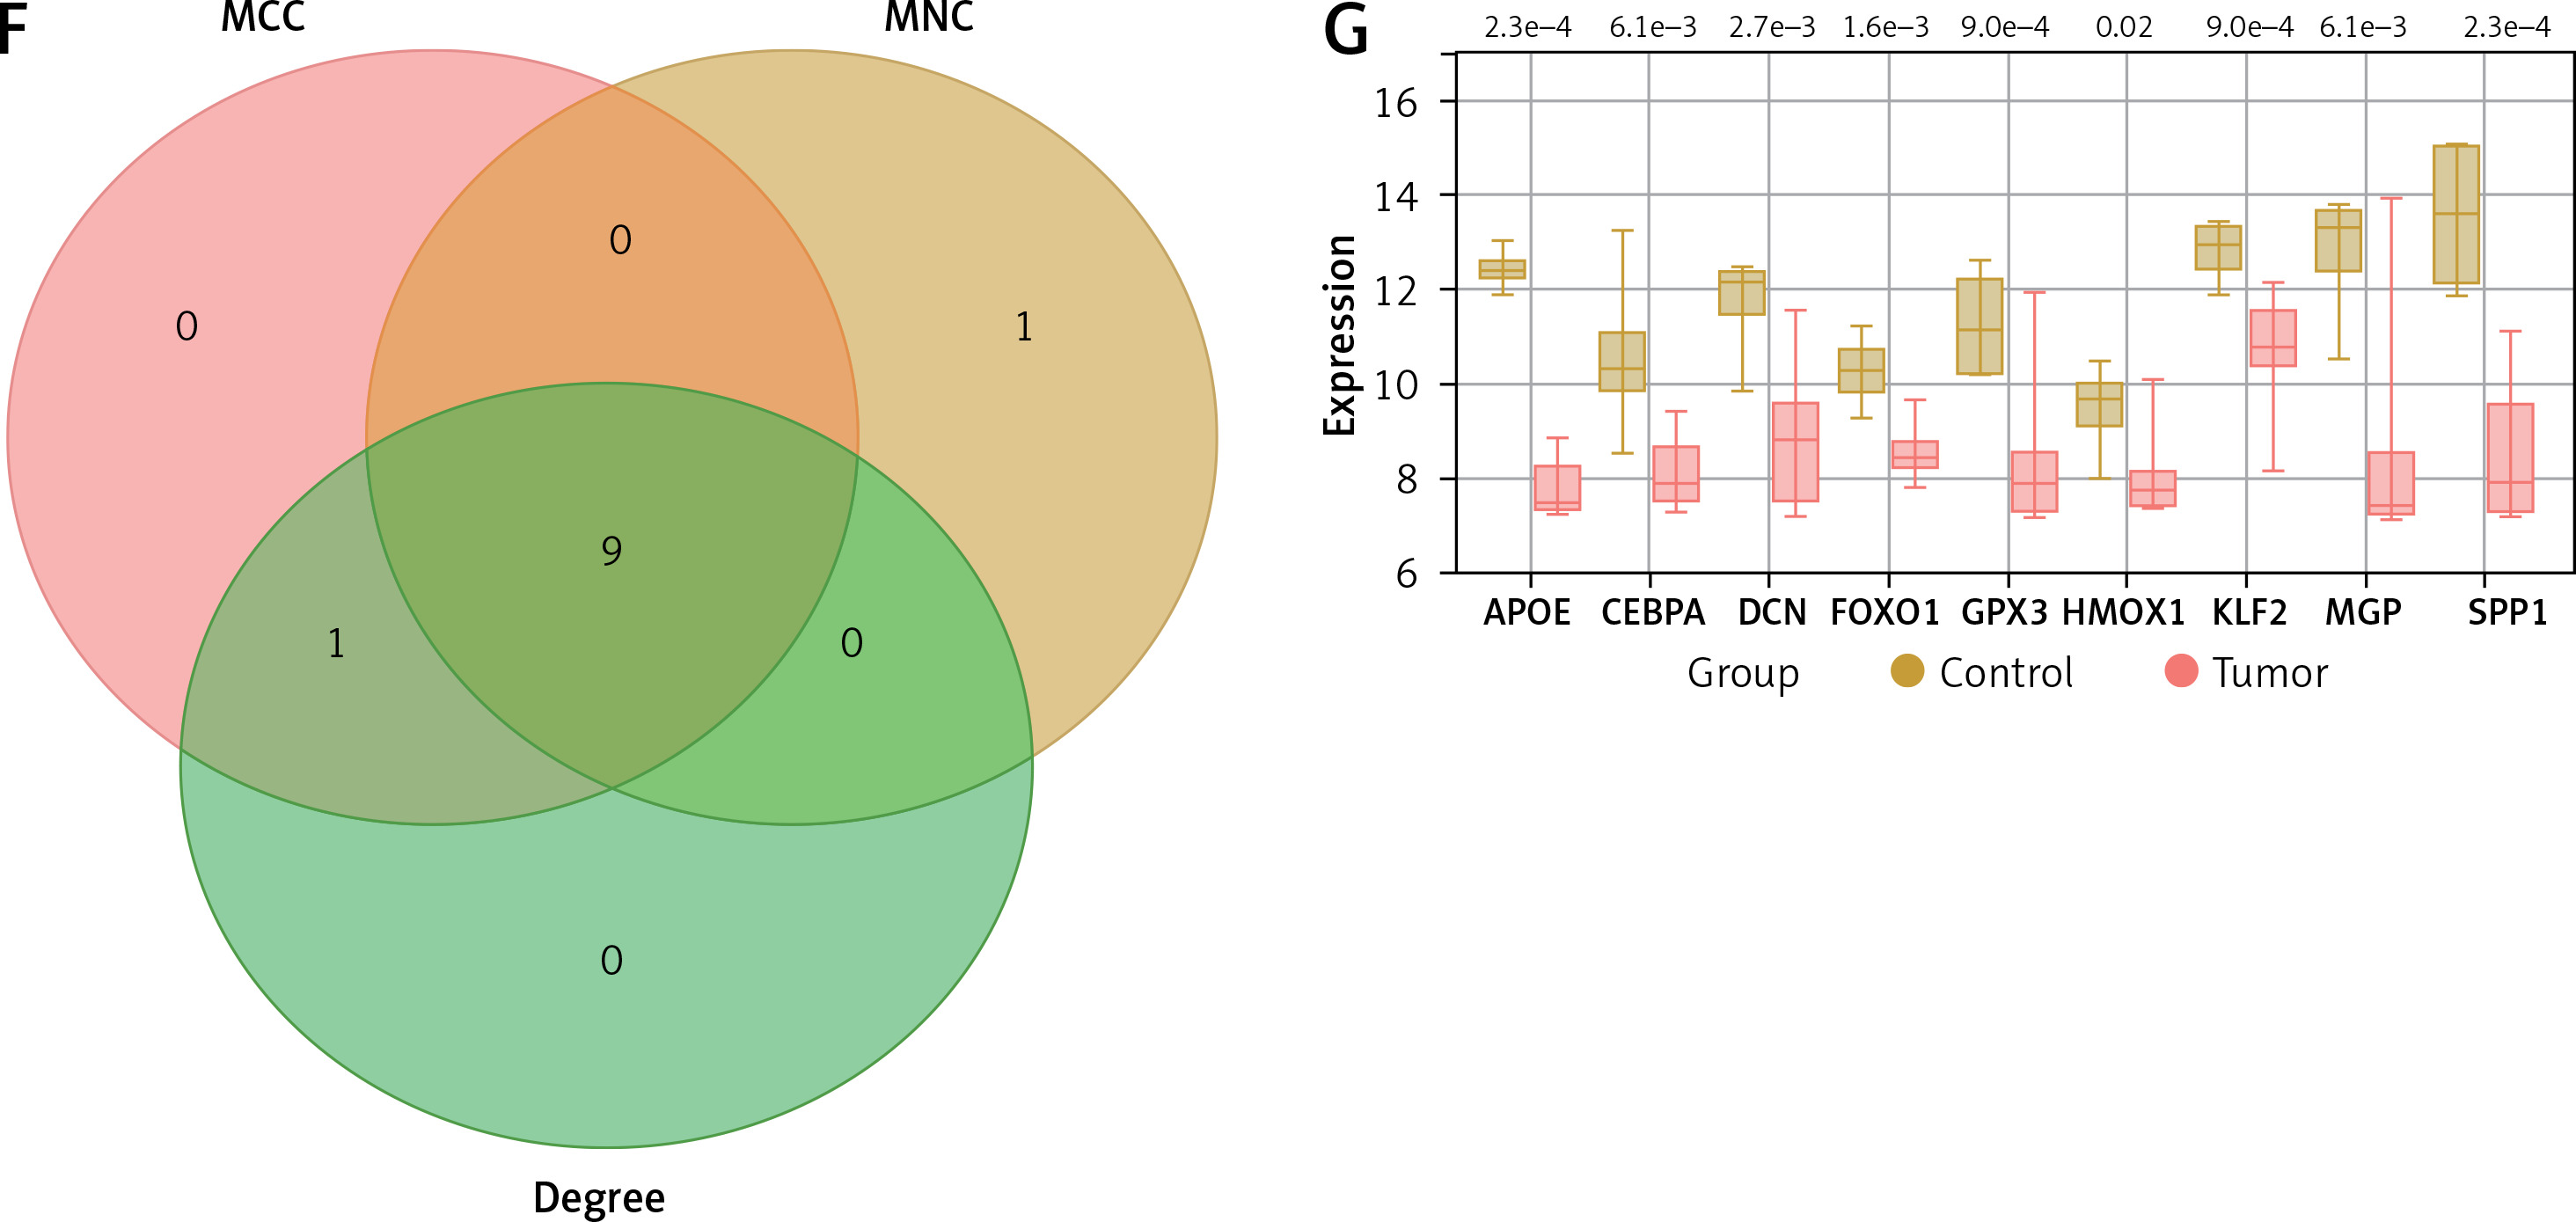
Differential expression analysis was performed on the GSE28424 dataset, resulting in the identification of 498 up-regulated and 869 down-regulated genes (Figure 2 A). From the purple module and DEGs in GSE28424, 56 intersection genes were identified (Figure 2 B). These intersection genes were analyzed by PPI network construction, and the top 10 genes based on MCC, MNC, and Degree algorithms were visualized using Cytoscape. In the MCC, MNC, and Degree networks, there are ten nodes and twenty edges each (Figures 2 C–E). After that, the top 10 genes of the three algorithms were analyzed again, and nine key intersection genes were obtained (Figure 2 F). The expression levels of these nine genes (APOE, CEBPA, DCN, FOXO1, GPX3, HMOX1, KLF2, MGP, and SPP1) were examined in the GSE28424 dataset, and it was found that all gene tumor case groups showed lower expression levels (Figure 2 G). Given the crucial role of APOE in lipid metabolism and its relatively limited exploration in the context of OS, APOE was chosen as the focus of this study.
Figure 2
Identification of key osteosarcoma (OS)-related genes and determination of hub gene. A – Volcano plot represents differentially expressed genes (DEGs) identified from GSE28424. Each point on the graph corresponds to a gene, with red representing down-regulated genes and yellow representing up-regulated genes. B – Venn diagram of intersection analysis of 1367 DEGs in the GSE28424 dataset and 99 purple module genes. The overlapping part in the middle is the intersection genes. C–E – Protein-protein interaction (PPI) network analysis of 56 intersection genes using maximum correlation criterion (MCC) (C), maximum neighborhood component (MNC) (D) and Degree (E) algorithms. Each dot represents the top ten genes of the algorithm, and each line represents the association between genes F – Venn diagram, the intersection region of three different network centers, MCC, MNC and Degree, showed nine intersection genes. G – Box plot of the expression of 9 intersection genes in the GSE28424 dataset in the control and tumor samples
Overexpression of APOE inhibits proliferation, migration, and invasion of OS cells
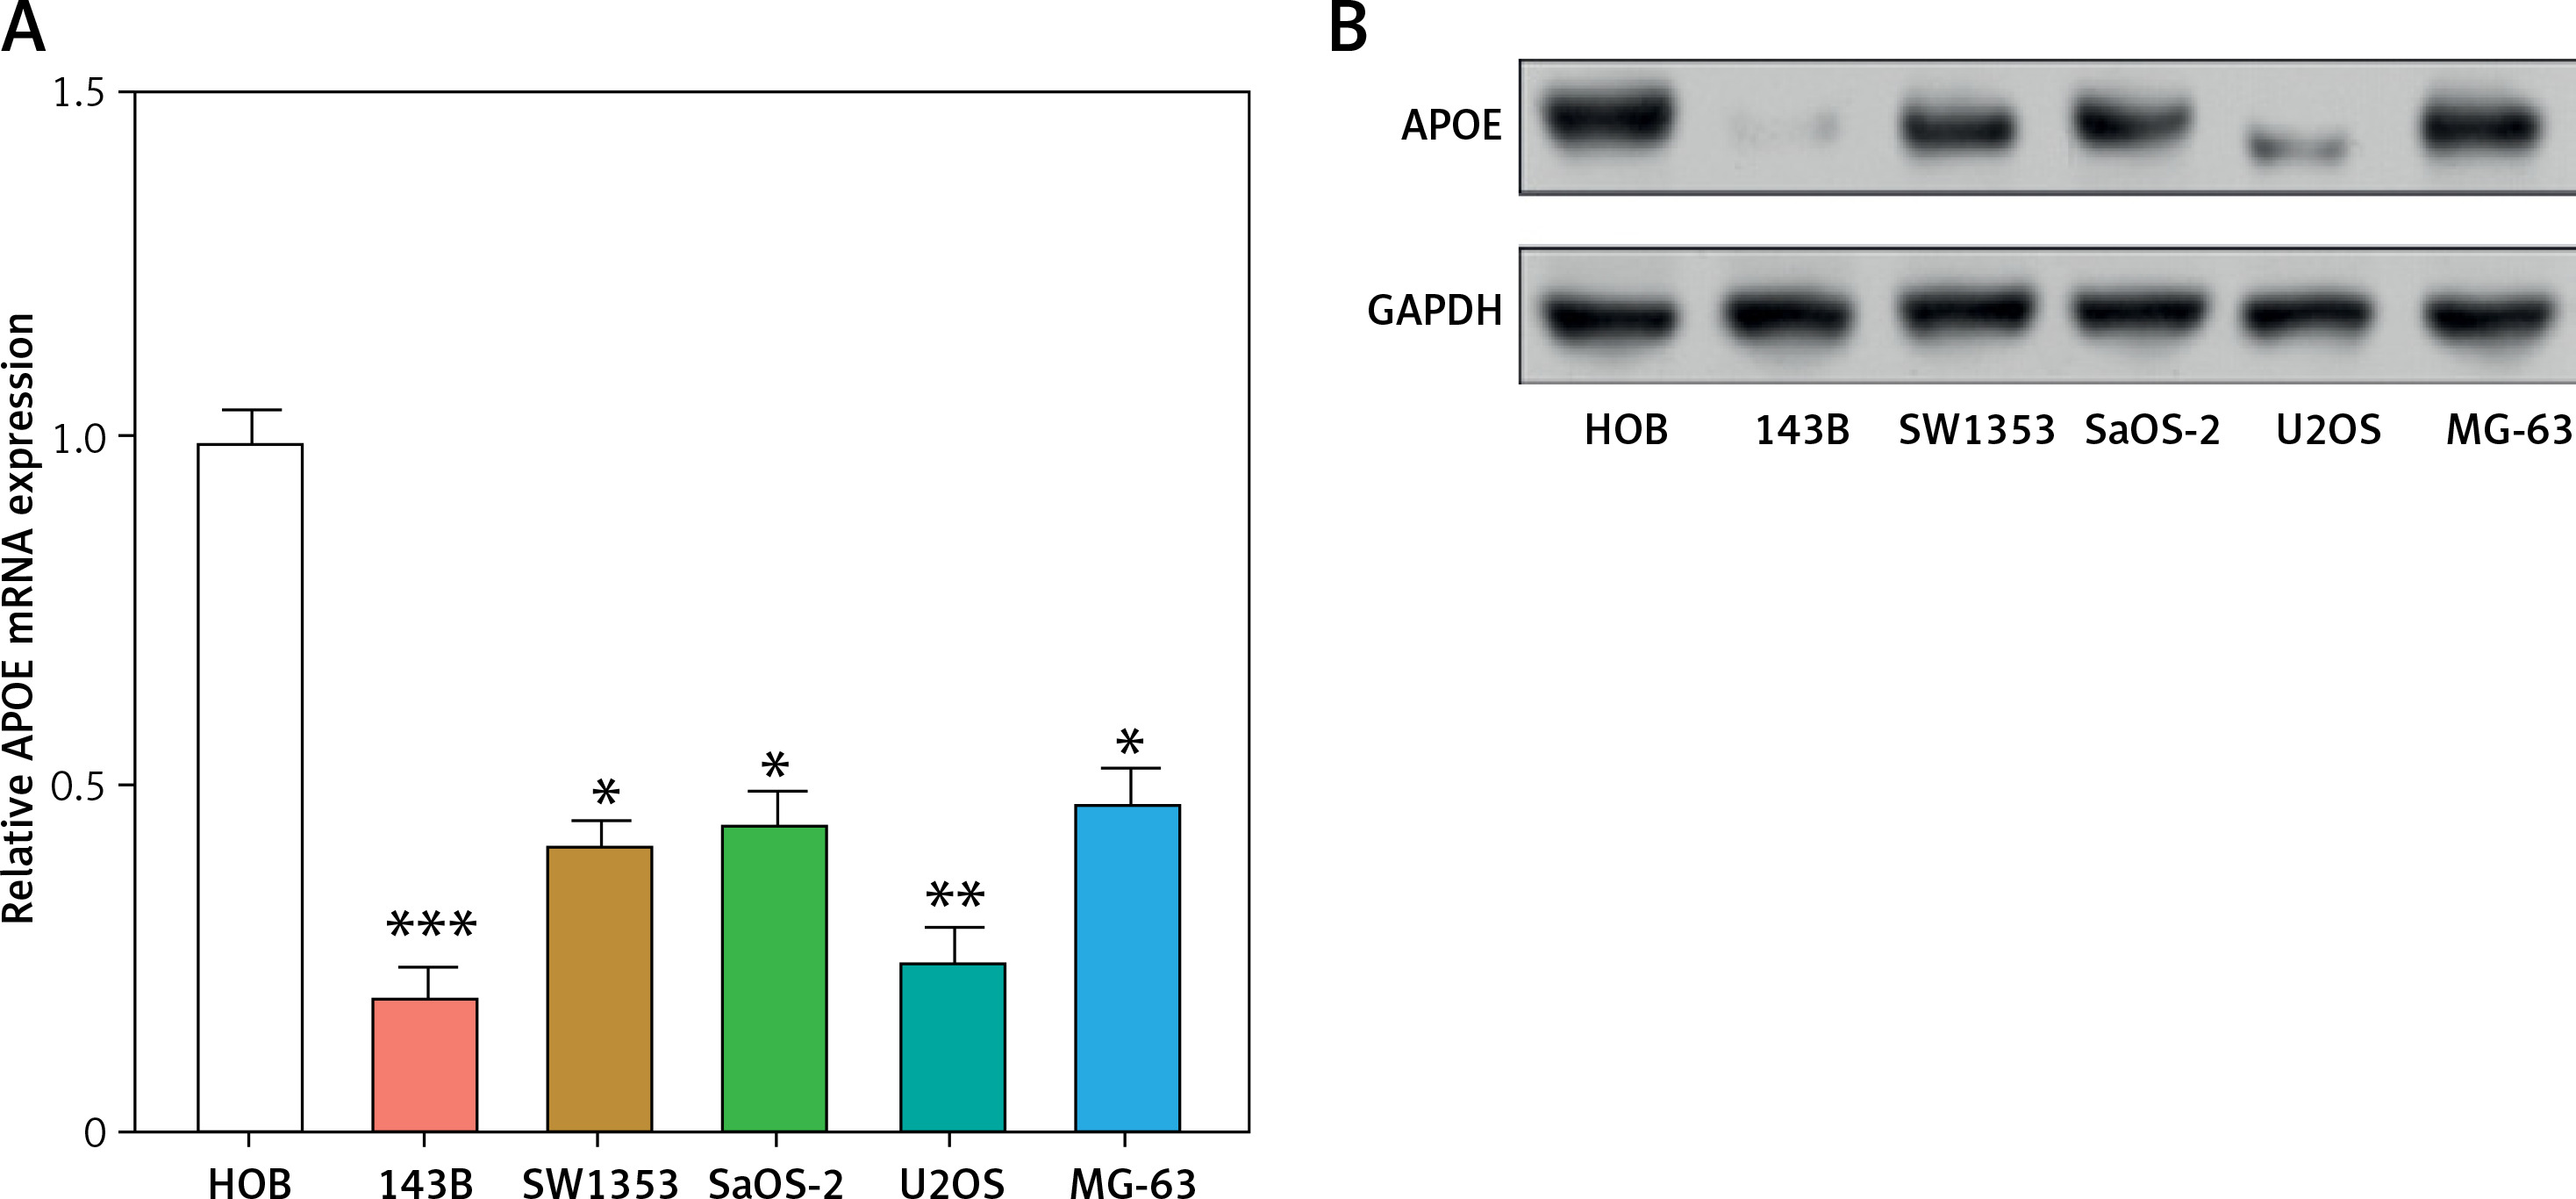
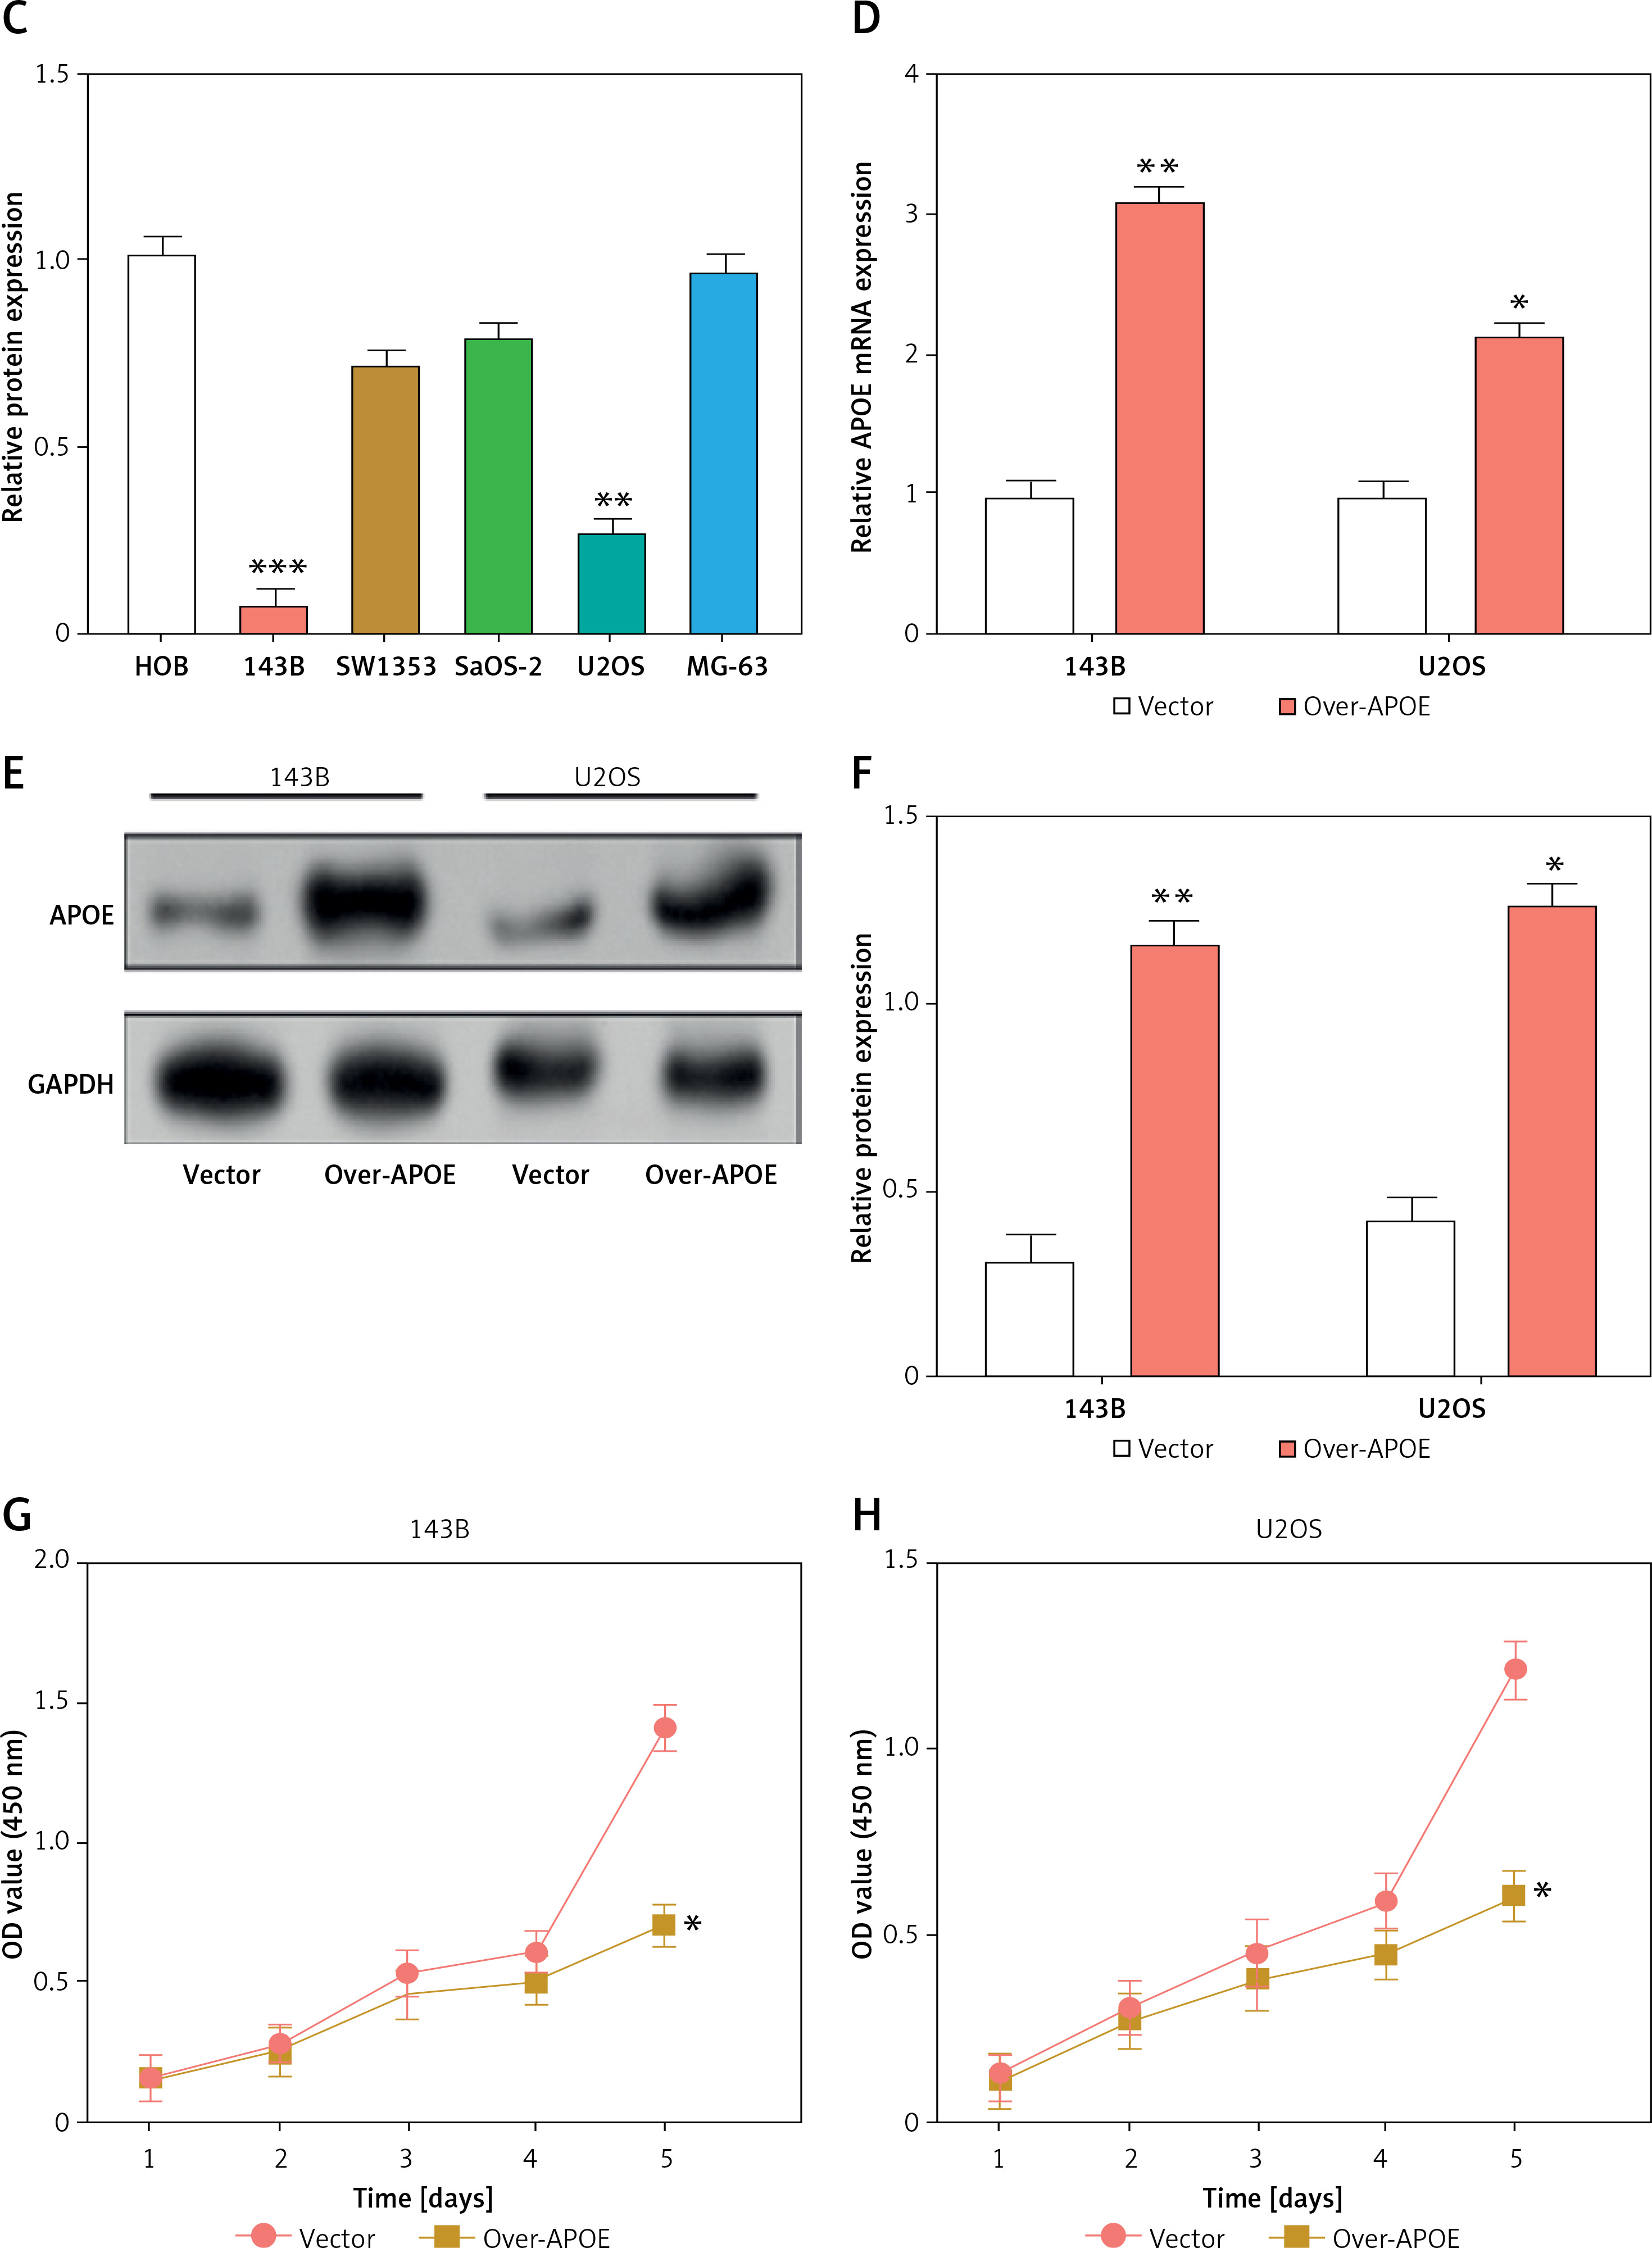
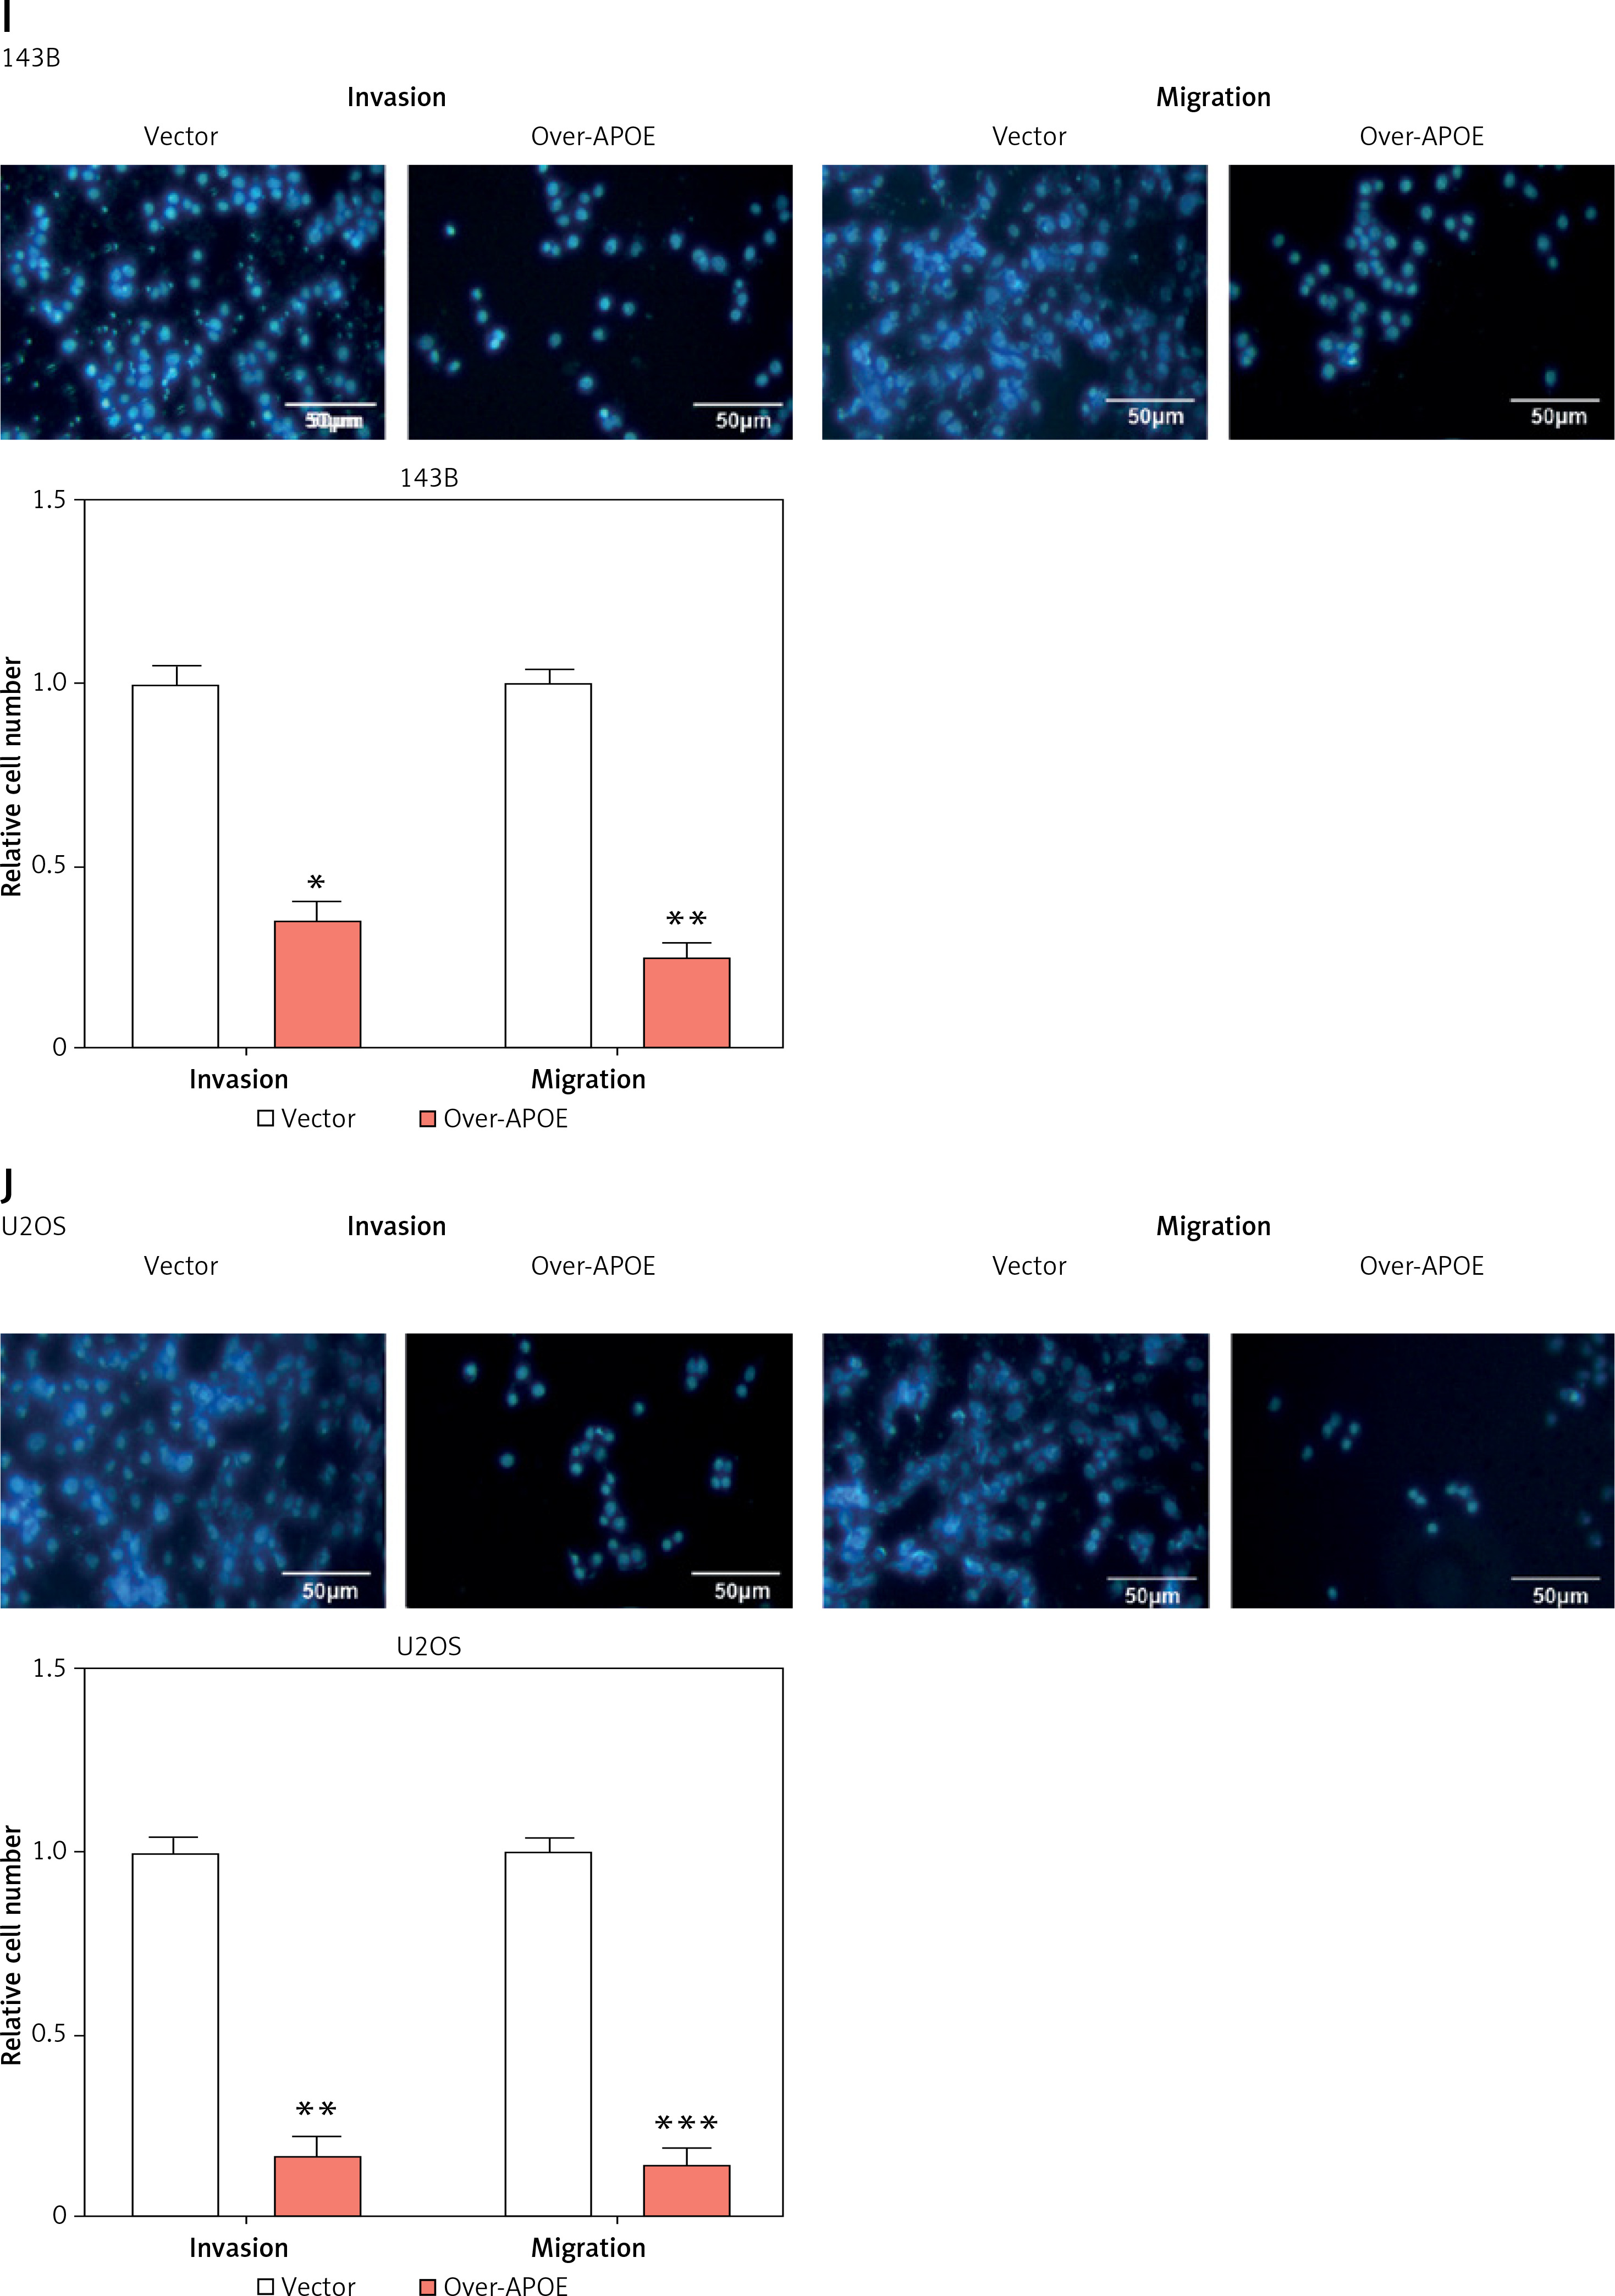
APOE mRNA and protein expression levels were evaluated across various osteosarcoma cell lines (143B, MG-63, SW1353, U2OS SaOS-2) and compared to normal osteoblastic cells (HOB). In comparison to HOB cells, OS cell lines have greatly reduced APOE mRNA and protein levels, as shown in Figures 3 A–C. After transfecting U2OS and 143B cells with an APOE overexpression vector, a notable increase in APOE expression was detected at the levels of both mRNA and protein (Figures 3 D–F). Afterward, CCK-8 was employed to assess the proliferation of OS cells after APOE overexpression. The findings demonstrated that in contrast to the control group, APOE overexpression significantly inhibited OS cell proliferation (Figures 3 G, H). Transwell assay was utilized to identify the effect of APOE on OS cell invasion and migration. By drastically reducing the quantity of OS cells stained with DAPI in comparison to the control group, APOE overexpression was found to considerably impede the ability of OS cells to invade and migrate (Figures 3 I, J).
Figure 3
Overexpression of APOE inhibits proliferation, migration and invasion in osteosarcoma (OS) cells. A – quantitative real-time reverse transcription PCR (qRT-PCR detection of APOE mRNA expression in 143B, SW1353, MG-63, SaOS-2, U2OS and HOB cells. B – WB detection of APOE protein expression in 143B, SW1353, MG-63, SaOS-2, U2OS and HOB cells. C – Quantitative analysis of APOE protein. D – qRT-PCR detection of APOE overexpression efficiency in 143B and U2OS cell lines. E – Western blot (WB) detection of APOE overexpression efficiency in 143B and U2OS cell lines. F – Quantitative analysis of APOE protein. G, H – Cell Counting Kit-8 (CCK-8) detects the cell proliferation of 143B (G) and U2OS (H) on days 0-5 after overexpressing APOE. I, J – Transwell detection of the invasion and migration abilities of 143B (I) and U2OS (J) after APOE overexpression. Scale bar: 50 μm. *p < 0.05, **p < 0.01, ***p < 0.001
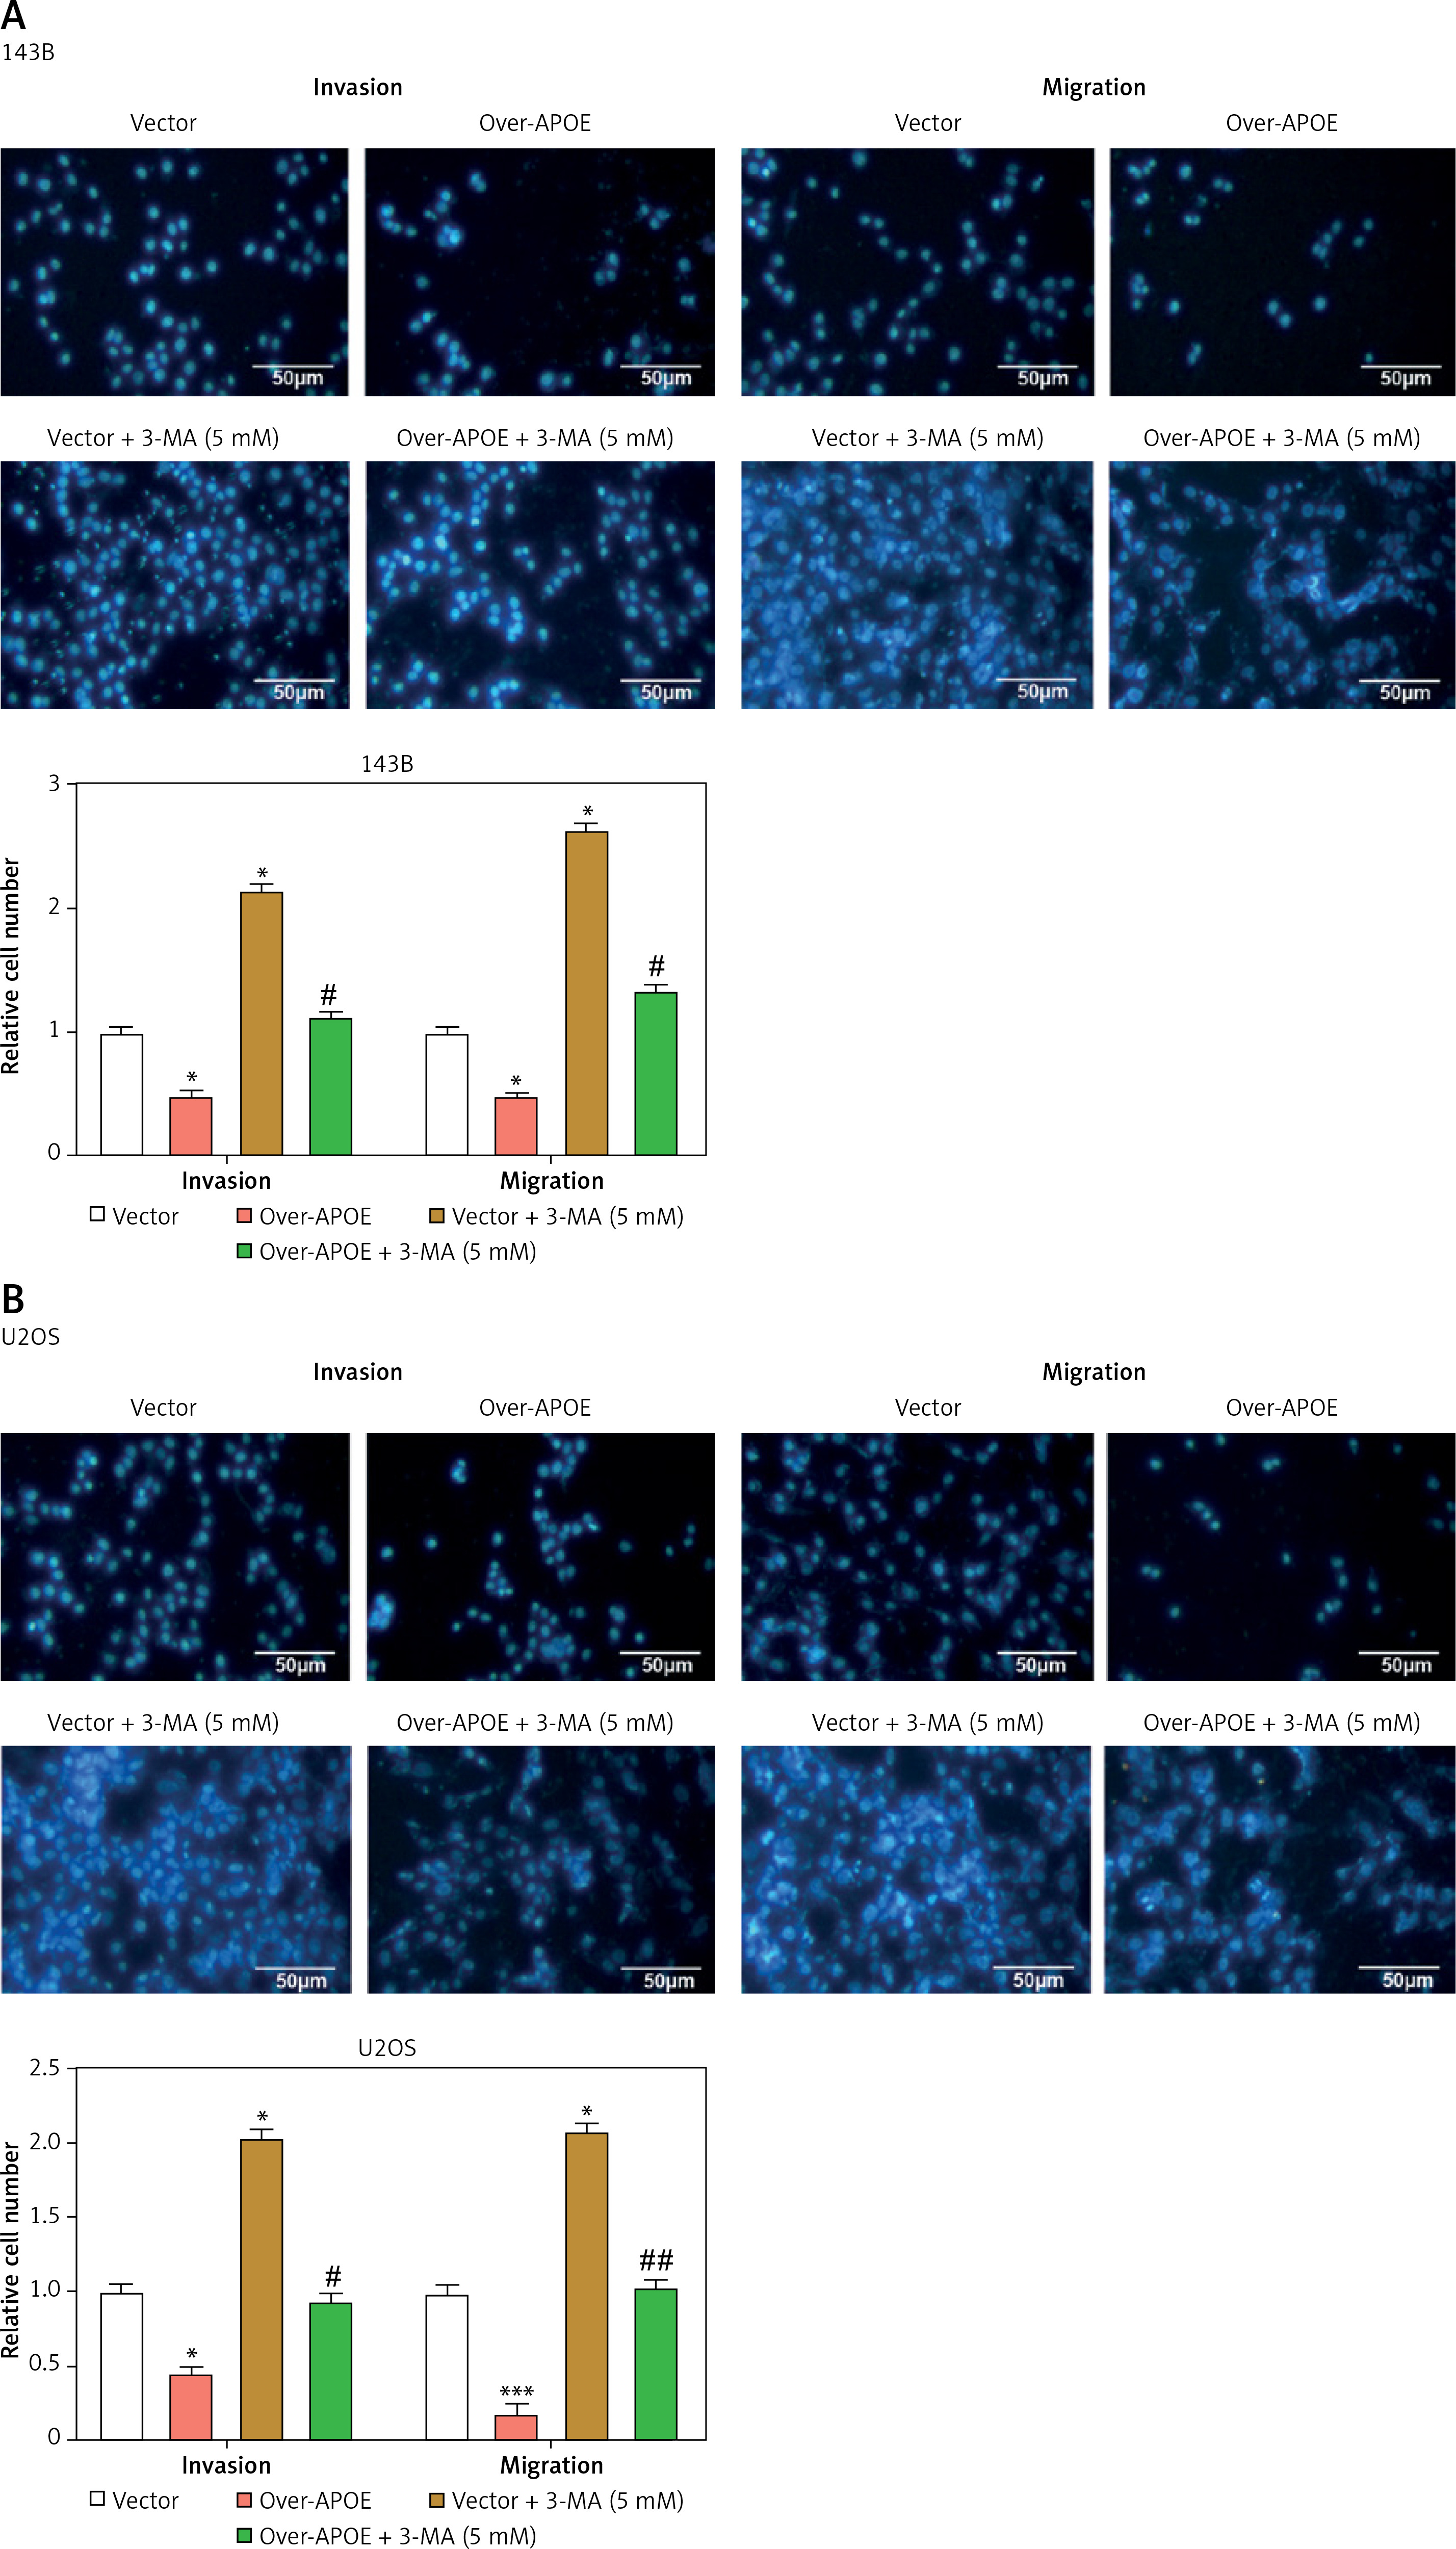
APOE overexpression inhibits OS cell invasion and migration, with effects reversed by autophagy inhibition
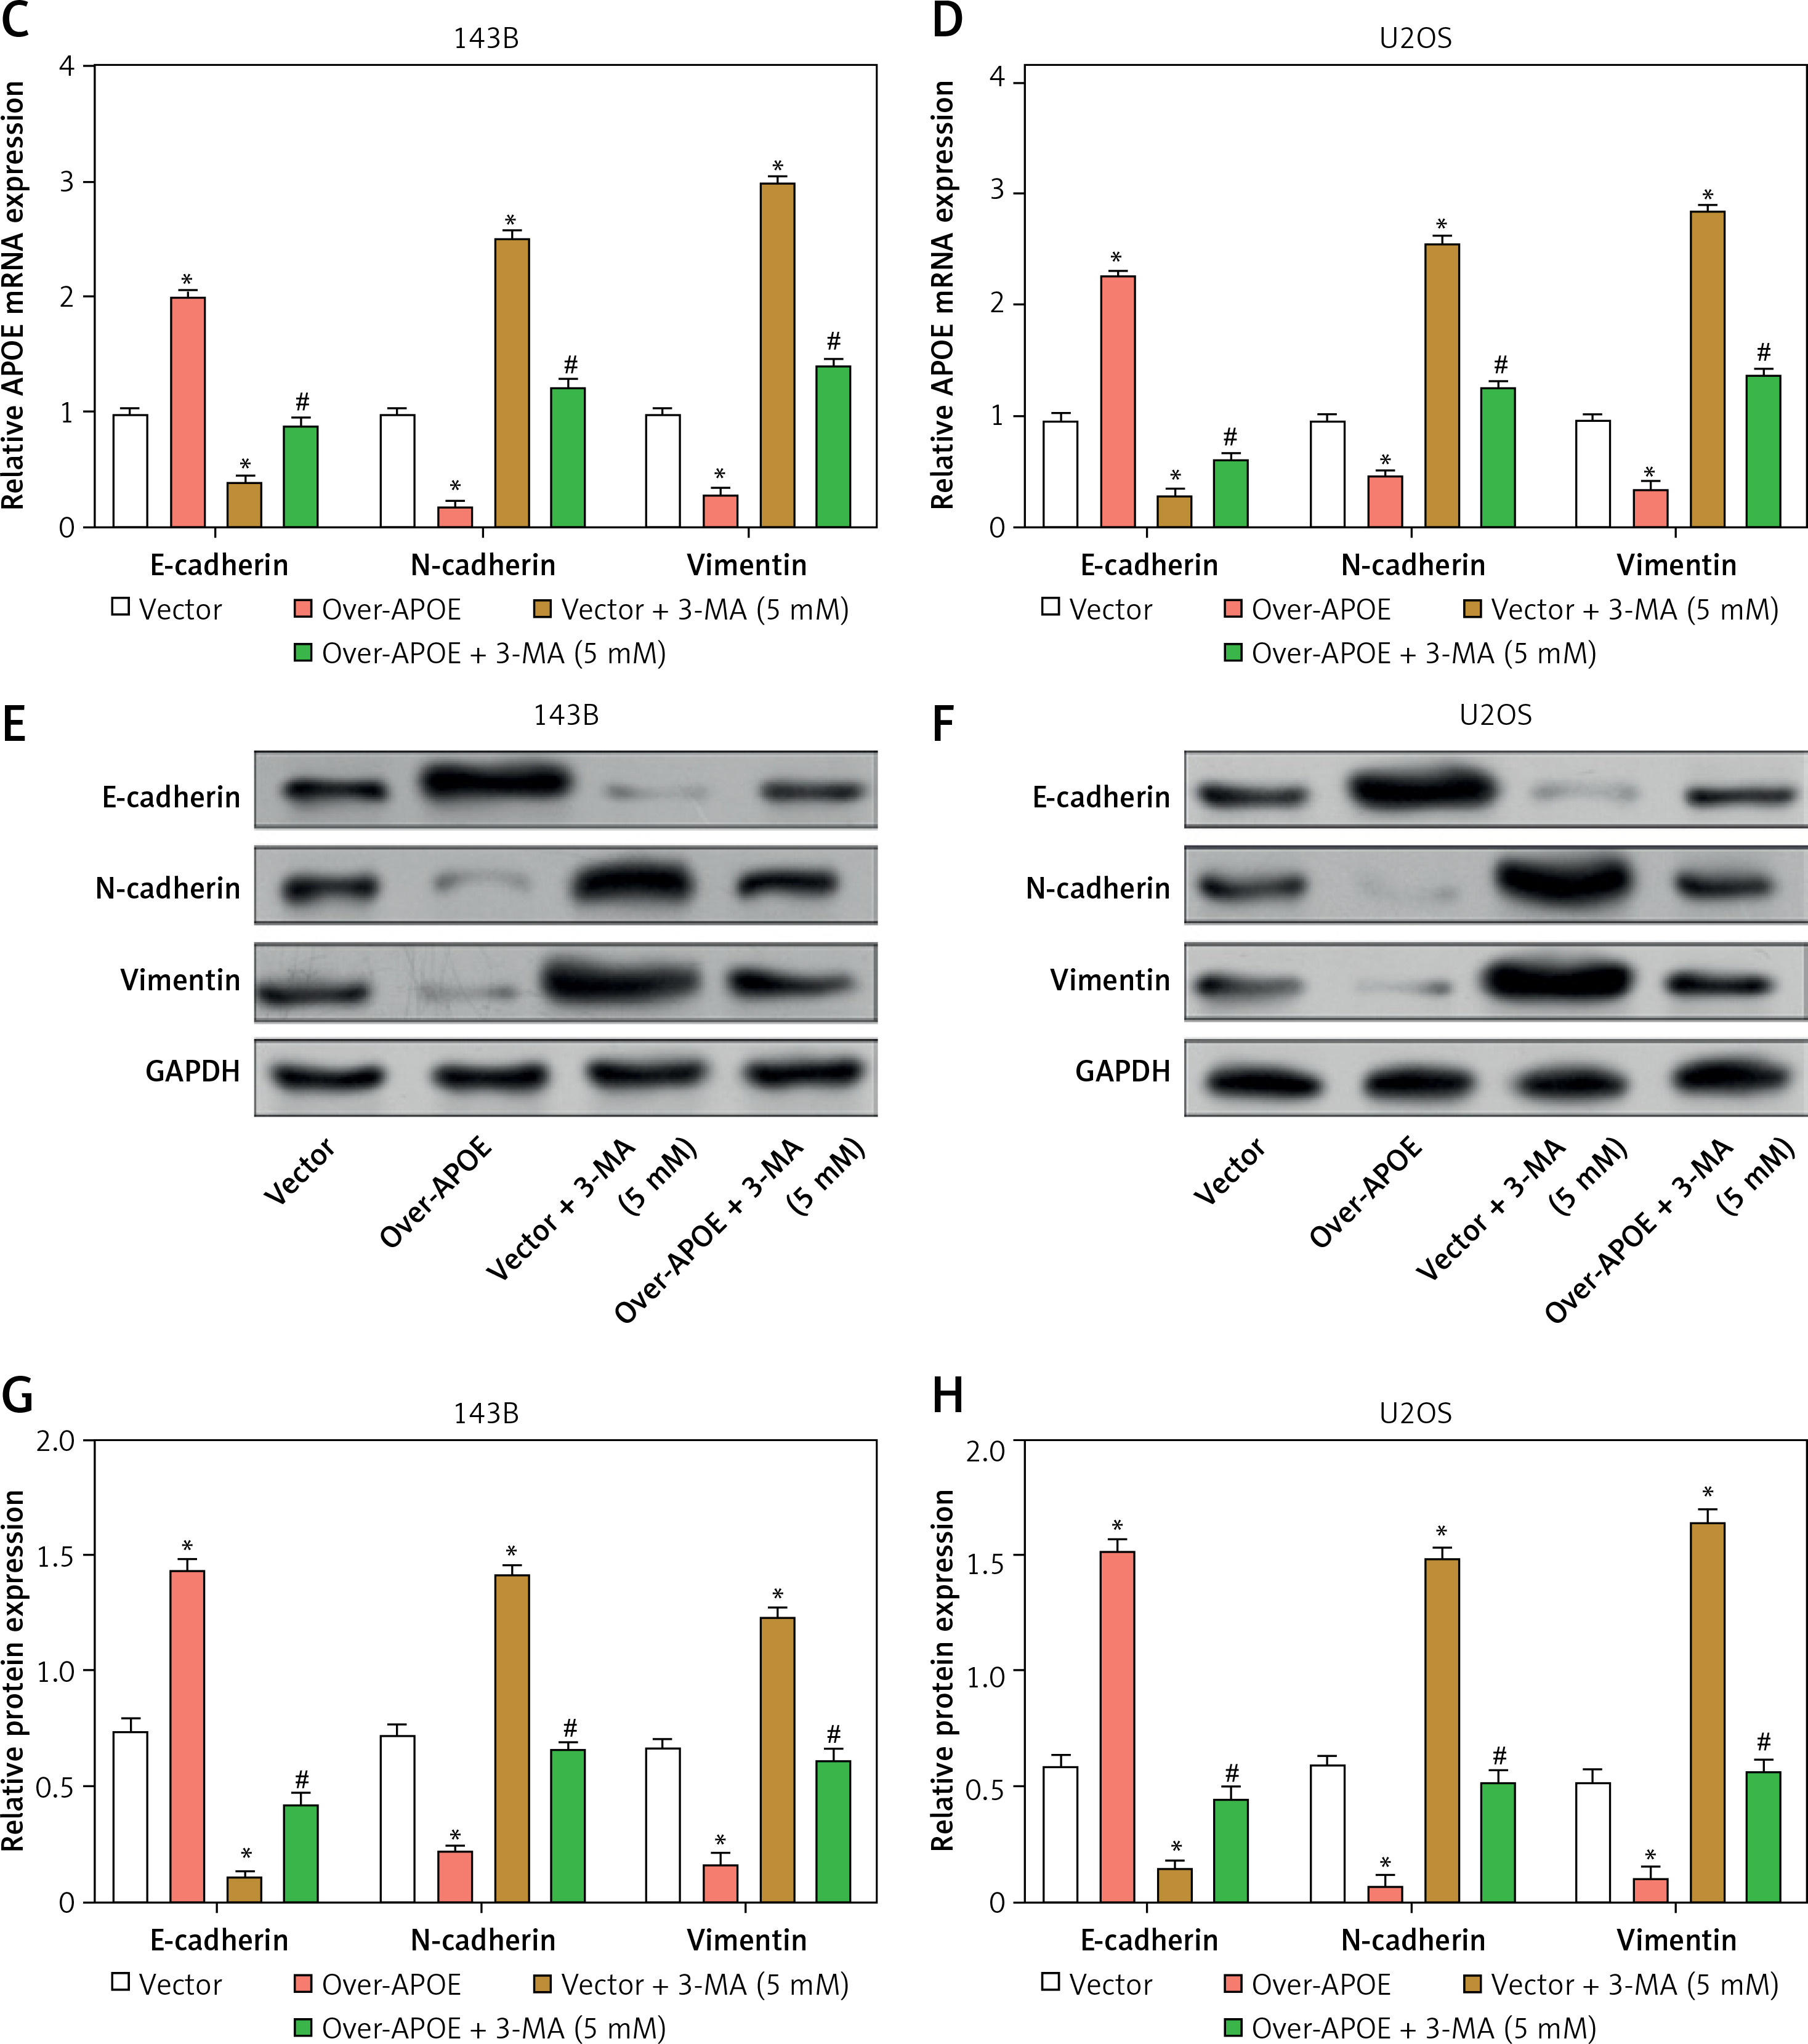
Transfected 143B and U2OS cells were subjected to a 24-hour autophagy inhibitor (3-MA) treatment and then subjected to a Transwell assay. The findings demonstrated that in contrast to the Vector group, APOE overexpression inhibited the invasion and migration of OS cells, while 3-MA treatment enhanced the migration and invasion of OS cells. APOE overexpression combined with 3-MA treatment can weaken the inhibitory impact of overexpression of APOE on the metastatic ability of OS cells (Figures 4 A, B). Next, qRT-PCR was employed to detect EMT-related markers (N-cadherin, E-cadherin, and vimentin) expression in OS cells after overexpression of APOE and combined with 3-MA treatment (Figures 4 C, D). As contrasted to the Vector group, the results indicated that the levels of vimentin and N-cadherin in cells overexpressing APOE were significantly reduced, and the level of E-cadherin was markedly elevated. The reverse was observed when EMT-related markers were detected in cells treated with 3-MA. The metastatic potential of OS cells overexpressing APOE to spread might be considerably inhibited by 3-MA treatment. Consistent results were also detected at the protein level (Figures 4 E–H). These outcomes suggest that APOE overexpression inhibits OS cell invasion and migration by regulating EMT, and this effect can be reversed by inhibiting autophagy.
Figure 4
APOE overexpression affects migration and invasion of OS cells mediated by autophagy. A, B – Transwell assay for invasion and migration of 143B (A) and U2OS (B) cells, including Vector, over-APOE, Vector + 3-MA and over-APOE + 3-MA groups. Scale bar: 50 μm C, D – qRT-PCR detection of E-cadherin, N-cadherin and Vimentin mRNA expression in 143B (C) and U2OS (D) cells, including Vector, over-APOE, Vector + 3-MA and over-APOE + 3-MA groups. E, F – WB detection of E-cadherin, N-cadherin and Vimentin protein expression in 143B (E) and U2OS (F) cells, including Vector, over-APOE, Vector + 3-MA and over-APOE + 3-MA groups. G, H – Quantitative analysis of E-cadherin, N-cadherin and Vimentin. *p < 0.05, **p < 0.01 vs. Vector, #p < 0.05, ##p < 0.01 vs. Over-APOE
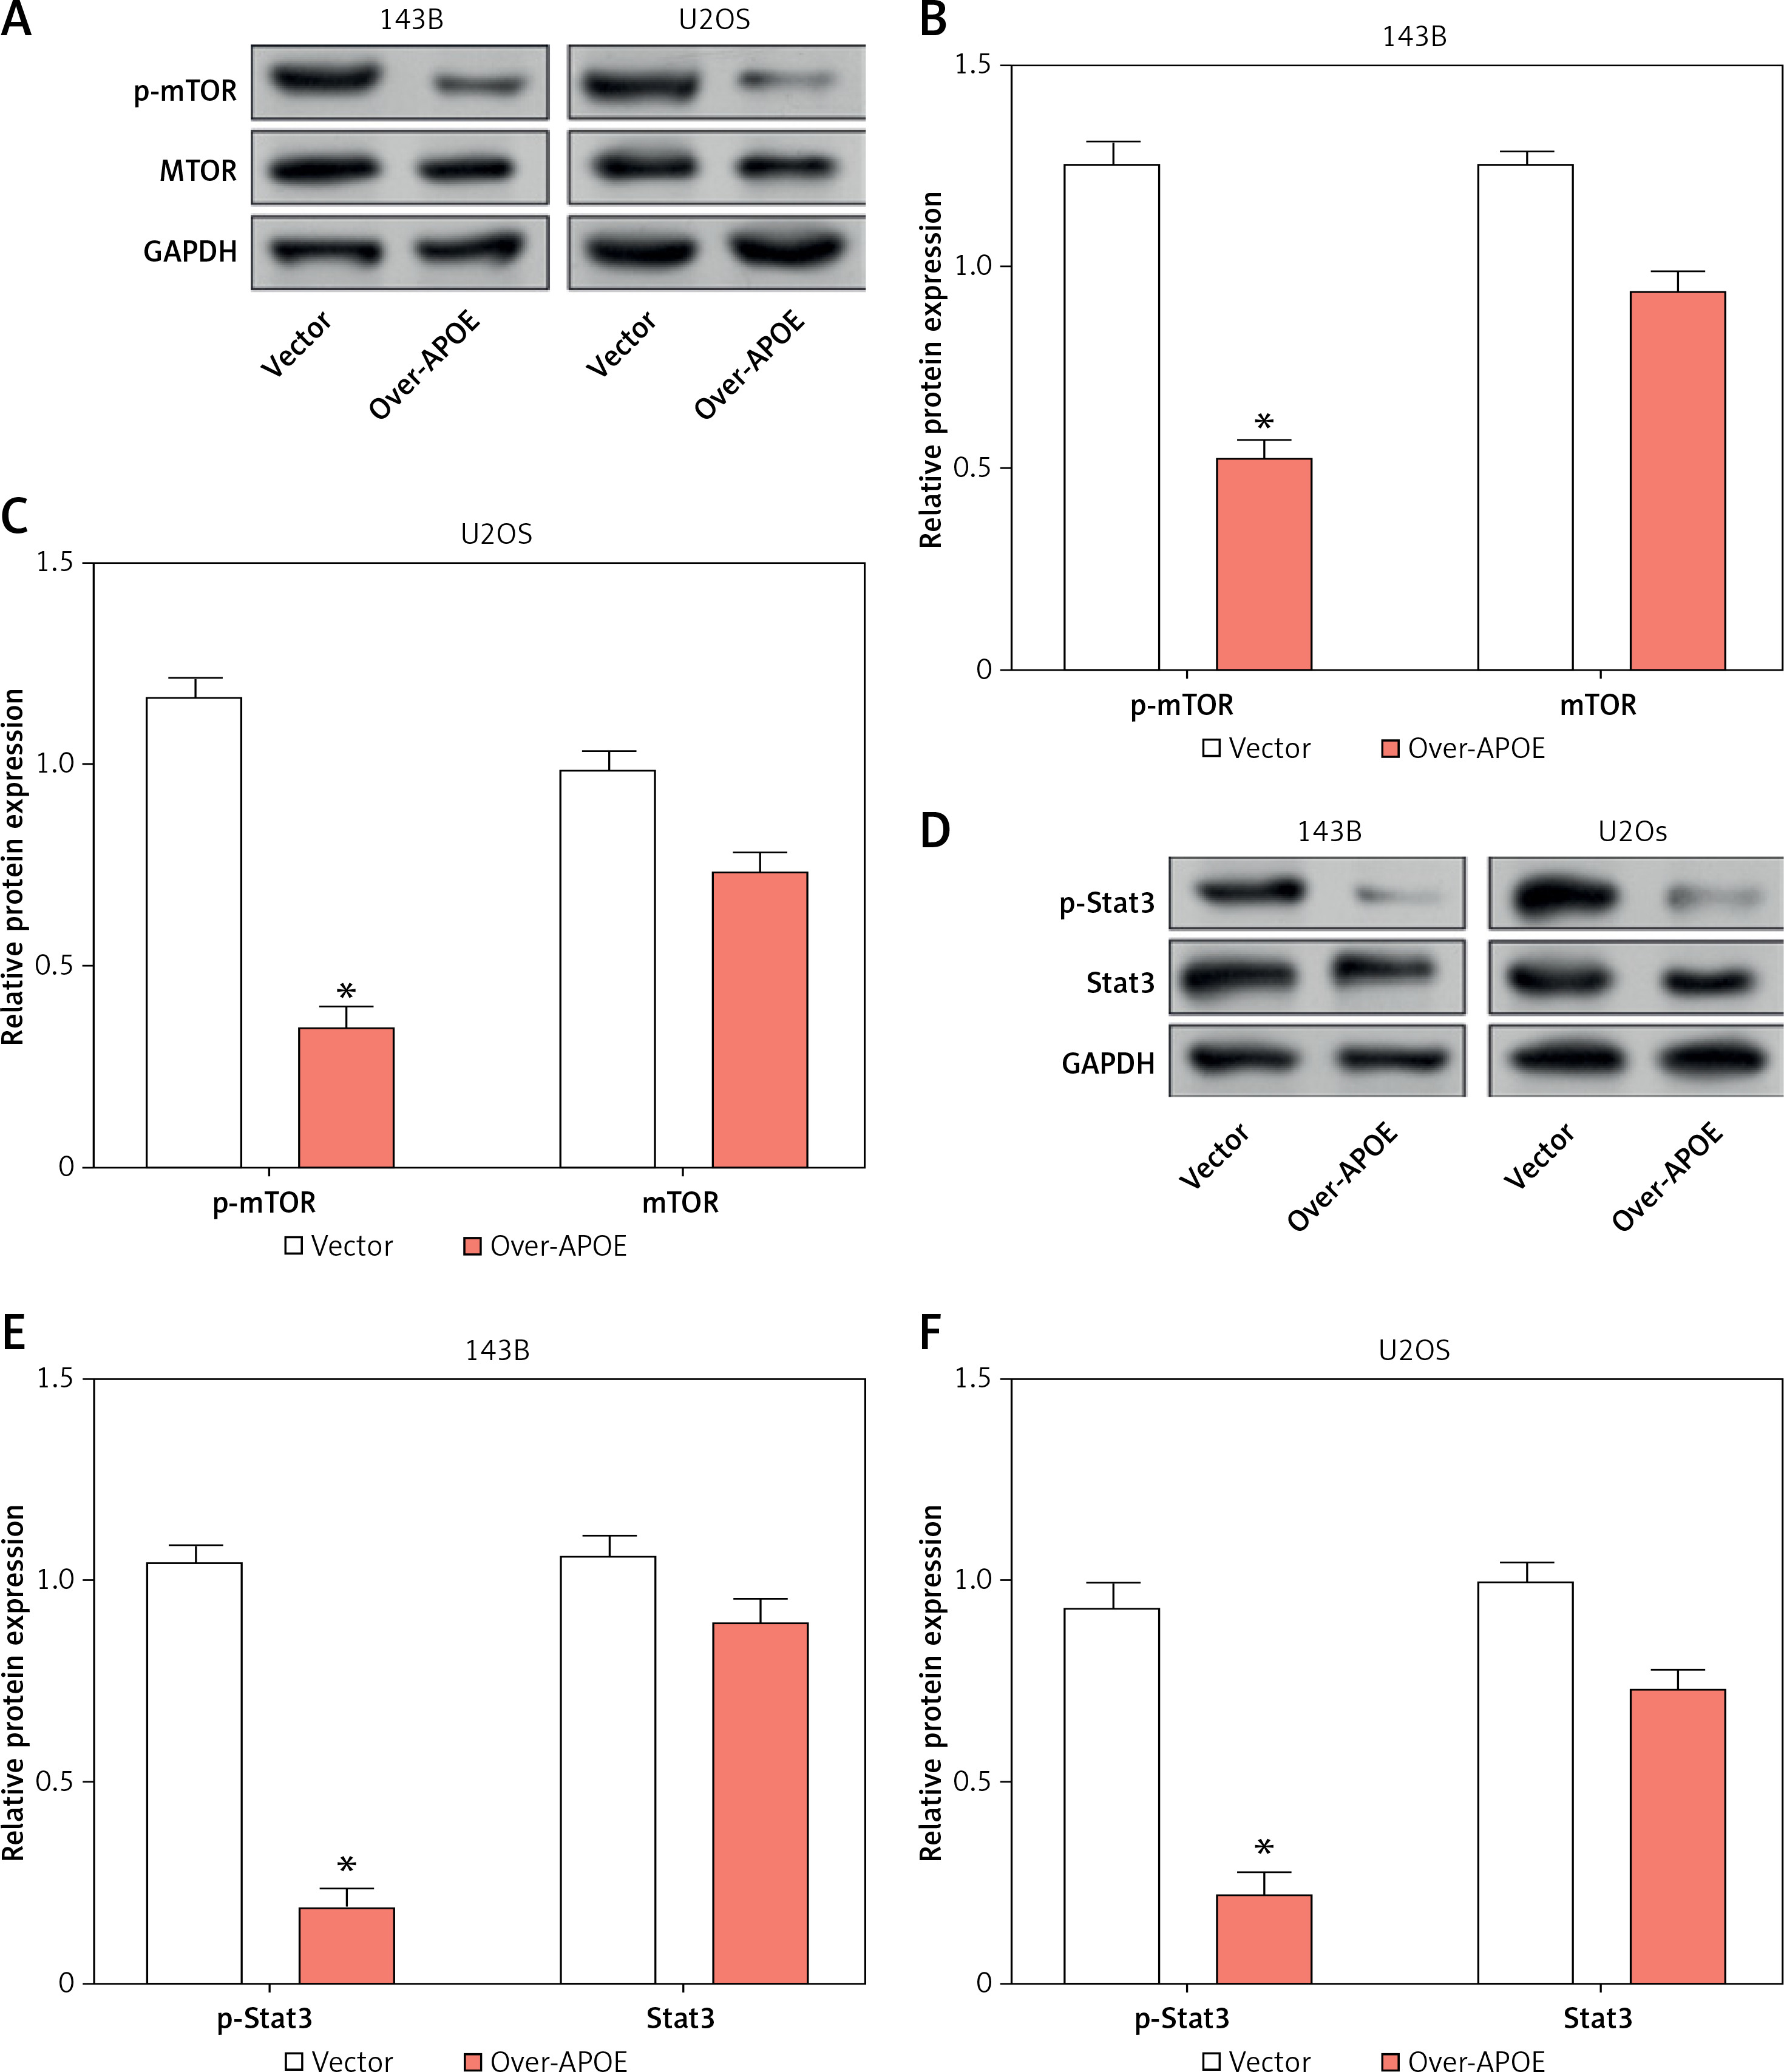
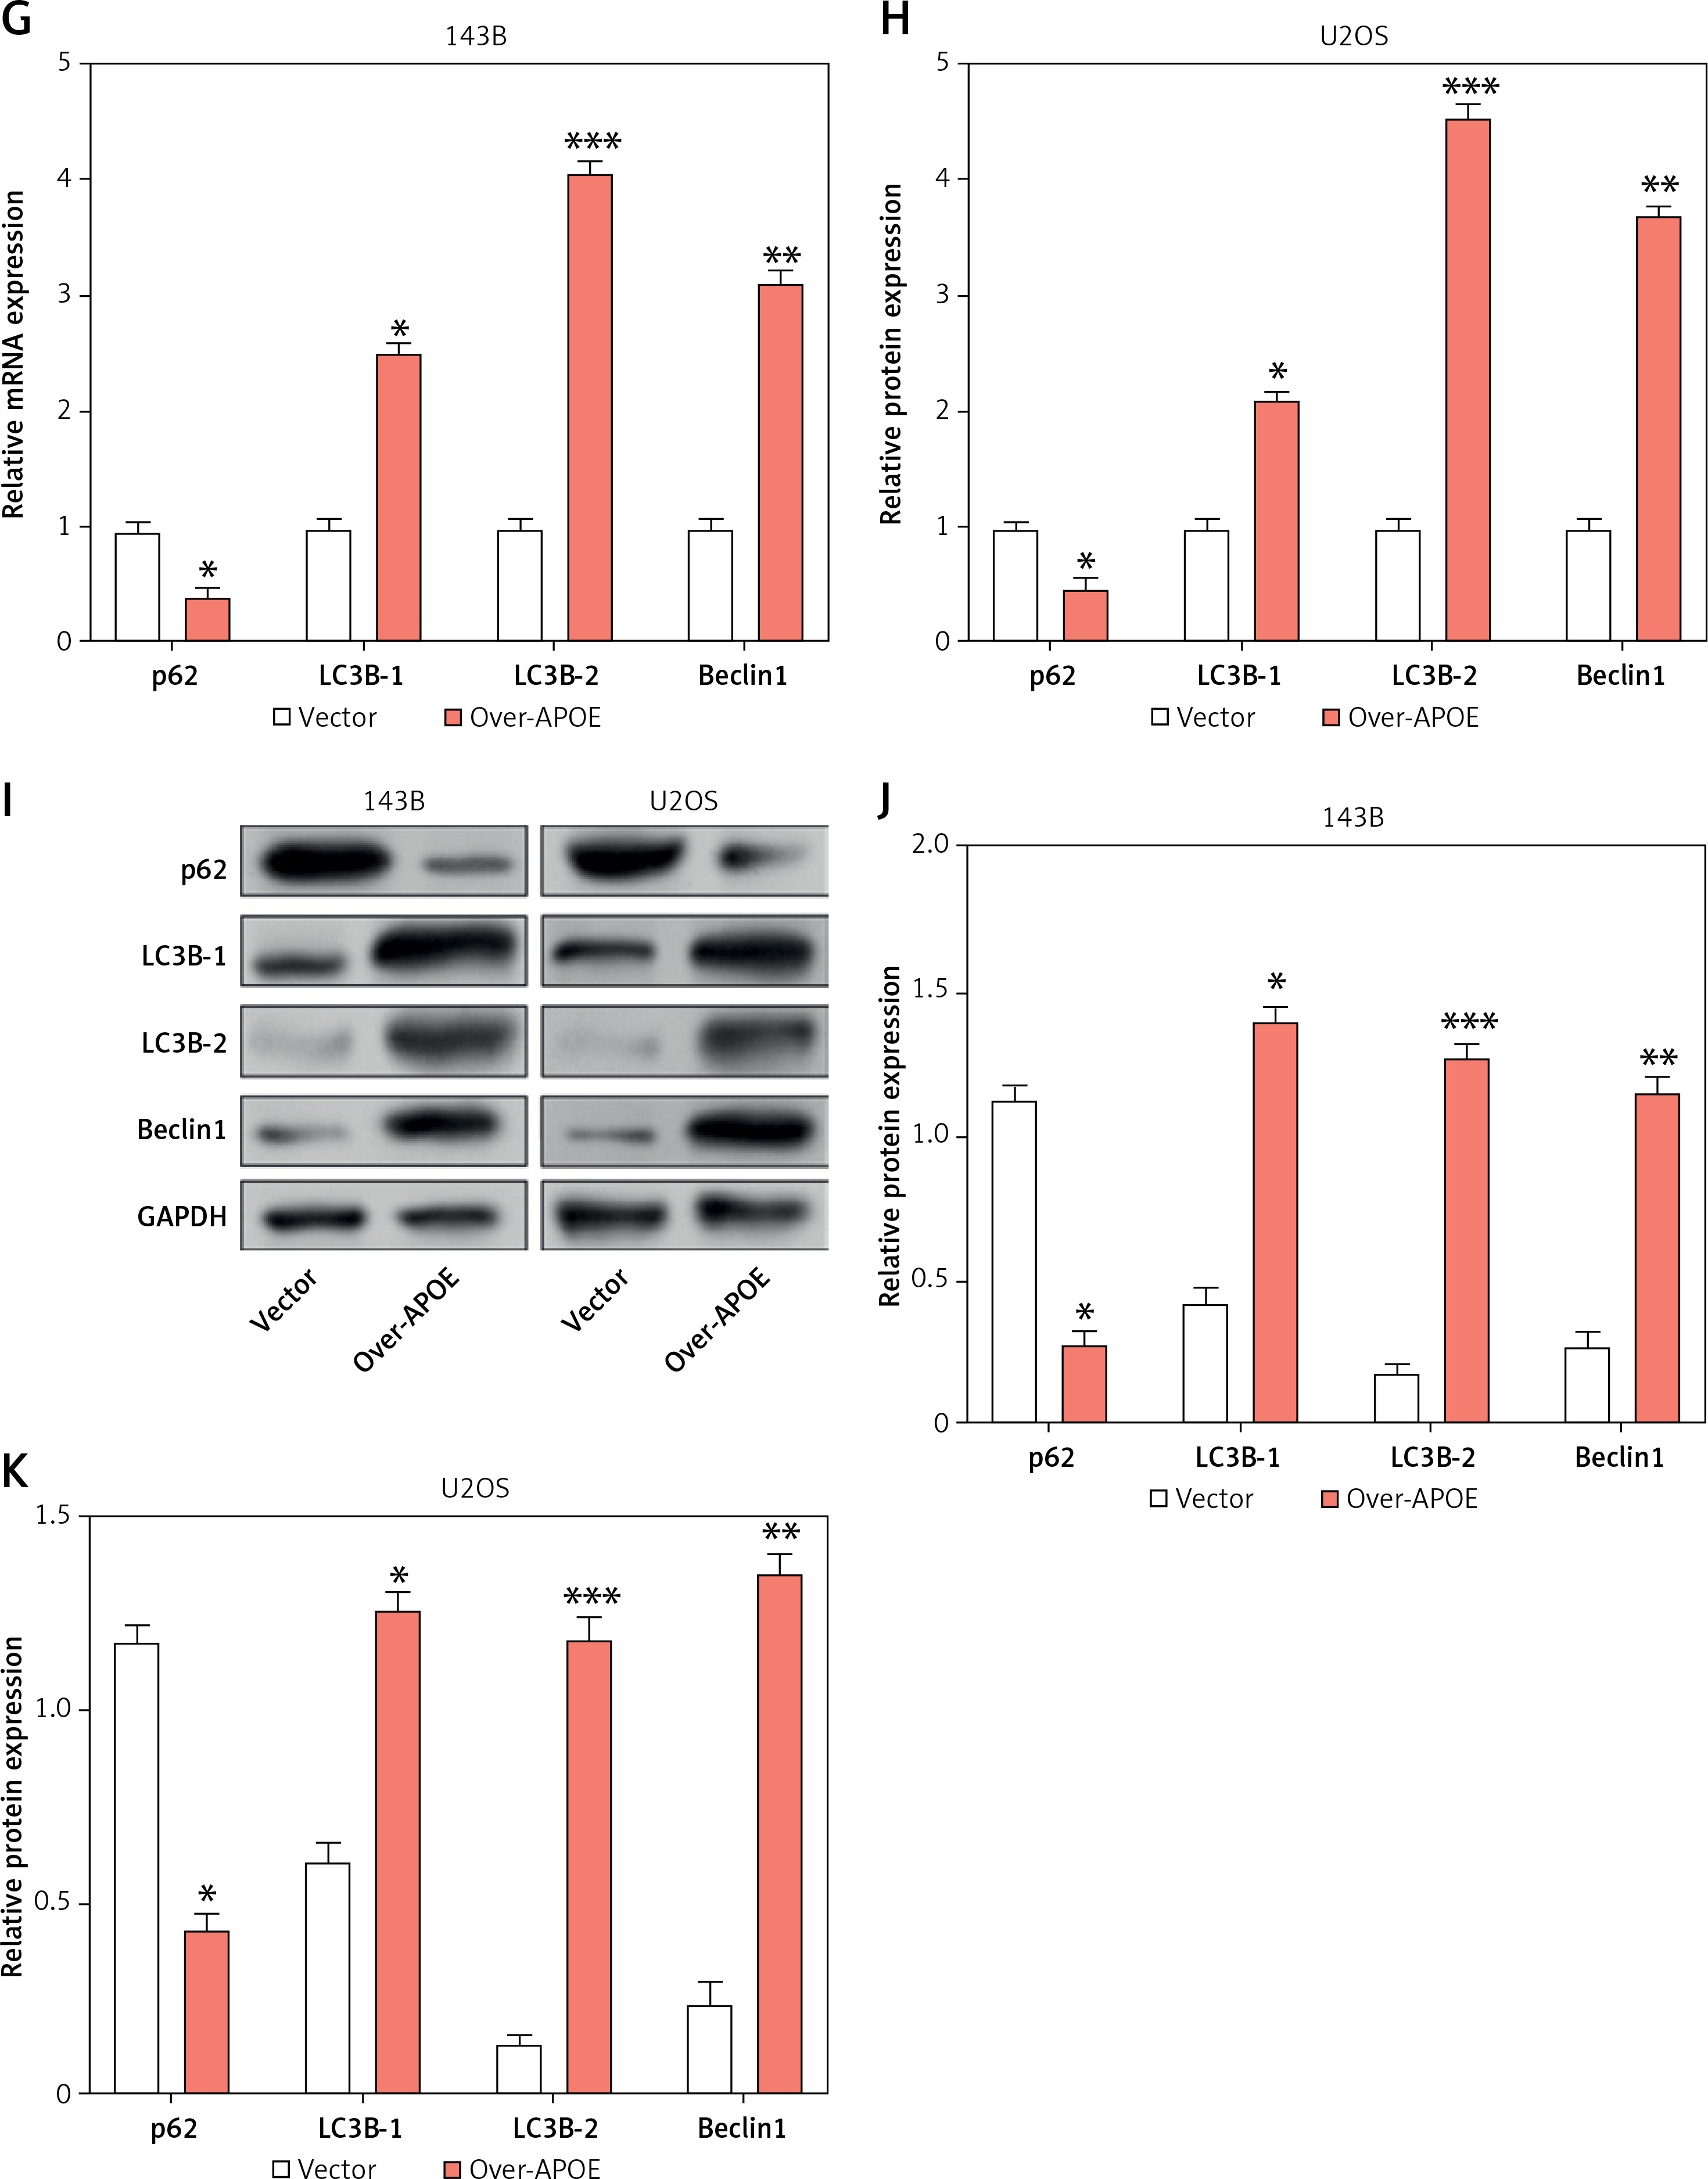
Overexpression of APOE stimulates autophagy via the mTOR/Stat3 signaling pathway in OS cells
To investigate the impact of APOE overexpression on autophagy in osteosarcoma cells, we examined the expression of key proteins engaged in the mTOR and Stat3 signaling pathways, as well as several autophagy-related markers. WB analysis showed that overexpression of APOE significantly decreased the levels of p-mTOR in both 143B and U2OS cells, while total mTOR levels remained unchanged (Figures 5 A–C). Similarly, p-Stat3 levels were reduced in APOE-overexpressing cells without affecting total Stat3 expression (Figures 5 D–F). These results indicate that APOE overexpression inhibits the mTOR and Stat3 pathways, both of which are known to negatively regulate autophagy. Further analysis of autophagy markers revealed that APOE overexpression resulted in a notable increase in LC3B-1, LC3B-2, and Beclin1 mRNA and protein levels, while levels of p62, a marker of autophagy flux, were decreased in both 143B and U2OS cells (Figures 5 G–K). These results indicate enhanced autophagic activity in APOE-overexpressing cells.
Figure 5
Overexpression of APOE stimulates autophagy in OS cells via the mTOR/Stat3 signaling pathway. A – WB detection of p-mTOR and mTOR expression in 143B and U2OS cells overexpressing APOE. B, C – Quantitative analysis of p-mTOR and mTOR. D – WB detection of p-Stat3 and Stat3 expression in 143B and U2OS cells overexpressing APOE. E, F – Quantitative analysis of p-Stat3 and Stat3. G, H – qRT-PCR detection of p62, LC3B-1, LC3B-2 and Beclin1 expression in 143B and U2OS cells overexpressing APOE. I – WB detection of p62, LC3B-1, LC3B-2, and Beclin1 expression in 143B and U2OS cells overexpressing APOE. J, K – Quantitative analysis of p62, LC3B-1, LC3B-2 and Beclin1. *p < 0.05, **p < 0.01, ***p < 0.001
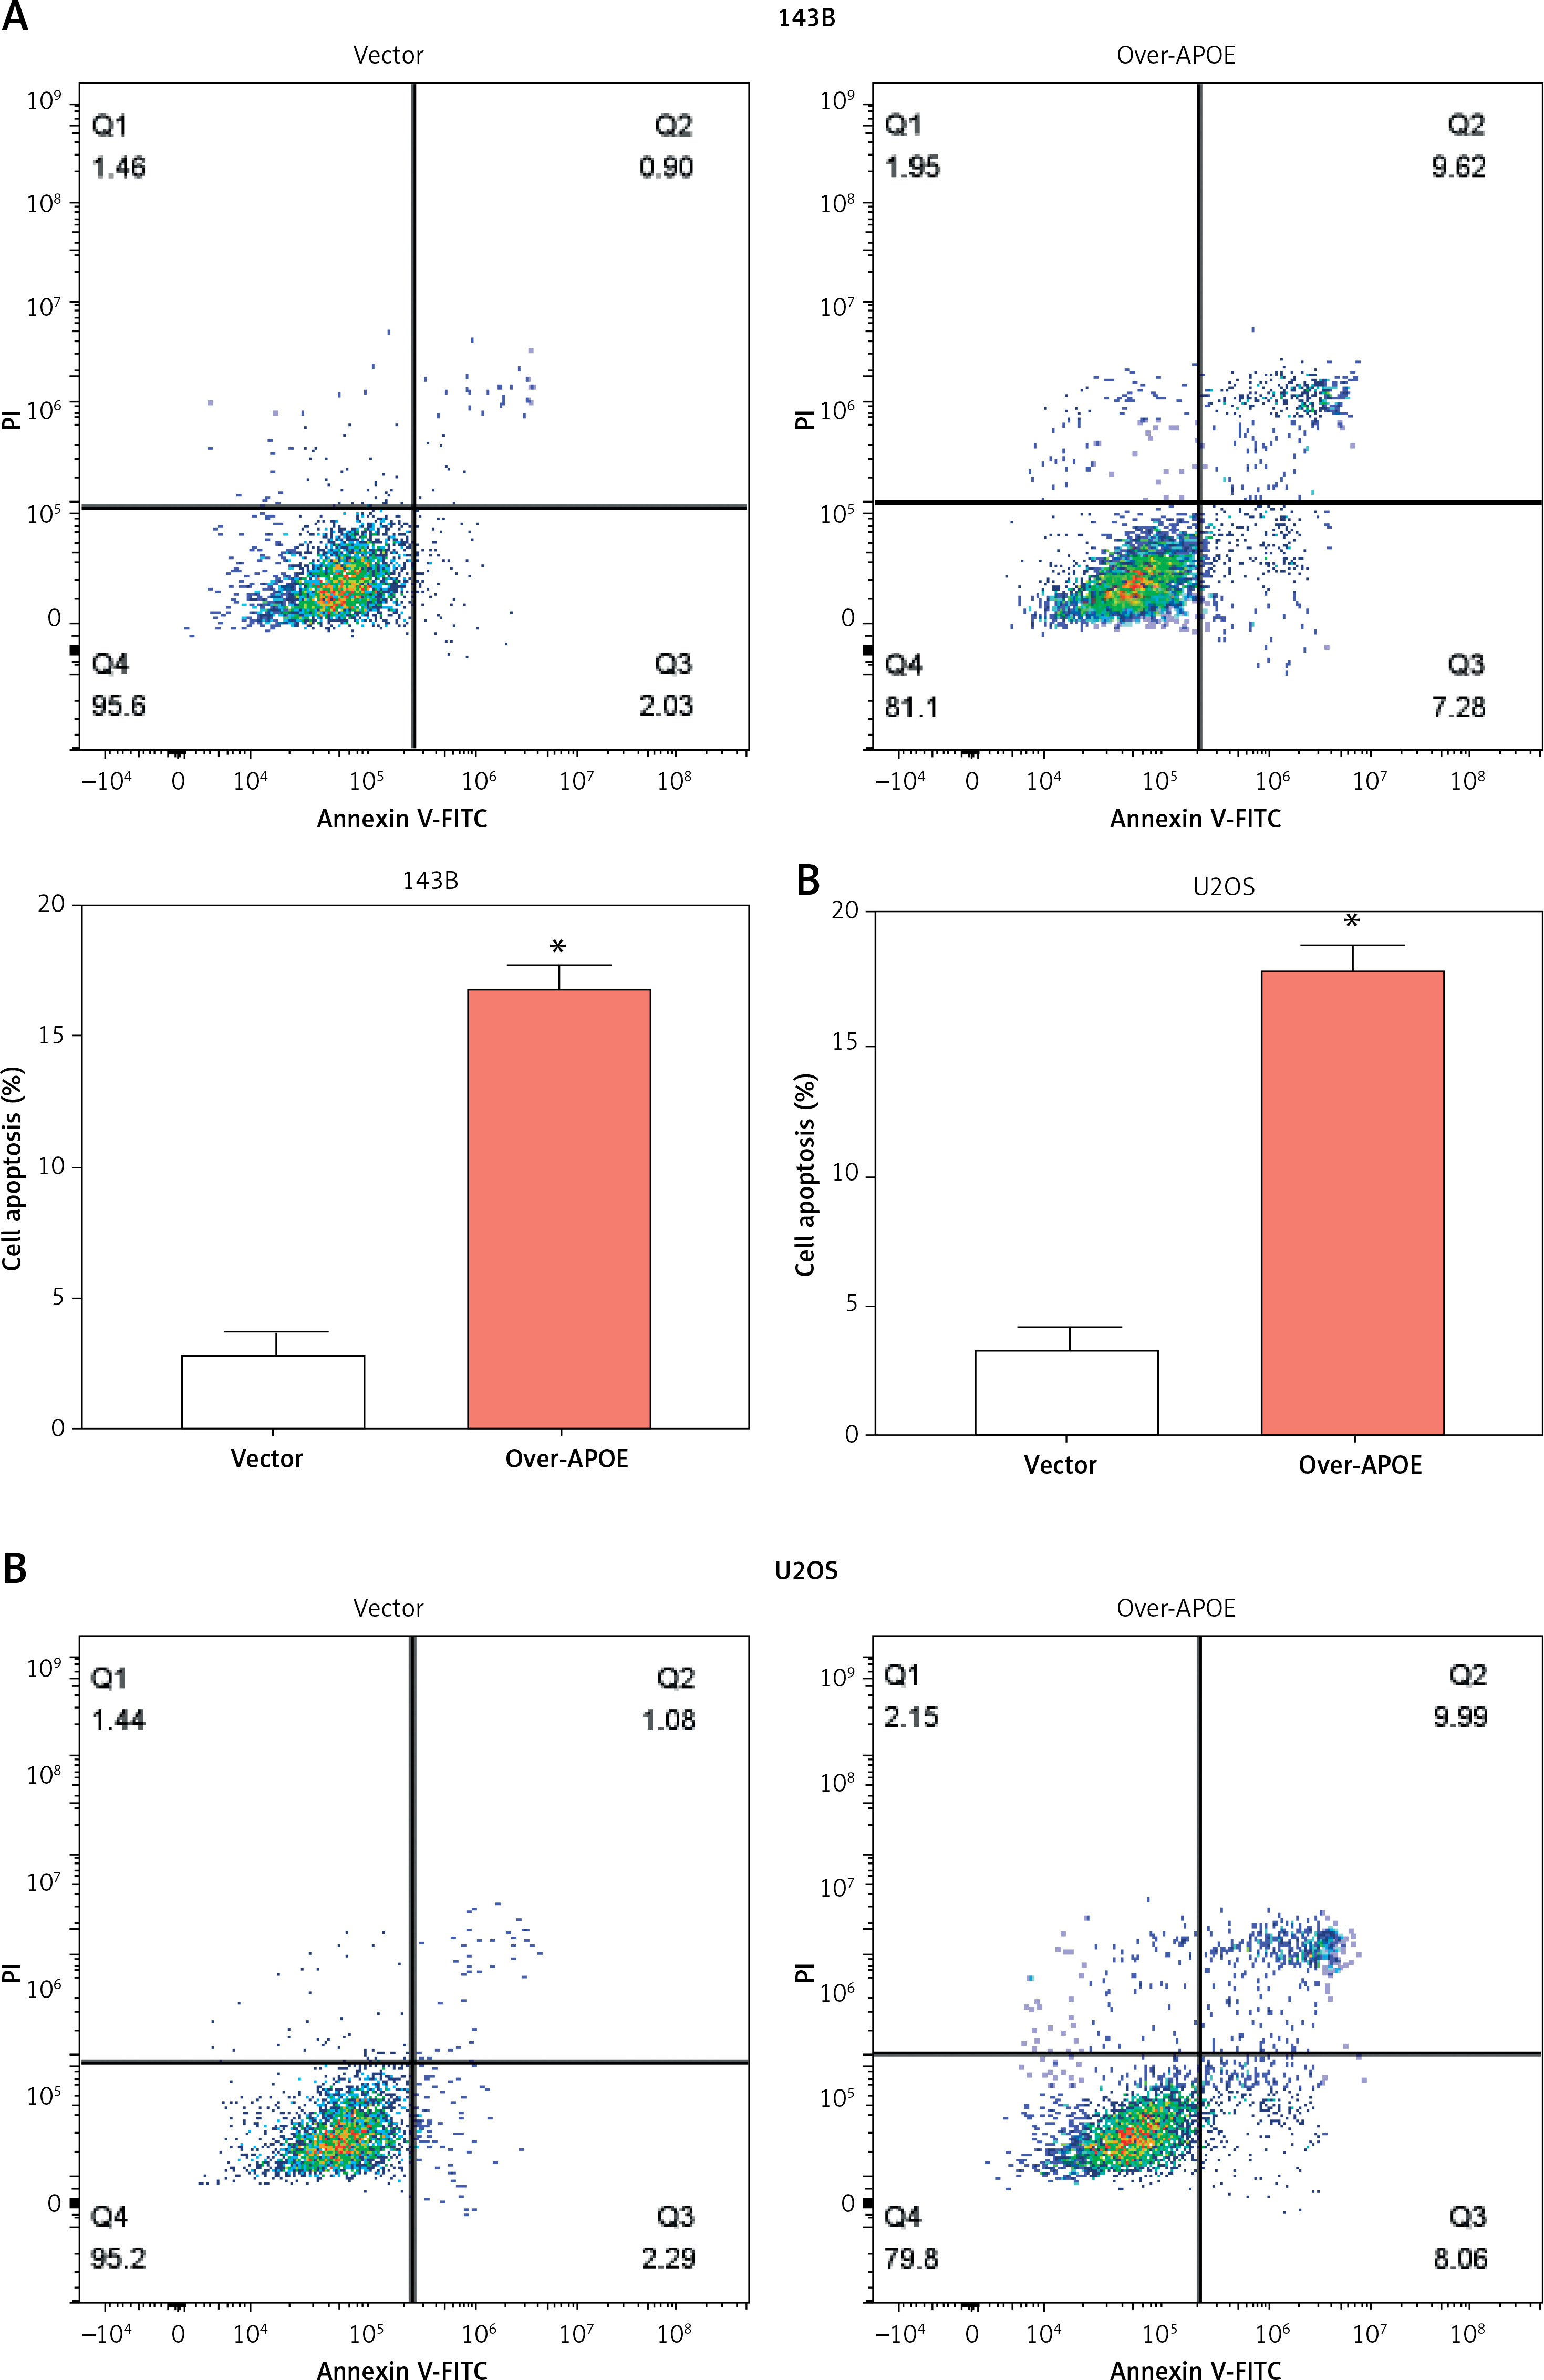
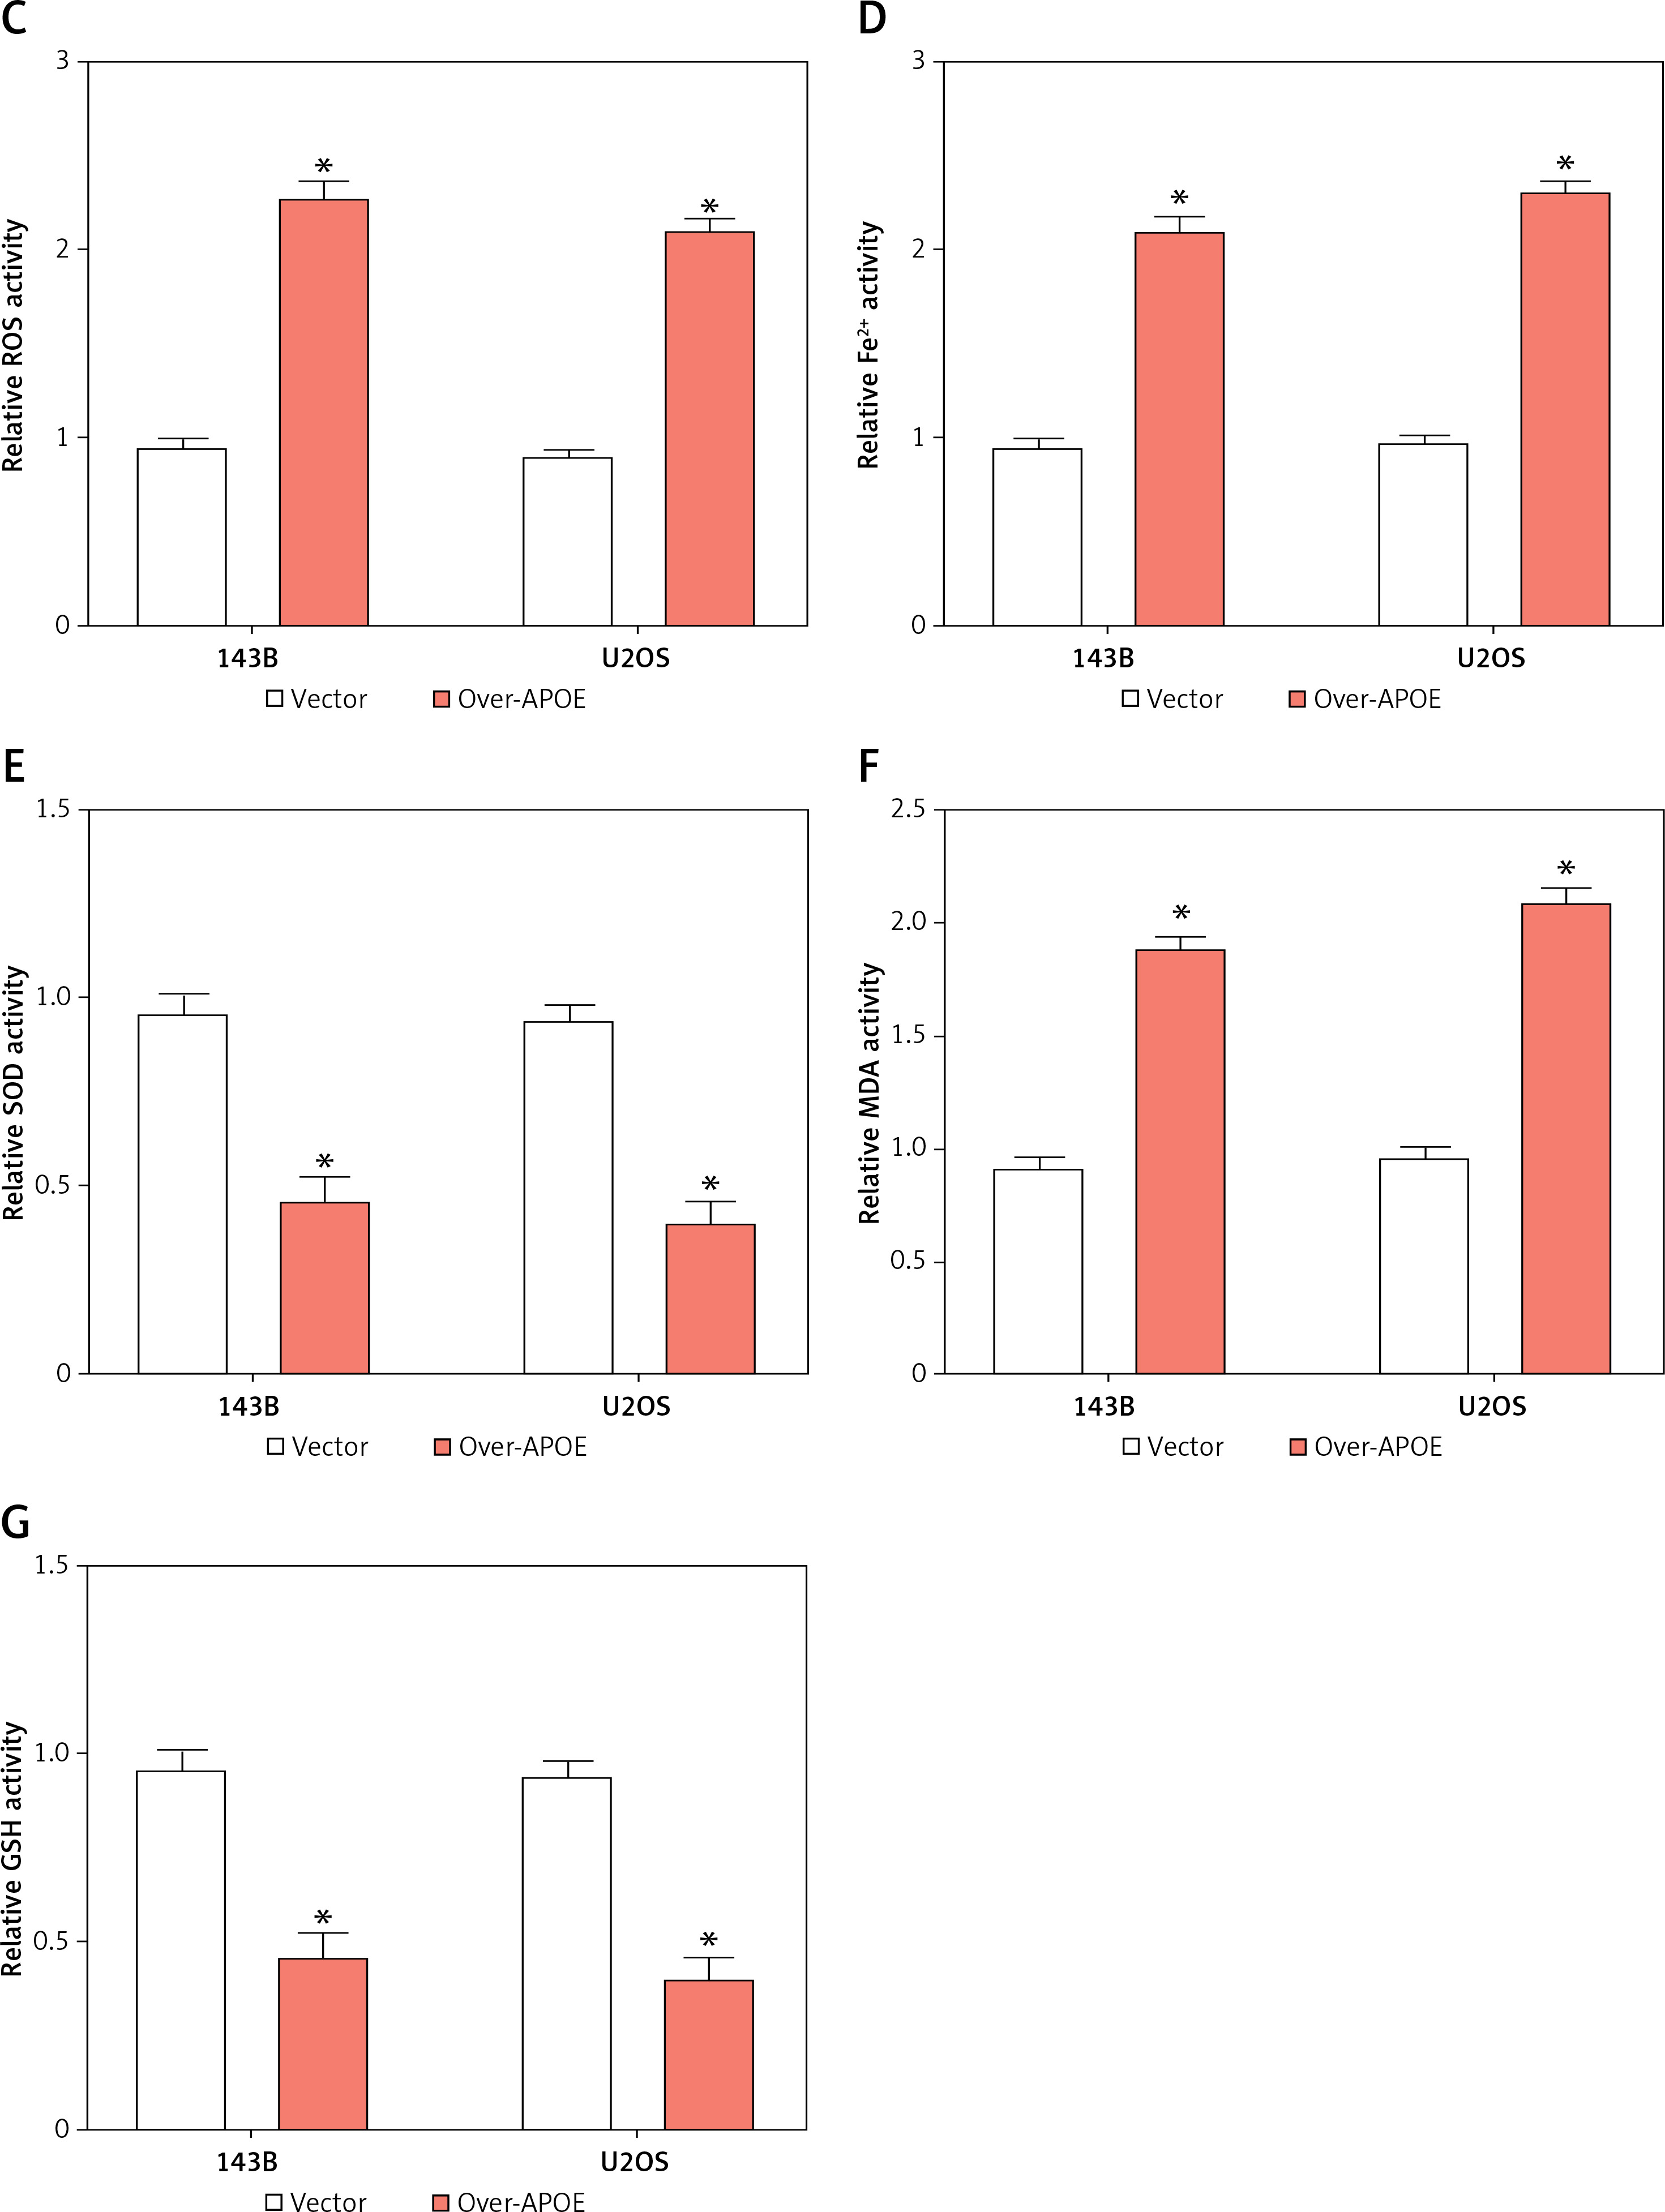
APOE overexpression induces apoptosis and disrupts iron homeostasis in OS cells
To determine the impacts of APOE overexpression on apoptosis in osteosarcoma cells, flow cytometry was conducted after Annexin V/PI double staining. The findings demonstrated that, in comparison to the vector control group, the proportion of apoptotic cells increased significantly in both 143B and U2OS cells overexpressing APOE (Figures 6 A, B). These findings suggest that APOE overexpression promotes apoptosis in osteosarcoma cells. Additionally, we evaluated the impact of APOE overexpression on oxidative stress markers. APOE overexpression led to a significant increase in ROS levels (Figure 6 C), and a concurrent increase in intracellular Fe²+ levels (Figure 6 D), both of which are indicators of enhanced oxidative stress. Conversely, the activities of key antioxidant enzymes were significantly lower in APOE-overexpressing cells than controls (Figures 6 E, G). Furthermore, MDA levels, a marker of lipid peroxidation, were significantly elevated in the APOE-overexpressing cells (Figure 6 F). These findings suggest that APOE overexpression not only induces apoptosis in osteosarcoma cells but also disrupts iron homeostasis, contributing to increased oxidative stress and compromised antioxidant defenses, which may further potentiate cell death mechanisms.
Figure 6
Overexpression of APOE induces ferroptosis of OS cells. A, B – Detection of apoptosis in 143B (A) and U2OS (B) cells after overexpression of APOE by flow cytometry. C – Relative reactive oxygen species (ROS) levels in 143B and U2OS cells transfected with over-APOE. D – Relative Fe2+ levels in 143B and U2OS cells transfected with over-APOE. E – Relative superoxide dismutase (SOD) levels in 143B and U2OS cells transfected with over-APOE. F – Relative malondialdehyde (MDA) levels in 143B and U2OS cells transfected with over-APOE. G – Relative glutathione (GSH) levels in 143B and U2OS cells transfected with over-APOE. *p < 0.05
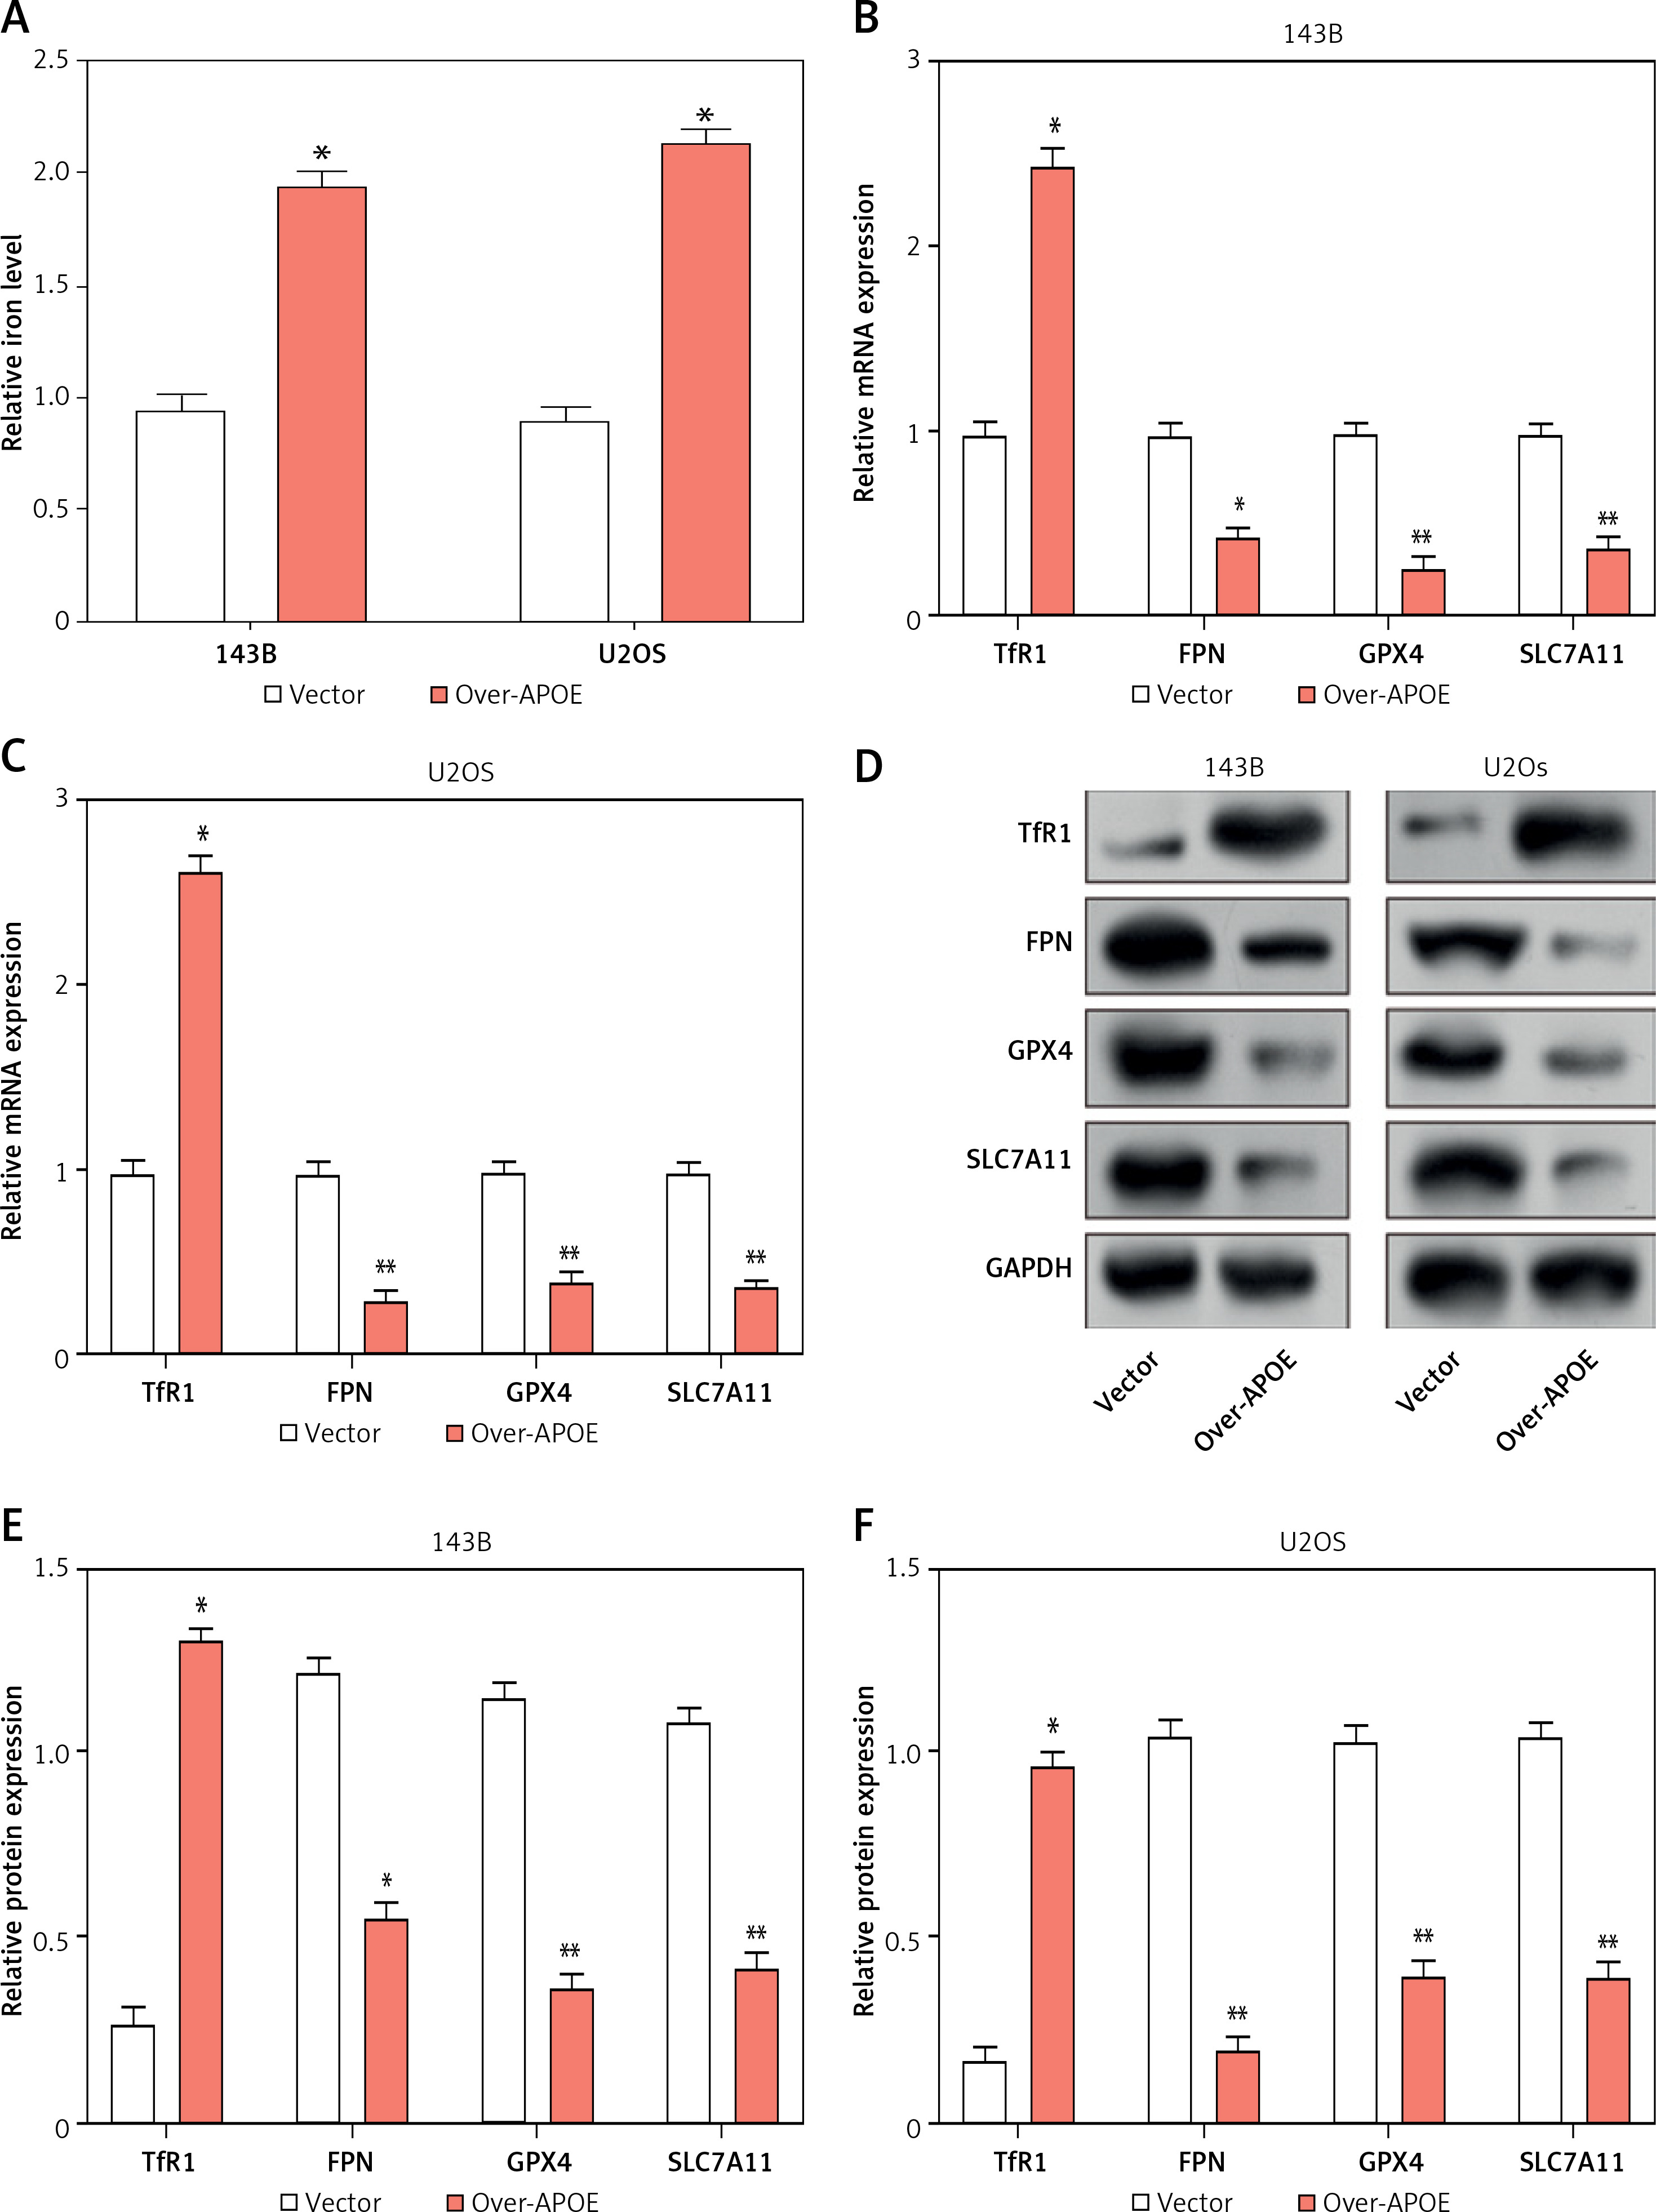
Overexpression of APOE alters iron metabolism in OS cells
Given the close relationship between iron metabolism and the onset, progression, and metastasis of malignancies, iron metabolism regulatory targets were detected in U2OS and 143B cells. First, the total iron content in U2OS and 143B cells after overexpression of APOE was determined using a total iron ion kit. When contrasting with the Vector group, the total iron content was greatly elevated after overexpression of APOE (Figure 7 A). Subsequently, qRT-PCR was used to determine the levels of TfR1, FPN, GPX4, and SLC7A11 expression in OS cells after overexpression of APOE. In contrast to the control cohort, the level of TfR1 was markedly increased after overexpression of APOE, while the levels of other factors were substantially reduced (Figures 7 B, C). This was further confirmed at the protein level (Figures 7 D–F). These results indicate that overexpression of APOE disrupts iron homeostasis and may promote ferroptosis by changing the expression of iron-regulating markers in OS cells.
Figure 7
Overexpression of APOE alters iron metabolism in OS cells. A – Relative total iron levels in 143B and U2OS cells transfected with over-APOE. B, C – qRT-PCR detection of TfR1, FPN, GPX4 and SLC7A11 expression in 143B and U2OS cells overexpressing APOE. D – WB detection of TfR1, FPN, GPX4 and SLC7A11 expression in 143B and U2OS cells overexpressing APOE. E, F – Quantitative analysis of TfR1, FPN, GPX4 and SLC7A11. *p < 0.05, **p < 0.01, *** p< 0.001
APOE overexpression reduces tumor growth and modulates ferroptosis-related markers
A mouse xenograft model was established using 143B cells to assess the impact of APOE overexpression in vivo tumor growth. Mice injected with APOE-overexpressing 143B cells had greatly reduced tumors in comparison to mice given vector control cell injections (Figures 8 A, B). Further analysis of tumor tissues revealed notable alterations in the expression of key genes involved in ferroptosis and autophagy. Specifically, mRNA levels of LC3B-1, LC3B-2, and TfR1 were upregulated in tumors from the APOE-overexpressing group, while GPX4, SLC7A11, and FPN were downregulated (Figure 8 C). These changes were confirmed at the protein level, with LC3B-1, LC3B-2, and TfR1 consistently upregulated, and GPX4, SLC7A11, and FPN downregulated (Figures 8 D, E). These findings suggest that APOE overexpression not only inhibits tumor growth in vivo but also promotes autophagy and disrupts iron homeostasis, potentially enhancing ferroptosis of osteosarcoma cells in the tumor microenvironment. Figure 9 summarizes the molecular mechanisms through which APOE overexpression influenced osteosarcoma progression. The figure illustrates how APOE activated the mTOR/Stat3 signaling pathway, thereby promoting autophagy while disrupting iron homeostasis and inducing ferroptosis. Collectively, these processes inhibited cell proliferation, invasion, migration, and tumor growth, as observed in both in vivo and in vitro models.
Figure 8
APOE overexpression reduces tumor growth and modulates ferroptosis-related markers in a mouse xenograft model. A – Xenograft tumor imaging after nude mice were injected with 143B cells stably transfected with Vector/over-APOE. B – Comparison of tumor weight between Vector and over-APOE groups. C – qRT-PCR analysis of mRNA expression levels of autophagy and ferroptosis-related markers, including LC3B-1, LC3B-2, GPX4, SLC7A11, TfR1, and FPN in tumor tissues. D – WB detection of LC3B-1, LC3B-2, GPX4, SLC7A11, TfR1 and FPN expression in tumor tissues overexpressing APOE. E – Quantitative analysis of LC3B-1, LC3B-2, GPX4, SLC7A11, TfR1 and FPN. *p < 0.05, **p < 0.01, ***p < 0.001
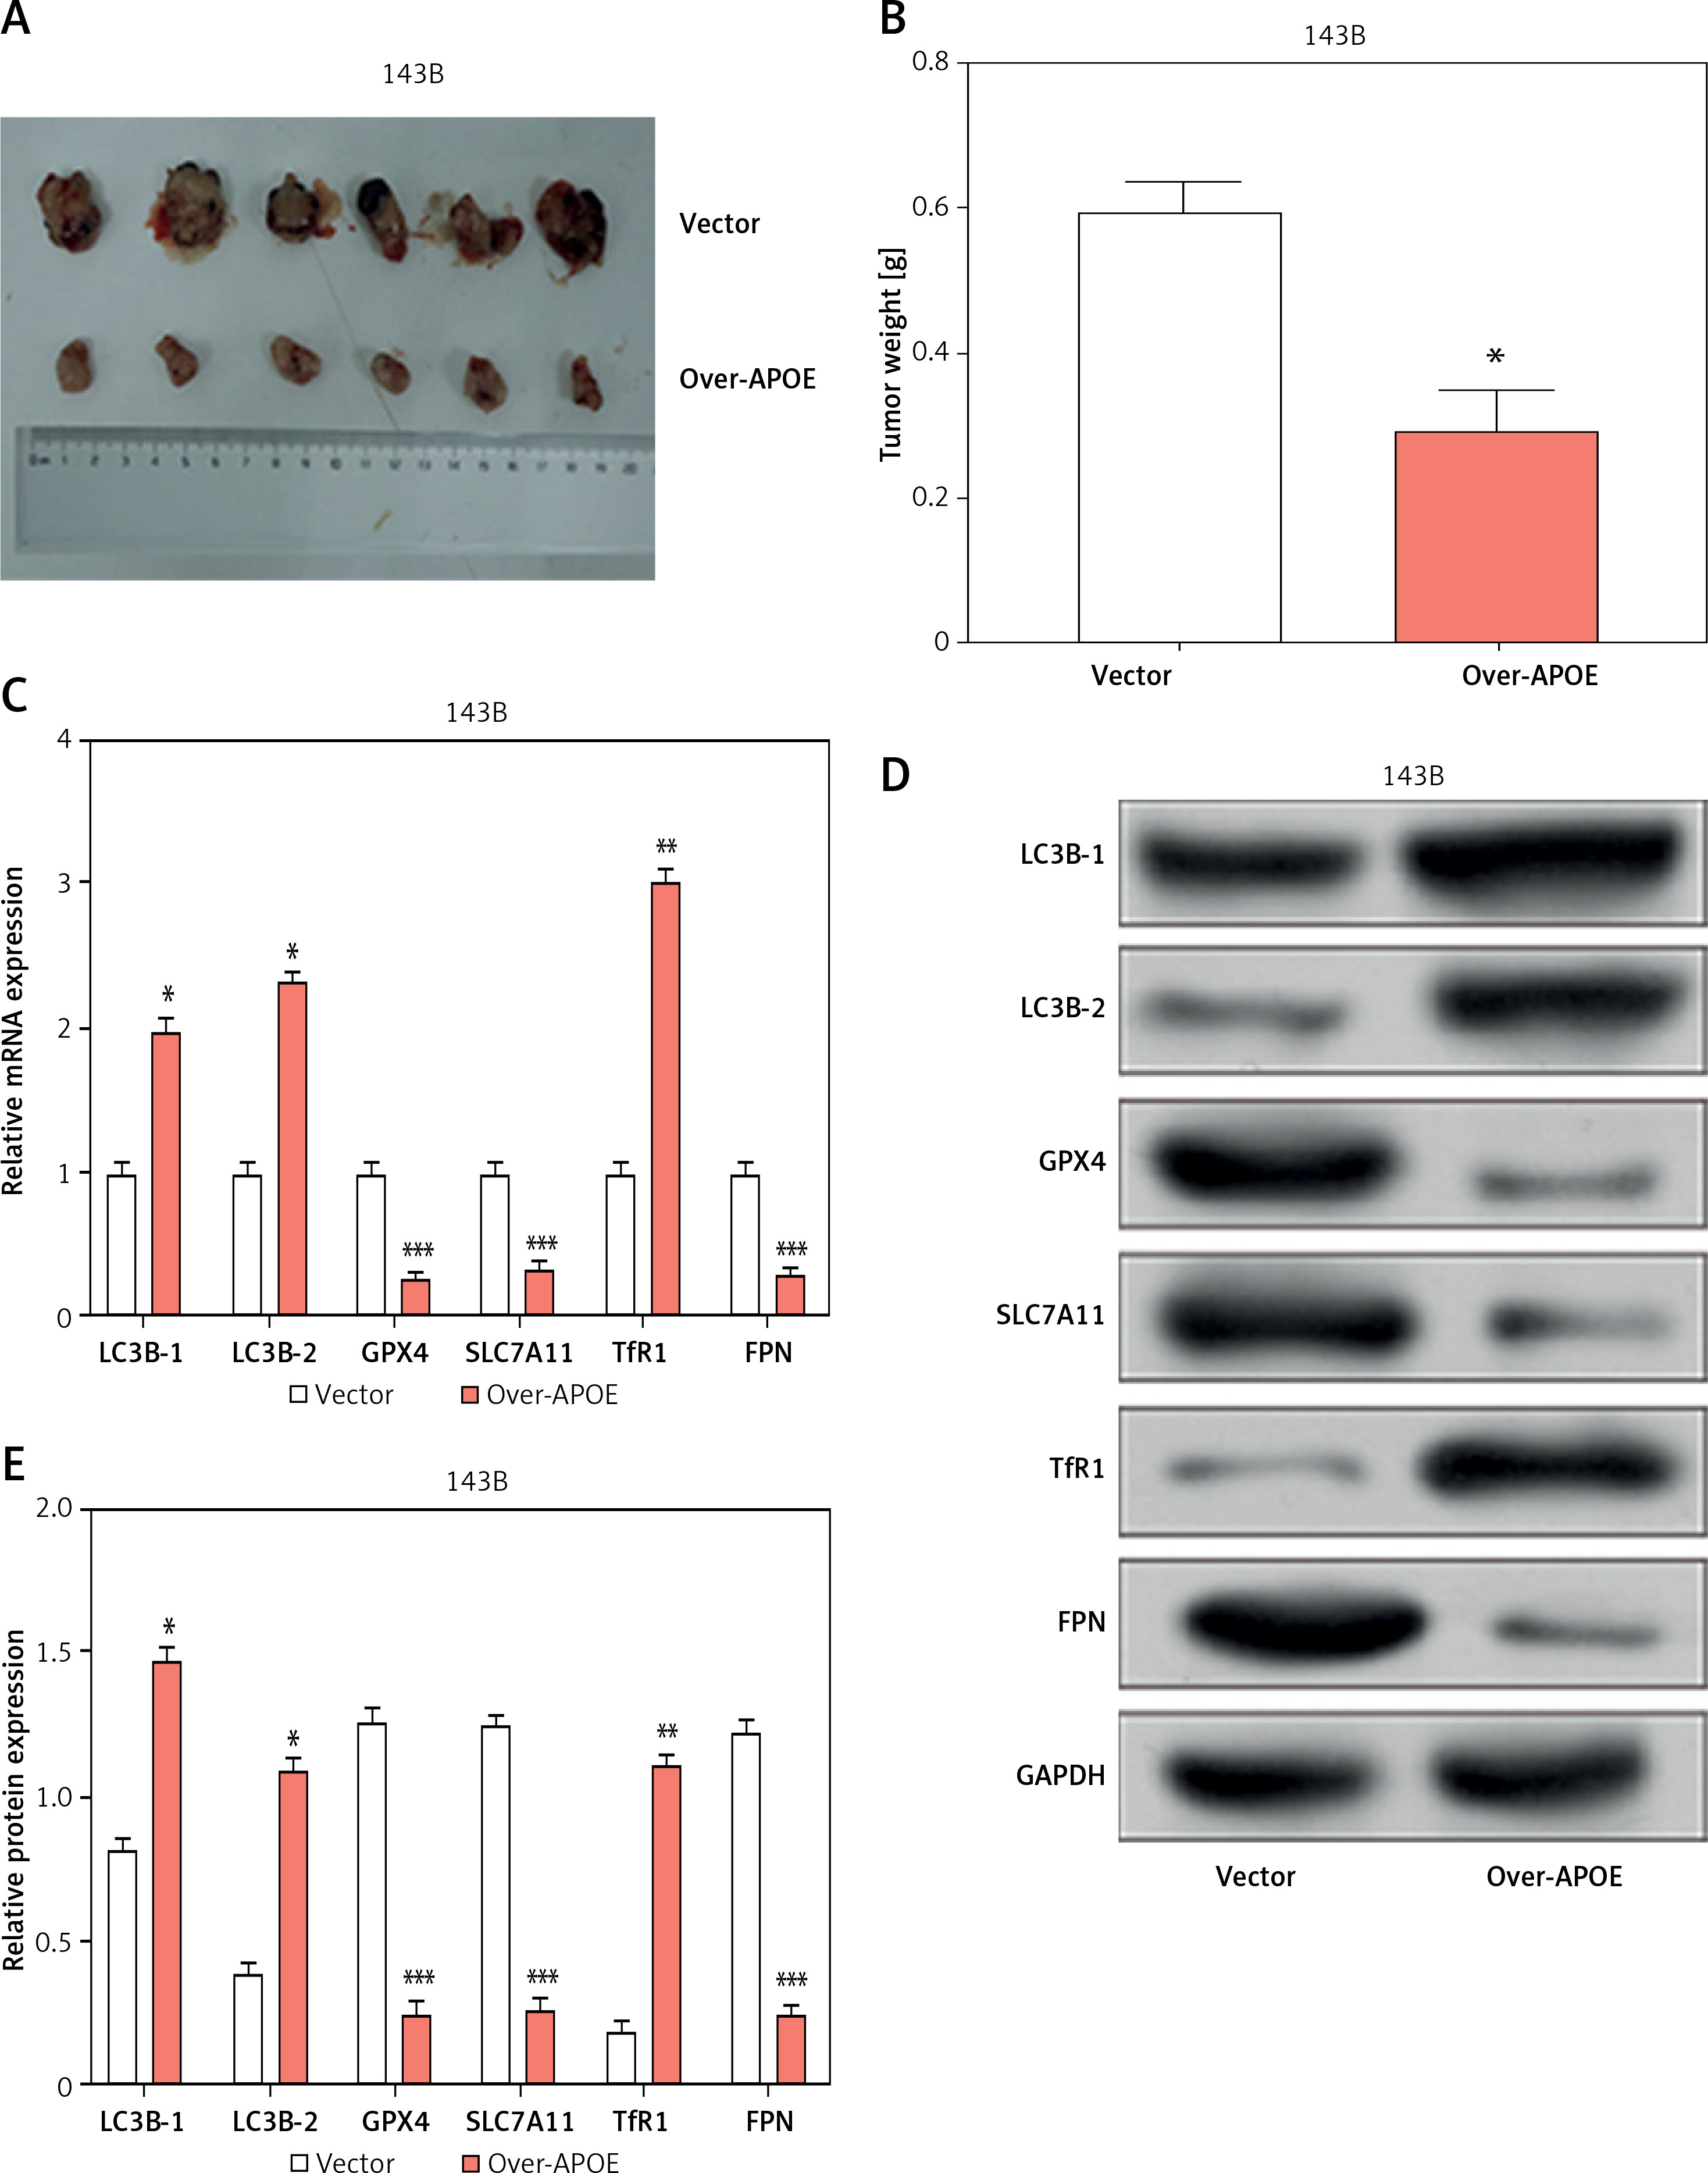
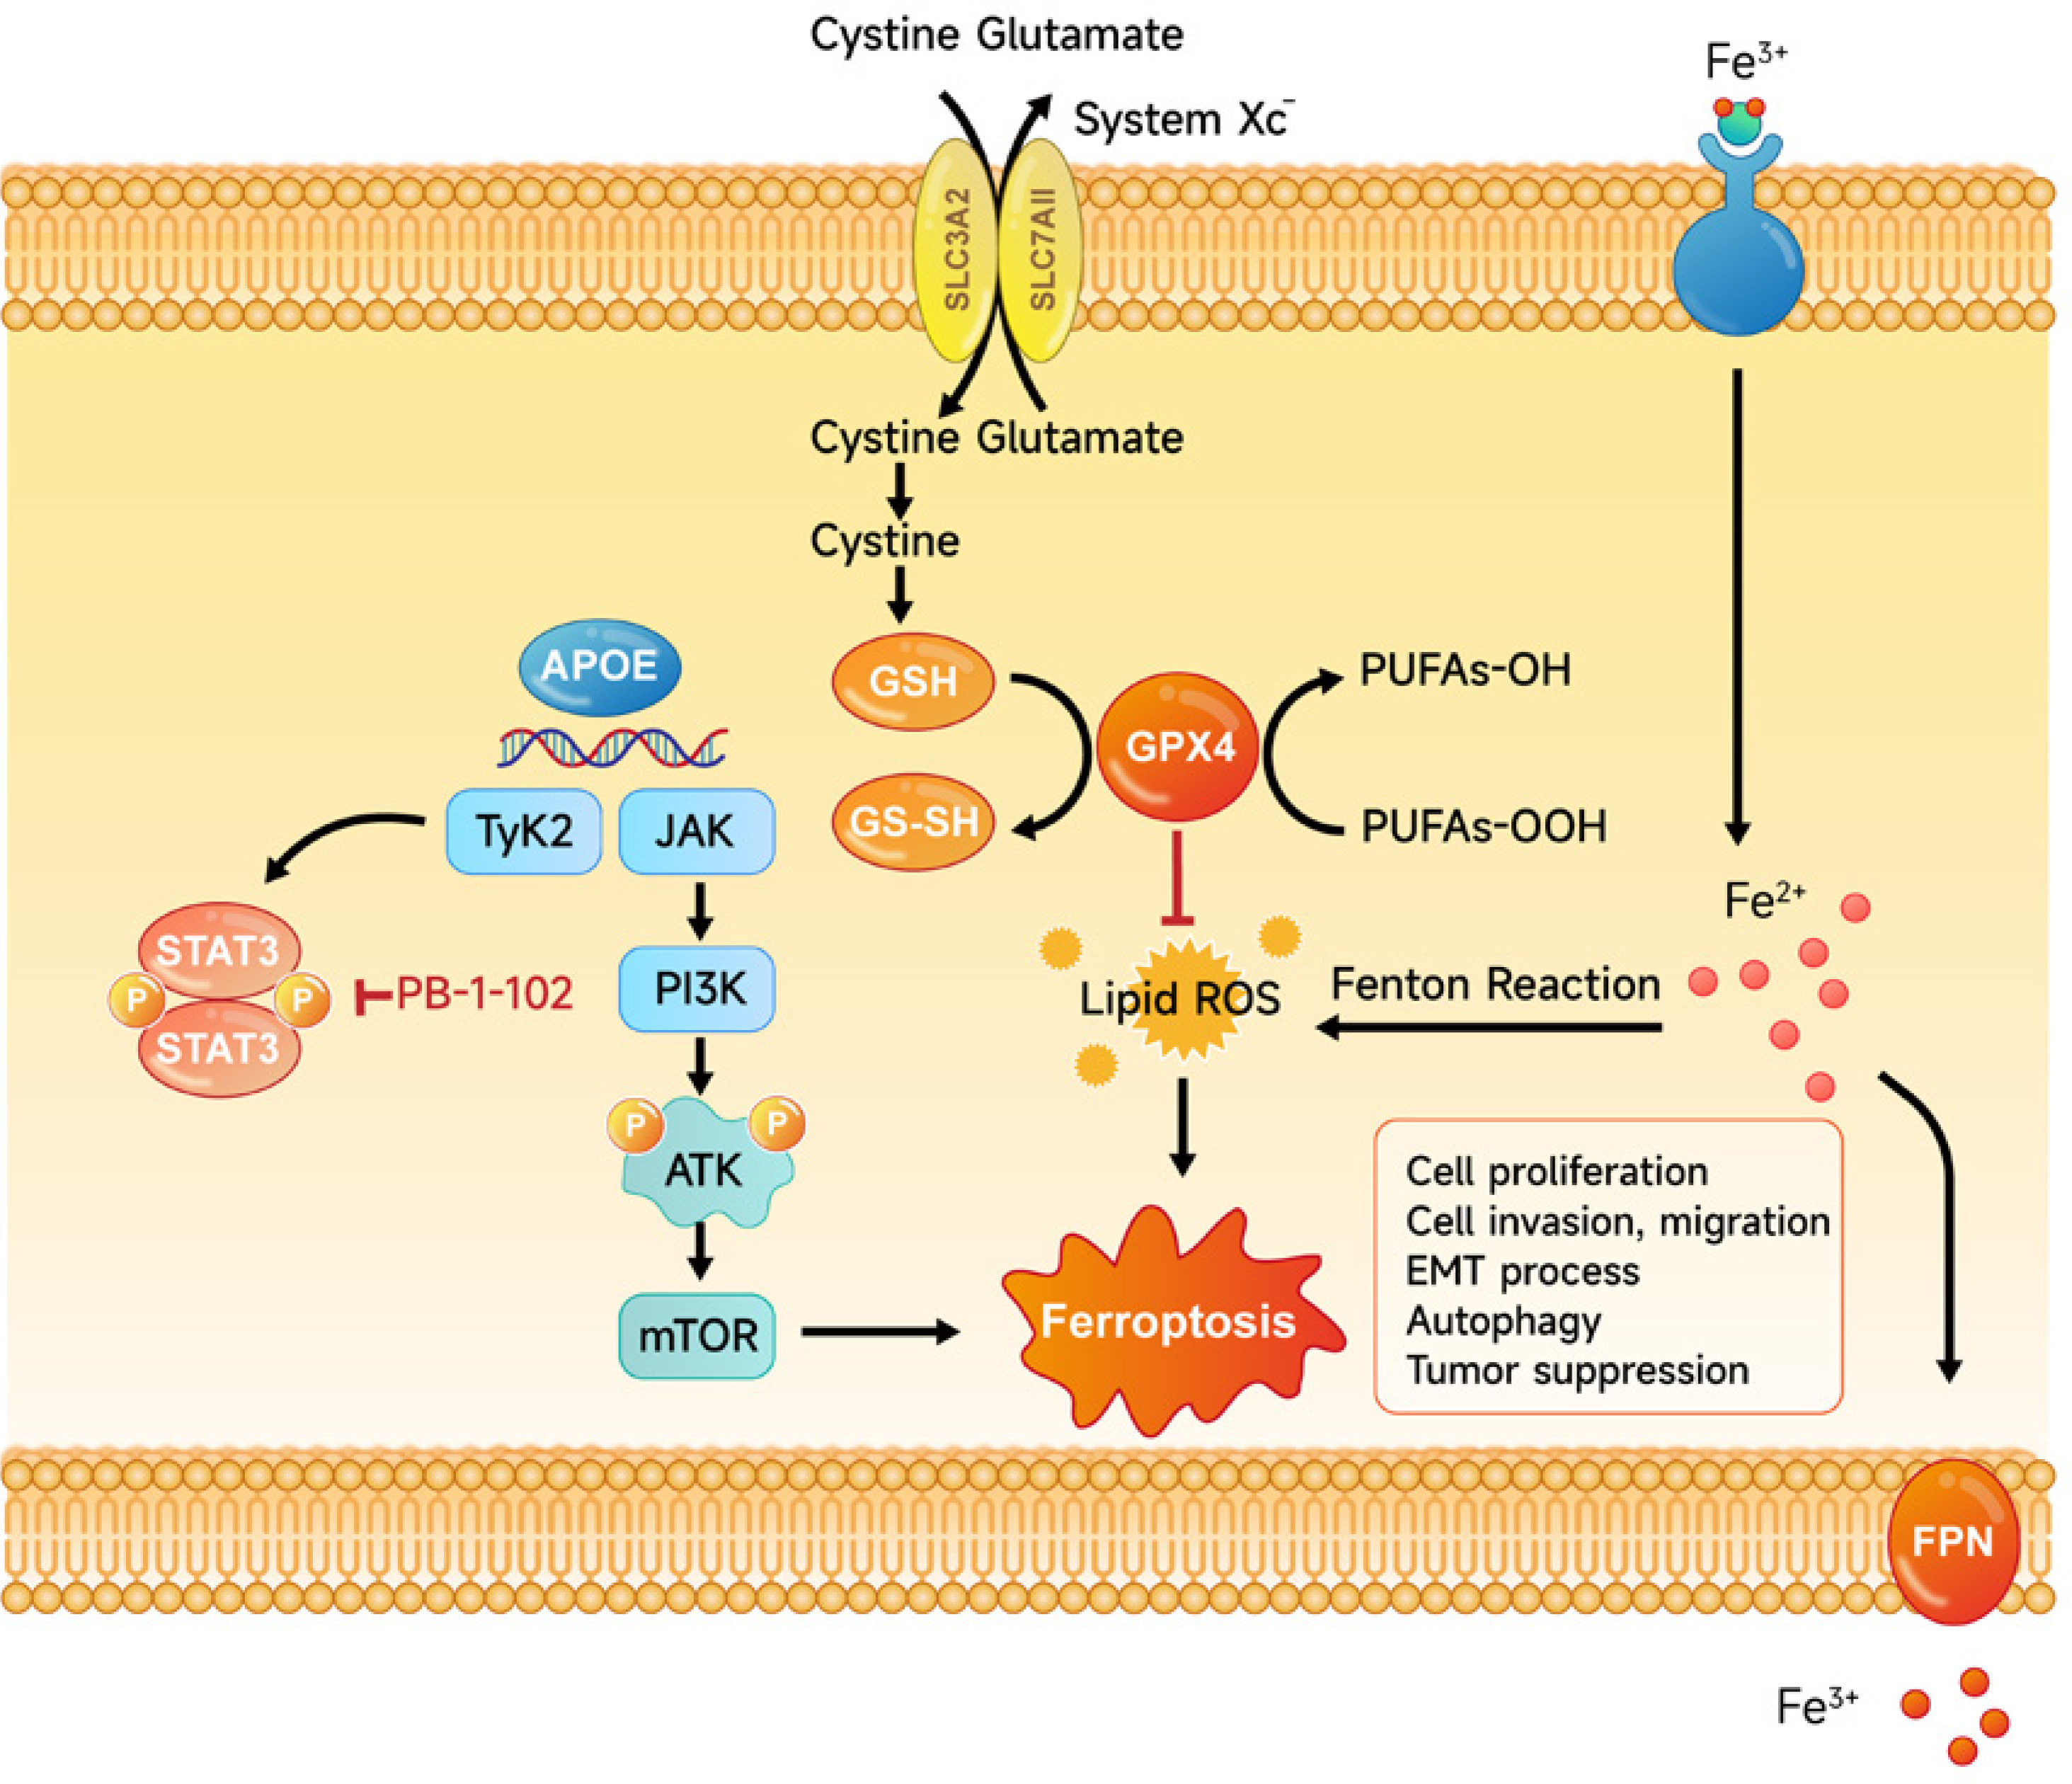
Figure 9
Overexpression of APOE induces cell ferroptosis. Diagram of the mechanism by which APOE mediates ferroptosis in osteosarcoma (OS) cells. Overexpression of APOE leads to activation of the mTOR/Stat3 signaling pathway and enhances autophagy, which together suppress OS cell proliferation, migration, and invasion. Additionally, APOE overexpression alters iron metabolism, increasing intracellular iron levels, reducing glutathione (GSH) levels, and promoting lipid ROS accumulation. These changes culminate in the induction of ferroptosis, a form of programmed cell death characterized by iron-dependent lipid peroxidation, thereby contributing to tumor suppression in OS cells
Discussion
OS is a particularly aggressive bone malignancy that predominantly affects adolescents and children [24]. Genetic studies have identified several key genes implicated in OS pathogenesis. For instance, mutations in TP53 are frequently observed in OS and are linked to genomic instability [25]. MYC overexpression is associated with poor prognosis, while SPP1 levels are significantly elevated in OS [26, 27]. Additionally, KLF2 has been shown to prevent the growth and invasion of OS cells, and the curcumin analogue EF24 upregulates HMOX1 expression, promoting ferroptosis in OS cells [28, 29]. APOE is primarily known for its role in lipid metabolism and has been widely studied in various cancers. In ovarian cancer, APOE is linked to the survival and development of cancer cells; in gastric cancer, its overexpression is linked to increased invasiveness; in breast cancer, it affects tumor cell proliferation and migration; and in prostate cancer, it is involved in apoptosis resistance [30–32]. However, the role of APOE in OS remains understudied. Given its critical role in other malignancies, understanding the function of APOE in OS could offer novel viewpoints on the pathogenesis of this disease. This research used bioinformatics analysis to reveal that APOE is significantly downregulated in OS. Functional experiments showed that APOE overexpression inhibited OS cell growth while promoting cell apoptosis. These findings implied that APOE may be essential to the development of OS and serve as a potential therapeutic target for this aggressive tumor.
Autophagy, a critical lysosomal degradation process essential for cellular homeostasis, maintains homeostasis by recycling damaged or unnecessary cellular components [33]. It exhibits a dual role in OS by either inhibiting tumor progression or enabling cancer cells to survive under stressful conditions. Our study demonstrates that APOE overexpression exerts potent anti-tumor effects in OS by suppressing the mTOR/Stat3 signaling axis, a central regulator of cellular metabolism and survival. Mechanistically, APOE overexpression significantly reduced phosphorylation of mTOR and Stat3, thereby alleviating their repression of autophagy and triggering enhanced autophagic flux, as evidenced by elevated LC3B-II/LC3B-I ratios, upregulated Beclin1, and diminished p62 accumulation. Key autophagy markers also play crucial roles in tumor dynamics. For instance, luteolin has been shown to increase Beclin1 expression in OS cells to promote autophagy and augment doxorubicin-induced autophagy [34]. Additionally, p62 overexpression is linked to aggressive characteristics and a poor prognosis in OS, as its accumulation inhibits autophagy [35]. Concurrently, mTOR/Stat3 inhibition disrupted iron homeostasis, downregulating ferroptosis suppressors (GPX4, SLC7A11) while upregulating TfR1, which collectively drove iron overload, lipid peroxidation, and ferroptotic cell death. This dual mechanism – autophagy activation coupled with ferroptosis induction – highlights APOE’s unique role in rewiring OS cell fate. In cancer cells, autophagy plays a complex and multifaceted role, making it a challenging but promising therapeutic target. In OS, autophagy has been implicated in various aspects of tumor biology. For example, autophagy can reduce the effectiveness of chemotherapeutic agents such as cisplatin, doxorubicin, and methotrexate in OS cells [36]. Conversely, miR-101 has been shown to downregulate autophagy, thereby inhibiting OS cell proliferation and metastasis [37]. These findings suggest that targeting autophagy could be an effective strategy to overcome chemotherapy resistance and reduce metastasis in OS.
The regulation of autophagy is intricately linked to several signaling pathways, with mTOR and Stat3 being central regulators. Our study demonstrated that APOE overexpression in OS cells not only altered iron metabolism and induced ferroptosis but also activated the mTOR/Stat3 signaling pathway. mTOR acts as a crucial autophagy-negative regulator, and its inhibition is associated with the induction of autophagy and subsequent cancer cell death. For instance, rapamycin inhibits tumor growth by promoting autophagy through mTOR pathway inhibition [38]. Stat3, a downstream effector of mTOR, mediates the expression level of multiple genes implicated in the development of cancer. In OS, BLACAT1 upregulation has been shown to regulate Stat3 phosphorylation, thereby enhancing OS progression [39]. Our findings reveal that APOE overexpression promotes autophagy in OS cells by the mTOR/Stat3 pathway, underscoring the potential therapeutic benefit of targeting APOE alongside autophagy inhibition in OS treatment. In vivo, APOE overexpression significantly slowed tumor growth, with molecular analyses suggesting that mTOR/Stat3 activation by APOE contributes to OS suppression by enhancing autophagy and ferroptosis. The mTOR/Stat3 signaling pathway is also closely associated with ferroptosis. Abnormal activation of this pathway has been linked to tumorigenesis and resistance to therapy in various cancers. For example, CD151 knockdown in OS reduces mTOR phosphorylation, inhibiting tumor progression, while natural compounds such as alternol suppress OS cell proliferation by modulating Stat3, causing cell cycle arrest and apoptosis [40, 41]. Additionally, Stat3 is involved in oxidative responses, influencing ferroptosis regulation. Inhibiting Stat3 has been shown to block ferroptosis in pancreatic ductal adenocarcinoma and induce it in breast cancer [42]. These findings suggest that targeting the mTOR/Stat3 signaling pathway in combination with APOE modulation could offer a novel therapeutic strategy for managing OS.
Ferroptosis, a kind of non-apoptotic cell death that is dependent on iron, is characterized by iron overload and lipid hydroperoxide accumulation, making it closely regulated by iron metabolism [43]. Iron metabolism and ferroptosis have been shown to be important components of cancer biology in a growing body of research. For instance, FANCD2 silencing has been shown to inhibit OS growth by regulating the JAK2/Stat3 axis and inducing ferroptosis [44]. PEITC induces ferroptosis in OS cells through activation of the ROS-related MAPK signaling pathway, and baicalin inhibits the development of OS cells both in vitro and in vivo by promoting ferroptosis [45, 46]. Building on these discoveries, our research investigated the function of APOE in ferroptosis regulation in OS cells. We found that APOE overexpression significantly altered iron metabolism, leading to increased levels of ROS and Fe²+, along with decreased SOD and GSH activities, which are indicative of oxidative stress and lipid peroxidation. These changes resulted in the downregulation of key ferroptosis regulatory genes such as GPX4 and SLC7A11, while TfR1 was upregulated, collectively driving ferroptosis in OS cells. In vivo experiments further confirmed that APOE overexpression led to reduced tumor growth, with molecular analyses revealing corresponding changes in autophagy and ferroptosis markers. These results highlight the therapeutic potential of targeting APOE and iron metabolism pathways in treating osteosarcoma. This contrasts with studies in other contexts, such as neurodegenerative diseases, where APOE is reported to inhibit ferroptosis [47]. The opposing effects likely stem from tissue-specific lipid metabolism, signaling pathway crosstalk, and experimental model variations. In OS, overexpression of APOE inhibits the mTOR/Stat3 pathway, making cells sensitive to ferroptosis, while in other contexts, the anti-ferroptotic effect of APOE may involve activation of the PI3K/AKT pathway to inhibit ferritin phagocytosis [47]. Finally, our study employed exogenous APOE overexpression, which may disrupt physiological lipid trafficking and create an artificial pro-oxidant state, contrasting with studies of endogenous APOE in neurons or hepatocytes that reflect its role in maintaining lipid homeostasis under basal conditions.
While our findings demonstrate that APOE overexpression suppresses osteosarcoma progression by modulating autophagy and ferroptosis, it is important to contextualize these results within the broader biological roles of APOE. Notably, APOE is a multifunctional protein with well-documented roles in lipid metabolism. Previous studies have shown that APOE overexpression in hepatic or systemic contexts can induce hypertriglyceridemia (HTG) by impairing triglyceride clearance, which is linked to metabolic disorders and an elevated risk of certain cancers [48–51]. For instance, elevated serum triglycerides (TGs) may promote tumorigenesis through chronic inflammation, oxidative stress, or lipid peroxidation-driven genomic instability [52]. However, the role of APOE in cancer appears to be highly context-dependent, varying by tissue type, tumor microenvironment, and molecular pathways involved. In contrast to its pro-tumorigenic effects in some cancers, our data reveal that APOE overexpression in osteosarcoma cells significantly inhibits proliferation, migration, and invasion while inducing ferroptosis. This discrepancy may arise from tissue-specific signaling mechanisms. In this study, it was found that overexpression of APOE inhibits the mTOR/Stat3 pathway in OS, which has been shown in previous studies to be a key driver of tumor progression and treatment resistance [8]. Conversely, APOE produces immunosuppression through CXCL1 mediated by NF-κB in pancreatic cancer and promotes tumor growth [53]. Furthermore, the relationship between hypertriglyceridemia and cancer risk is complex and not universally applicable. While epidemiological studies associate HTG with increased cancer incidence, this correlation may not extend to all cancer types or stages. Osteosarcoma, a malignancy with distinct genetic and metabolic profiles, may respond differently to lipid metabolic perturbations. Our findings suggest that APOE’s anti-tumor effects in OS are mediated through autophagy activation and iron homeostasis disruption, rather than systemic lipid alterations. Importantly, our xenograft model focused on localized tumor suppression without inducing systemic hypertriglyceridemia, highlighting the potential for tissue-targeted APOE modulation as a therapeutic strategy.
There are three isomers of APOE – ApoE2, ApoE3, and ApoE4 – and our main focus is on ApoE4. Our study reveals that APOE4 overexpression promotes autophagy in osteosarcoma cells, contrasting with its autophagy-suppressive effects in neurodegenerative contexts [54, 55]. This divergence likely stems from tissue-specific signaling networks and metabolic demands. In OS, APOE4-driven lipid remodeling may inhibit mTOR/Stat3 signaling, a key suppressor of autophagy, thereby activating pro-degradative pathways. Conversely, in neurons, APOE4 disrupts lysosomal function and autophagosome clearance, exacerbating proteotoxic stress. These findings underscore the context-dependent duality of APOE isoforms and highlight the need to explore their roles across disease models.
Future studies should investigate whether APOE overexpression in OS influences systemic lipid metabolism or interacts with dietary/endocrine factors to modulate tumor progression. Additionally, exploring tissue-specific isoforms of APOE (e.g., APOE2, APOE3, APOE4) and their differential effects on cancer biology could provide further mechanistic insights. These efforts will clarify the dual roles of APOE in metabolism and oncology, guiding its safe therapeutic application.
In conclusion, this research elucidates the crucial function of APOE in the regulation of OS progression through its effects on autophagy and ferroptosis. The results demonstrated that APOE overexpression in OS cells markedly suppressed cell proliferation, invasion, and migration while causing ferroptosis and apoptosis. From a mechanistic perspective, APOE activated the mTOR/Stat3 signaling pathway, thereby enhancing autophagic activity. Concurrently, APOE disrupted iron homeostasis, which resulted in increased ROS levels, lipid peroxidation, and ferroptosis. These findings were corroborated by in vivo experiments, wherein APOE overexpression resulted in significantly reduced tumor growth and altered expression of key autophagy and ferroptosis markers. Our results suggest that targeting APOE, in conjunction with the modulation of iron metabolism and the mTOR/Stat3 signaling pathway, could offer a novel therapeutic approach for managing osteosarcoma. Future studies should explore the potential of combining APOE modulation with existing therapies to enhance treatment efficacy in OS.