Introduction
Telomeres are nucleoprotein structures consisting of TTAGGG tandem repeats at the ends of chromosomes [1]. They have a wide range of biological functions involving the maintenance of chromosomal structure and stability, the prevention of chromosome end-to-end fusion, and the determination of cell replicative capacity [2]. Telomere length (TL) is considered as a biomarker of aging, stress, and survival [3–5]. Shorter telomeres have been related to several diseases including type 2 diabetes mellitus (T2DM) [6, 7], hypertension [8, 9], coronary heart disease (CHD) [10–12], cancers [13], and obesity [14].
Experimental research suggests that oxidative stress and inflammation are the main contributors of acceleration of telomere shortening [15–17] by promoting cell turnover and replicative senescence [18]. Furthermore, inflammation induces the production of reactive oxygen species (ROS) that cause telomeric DNA damage [19]. It is worth mentioning that epidemiological studies showed that patients with inflammatory disorders have shorter leukocyte TL compared with healthy individuals [20, 21]. However, in such studies the chance of residual bias, confounding factors, and reverse causation cannot be ruled out.
C-reactive protein (CRP) is a major inflammatory biomarker [22]. Due to the sensitivity of telomeres to oxidative stress and inflammation [17], it is plausible that telomeric DNA damage could be associated with increased CRP levels (or other factors represented by raised CRP levels), leading to telomere shortening [12, 23]. Some studies reported that individuals with normal CRP concentrations have significantly longer telomeres than those with acutely elevated CRP levels [24]. Furthermore, several epidemiological data support an association between high CRP concentrations and shorter TL [10, 23, 25–28]; however, there are also studies that did not find any significant link [29–34].
Leptin and adiponectin are important adipocyte-derived peptides that affect the expression of various systemic inflammatory markers [35]. High leptin levels are closely linked to inflammation, insulin resistance, glucose intolerance, and atherosclerosis [36], whereas low adiponectin levels were associated with inflammation, insulin resistance, vasodilatation, hypertension, and atherosclerosis [37, 38]. The evidence regarding the associations between adipokines and TL is conflicting [33, 34, 39–46]. In this context, some studies reported non-significant links between leptin and TL [33, 34, 39–41], whereas others reported an inverse relationship [42–45]. For example, Aviv et al. found a negative association between leptin and leukocyte telomere restriction fragment length (TRFL) in premenopausal women [45]. Another study found a positive relationship between leptin and TL among 2721 elderly subjects [42]. As for adiponectin, several epidemiological studies evaluated the link between adiponectin and TL [33, 34, 39, 40, 46, 47], 2 of which reported a positive association [41, 48].
Enzymatic and non-enzymatic antioxidant defence systems may affect ROS production by scavenging or decreasing ROS levels, resulting in the maintenance of cellular redox balance [49]. In this context, serum uric acid (SUA) and bilirubin are natural antioxidants that play a role in free radical scavenging activity [50, 51]. A correlation between increased serum bilirubin and decreased incidence of cardiometabolic diseases has been reported [52]. This beneficial effect might be attributed to the radical scavenging activity of bilirubin, which in turn may delay telomere shortening by maintaining a balanced redox. Two other studies found a positive association between unconjugated bilirubin and TL [53, 54] whereas a significant relationship between total and indirect bilirubin with TL was not found [55, 56]. SUA may also represent a risk factor for cardiovascular disease [57, 58]. However, only a limited number of studies have investigated the association of SUA with TL [25, 59].
Given the inconsistency in the field, we implemented a Mendelian randomization (MR) analysis to evaluate the associations of selected and available anti- and pro-inflammatory markers: adiponectin, leptin, bilirubin, CRP, and SUA with TL. This approach is able to circumvent the limitations of observational studies (such as residual bias, confounding factors, and reverse causation) [60] by using genetic variants that are associated with an exposure as instruments to investigate the associations with an outcome (TL) [60]. Therefore, we performed an MR analysis on the recognized single nucleotide polymorphisms (SNPs) of our interested exposures (i.e. adiponectin, bilirubin, CRP, leptin, and SUA) and their causal impact on TL.
Material and methods
Study design
This was a separate-sample MR study, in which we performed summary statistics from 2 different genome-wide association studies (GWASs) – 1 for the exposures and 1 for the outcomes – to estimate the effects of exposure on outcome. Essentially, we applied genetic predictors of anti-inflammatory factors to extensively genotyped case-control studies of TL markers in order to obtain estimates of the association of exposure to our interested outcome.
Genetic predictors of exposures
We considered identification of genetic variants as instrumental variables for the following factors: 1) adiponectin, 2) bilirubin, 3) CRP, 4) leptin, and 5) SUA. We identified GWAS findings for circulating measures of each variable of interest [61–65]. For adiponectin, a meta-analysis of GWASs was conducted in 39,883 individuals of European ancestry [61]. Adiponectin levels were measured using ELISA or RIA methods [61]. Genotyping was performed by commercially available Affymetrix or Illumina genome-wide genotyping arrays [61]. For bilirubin, 3GWASs were used, i.e. the Framingham Heart Study (FHS) (n = 3424), the Rotterdam study (RS) (n = 3847), and the Age, Gene, Environment, and Susceptibility-Reykjavik study (n = 2193) [62]. For leptin, a GWAS was performed for circulating leptin levels from 32,161 individuals (of European ancestry) and followed up loci reaching p < 10–6 in 19,979 additional individuals (of European ancestry) [64]. For SUA, data from > 140,000 individuals of European ancestry within the Global Urate Genetics Consortium (GUGC) were combined [65].
Genetic predictors of outcomes
For the TL, we used [66] a genome-wide meta-analysis of 37,684 individuals (from 15 cohorts) with replication of selected variants performed in a further 10,739 individuals (from 6 cohorts). All individuals were of European descent [66]. MR studies assume that the SNPs (instrumental variables) are associated with the outcome only via the exposure [67]; thus, we performed a sensitivity analysis, excluding SNPs with potentially pleiotropic effects. To assess the instrumental variable analysis “exclusion-restriction” assumption, we used Ensembl release (http://useast.ensembl.org/index.html). Ensembl gives SNP phenotypes. SNP highly correlated (R 2 > 0.99) with the original SNP was used as a proxy when the original SNP was not available for outcomes.
Statistical analysis
In the primary analysis, SNP-specific Wald estimates were combined in a meta-analysis through the use of inverse variance weighting (IVW) with fixed effects, as well as combined in a weighted median (WM). Wald estimates were calculated as the estimate for SNP on outcomes divided by the estimate for SNP on each single exposure. The IVW estimate assumes all the SNPs are valid instruments. In the absence of directional pleiotropy, it provides robust causal estimates. We aligned the SNPs on allele because none were palindromic.
Sensitivity analysis
We also used MR-Egger to test for potentially pleiotropic effects because it may generate correct estimates even when all SNPs are invalid instruments, as long as the assumption of instrument strength independent of direct effect (InSIDE) is satisfied [68]. MR Egger allows free estimation of the intercept, although further assumptions, such as the independence between instrument strength and direct effects, cannot be easily verified. Average directional pleiotropy across genetic variants was assessed from the p-value of the intercept term from MR-Egger [68]. A statistically significant intercept term implies the presence of unbalanced pleiotropy; causal estimates in MR-Egger are less precise than those in inverse variance-weighted MR [69]. Analysis using MR-Egger has a lower false positive rate but a higher false negative rate than IVW [70]. The WM estimate, as the weighted median of the SNP-specific estimates, provides correct estimates as long as SNPs accounting for ≥ 50% of the weight are valid instruments. WM MR permits some variants to be invalid instruments provided at least half are valid. It uses IVW and bootstrapping to estimate confidence intervals (CIs) [68].
To assess heterogeneity between individual genetic variants estimates, we performed the Q′heterogeneity statistic [71] and the MR pleiotropy residual sum and outlier (MR-PRESSO) [71] test. The Q′statistic uses modified 2nd-order weights that are a derivation of a Taylor series expansion and take into account uncertainty in both the numerator and denominator of the instrumental variable ratio (this eases the no-measurement-error, NOME, assumption) [71]. The MR-PRESSO framework relies on the regression of variant-outcome associations on variant-exposure associations and implements a global heterogeneity test by comparing the observed distance (residual sums of squares) of all variants to the regression line with the distance expected under the null hypothesis of no pleiotropy [72].
In the case of evidence of horizontal pleiotropy, the test compares individual variants’ expected and observed distributions to identify outlier variants [72]. We consider as results causal estimates that agree in direction and magnitude across MR methods, with pass nominal significance in IVW MR and without bias from horizontal pleiotropy in heterogeneity tests [72]. Furthermore, we applied on MR-Robust Adjusted Profile Score (RAPS); this method is able to correct for pleiotropy using robust adjusted profile scores [72]. We used R software (Version 3.4.2 R Core Team, 2017). The first-stage regression, or F, statistic was used to assess the strength of the analysis [73].
Ethics
This investigation uses published or publicly available summary data. No original data were collected for the present study. Ethical approval for each of the studies included in the present analysis can be found in the original publications (including informed consent from each subject). The study conforms to the ethical guidelines of the 1975 Declaration of Helsinki.
Results
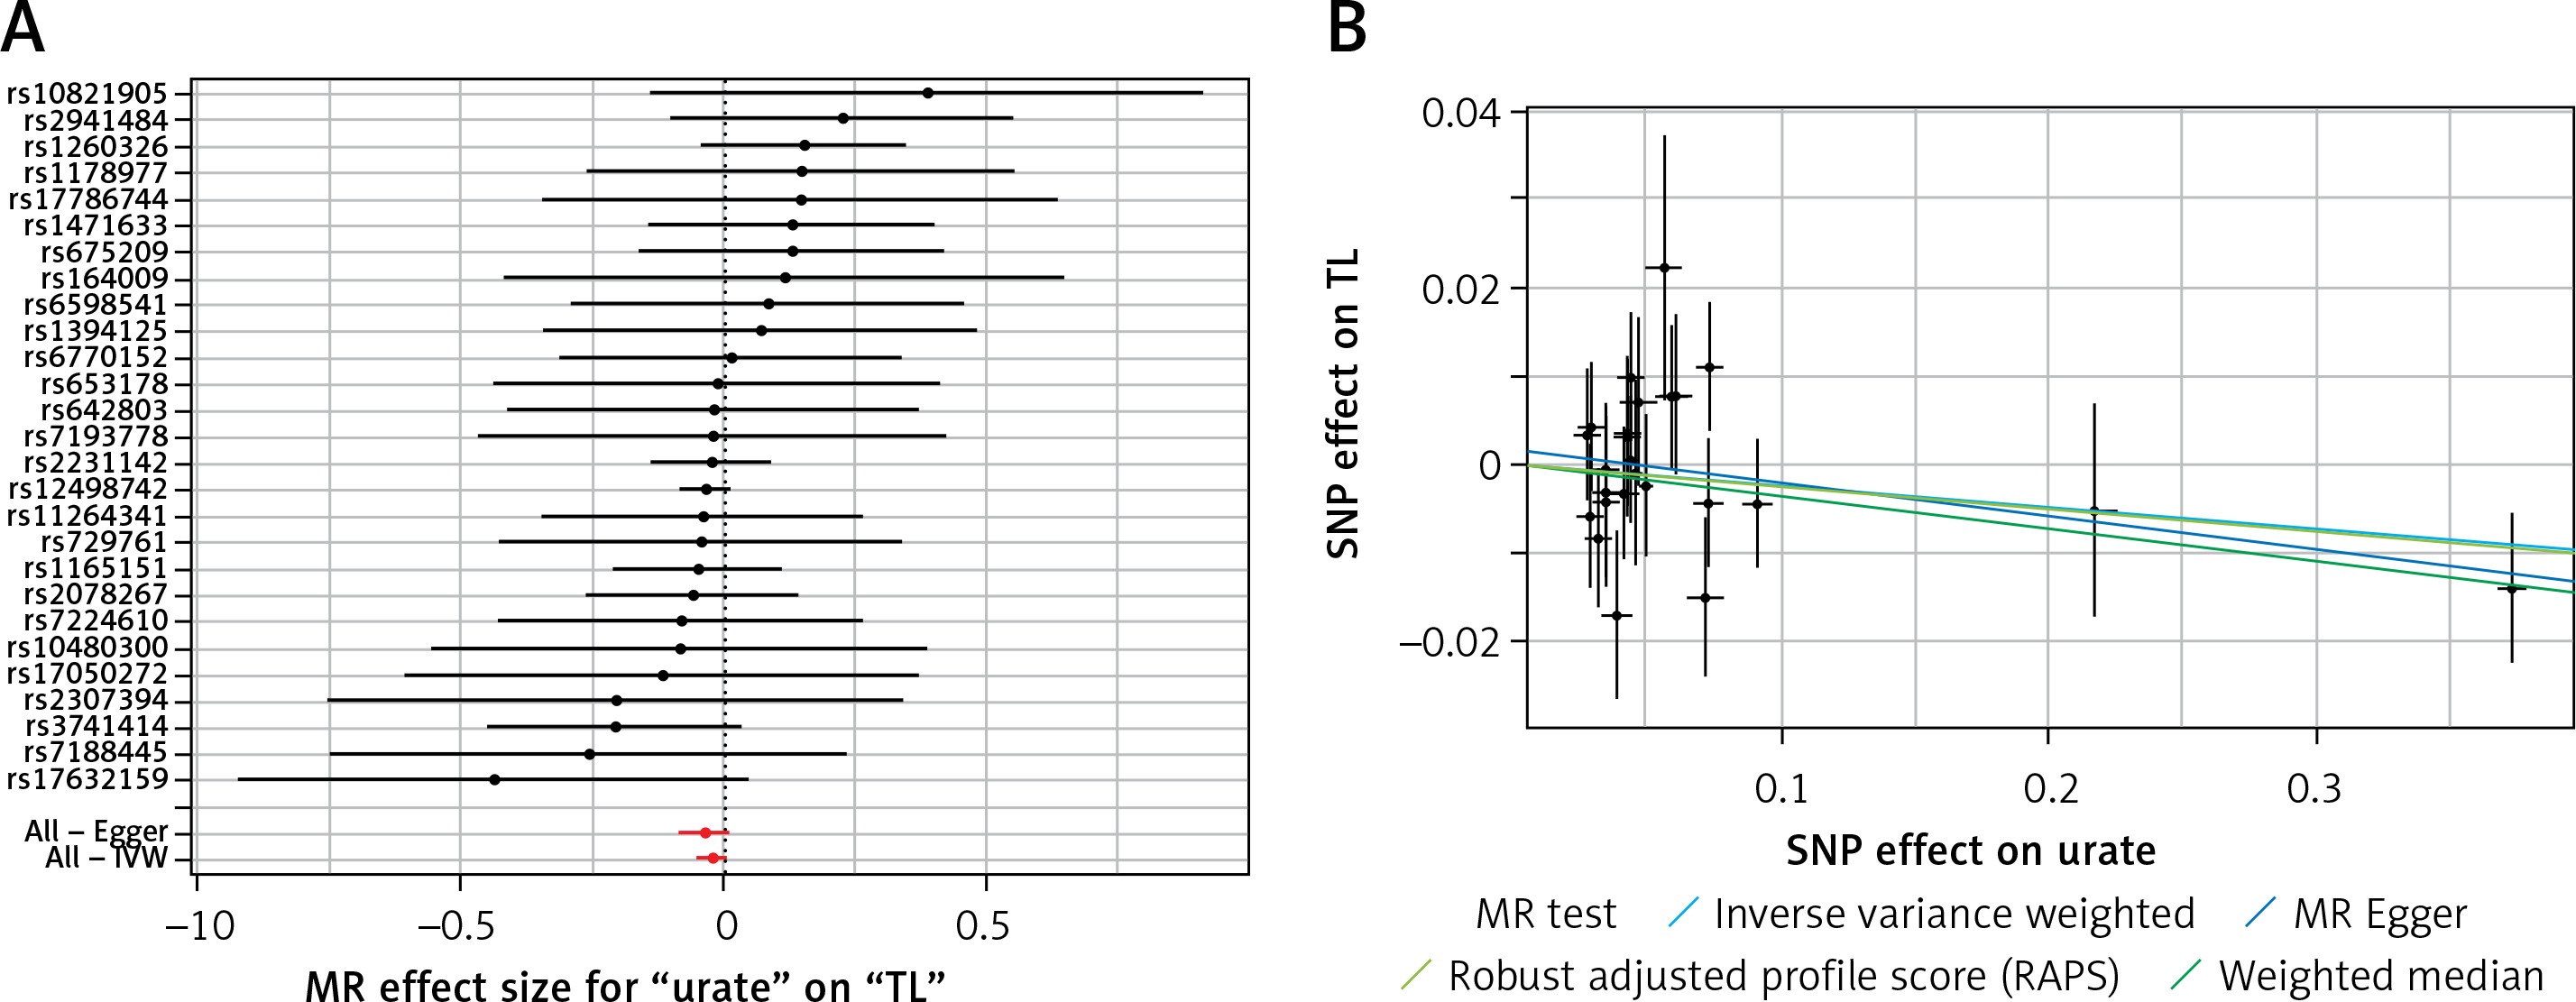
A list of all instruments associations for exposures is shown in Table I. The results, expressed as β-coefficient for exposures per one standard deviation (SD) increase in outcomes, are presented in Table II. The instruments have F statistics ranging from 96 to 563, making it unlikely that there was a significant bias from the use of weak instruments [73]. Adiponectin did not affect TL in all 4 types of tests (all p > 0.299, Table II). Results of the MR-Egger (p = 0.892) and IVW (p = 0.124) showed that bilirubin had no effect on TL, whereas the results of the WM (p = 0.030) and RAPS (p = 0.022) were negative, with higher bilirubin concentrations linked to shorter TL. With regard to CRP, all tests were in the same line and indicated no effect on TL (all p > 0.370, Table II). Similar results were found for leptin and SUA (all p > 0.108, Table II).
Table I
Summary results of the genetic loci of exposures
Table II
Results of MR analysis for all of exposure
Results of the forest and scatter plots for each outcome of interest are shown in Figures 1–5. With regard to adiponectin, none of the single SNPs had a significant effect (Figure 1 A). All but 2 of the bilirubin-increasing alleles of the 4 SNPs with a genome-wide significant association with bilirubin concentration were negatively associated with TL – rs6431558, near the gene encoding UGT1A8 (increase in glucuronidation metabolic ratios) (β = –0.122, SE = 0.0618, p = 0.0466) and rs7587051, near the gene encoding ATG16L1 (β = –0.913, SE = 0.267, p = 0.0006) (Figure 2 A). UGT1A8 rs6431558 is an intronic haplotype-tagging SNP associated with glucuronidation ratios, but to date there has been no supportive molecular function [74]. UGT1A8 has extrahepatic intestinal localization [74]. The ATG16L1 gene provides instructions for making a protein that is required for a process called autophagy. Cells use this process to recycle worn-out cell parts and break down certain proteins when they are no longer needed. Autophagy also plays an important role in controlled cell death (apoptosis). Additionally, autophagy is involved in the body’s inflammatory response and helps the immune system destroy some types of harmful bacteria and viruses [75]. SNPs of CRP, leptin, and SUA did not significantly affect TL (Figures 3 A, 4 A, and 5 A).
Figure 1
A – Forest plot for adiponectin showing that no single SNPs had a significant effect on telomere length. B – Scatter plot for adiponectin showing low heterogeneity (IVW p = 0.093)
TL – telomere length, SNR – single nucleotide polymorphisms, IVW – inverse variance weighted method, Adipo – adiponectin, MR – Mendelian randomization.
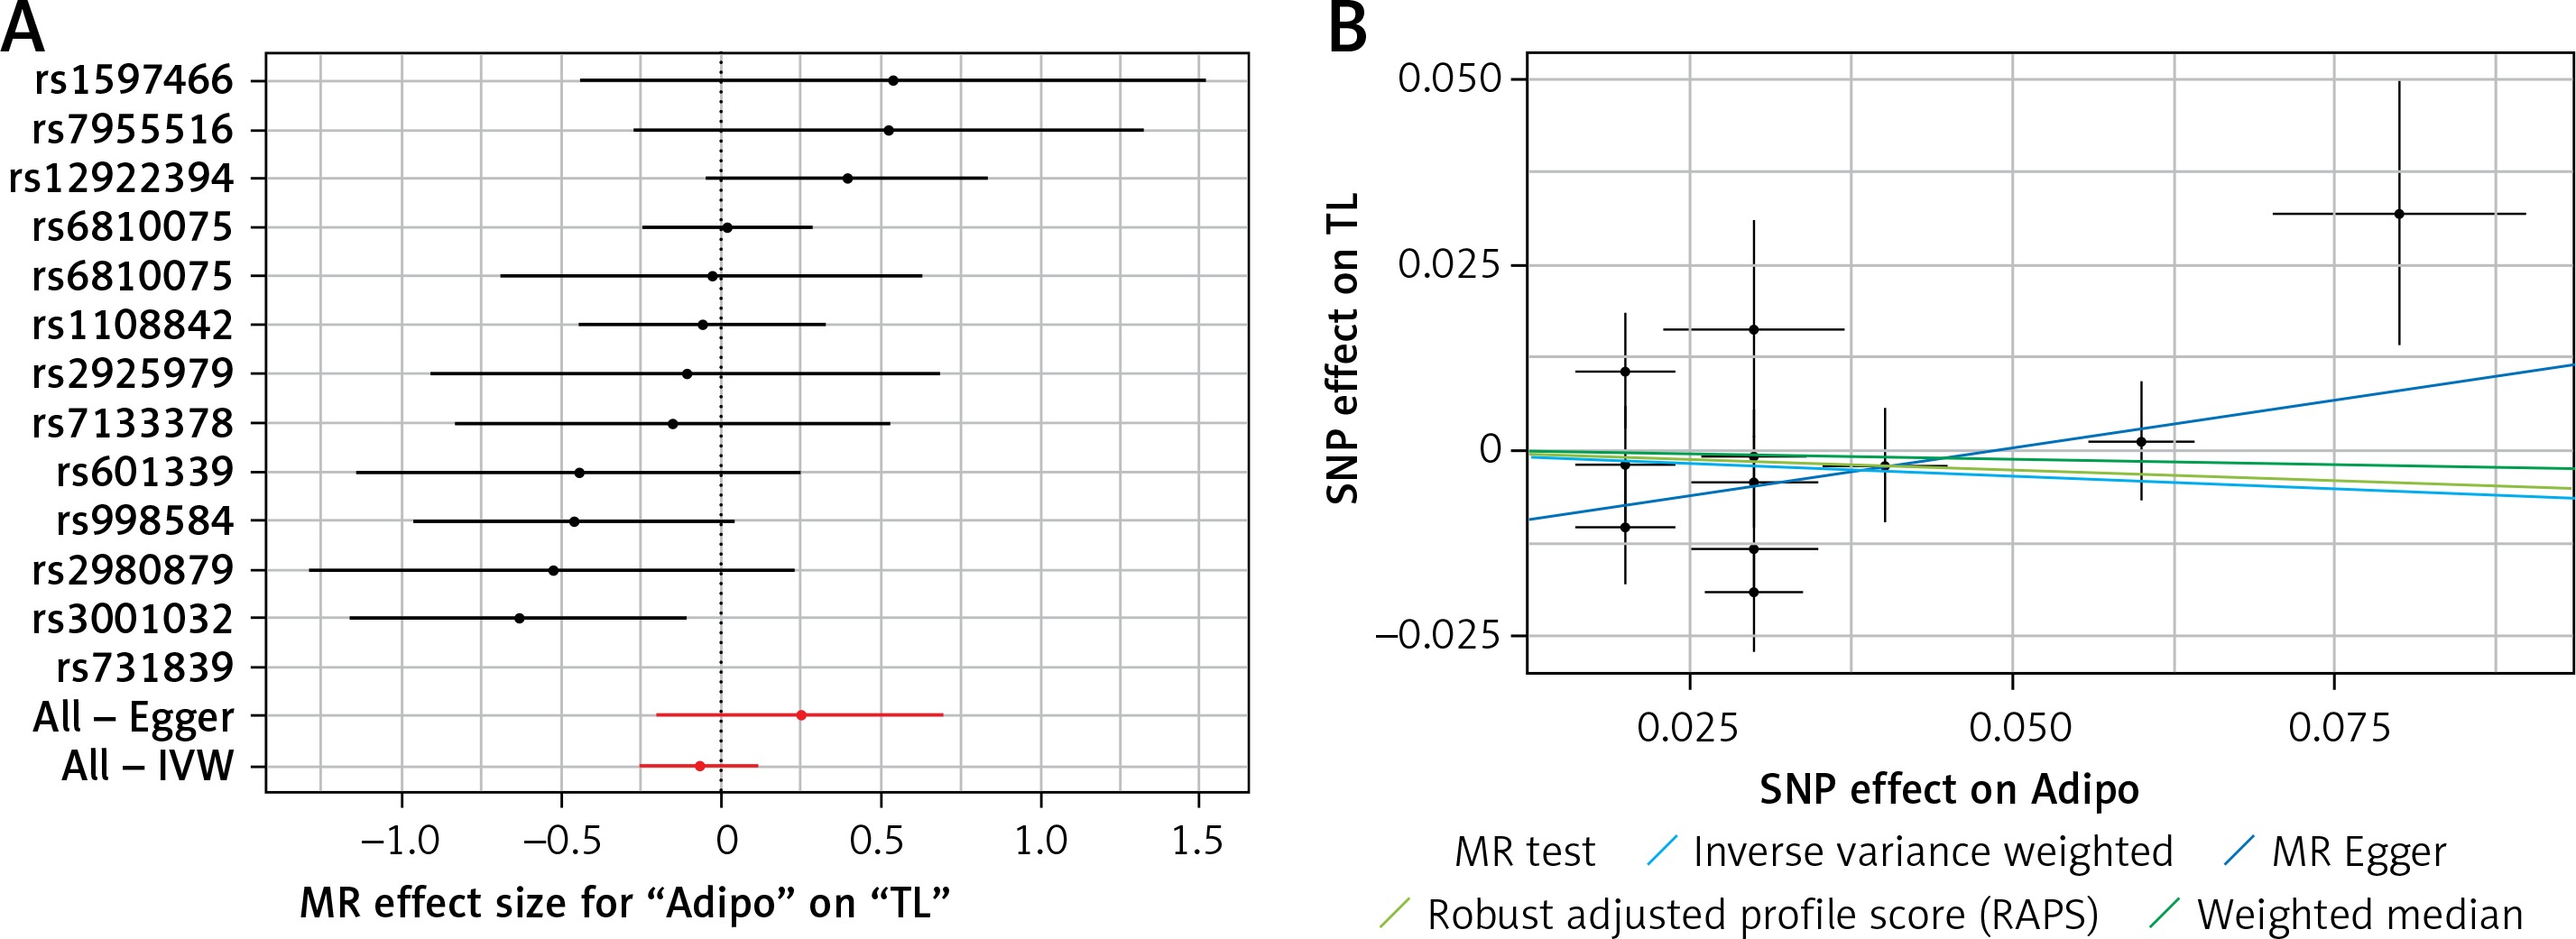
Figure 2
A – Forest plot for bilirubin showing that 2 out of 4 SNPs were negatively associated with telomere length (i.e. rs6431558 (β = –0.122, SE = 0.0618, p = 0.0466) and rs7587051 (β = –0.913, SE = 0.267, p = 0.0006)). B – Scatter plot for bilirubin showing heterogeneity (IVW p = 0.026; MR Egger’s p = 0.018)
TL – telomere length, SNR – single nucleotide polymorphisms, IVW – inverse variance weighted method, Bili – bilirubin, MR – Mendelian randomization.
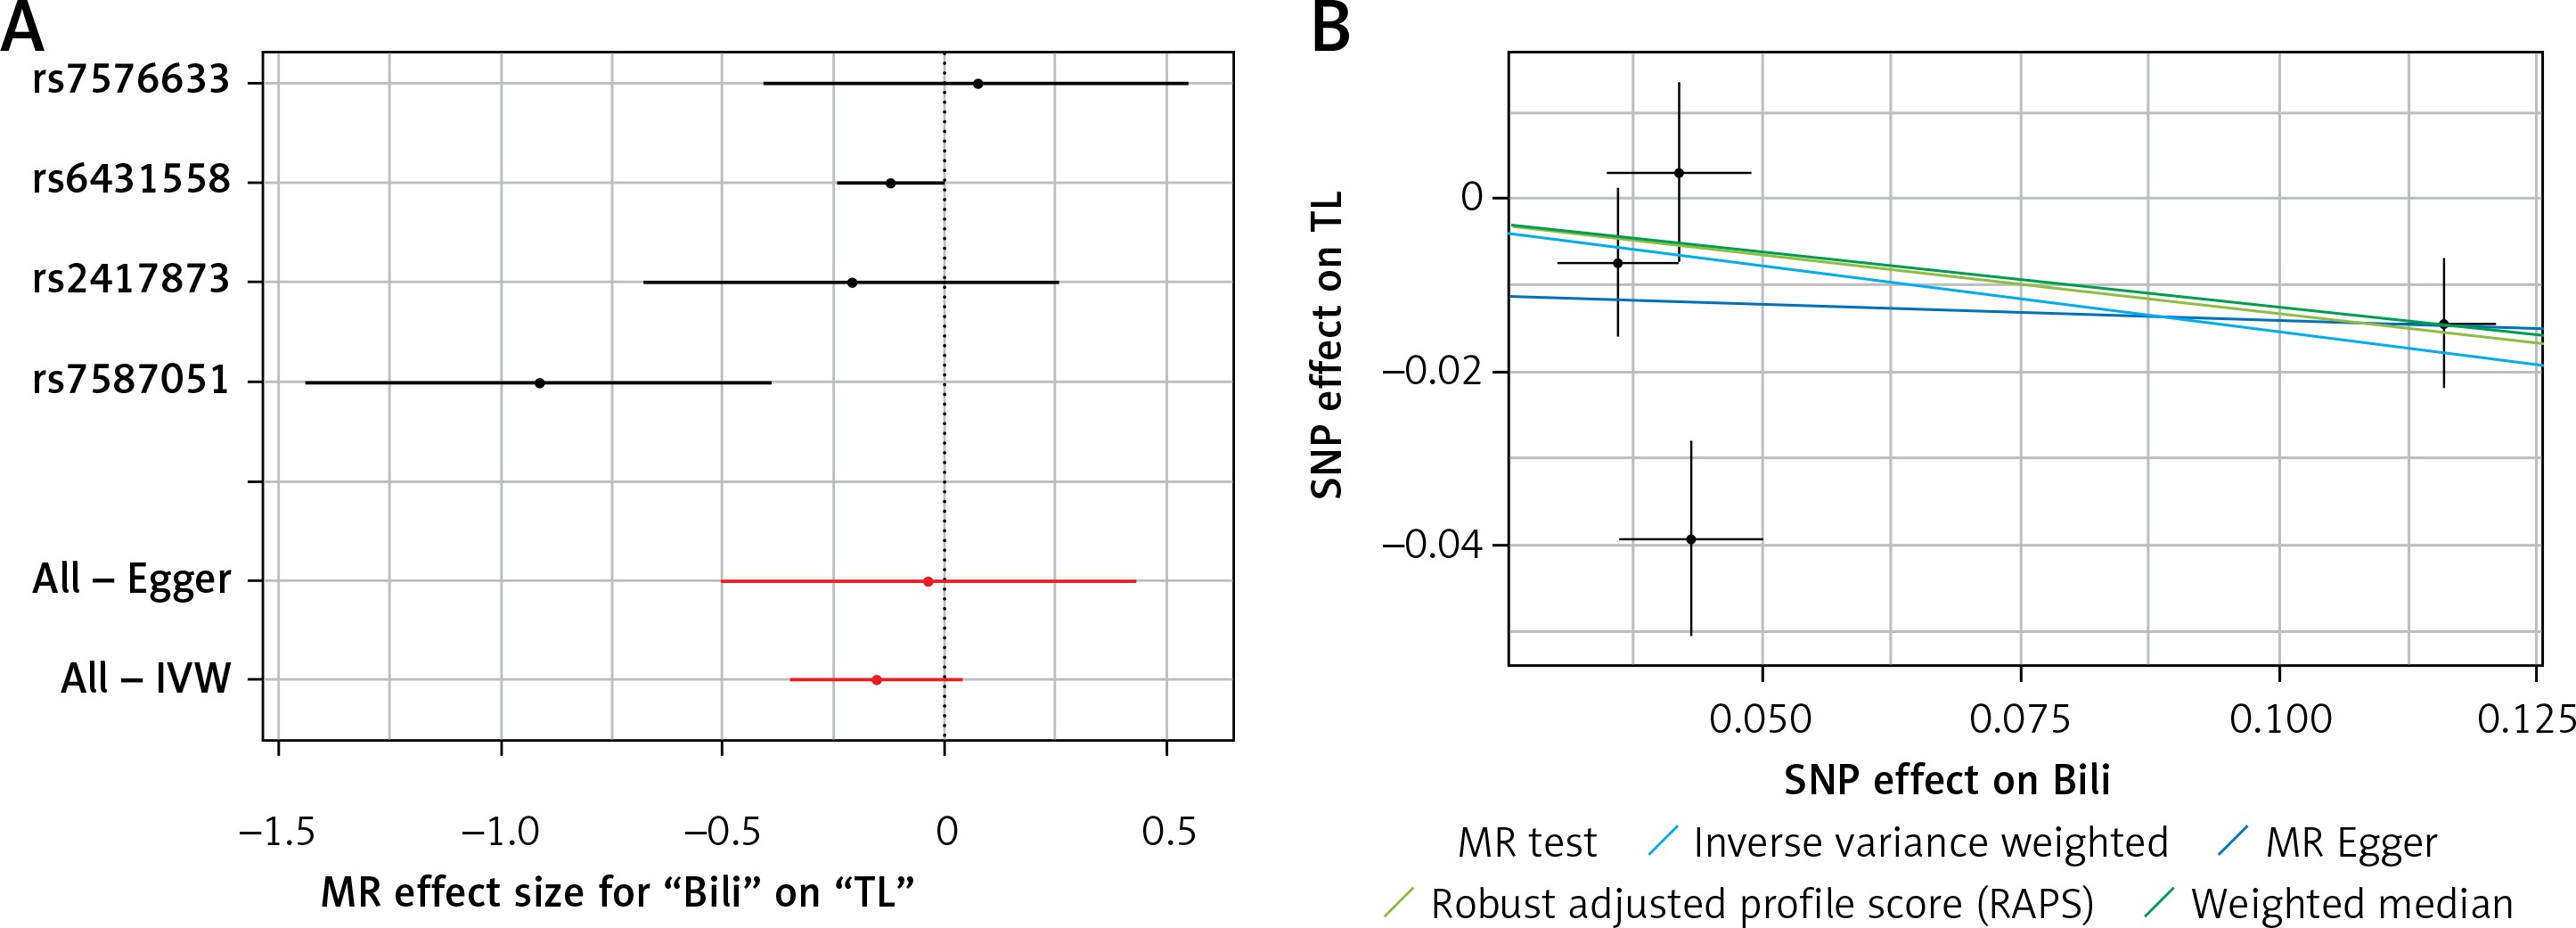
Figure 3
A – Forest plot for C-reactive protein (CRP) showing that no single SNPs had a significant effect on telomere length. B – Scatter plot for C-reactive protein (CRP) showing low heterogeneity (IVW p = 0.616)
TL – telomere length, SNR – single nucleotide polymorphisms, IVW – inverse variance weighted method, CRP – C-reactive protein, MR – Mendelian randomization.
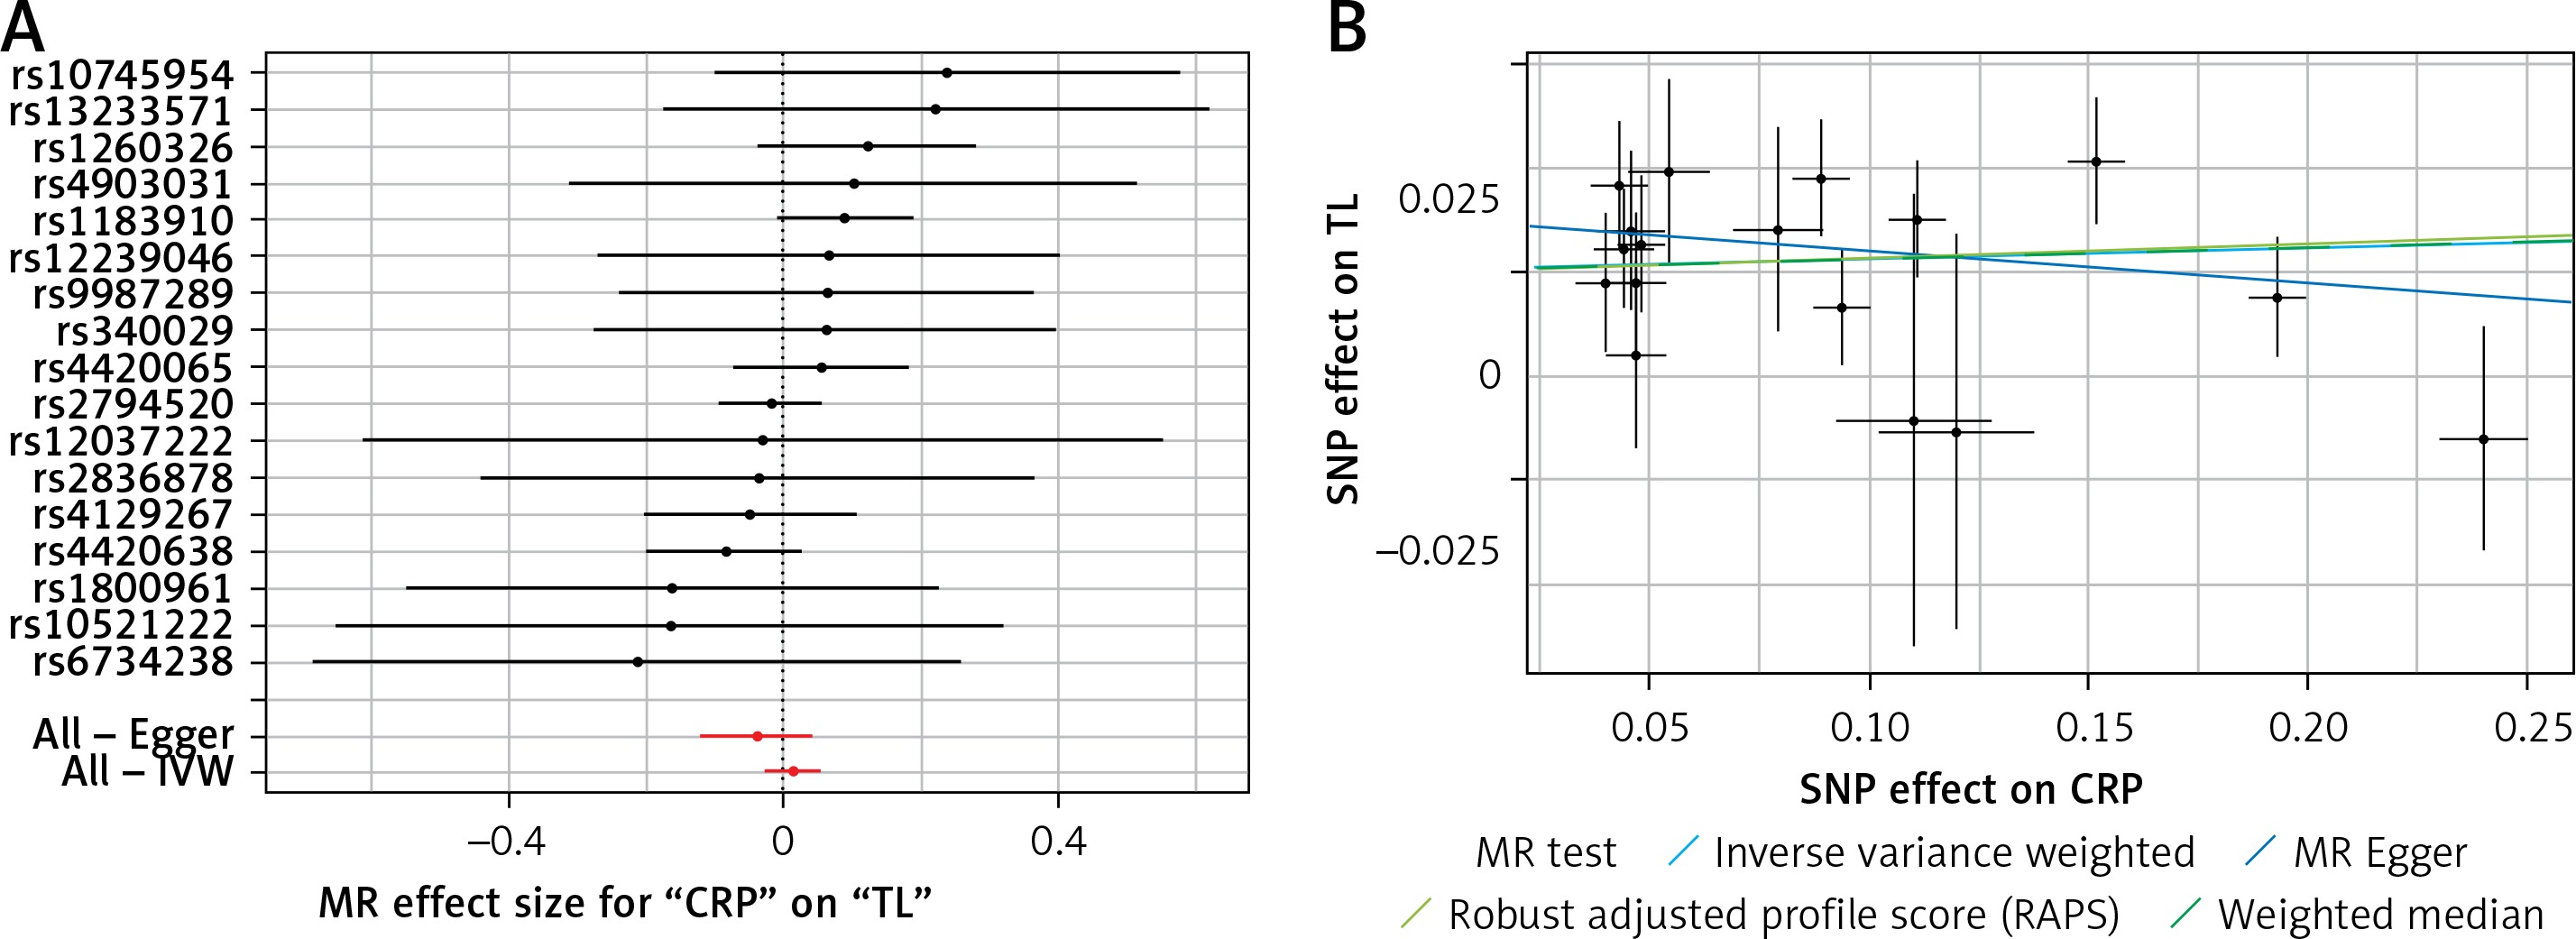
Figure 4
A – Forest plot for leptin showing that no single SNPs had a significant effect on telomere length. B – Scatter plot for leptin showing low heterogeneity (IVW p = 0.480)
TL – telomere length, SNR – single nucleotide polymorphisms, IVW – inverse variance weighted method, MR – Mendelian randomization.
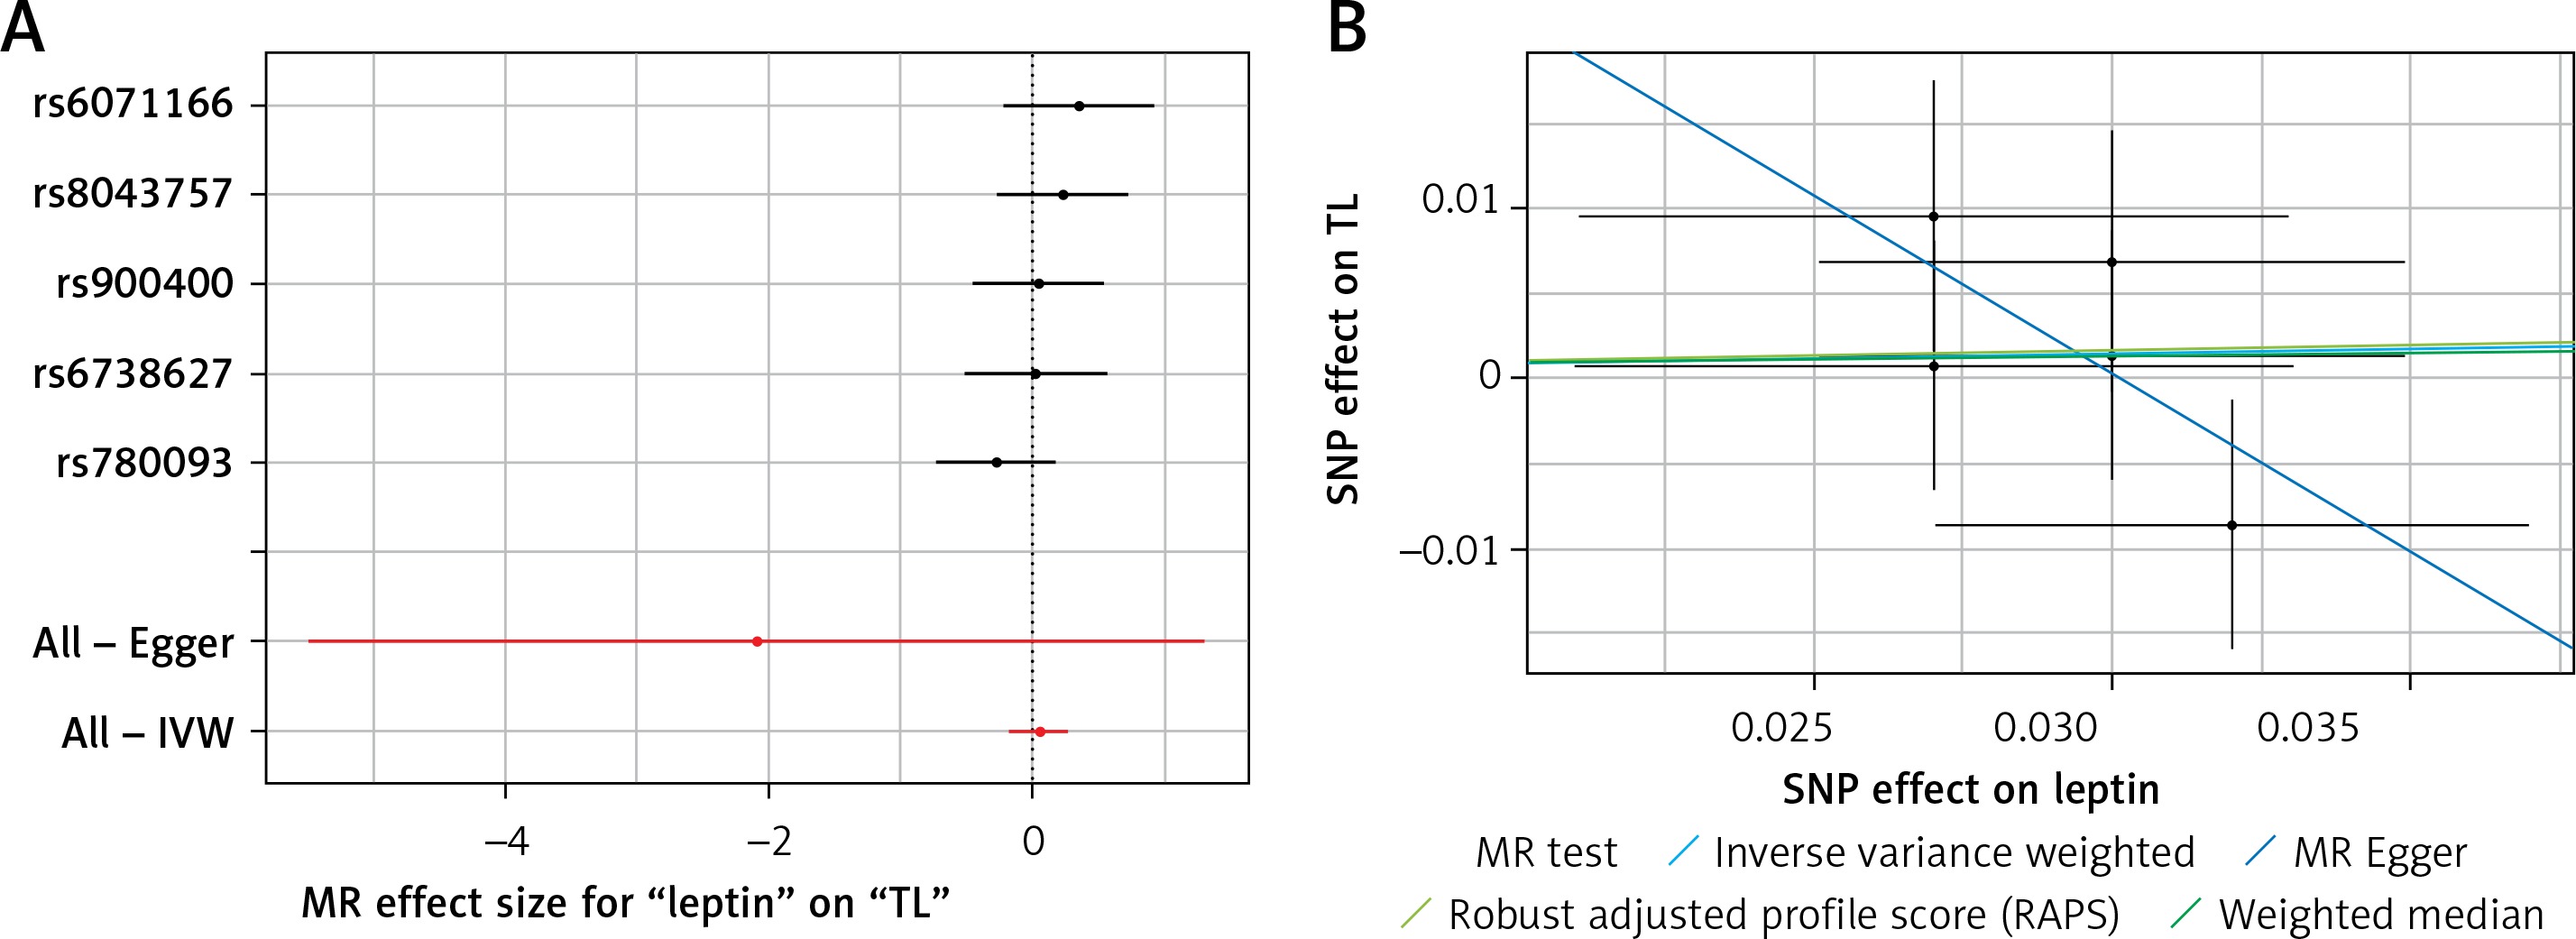
Figure 5
A – Forest plot for serum uric acid showing that no single SNPs had a significant effect on telomere length. B – Scatter plot for serum uric acid showing low heterogeneity (IVW p = 0.829)
TL – telomere length, SNR – single nucleotide polymorphisms, IVW – inverse variance weighted method, MR – Mendelian randomization.
Results of heterogeneity and pleiotropy bias are shown in Table II. There was a low heterogeneity for adiponectin (IVW p = 0.093), CRP (IVW p = 0.616), leptin (IVW p = 0.480), and SUA (IVW p = 0.829). In contrast, there was heterogeneity for bilirubin (IVW p = 0.026, MR Egger’s p = 0.018, Table II, Figures 1 B to 5 B). Analysis of MR-PRESSO did not find outliers for all instrumental variables. The pleiotropy test, with very negligible intercept, also indicated low likelihood of pleiotropy for all of our estimations (all p > 0. 0.161, Table II).
Discussion
In the present analysis, the effect of genetically programmed anti- and pro-inflammatory markers (i.e. leptin, adiponectin, bilirubin, CRP, and SUA) on TL was investigated by applying the MR method. Neither anti-inflammatory nor pro-inflammatory markers were shown to affect TL. There was no evidence to imply that pleiotropy, heterogeneity, or outliers biased these results.
There is growing interest in identifying the factors that influence TL and thus longevity [76, 77]. Increased oxidative stress is one of the major pathogenetic factors in metabolic diseases [78]. Adiponectin exerts antioxidant as well as insulin-sensitizing, anti-atherogenic, and anti-inflammatory properties, thus protecting against metabolic disorders and accelerated aging [41, 79, 80]. Furthermore, hypoadiponectinaemia has been related to several chronic diseases such as cardiovascular disease [81–85], chronic kidney disease [86–88], dementia, and T2DM [89]. It is speculated that adiponectin may protect against cardiometabolic disorders, in part, via affecting TL. In obese rats, endothelial dysfunction was reversed by adiponectin via the production of nitric oxide (NO) by NO synthase phosphorylation and by declining NO inactivation through blockage of the superoxide production [90]. In the same line, hyperleptinaemia has been associated with inflammation, insulin resistance, glucose intolerance, and atherosclerosis [91]. Furthermore, leptin may be involved in stress-induced cardiovascular hyperactivity by increasing circulating catecholamine levels, heart rate, and blood pressure [35, 92].
Our results are consistent with previous reports that have not found an association between TL and inflammatory cytokines [93, 94]. Cellular hypoxia and cell size of adipocytes were negatively related to adiponectin secretion and synthesis [93, 94]. A study in obese and T2DM patients reported that adipocyte hypertrophy (in both visceral and subcutaneous adipose tissue) was associated with shortened telomeres [93, 94]. This significant link between TL and hypoadiponectinaemia was lost after adjusting for adipocyte cell size [47]. Diaz et al. found no linear associations of TL with leptin and adiponectin, even after adjustments for race or gender [40]. TL was also not associated with adipocytokines in children aged 5–12 years [34, 95]. Zhu et al. studied 667 adolescents (aged 14–18 years, 48% black, 51% girls) and reported that race, gender, adiposity, adipokines (leptin and adiponectin), and physical activity did not affect TL [39]. Similarly, Hardikar et al. found no significant association between TL and leptin or adiponectin in 295 individuals with Barrett’s oesophagus [33, 96].
In contrast, a cross-sectional study (n = 193 non-diabetic and T2DM patients without complications; 97 males) demonstrated that adiponectin had a positive significant association with TL [41, 79]. Moreover, an inverse association between leptin and leukocyte TRFL in premenopausal, but not post-menopausal, women has been reported [45]. However, we need to consider these results with caution [45]. Decreased levels of oestrogen and redistribution of body fat can change leukocyte telomere attrition [45]. Two other studies found negative associations between TL and leptin levels [42, 44]. Furthermore, a meta-analysis, including 7 independent cohorts with a total of 11,448 participants, reported an inverse association between leptin and TL but no association between adiponectin and TL [91]. However, as in any other observational study, the authors did not consider all confounding factors related to TL (such as pollutant and dietary factors), which may have increased the chance of bias, which is inevitable for epidemiological studies. TL measurements may differ in studies, which might be considered as another source of heterogeneity [97]. In the same line, leptin and adiponectin biochemical assays measure different oligomeric forms of these adipokines (i.e. low, medium, and high molecular weight forms) that might exert different functions [98–100].
The guanine residues of telomeric DNA sequences are susceptible to oxidative stress [101]. When DNA double-strand breaks at telomeric regions is promoted, the distal fragment is lost, and therefore telomeres shorten [102]. SUA can react with hydroxyl radicals; peroxyl and hydroperoxyl superoxide radicals are scavenged by SUA via binding with transition metals, thus preventing the production of free radicals [103]. Ames et al. hypothesized that circulating SUA is close to its maximum solubility, thus potentially protecting against oxygen radicals and subsequently leading to lifespan increase [104]. Therefore, increased SUA levels could be associated with longer leukocyte telomeres. In contrast, Bekaert et al. found a negative age-adjusted association between TRFL and SUA [25]. However, some confounding factors such as smoking status were not considered in this study. In another study involving 143 elderly Dutch men (mean age: 83.9 years) and 109 Greek elderly men (mean age: 84.6 years), SUA was positively related to TL [59]. These findings cannot be generalized to women or other ages, and the sample size was small compared with other studies.
Regarding bilirubin, our findings are in line with those of Pereira et al. that showed no association between TL and indirect bilirubin in 91 sickle cell adult patients and 188 controls [55]. Similarly, no relationship between total bilirubin and peripheral blood leukocyte TL was found in 114 patients with biliary atresia and 114 age-matched healthy controls [56, 105, 106].
CRP plays an important role in chronic diseases via low-grade inflammation [29], increased cell turnover in the bone-marrow, and alterations in the leukocyte distribution [107]. CRP could increase the phagocytosis by macrophages and in turn production of oxygen free radicals [22]. Considering the fact that telomeres are highly sensitive to damage by oxidative stress [17], we speculated that CRP may damage telomeric DNA by enhancing oxygen free radicals. Our finding of no association between CRP and TL is in agreement with other studies reporting no relationship between CRP and TL in a case-cohort study on 1525 post-menopausal women (667 African American and 858 whites) from the Women’s Health Initiative [32], as well as in a cross-sectional analysis of 1136 Cardiovascular Health Study (CHS) participants [31]. In another prospective cohort study involving 780 patients with stable CAD, CRP also did not correlate with TL [30] as well as in the FHS (in individuals at risk of atherosclerosis) [29] and in high-functioning elderly (aged 70–79 years) in the Health, Aging, and Body Composition Study [104]. However, there are conflicting results showing significant association between CRP and TL. For example, a cohort of 1000 relatively healthy 10-year-old Scots (the Lothian Birth Cohort of 1936) found longer telomeres related to lower CRP levels [24]. A cross-sectional study, involving 77 patients with Cushing’s syndrome and 77 controls, showed that CRP was negatively associated with TL [26]. Solorio et al. also reported an inverse relationship between TL and CRP concentrations in 40 subjects aged 53.9 years (20 per group) [27]. Similarly, the Ten Town Heart Health Study of European and South Asian adolescents (n = 1080) aged 13-16 years found a negative link between CRP and TL [108]. Interestingly, Aviv et al. [45] and Fitzpatrick et al. [10] observed that TRFL and CRP were inversely associated in younger participants but not in older ones. However, these studies have limitations such as the small sample size and not taking into consideration confounding factors such as drug therapy. In another study, 3256 American Indians (14–93 years, 607 women) participating in the Strong Heart Family study were analysed [30]. Multivariate analysis demonstrated that TL was significantly and inversely associated with CRP levels [28]. However, there was an increased prevalence of obesity and T2DM in this study, with participants having distinct genetic and lifestyle risk profiles. Furthermore, not all confounding factors were excluded.
Our analysis has certain strengths and limitations. Our approach, MR, is a powerful tool for detection of the causal impact, which provides an advantage compared with former observational studies. Moreover, we benefited from the largest GWAS on our interested exposure and TL. However, MR analysis has its limitations. Therefore, the lack of findings in our analysis might be due to small causal effects that were not detectable. Our study used genetic instruments and estimation of genetic associations using GWAS, which were mainly based on a sample of European ancestry. It is known that telomere dynamics may vary by ethnicity. The difference might affect the generalizability of our findings, and therefore the results of our study should be interpreted with caution for other races. Also, we measured TL in leukocytes; the results may have been different if another tissue source had been used. However, because of the accessibility and the relative non-invasive nature of sample collection, leukocytes are used as sources to measure TL in most epidemiological studies, as in the present study.
In conclusion, the present analysis found that genetically programmed selected anti- and pro-inflammatory markers had no significant impact on TL, a biological index of aging. These markers included leptin, adiponectin, bilirubin, and CRP. These findings are based on MR analysis, which can overcome several limitations of clinical and observational studies. However, further research in this field is needed to elucidate the factors that affect TL and, subsequently, longevity. The casual role of bilirubin on TL needs to be further investigated.
Conflict of interest
NK has given talks, attended conferences and participated in trials sponsored by Amgen, Angelini, Astra Zeneca, Boehringer Ingelheim, MSD, Novartis, NovoNordisk, Sanofi, and WinMedica. DPM has given talks and attended conferences sponsored by Amgen, AstraZeneca, and Libytec. The other authors have no conflict of interest to declare.