Introduction
Non-alcoholic fatty liver disease (NAFLD) is a complex worldwide health issue encompassing a range of liver illnesses characterised by the abnormal buildup of fat in the liver, unrelated to alcohol consumption [1–3]. NAFLD encompasses a range of liver disorders, starting with the buildup of fat in the liver (steatosis) and progressing to non-alcoholic steatohepatitis (NASH), which can ultimately lead to cirrhosis and hepatocellular carcinoma [4, 5]. Steatohepatitis is a multifaceted disorder characterised by the buildup of fat in the liver along with inflammation. Its development is typically attributed to a 2-step process [6]. During the initial phase, the liver experiences an increase in fat buildup due to insulin resistance and de novo lipogenesis. During the second stage, the occurrence of oxidative stress and endoplasmic reticulum stress leads to the production of proinflammatory cytokines, resulting in inflammation and damage to hepatocytes. This process can result in the activation of immune cells and the development of fibrosis, ultimately leading to the progression of liver damage [2]. Hepatic lipidosis, also known as fatty metamorphosis, is defined by the accumulation of fat in the liver. Numerous factors, including alcohol consumption, metabolic syndrome, type 2 diabetes, malnutrition, some medications and toxins, rapid weight loss, and genetic/metabolic disorders, can contribute to this condition [7, 8]. The interaction of these factors determines the severity and progression of the disease [3, 9]. Hence, ongoing research is being conducted on various approaches for the management and treatment of NAFLD [10, 11]. There is growing evidence suggesting that dietary behaviours may significantly influence the development and progression of NAFLD [12–16]. In this situation, it has become more and more important to study how certain nutrients and eating habits can speed up or slow down the progression of NAFLD, as well as how they can affect the development and treatment of the disease. The overconsumption of foods that are high in calories but low in nutrients, such as those containing high amounts of sugar and refined carbohydrates, has been linked to the development of NAFLD [17]. Wheat flour bread, a dietary staple in numerous societies, has refined carbohydrates that can induce fast variations in blood glucose levels [18]. These carbohydrates can result in rapid elevations in blood sugar levels and the subsequent development of insulin resistance, which is a significant factor contributing to NAFLD [19].
The yeast Saccharomyces cerevisiae undergoes fermentation of the simple sugars in the dough, leading to the production of carbon dioxide (CO2), which causes the dough to rise. Additionally, other fermentation byproducts contribute to the maturation and development of scent in the dough [20]. Baker’s yeast, which is frequently utilised in bread production, comprises constituents, including mannose oligosaccharides, that have the potential to modify the composition of the gut microbiota [20, 21]. When the gut microbiome is out of balance, this is called dysbiosis, and it may make NAFLD worse by causing inflammation and metabolic problems [22, 23]. Baker’s yeast, a crucial component in the process of bread manufacturing, has purine molecules that can be converted into uric acid during metabolism. Elevated levels of uric acid have been linked to insulin resistance and could potentially contribute to the development of NAFLD [24].
This study aims to evaluate the clinical impact of 3 different dietary approaches (a diet restricted in wheat flour, yeast, and calorie restriction) on developing and treating NAFLD. It will examine the effects of these dietary strategies on the fatty liver and explore the potential of nutritionally based approaches to managing the disease. In this context, the discoveries may provide significant progress in the development of improved and personalised dietary approaches for the management of NAFLD patients.
Material and methods
Participants and study design
This study was conducted to evaluate the effects of different dietary strategies in patients diagnosed with NAFLD. The study had a prospective, randomised, controlled design. The research was conducted on adult individuals who applied to the Ataturk University University Endocrinology and Metabolism outpatient clinic and were diagnosed with NAFLD. Those < 18 years old, with other chronic liver diseases, who consumed alcohol (> 30 g/day for men, > 20 g/day for women), who were pregnant, breastfeeding, or those who had difficulty complying with special dietary restrictions were excluded from the study.
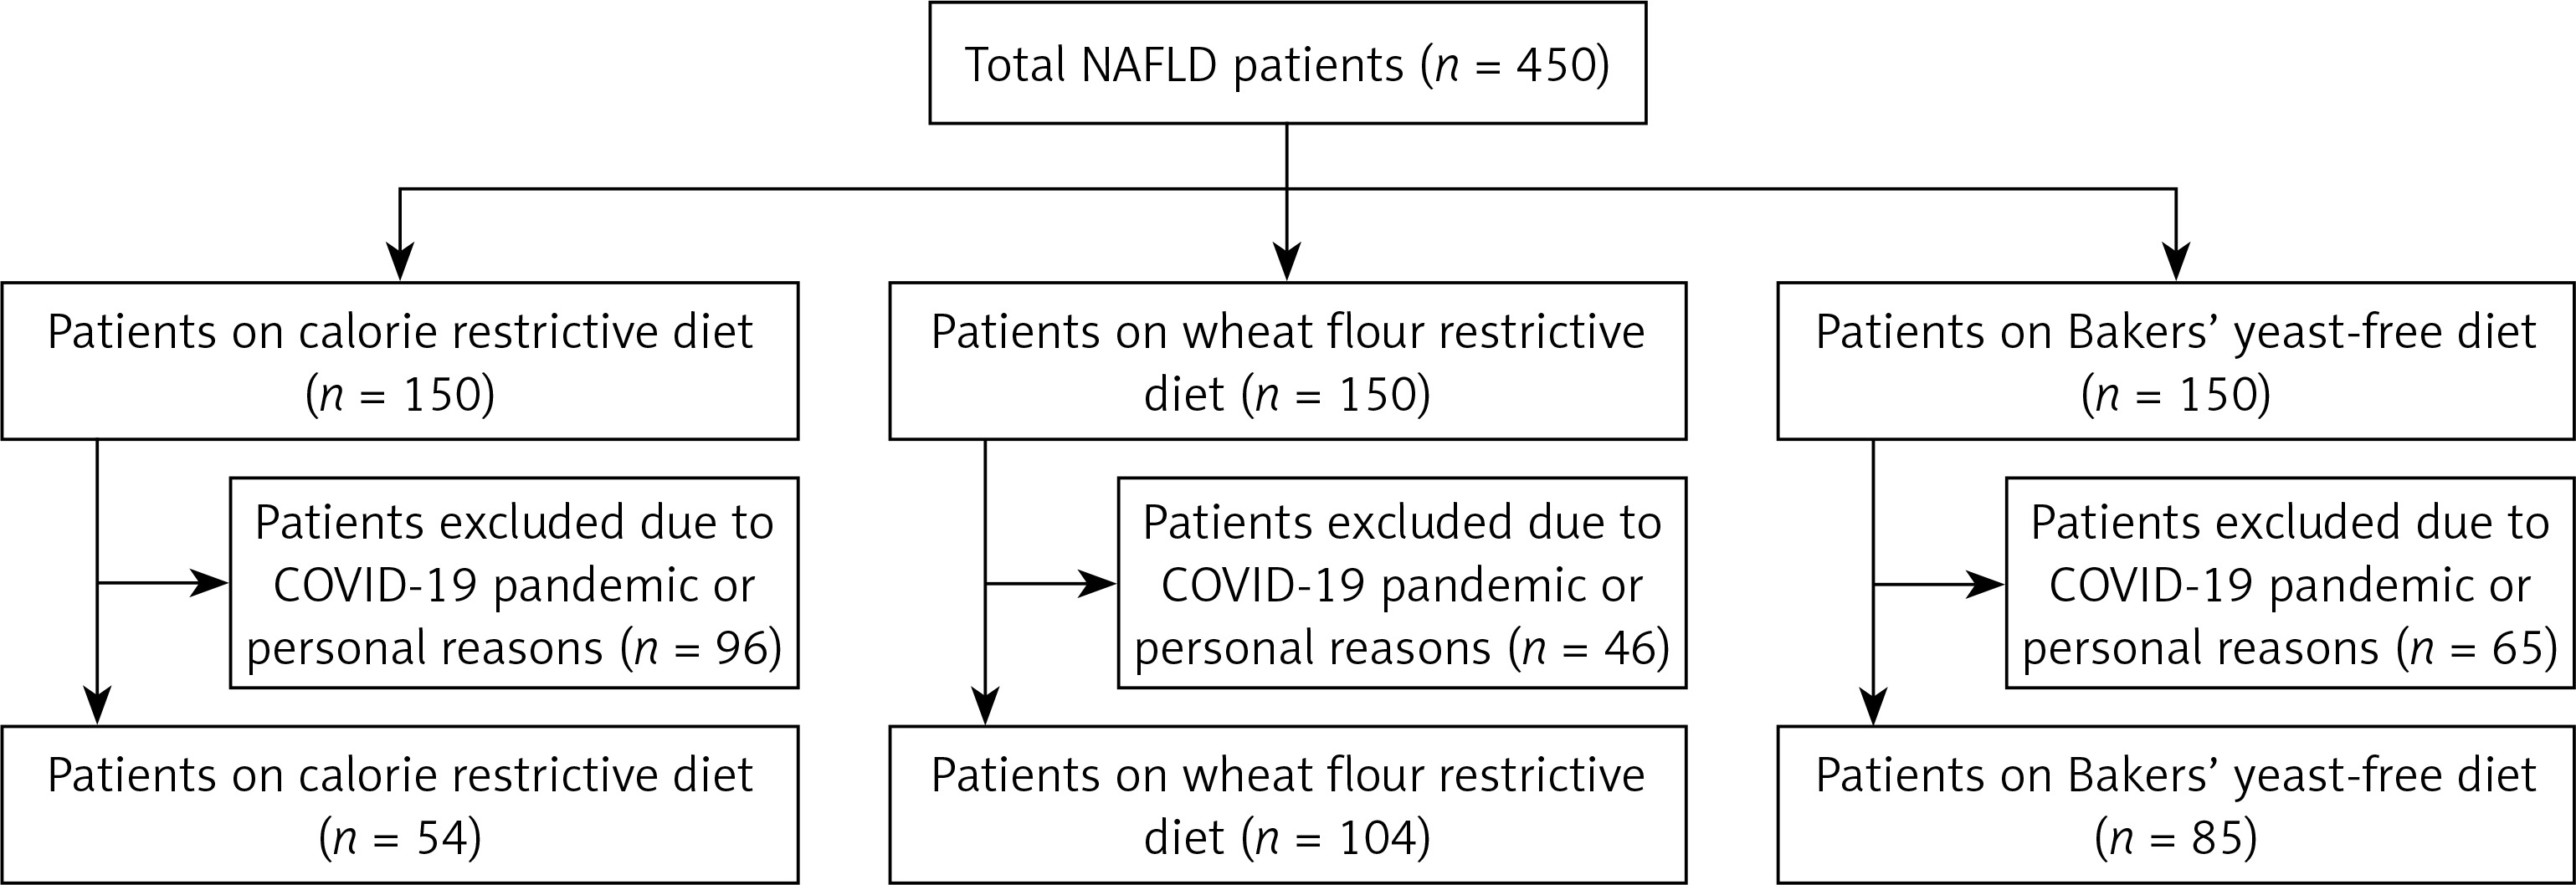
The study, with a statistical power of 88%, a type 1 error rate of 0.04, and an effect size of 0.5, required a minimum sample size of 54 for each of the 3 groups. Those with other chronic liver diseases, those who consumed alcohol (> 30 g/day for men, > 20 g/day for women), and those who were pregnant or breastfeeding were excluded from the study. The study comprised a total of 450 patients diagnosed with NAFLD, who were listed sequentially, with each patient assigned a number from 1 to 450. Subsequently, they were allocated into three groups by a random selection process, with each group consisting of 150 patients. The randomisation process was conducted in the following manner: patient number 1 was allocated to Group 1, patient number 2 was allocated to Group 2, patient number 3 was allocated to Group 3, patient number 4 was allocated to Group 1, patient number 5 was allocated to Group 2, etc. Thus, patient 450 was allocated to group 3. Regrettably, due to the overlap of our study with the COVID-19 pandemic period and some patients having difficulty complying with special dietary restrictions, a total of 96 patients from the first group, 46 patients from the second group, and 65 patients from the third group were unable to complete the study. The CONSORT flow diagram is given in Figure 1.
Patients were divided randomly into 3 intervention groups.
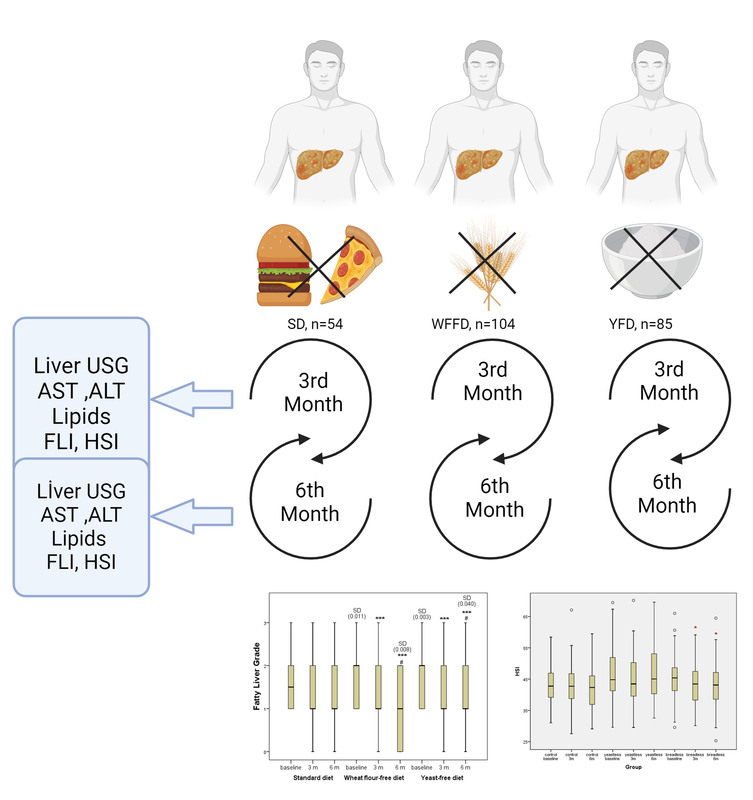
Group (1) (standard diet, SD, n = 54): This group was fed a generally recommended calorie restriction diet. There was no restriction on wheat flour and yeast, and there was no intervention in the daily nutritional composition of their food intake.
Group (2) (wheat flour-free diet, WFFD, n = 104): This group followed a wheat flour-free diet, so they were obtained carbohydrates in their diet from legumes, vegetables, and fruits instead of wheat flour.
Group (3) (baker’s yeast-free diet, YFD, n = 85): This group adopted a baker’s yeast-free diet. They consumed bread without yeast, just with wheat flour and water.
Each group followed a specific diet plan determined by the dietitian. Daily calorie intake and nutrient composition were determined to suit the individual’s energy needs and medical condition. Daily calorie needs of patients were determined by the World Health Organisation (WHO), calculated according to the formula: for men: weight (kg) × 24 × 1 kcal; for women: weight (kg) × 24 × 0.95 kcal. For obese individuals, the corrected weight formula was used. The diet duration was determined as 6 months. No additional physical exercise was recommended for all 3 groups other than walking 30 min/day, 150 min/week in total, 5 days a week, with no breaks for 2 consecutive days. The patients’ diet and exercise compliance were evaluated based on their own statements.
Measurements
Biochemical analyses
Liver ultrasonography and biochemical analyses were performed on the participants 3 times in total, before starting the diet (month 0) and at the end of the third and sixth months. Biochemical analyses included serum alanine aminotransferase (ALT), aspartate aminotransferase (AST), lipid profile (total cholesterol (TC), triglyceride (TG), low-density lipoprotein-cholesterol (LDL-C), and high-density lipoprotein-cholesterol (HDL-C) levels.
Hepatic Steatosis Index (HSI) and body mass index (BMI) measurements
Body mass index (BMI) was calculated for each participant. Each participant’s height (in metres) and weight (in kilograms) were measured. These measurements were performed by trained personnel. BMI was calculated by dividing the participants’ weight by the square of their height (BMI = weight (kg)/(height (m)2). The resulting BMI values were divided into standard categories: < 18.5 kg/m2 (underweight), 18.5–24.9 kg/m2 (normal weight), 25–29.9 kg/m2 (overweight), and ≥ 30 kg/m2 (obese).
The hepatic steatosis index (HSI) was used to assess patients’ NAFLD severity. Calculation of HSI was done with the following formula: HIS = 8 × ALT/AST ratio + BMI (+2 if diabetic, +2 if female) [25].
Fatty liver grade (FLG) evaluation
Evaluation of the NAFLD score was defined by liver ultrasonography. Ultrasonography has been used for objective assessment of hepatic fat accumulation and liver damage. All 3 ultrasonography measurements were made by the same radiologist, who was blinded to the study groups. Results were classified based on measured liver fat content. Representative ultrasound images of grading liver fat content are shown in Figure 2.
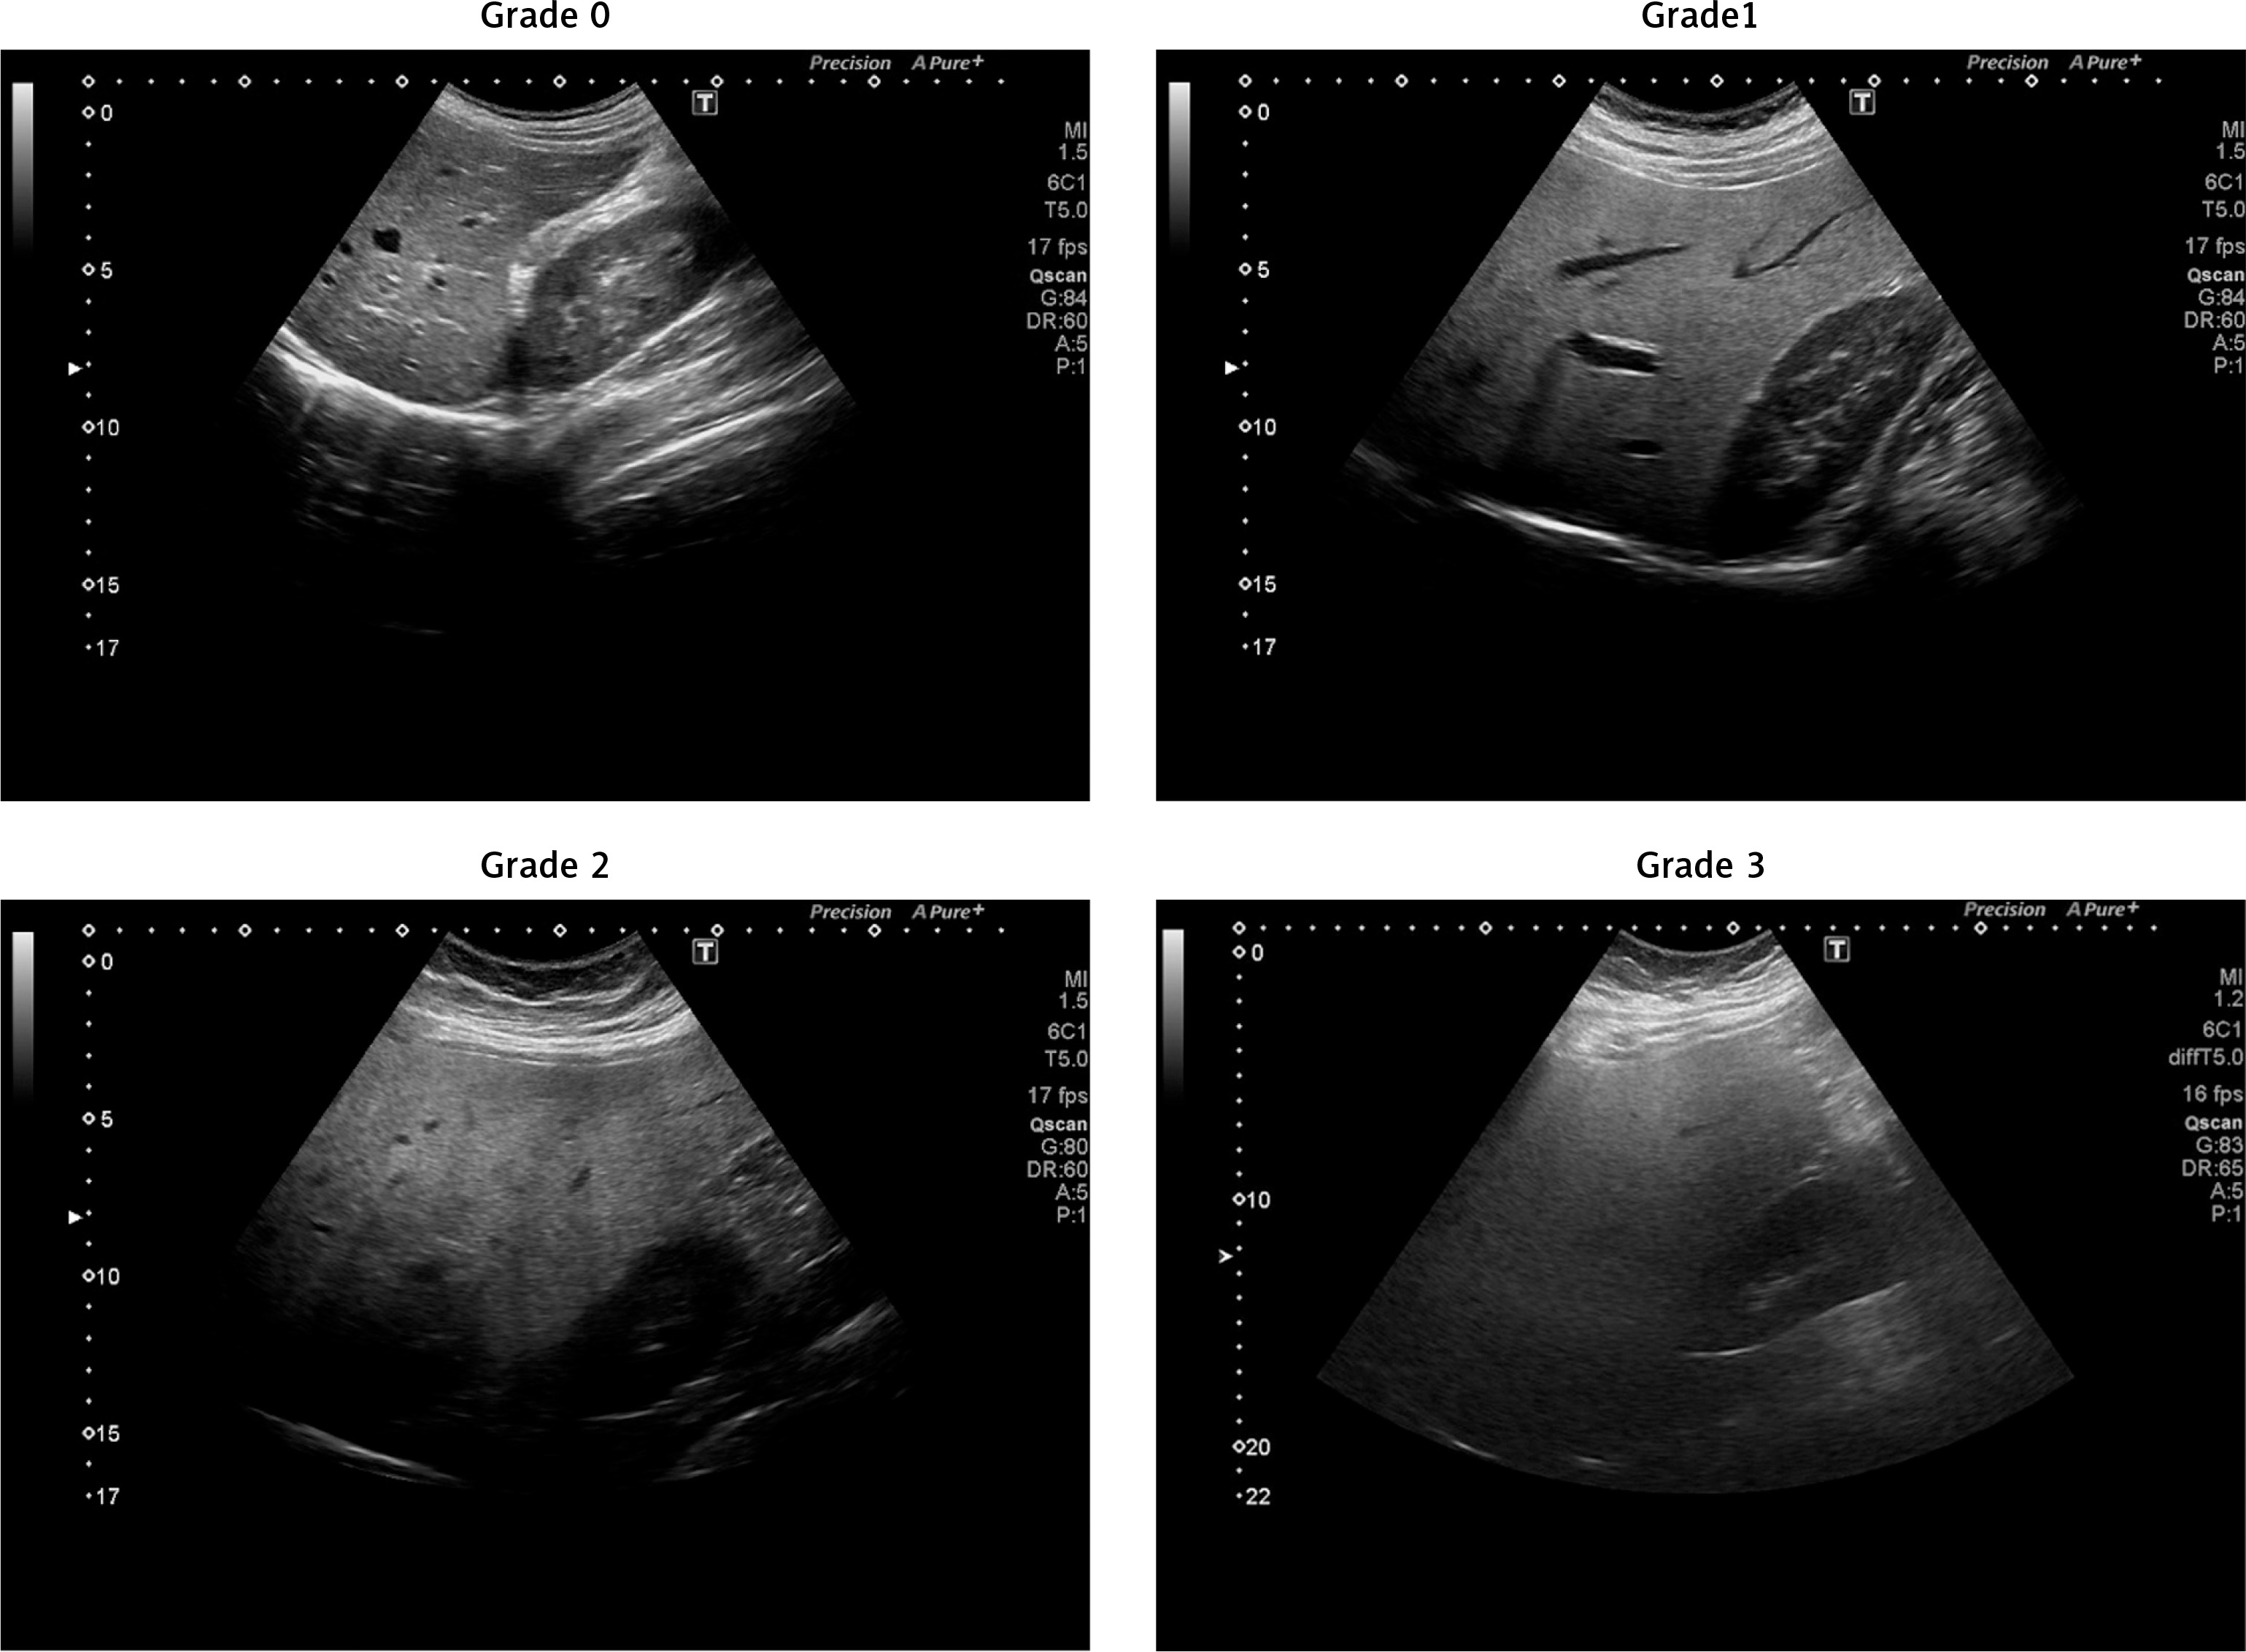
The grade system used for fatty liver is classified as follows [26]:
Grade 0: Normal liver appearance, no fat accumulation.
Grade 1: Mild fatty liver. Minimal fat accumulation in the liver tissue can be seen on ultrasound.
Grade 2: Moderate fatty liver. Significant fat accumulation in the liver tissue can be observed on ultrasound.
Grade 3: Severe fatty liver. Fat accumulation in liver tissue is evident and widespread. This stage usually refers to an advanced stage of fatty liver disease.
Statistical analysis
Statistical analysis was performed using IBM SPSS version 24.0 (SPSS Corp., Chicago, Illinois, USA) software. The results were regarded statistically significant for p < 0.05. The data were presented as mean ± standard deviation and median (interquartile range). The differences between groups were examined by Student’s t test, Mann-Whitney U test, and Kruskal-Wallis ANOVA for continuous and χ2 test for categorical variables.
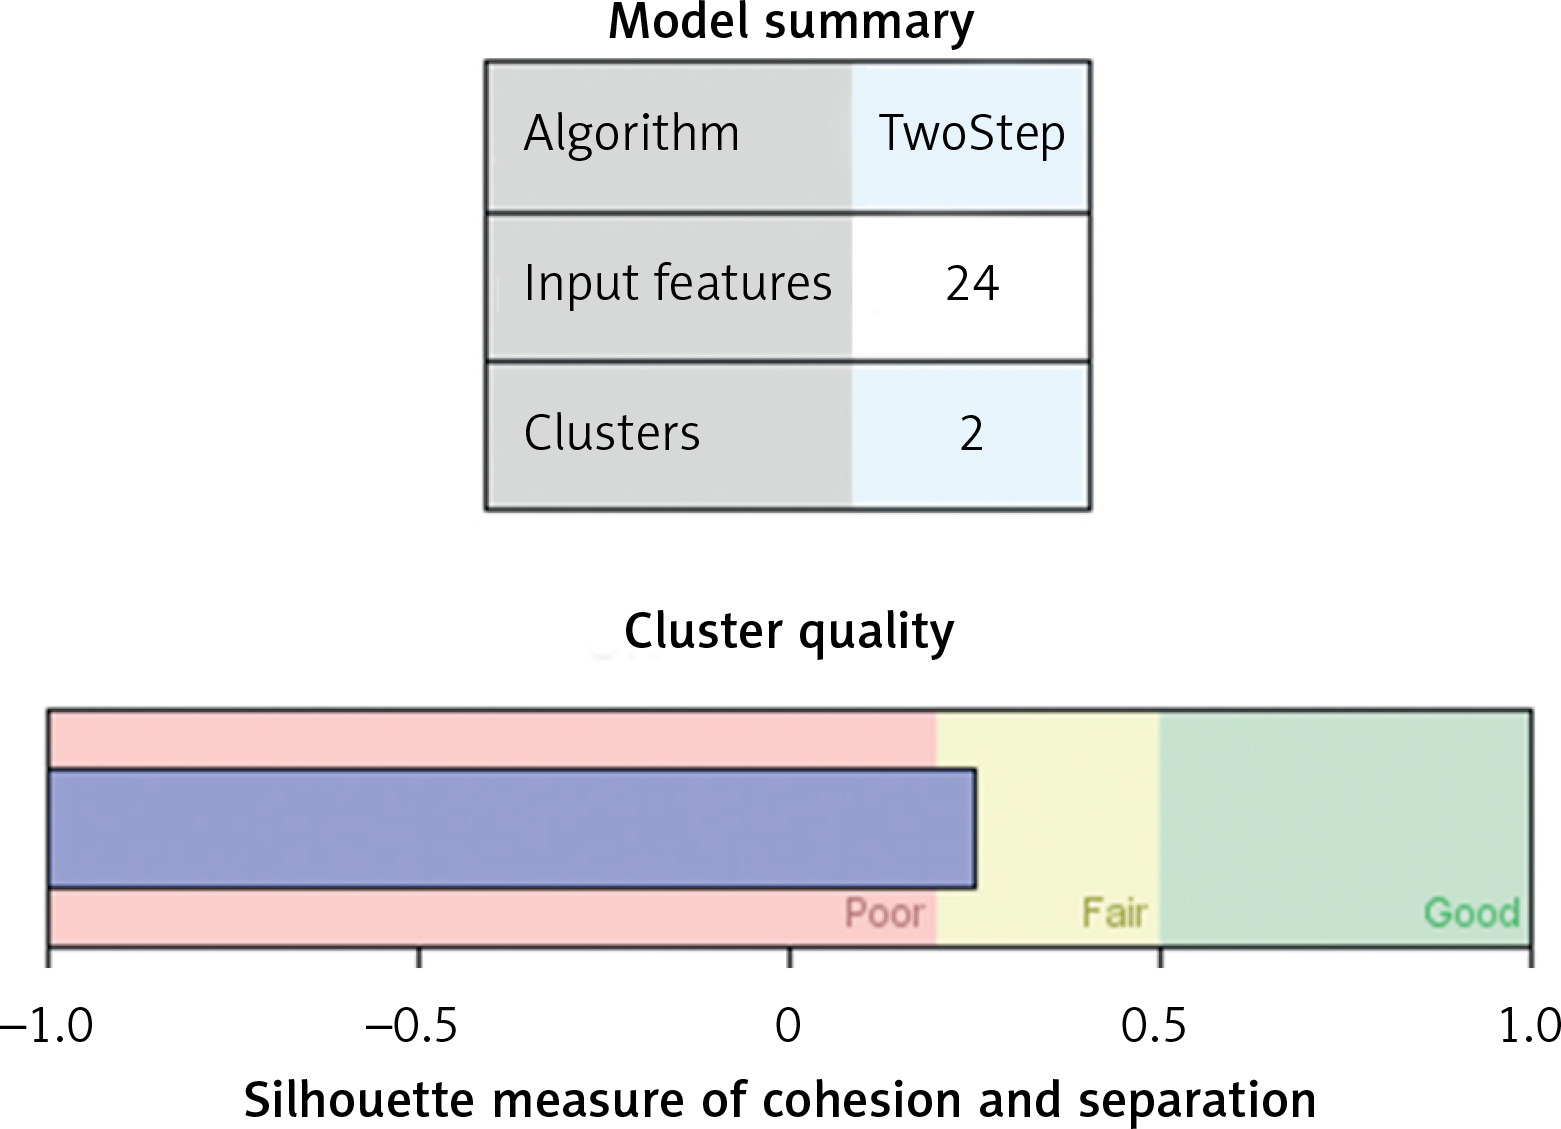
Two step clusters analysis enabled grouping of patients in optimal number of clusters. This analysis included continuous so as categorical variables, using the model-based distance measure [27]. This model allows, albeit distance between the two clusters also decrease in log-likelihood by clusters combination estimation. The clusters were selected using a hierarchical clustering algorithm. The best cluster model was selected through the Bayesian information criterion (BIC), i.e. the lowest BIC characterised the best model [28].
Results
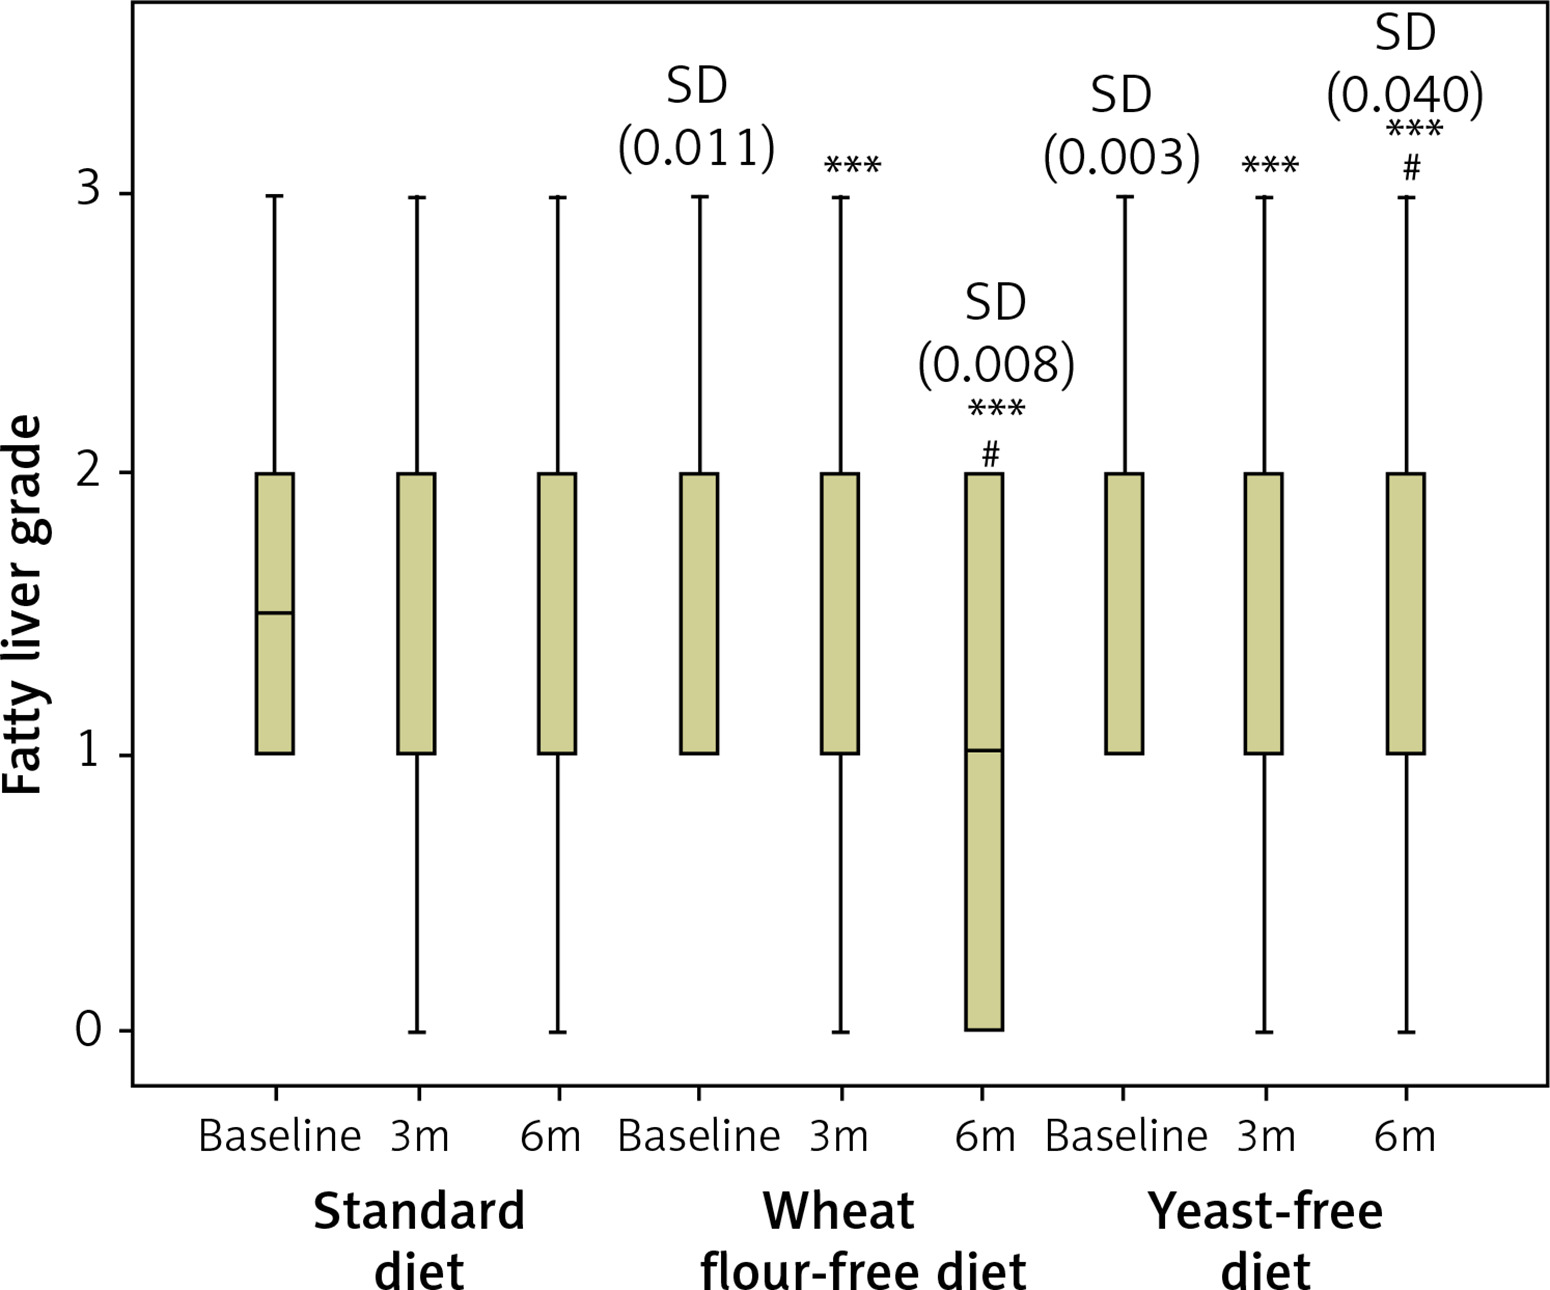
A total of 243 patients (139 women and 104 men) were included in the study. There were 54 patients in the standard diet group (Group 1; SD), 104 patients in the wheat flour-free diet group (Group 2; WFFD), and 85 patients in the baker’s yeast-free diet group (Group 3; YFD). The demographic results presented in Table I confirm that, at the beginning of the study, there were no differences between the subjects in the 3 diet regimes regarding general demographic (age, gender, diabetes mellitus (DM), and BMI) and biochemical (AST, ALT, and TG) data. Table II shows the data on BMI and biochemical markers at 3 study points, categorised by diet type. There was a statistically significant difference between the 3 diet groups solely for BMI and TG levels at month 6. This difference arises from the disparity between WFFD and the standard diet. Table III shows the percentage distribution of fatty liver degree among diet groups by month. None of the participants in the YFD group exhibited grade 3 hepatosteatosis after 6 months. The rate of grade 3 hepatosteatosis was 4.8% in the WFFD group and 7.4% in the SD group after 6 months. Table IV shows the changes in the degree of fatty liver during the 6-month study period according to the different diets applied in NAFLD patients. While no difference was found in terms of fatty liver at 3 months in the pairwise comparisons between the diet groups, statistical significance was observed between the standard diet and both WFFD and YFD at 6 months. However, no statistical difference was found between the WFFD and YFD groups in terms of fatty liver degree at 6 months. When each diet group was compared in terms of the time points of the study, no difference was found between the baseline, third, and sixth months in the standard diet group. However, the WFFD and YFD groups showed differences in terms of the degree of liver steatosis both at third and sixth months when compared with the baseline time point. Similarly, there was a statistical difference between the third and sixth month time points in the WFFD and YFD groups. Figure 3 provides more detailed information on the FLG score change across the 3 study periods and 3 experimental groups. Lowering of FLG during 3 and 6 months of the study was significant only for the wheat flour-free diet and yeast-free diet groups, while the change in the standard diet group was not statistically significant. At the same time, baseline values in the WFFD group and YFD group were significantly higher compared to the SD group.
Table I
Demographic and biochemical data by diet group
| Parameter | Standard diet (SD) (n = 54) | Wheat flour-free diet (WFFD) (n = 104) | Yeast-free diet (YFD) (n = 85) | P-value |
|---|---|---|---|---|
| Age [years] | 37 (28–45) | 35 (27–46) | 34 (26–45) | 0.601 |
| Gender, female/male, n (%)# | 27 (50)/27 (50) | 57 (54.8)/47 (45.2) | 55 (64.7)/30 (35.3) | 0.188 |
| Diabetes, yes/no, n (%)# | 18(33.3)/36(66.7) | 33(38.8)/52(61.2) | 41(39.4)/63(60.6) | 0.736 |
| BMI [kg/m2] | 30.1 (27.0–36.2) | 32.9 (29.1–38.2) | 31.6 (29.3–35.4) | 0.063 |
| AST [U/l] | 20.5 (17.0–32.0) | 25.0 (19.0–32.0) | 23.5 (17.0–32.5) | 0.117 |
| ALT [U/l] | 24.0 (16.0–45.0) | 31.0 (19.0–56.0) | 28.0 (19.0–49.0) | 0.307 |
| TG [mg/dl] | 183 (129–206) | 147 (109–234) | 186 (124–292) | 0.169 |
Table II
BMI and biochemical parameters in the three study points in subgroups defined by diet type
| Parameter | Study period | Standard diet | WFFD | YFD | P-value |
|---|---|---|---|---|---|
| BMI [kg/m2] | Baseline | 30.1 (27.0–35.9) | 33.0 (28.3–38.3)a | 31.6 (29.3–35.4) | 0.063 |
| 3 months | 29.4 (26.4–34.0) | 32.4 (28.9–37.6)a | 30.9 (28.1–35.1) | 0.094 | |
| 6 months | 29.4 (26.3–33.1) | 31.9 (28.6–38.1)a | 30.5 (28.0–34.7) | 0.049 | |
| ALT [U/l] | Baseline | 24.0 (16.5–43.0) | 28.0 (18.5–51.5) | 27.0 (19.0–44.0) | 0.307 |
| 3 months | 25.0 (17.0–34.0) | 23.0 (18.0–42.5) | 24.0 (16.0–34.0) | 0.796 | |
| 6 months | 23.0 (17.0–34.0) | 24.0 (19.5–34.0) | 23.0 (18.0–36.0) | 0.688 | |
| AST [U/l] | Baseline | 20.0 (17.0–29.5) | 24.0 (19.0–32.0) | 24.0 (17.0–32.0) | 0.117 |
| 3 months | 20.0 (16.0–25.5) | 22.0 (18.0–28.5) | 22.0 (18.0–28.0) | 0.215 | |
| 6 months | 20.0 (16.0–23.0) | 21.0 (15.5–27.0) | 21.0 (17.0–28.0) | 0.601 | |
| TG [mg/dl] | Baseline | 183 (131–203) | 144 (108–212) | 187 (125–292) | 0.169 |
| 3 months | 164 (124–226) | 155 (114–226) | 156 (113–234) | 0.641 | |
| 6 months | 156 (105–238) | 125 (98–171)a | 164 (98–234) | 0.046 |
Table III
Comparison of fatty liver grade of the diet groups according to months
Table IV
Fatty liver grade changes during 6 months of study regarding different diets implemented in NAFLD patients
Figure 3
Fatty liver grade changes during 6 months of study regarding different diets implemented in NAFLD patients. ***P < 0.001 vs. baseline in the same diet group; #P < 0.05 vs. 3 months in the same diet group; SD (p-value) – significant difference vs. standard diet group at the same study time point. Lowering of FLG during 3 and 6 months of the study was significant only for the wheat flour-free diet and yeast-free diet groups, while the change in the standard diet group was not statistically significant. At the same time, baseline values in the WFFD group and YFD groups were significantly higher compared to the SD group
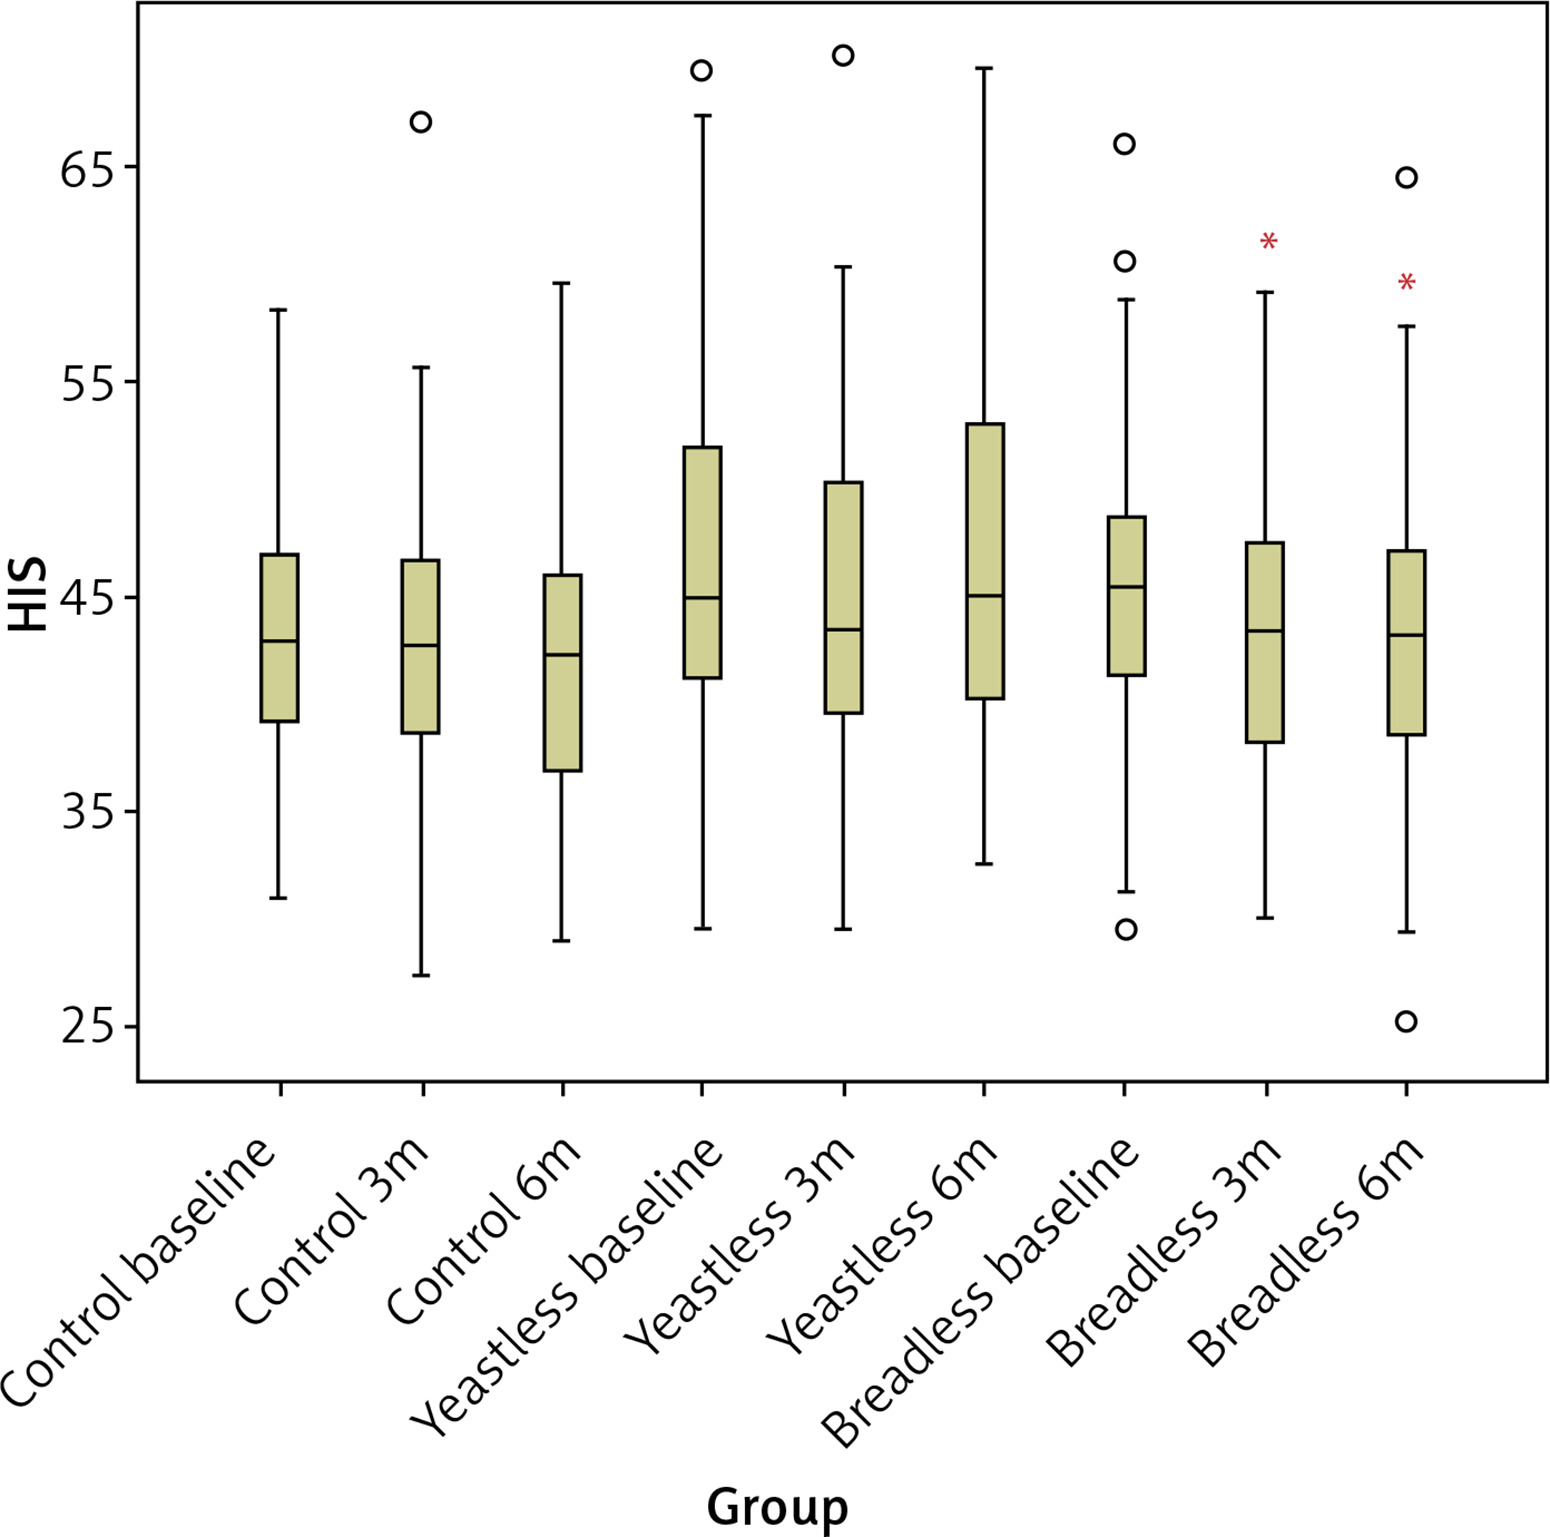
The changes in HSI are shown in Figure 4 for three different diet types and 3 different time points: before the diet, after 3 months, and after 6 months of the diet. The HIS level change did not differ between the 3 different diet types, although it was slightly higher in the YFD group (i.e. the yeast-free group) compared to the other 2 groups. There was also a significant decrease in HSI in the WFFD group in the 3- and 6-month measurements compared to baseline measurements in this group.
Figure 4
HSI value change throughout the study period and in 3 diet groups. *P < 0.05 vs. wheat flour-free diet baseline
Two-step cluster analysis
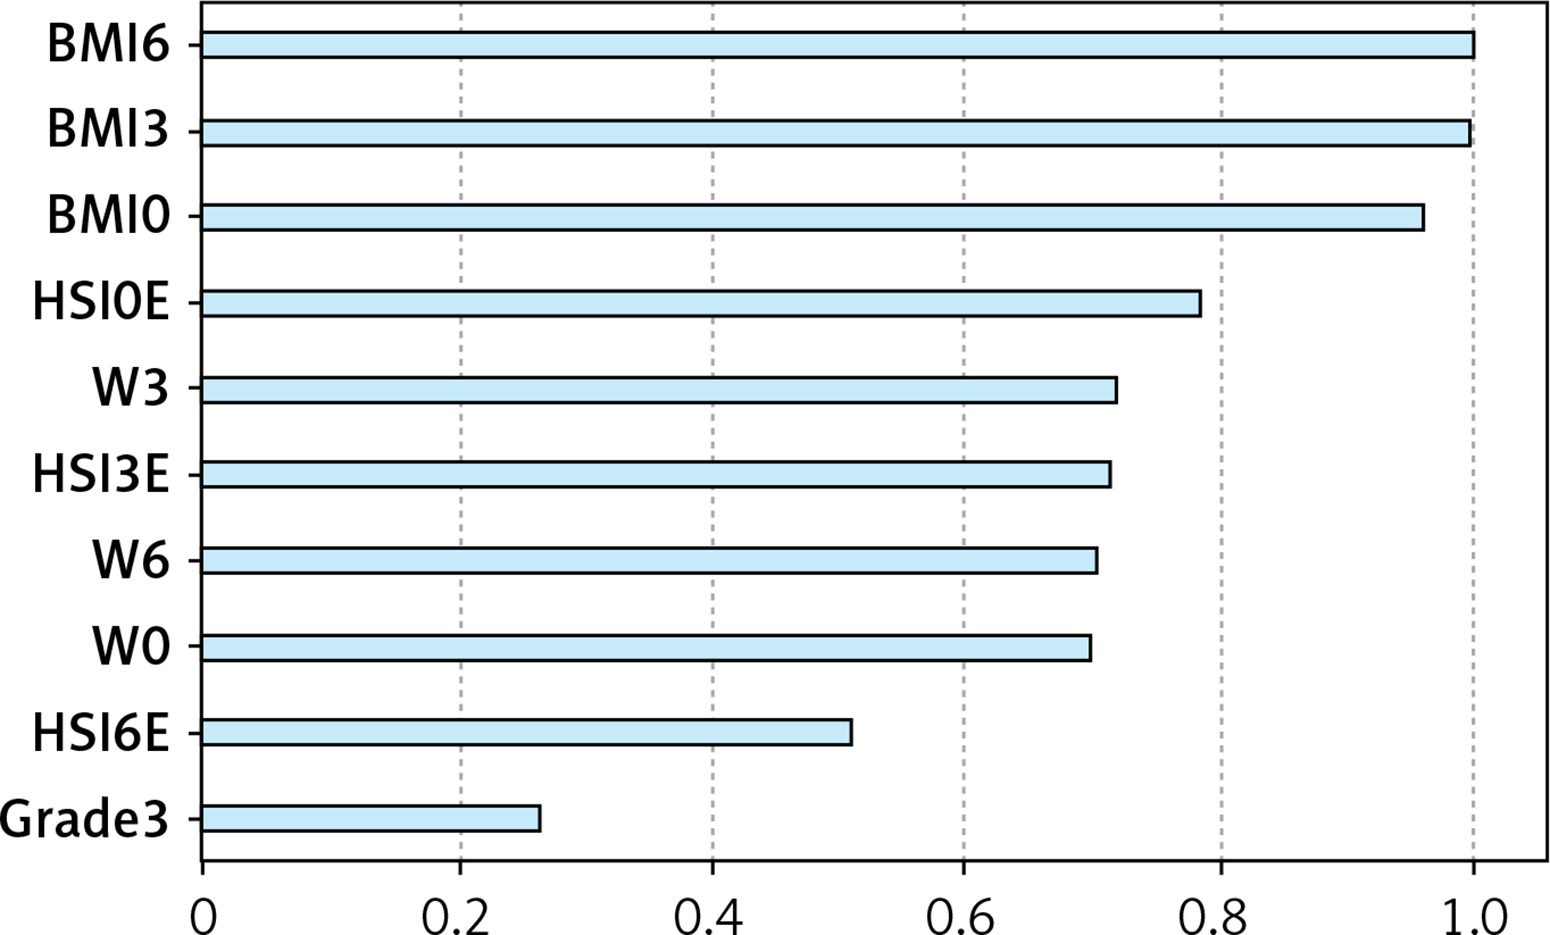
Cluster analysis enables participants’ grouping based on similarities in individual parameters. Here, 3 different diet groups of patients were divided into 2 clusters, with BMI making the principal difference. In Figure 5, the model summary is presented along with silhouette measures of cohesion and separation, indicating the optimal level of cluster quality. Figure 6 shows the relative value of distinct parameters that are included in the study, i.e. their importance in obesity status determination. Figure 6 shows that BMI and HSI are the most important determinants of cluster affiliation.
Two groups (clusters) were identified: obese and non-obese patients. Table V displays the parameter values for each of these groups. According to patients’ clustering, obese patients had higher HSI (as would be expected based on the formula of HSI calculation), weight, and BMI in all 3 study periods. This analysis grouped significantly more women in the obese group. A smaller number of patients with NAFLD grade 1 and a higher number of patients with NAFLD grade 3 were detected at baseline in the obese group compared to the non-obese group. Similarly, a significantly smaller number of patients with NAFLD grade 0 in obese patients were detected compared to non-obese patients after 3 months, as well as after 6 months of the study.
Table V
Cluster definition according to obesity status
Discussion
This study investigated the impact of several dietary therapies on BMI, TG levels, degree of hepatosteatosis, and HSI in patients with NAFLD. The findings indicate that there were notable biochemical and clinical enhancements, particularly in the WFFD and HFD groups, in comparison to a standard diet that just involved calorie restriction. The absence of disparity in demographic and biochemical data across the groups at the study’s onset implies that the variations in the study’s outcomes were attributable to the implemented diets. The notable reductions observed in BMI and TG levels, particularly in the WFFD and HFD groups after 6 months, provide evidence of the beneficial impact of these diets on metabolic health.
Wheat flour, a commonly consumed grain product, is believed to potentially impact metabolic health due to its gluten, fibre, and other constituents [29]. Scientific literature provides evidence that gluten and other protein constituents included in wheat flour can have an impact on the microorganisms present in the intestines [13, 14]. These findings indicate that the constituents present in wheat flour, particularly gluten and fructans, have the potential to induce inflammation in the liver [30]. The ingestion of wheat flour potentially causes inflammation in the mucosa of the intestines and impairs the function of the intestinal barrier, resulting in the release of endotoxins into the bloodstream. The current scenario can initiate inflammatory mechanisms in the liver and contribute to the progression of NAFLD. Furthermore, the presence of high glycaemic index carbohydrates in wheat flour might lead to a rise in insulin resistance and have an impact on TG levels [31]. This could lead to enhanced hepatic lipid deposition and facilitate the development of NAFLD. Nevertheless, the presence of non-digestible carbohydrates in wheat flour indicates that it could potentially enhance intestinal well-being and yield favourable outcomes for metabolic health. Fibre is recognised for its ability to decrease inflammation and regulate lipid metabolism through the regulation of the intestinal microbiota. The precise contribution of wheat flour to the development of NAFLD remains unclear, and there are contradictory findings on this matter. Specifically, conducting molecular-level investigations is necessary to gain a more profound comprehension of the impact that individual constituents of wheat flour have on NAFLD. Furthermore, it is imperative to conduct clinical trials to assess the enduring consequences of wheat flour consumption. However, it is important to remember that genetic variations and unique reactions among people can influence the impact of wheat flour. These variables emphasise the necessity of creating customised nutritional approaches to gain a deeper understanding of the impact of wheat flour on NAFLD.
A significant discovery from the study is that diets devoid of wheat flour and diets lacking baker’s yeast produce similar outcomes. This supports the positive effects of baker’s yeast on NAFLD, especially considering its effects on the gut microbiota [21, 23]. Baker’s yeast, a conventional ingredient in various baked goods, contains yeast, proteins, and other constituents that influence the gut microbiota. Prior research has demonstrated that the gut microbiota has a crucial impact on the development of NAFLD [23, 32]. The parts of baker’s yeast that are involved in this situation, especially beta-glucans and other adhesive compounds found in yeast cell walls, could cause inflammation and changes in permeability of the intestinal mucosa. This could cause a decline in the integrity of the intestinal barrier, potentially allowing endotoxins to enter the bloodstream, which in turn may initiate inflammatory reactions in the liver [21]. Moreover, the presence of gluten and other protein constituents found in baker’s yeast can trigger immunological responses in the intestine, leading to heightened inflammation of the intestinal mucosa. Inflammation in the intestinal mucosa may play a role in the development of NAFLD [23, 32]. This is because it raises systemic inflammation, which makes it easier for fat to build up in the liver [23, 32].
Regarding analysis of the hepatosteatosis index, a notable reduction was noted in the WFFD group. This discovery strengthens the evidence of the impact of WFFD on liver steatosis. The correlation between HSI and BMI once again demonstrates the significant association between obesity and liver steatosis [33, 34]. The findings provide evidence that HSI can serve as a dependable biomarker for assessing the severity of hepatic steatosis.
After performing a 2-stage cluster analysis, distinct disparities were observed between patients who were obese and those who were not obese. The higher percentage of females in the obese group underscores the influence of gender in the progression of obesity and NAFLD. Some literature data suggest that women may have a higher susceptibility to obesity and metabolic problems as a result of hormonal disparities [34, 35]. This study also supports these perspectives.
While our study offers insights into the impact of various diets on NAFLD, a widespread global illness, it is important to acknowledge its limitations. Assessments made taking into account these constraints are crucial for both evaluating the findings and planning future research. Our study was unfortunately conducted during the same time period as the COVID-19 epidemic, which had a significant impact on our research. Despite our original enrolment of 450 patients with NAFLD and a meticulous randomisation process, the study had to remove a significant number of participants due to their inability to attend regular follow-up appointments as a result of the pandemic. Both our randomisation process and sample size were negatively affected by this. This condition resulted in a disparity in numbers between the diet groups. Furthermore, our study was constrained by a time frame of only 6 months. While this approach enabled us to assess immediate and intermediate outcomes, it may have resulted in the neglect of long-term impacts and possible adverse consequences. The efficacy of dietary treatments in studies relies on the degree to which participants comply with their recommended diets. This study assessed dietary compliance based on self-reported statements from the participants, without objective measurements, and with inadequate control over factors that could influence dietary compliance. Simultaneously, the lifestyle and physical activity levels of the subjects are unmodifiable variables. In our study, the data obtained using biochemical and clinical indicators such as BMI, TG, HSI, and ultrasonography may not always provide a complete representation of fatty liver. Utilising more advanced imaging techniques or approaches, such as magnetic resonance imaging and liver biopsy, can provide more precise data to evaluate the extent of fatty liver. Nevertheless, these methods are invasive and expensive, thus requiring their restricted application. The study was conducted in a single centre, which may restrict the applicability of the findings to other geographic regions or population groups.
Ultimately, while this study’s results showcase the possible advantages of dietary interventions for individuals with NAFLD, it is important to take into account the highlighted limitations when interpreting them. To address these limitations, future research should incorporate bigger and more diverse sample groups, extend the follow-up periods, and employ more complete data collection methods. Thus, employing this approach enables a more distinct and dependable assessment of the impact of diets on NAFLD.
In conclusion, this study investigated the impact of various diets on the treatment of NAFLD, and it showed that the wheat flour-free diet and yeast-free diet have potential effectiveness in lowering liver steatosis. Furthermore, the strong correlation between obesity and HSI results underscores the significance of BMI in assessing hepatic steatosis. The study indicates that diets excluding wheat flour and yeast may have positive effects on the treatment of NAFLD. However, it highlights the need for more research with bigger sample numbers and longer durations to validate these findings. The acquired findings illustrate the potential impact of individualised dietary approaches in the management of NAFLD and offer a significant basis for future investigation.