Introduction
Data indicate that 537 million adults are living with diabetes mellitus (DM) worldwide [1]. In Poland, over 2 million people have DM, 25% of them unaware of their condition [2]. Forecasts predict that this number will double in the next 15–20 years [2]. Their projected lifespan is reduced, since DM elevates the likelihood of cardiovascular (CV) diseases and the susceptibility to other illnesses [3]. According to guidelines, lifestyle interventions are paramount in treating DM and in preventing the development of atherosclerotic cardiovascular disease [4]. Diets that favor a higher intake of whole grains and green leafy vegetables and a lower intake of refined grains, red and processed meat, and sugar-sweetened beverages have been linked with reduced risk of type 2 DM [5–8]. Adhering to Mediterranean-style or Dietary Approaches to Stop Hypertension (DASH) or diets which exclude animal products decrease the likelihood of developing type 2 DM and reduce risk of CV complications [9–11]. Nutritional education is a continuous, permanent process and an integral part of the treatment during every doctor’s visit or nursing consultation [12]. Standards of Medical Care in Diabetes recommend reeducation of the patient when complication factors influencing self-management such as new health conditions occur [13].
The most recent and reliable data regarding nutrition in Polish hospitals were presented in the report of the Supreme Audit Office from 2018 [14]. It revealed that the healthcare system did not guarantee proper nutrition. There were no nutritional standards, health requirements or methods for assessing the quality of nutrition and rules for employing dieticians in hospital wards. Such gaps in the system and low financial outlays resulted in meals that were inadequate for patients’ health conditions, prepared from low-quality raw materials, with unsuitable energy and nutritional values. The food provided by hospitals could harm patients’ health. The problem of poor-quality hospital nutrition is also noticeable in other Central European countries, such as the Czech Republic and Germany [15, 16]. Since 1991, hospital nutrition in the Czech Republic has been guided by recommendations of the Ministry of Health. As a result, individual hospitals may offer very different diets. They have to meet criteria for nutrients and energy value but often lack quality and taste and do not fulfil patients’ needs. In Germany, the Physicians Association for Nutrition prepared an open letter to the Ministry of Health in which they requested changes in hospital meals. Nutrition there is included in the so-called “non-medical services” and therefore competes for financing with 12 other services (including training and further education, IT, administration, laundry, control and cleaning).
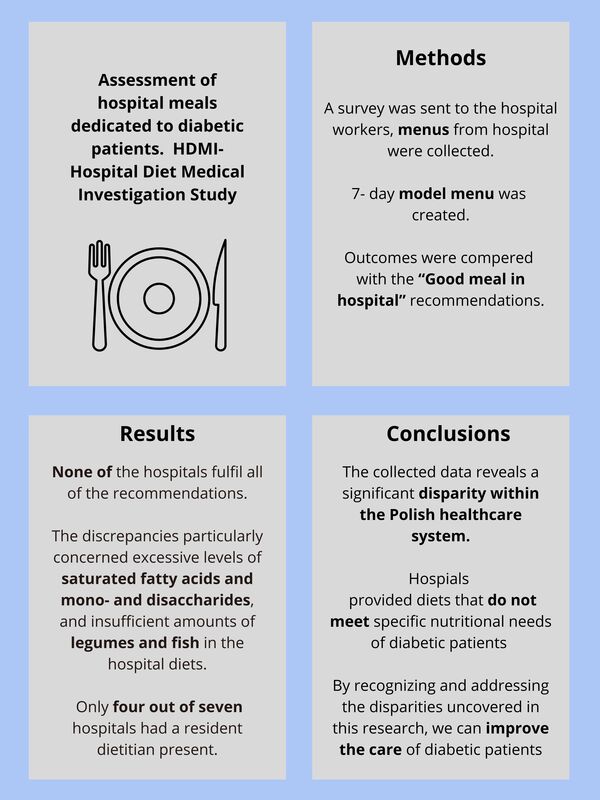
The aim of this study was to investigate the nutrition provided to diabetic patients in hospitals located in Poland and assess their adherence to the Good Meal in Hospital recommendations, prepared at the behest of the Polish Ministry of Health [16]. We hypothesized that the menus offered to diabetic patients in Polish hospitals failed to adhere to recommendations and lacked proper balance.
Material and methods
Study design and setting
The comparative cross-sectional study was conducted between January and August 2022. Menus for a diabetic diet were collected. Inclusion criteria were: (1) location in Poland (2) being a public hospital, (3) having a general medicine ward, (4) submitting meal plans from 10 consecutive days, which contained all essential information for analysis (precise ingredients and their weight), and (5) completing the entire questionnaire. Exclusion criteria were: (1) being a private hospital, (2) focusing on specific illnesses or patient demographics, e.g. military personnel, (3) sending incomplete surveys or (4) inaccurate and unreadable menus (without the weight of the ingredients or containing only general information, e.g. ham sandwich). The aims of the study, information about anonymity and terms of participation were mentioned before beginning the survey. Completing and submitting the form was regarded as providing informed consent to participate in the study.
Data collection
Participants – heads of departments, specialists and resident doctors from various districts of Poland – were reached by an email about the study. They were asked to complete a survey created with Google Forms and send the meal menus received by diabetic patients for the upcoming 10 days.
Research tools
Questions involved: (1) the hospital’s degree of reference (1st/2nd/3rd degree) – the first degree provides fundamental medical procedures, the third degree offers the most specialized procedures; (2) the total amount of beds in the hospital and the internal medicine unit; (3) the attendance of a person delivering nutritional education; (4) place of meal preparation – hospital kitchen or outsourced catering services; (5) access to diets tailored for patients with diabetes. Next, the received menus were compared with the self-created model menu. It was prepared using widely accessible and relatively affordable ingredients to meet the nutritional requirements of individuals with diabetes and at risk of cardiovascular disease. The form and model menu are available in the Supplementary Materials section. Then, all menus were evaluated in the DIETA 6 computer program and compared with the Good Meal in Hospital governmental recommendations. The DIETA 6 computer program was created by the National Institute of Public Health – National Institute of Hygiene in Warsaw and is tailored to the Polish population. The Good Meal in Hospital recommendations are the first such recommendations in Poland that introduce a coherent system to plan meals in hospitals [17]. They introduce an average weighted standard for energy and nutrients for the entire hospital population, regardless of gender, types of diets, their characteristics, recommended and contraindicated foods. A summary of the recommendations is presented in Table I.
Table I
Characteristics of a diet restricting easily digestible carbohydrates based on the Good Meal in Hospital recommendations [17]
Statistical analysis
Statistical analyses were carried out using Statistica 13.3 software by TIBCO Software in Palo Alto, California, United States. DIETA 6 software was used to calculate the nutritional values of the received menus. For every nutritional value, the mean (M), standard deviation (SD), and range (min-max) were calculated. To assess discrepancies in means for both nutrients and products among different hospitals and the standardized menu, we used a one-way ANOVA followed by a post-hoc Dunnett’s two-tailed test. Dunnett’s test is a multiple comparison method that contrasts each mean with a single control in many-to-one comparisons. The null hypothesis was rejected when the p-value was below 0.05, indicating a statistically significant difference in means.
Results
A total of 70 daily menus for diabetic patients from seven hospitals underwent analysis (A – 1035 beds, B – 452 beds, C – 683 beds, D – 677 beds, E – 363 beds, F – 176 beds, G – 321 beds). Five of the examined hospitals were third degree reference hospitals (A, C, D, E, G), one was second (B) degree and one first degree (F). Hospitals 1, 2, and 3 were located in the Mazowieckie Voivodeship, hospitals 4, 6, and 7 in the Śląskie Voivodeship, hospital 5 in the Łódzkie Voivodeship. A special diet for diabetic patients was available in every hospital. Nutrition education was available in six hospitals (A, B, D, E, F, G), yet only four of them had a resident dietician (D, E, F, G). Four hospitals undertook the culinary preparations internally (C, D, F, G), while three hospitals opted to engage external catering services (A, B, E).
There was a statistically significant difference in mean: energy, energy from carbohydrates, total carbohydrates per 1000 kcal, fiber per 1000 kcal, mono- and disaccharides per 1000 kcal, and percentage of energy from mono- and carbohydrates. Compared to the standardized menu, there was a statistically greater mean amount of energy in hospitals B, C and lower in hospitals D and E; a greater percentage of energy from carbohydrates in hospitals F and G and lower in hospital B; lower mean fiber per 1000 kcal in hospitals B, D, E; a greater mean amount of carbohydrates per 1000 kcal in hospitals F and G and lower in hospital B; a greater mean amount of mono- and disaccharides per 1000 kcal in hospitals F and G and lower in hospital D; a greater percentage of energy from mono- and disaccharides in hospitals F and G and lower in hospital D. Table II displays precise values.
Table II
Energy and carbohydrate content
| Hospital/unit | M | SD | Min. | Max. | P-valuea |
|---|---|---|---|---|---|
| Energy [kcal] (F = 22.141; p < 0.001b) | |||||
| A | 2054.1 | 234.5 | 1726.4 | 2397.1 | 0.998 |
| B | 2266.4 | 100.7 | 2111.4 | 2394.4 | 0.033 |
| C | 2332.9 | 108.3 | 2180.1 | 2524.2 | 0.002 |
| D | 1620.8 | 65.4 | 1514.8 | 1716.5 | < 0.001 |
| E | 1759.1 | 116.3 | 1572.9 | 1940.6 | 0.016 |
| F | 2130.0 | 155.3 | 1881.7 | 2389.5 | 0.608 |
| G | 2162.3 | 192.1 | 1864.2 | 2439.1 | 0.344 |
| Reference | 2015.8 | 29.3 | 1993.1 | 2055.8 | – |
| Percentage of energy from carbohydrates [kcal] (F = 25.600; p < 0.001b) | |||||
| A | 53.8 | 4.3 | 46.2 | 59.4 | 0.900 |
| B | 41.8 | 3.1 | 38.3 | 46.9 | < 0.001 |
| C | 53.7 | 2.6 | 50.0 | 58.0 | 0.935 |
| D | 54.3 | 1.4 | 52.2 | 56.5 | 0.802 |
| E | 52.8 | 3.3 | 48.4 | 58.1 | 1.000 |
| F | 59.4 | 2.6 | 55.5 | 63.6 | < 0.001 |
| G | 59.6 | 3.1 | 55.9 | 65.3 | < 0.001 |
| Reference | 52.2 | 2.6 | 48.5 | 55.7 | – |
| Fiber/1000 kcal [g/kcal] (F = 7.033, p < 0.001b) | |||||
| A | 20.6 | 2.0 | 16.4 | 22.5 | 0.996 |
| B | 17.1 | 1.9 | 14.9 | 20.3 | 0.004 |
| C | 18.2 | 2.6 | 15.3 | 22.4 | 0.044 |
| D | 15.6 | 1.5 | 13.7 | 17.6 | < 0.001 |
| E | 16.5 | 1.5 | 13.7 | 19.8 | < 0.001 |
| F | 18.2 | 1.8 | 15.7 | 19.8 | 0.040 |
| G | 18.1 | 2.1 | 14.1 | 21.6 | 0.035 |
| Reference | 21.1 | 1.5 | 18.8 | 22.9 | – |
| Carbohydrates/1000 kcal [g/kcal] (F = 22.490, p < 0.001b) | |||||
| A | 144.6 | 11.7 | 124.2 | 159.3 | 0.939 |
| B | 112.7 | 8.4 | 103.8 | 127 | < 0.001 |
| C | 143.1 | 7.6 | 132.6 | 155.9 | 0.996 |
| D | 143.1 | 3.7 | 137.0 | 148.9 | 0.997 |
| E | 139.7 | 9 | 128.2 | 154.8 | 1.000 |
| F | 157.4 | 6.7 | 146.4 | 167.2 | 0.003 |
| G | 157.9 | 8.4 | 146.5 | 173.7 | 0.002 |
| Reference | 140.7 | 6.6 | 131.1 | 149.5 | – |
| A total of mono- and disaccharides/1000 kcal [g/1000 kcal] (F = 20.194; p < 0.001b) | |||||
| A | 32.3 | 6.7 | 18.5 | 41.9 | 0.209 |
| B | 21.6 | 3.6 | 17.3 | 26.8 | 0.293 |
| C | 32.3 | 3.7 | 26.2 | 36.7 | 0.212 |
| D | 15.5 | 3.8 | 10.4 | 20.0 | 0.001 |
| E | 27.9 | 7.6 | 14.2 | 42.6 | 0.999 |
| F | 37.6 | 3.2 | 32.8 | 42.1 | 0.001 |
| G | 37.2 | 3.1 | 32.8 | 42.1 | 0.002 |
| Reference | 26.9 | 2.2 | 23.8 | 29.7 | – |
| Percentage of energy from mono- and disaccharides [%] (F = 20.194, p < 0.001b) | |||||
| A | 12.9 | 2.7 | 7.4 | 16.8 | 0.209 |
| B | 8.6 | 1.4 | 6.9 | 10.7 | 0.293 |
| C | 12.9 | 1.5 | 10.5 | 14.7 | 0.212 |
| D | 6.2 | 1.5 | 4.2 | 8.0 | 0.001 |
| E | 11.2 | 3.0 | 5.7 | 17.0 | 0.999 |
| F | 15.1 | 1.3 | 13.1 | 16.9 | 0.001 |
| G | 14.9 | 1.3 | 13.1 | 16.9 | 0.002 |
| Reference | 10.7 | 0.9 | 9.5 | 11.9 | – |
There was a statistically significant difference in the mean: total protein, percentage of energy from protein, animal-based protein per 1000 kcal, and plant-based protein per 1000 kcal. Compared to the standardized menu there was a statistically significantly lower mean amount of total protein in hospitals A, C, D, E, F, G and a greater amount in hospital B; a lower percentage of energy from protein in hospitals A, C, D, E, F, G, a greater mean of animal-based protein per 1000 kcal in hospital B, and a lower mean amount of plant-based protein per 1000 kcal in every hospital. Precise values are presented in Table III.
Table III
Protein content
| Hospital/unit | M | SD | Min. | Max. | P-valuea |
|---|---|---|---|---|---|
| Total amount of protein [g] (F = 25.246; p < 0.001b) | |||||
| A | 79.2 | 10.4 | 70.6 | 101.9 | < 0.001 |
| B | 120.4 | 8.7 | 106.2 | 135 | 0.033 |
| C | 92.1 | 10.0 | 74.9 | 105.5 | 0.022 |
| D | 73.8 | 11.9 | 57.4 | 93.7 | < 0.001 |
| E | 77.0 | 7.2 | 66.6 | 90.5 | < 0.001 |
| F | 85.3 | 5.2 | 75.6 | 94.5 | < 0.001 |
| G | 86.1 | 5.8 | 75.2 | 94.5 | < 0.001 |
| Reference | 106.1 | 6.7 | 99.8 | 116.0 | – |
| Percentage of energy from protein [%] (F = 21.362; p < 0.001b) | |||||
| A | 15.5 | 1.4 | 12.7 | 18.0 | < 0.001 |
| B | 21.2 | 1.1 | 19.7 | 22.6 | 1.000 |
| C | 16.0 | 1.6 | 12.9 | 17.6 | < 0.001 |
| D | 17.9 | 1.7 | 14.7 | 20.0 | 0.001 |
| E | 17.6 | 1.7 | 14.8 | 20.2 | < 0.001 |
| F | 15.8 | 1.0 | 14.3 | 16.8 | < 0.001 |
| G | 15.7 | 1.1 | 14.1 | 16.8 | < 0.001 |
| Reference | 21.3 | 1.1 | 20.2 | 22.8 | – |
| Animal-based protein/1000 kcal [g/kcal] (F = 11.049; p < 0.001b) | |||||
| A | 22.7 | 4.2 | 18.0 | 31.5 | 0.986 |
| B | 38.1 | 4.4 | 32.7 | 45.0 | < 0.001 |
| C | 22.6 | 4.5 | 13.2 | 27.5 | 0.981 |
| D | 25.2 | 6.1 | 16.1 | 35.4 | 0.998 |
| E | 25.4 | 4.3 | 17.9 | 30.7 | 0.994 |
| F | 23.5 | 2.9 | 20.0 | 28.4 | 1.000 |
| G | 23.4 | 2.9 | 19.8 | 28.4 | 1.000 |
| Reference | 24.1 | 4.6 | 18.6 | 29.1 | – |
| Plant based protein/1000 kcal [g/kcal] (F = 29.212; p < 0.001b) | |||||
| A | 16.0 | 2.3 | 12.6 | 19.3 | < 0.001 |
| B | 14.6 | 1.7 | 12.3 | 16.8 | < 0.001 |
| C | 16.7 | 2.7 | 13.9 | 21.7 | < 0.001 |
| D | 19.9 | 1.0 | 18.7 | 21.4 | < 0.001 |
| E | 18.3 | 1.7 | 14.8 | 20.5 | < 0.001 |
| F | 16.5 | 1.1 | 14.8 | 18.0 | < 0.001 |
| G | 16.5 | 1.4 | 13.7 | 18.0 | < 0.001 |
| Reference | 28.2 | 2.2 | 24.9 | 30.7 | – |
Table IV displays fat content. A one-way ANOVA revealed that there was a statistically significant difference in the mean: total fat, fat per 1000 kcal, percentage of energy from fat, cholesterol and percentage of energy from saturated fat acids. Compared to the standardized menu there was a statistically significantly higher mean amount of total fat in hospitals B and C; a higher mean amount of fat per 1000 kcal in hospital B, a higher percentage of energy from fat in hospital B, a higher mean amount of cholesterol in hospitals A, B, C; and a higher percentage of energy from saturated fat acids in hospital A, B, C, E, F, G.
Table IV
Fat content
| Hospital/unit | M | SD | Min. | Max. | P-valuea |
|---|---|---|---|---|---|
| Fat [g] (F = 11.726; p < 0.001b) | |||||
| A | 70.7 | 17.1 | 51.7 | 106.6 | 0.407 |
| B | 93.3 | 11.6 | 79.8 | 112.4 | < 0.001 |
| C | 79.4 | 10.1 | 65.3 | 100.9 | 0.019 |
| D | 50.0 | 1.6 | 47.4 | 52.4 | 0.529 |
| E | 58.4 | 9.9 | 39.5 | 78.2 | 1.000 |
| F | 58.6 | 12.0 | 44.9 | 79.3 | 1.000 |
| G | 59.0 | 11.7 | 44.9 | 81.0 | 1.000 |
| Reference | 60.1 | 7.6 | 49.9 | 70.2 | – |
| Fat/1000 kcal [g/kcal] (F = 10.600; p < 0.001b) | |||||
| A | 34.1 | 5.2 | 28.0 | 45.7 | 0.252 |
| B | 41.1 | 4.5 | 34.9 | 46.9 | < 0.001 |
| C | 34.0 | 3.5 | 27.5 | 40.9 | 0.279 |
| D | 30.9 | 1.5 | 29.2 | 33.3 | 0.998 |
| E | 33.0 | 3.8 | 25.1 | 40.3 | 0.554 |
| F | 27.3 | 3.7 | 22.1 | 33.8 | 0.768 |
| G | 27.2 | 4.0 | 21.9 | 33.5 | 0.727 |
| Reference | 29.9 | 4.1 | 24.3 | 35.2 | – |
| Percentage of energy from fat [%] (F = 10.607; p < 0.001b) | |||||
| A | 30.6 | 4.6 | 25 | 40.9 | 0.170 |
| B | 37.0 | 3.9 | 31.1 | 42 | < 0.001 |
| C | 30.4 | 3.2 | 24.5 | 36.6 | 0.224 |
| D | 27.8 | 1.3 | 26.1 | 29.5 | 0.983 |
| E | 29.7 | 3.0 | 24.5 | 36.0 | 0.417 |
| F | 24.8 | 3.3 | 19.6 | 30.2 | 0.916 |
| G | 24.7 | 3.7 | 19.5 | 29.9 | 0.890 |
| Reference | 26.5 | 3.6 | 21.5 | 31.3 | – |
| Cholesterol [g] (F = 6.167; p < 0.001b) | |||||
| A | 329.2 | 100.6 | 173.8 | 445.9 | 0.024 |
| B | 421.3 | 129.6 | 305.7 | 649.0 | < 0.001 |
| C | 330.9 | 103.4 | 193.4 | 486.9 | 0.022 |
| D | 177.3 | 93.0 | 99.1 | 316.7 | 1.000 |
| E | 258.1 | 87.8 | 152.3 | 412.5 | 0.469 |
| F | 228.4 | 65.1 | 180.8 | 372.3 | 0.868 |
| G | 229.2 | 64.5 | 180.8 | 359.9 | 0.859 |
| Reference | 177.3 | 97.7 | 93.4 | 318.4 | – |
| Percentage of energy from saturated fat acids [%] (F = 21.777; p = 0.001b) | |||||
| A | 12.8 | 1.8 | 10.1 | 15.5 | < 0.001 |
| B | 15.7 | 1.5 | 14.3 | 18.6 | < 0.001 |
| C | 15.0 | 1.9 | 12.6 | 19.4 | < 0.001 |
| D | 9.3 | 1.1 | 7.8 | 10.9 | 0.025 |
| E | 11.4 | 1.1 | 10.3 | 13.6 | < 0.001 |
| F | 11.8 | 1.7 | 10.0 | 14.6 | < 0.001 |
| G | 11.7 | 1.8 | 9.2 | 14.6 | < 0.001 |
| Reference | 6.5 | 1.4 | 4.9 | 8.6 | – |
The hospitals showed significant differences in mean amounts of: fruits, vegetables, sugar in total, legumes, nuts and seeds, whole grain cereal products, red meat, and processed white and red meat. Compared to the model menu, lower mean amounts of fruits were observed in hospitals B, D, E, lower mean amounts of vegetables in hospitals A, C, D, E, F, G; greater mean amounts of sugar in hospitals A, C, E, F, G, greater mean amounts of potato in hospitals F and G; a lower amount of legumes in every hospital, a greater mean amount of whole grain products in hospital A and lower in hospital D; and a greater mean amount of red meat in hospitals B and E. Only one hospital offered nuts and in a statistically significantly lower amount than the model menu. Other differences were not statistically significant. Every hospital provided red meat; only the reference diet did not. Precise values are presented in Table V.
Table V
Groups of products and sodium intake
| Hospital/Unit | M | SD | Min. | Max. | P-valuea |
|---|---|---|---|---|---|
| Fruits [g] (F = 6.855; p < 0.001b) | |||||
| A | 287.8 | 52.8 | 150.0 | 348.8 | 0.987 |
| B | 168.9 | 21.0 | 150.0 | 202.5 | 0.025 |
| C | 262.1 | 121.5 | 138.8 | 497.3 | 0.763 |
| D | 65.2 | 85.4 | 0.0 | 178.1 | < 0.001 |
| E | 155.3 | 90.1 | 0.0 | 281.0 | 0.006 |
| F | 240.5 | 94.2 | 138.8 | 450.8 | 0.433 |
| G | 237.4 | 94.7 | 138.8 | 450.8 | 0.391 |
| Reference | 316.9 | 19.1 | 300.0 | 346.2 | – |
| Vegetables [g] (F = 15.204; p < 0.001b) | |||||
| A | 484.4 | 89.3 | 334.5 | 602.4 | 0.001 |
| B | 761.3 | 185.0 | 482.1 | 1021.3 | 1.000 |
| C | 551.2 | 175.6 | 290.7 | 922.3 | 0.025 |
| D | 424.4 | 125.1 | 272.8 | 641.6 | < 0.001 |
| E | 384.2 | 95.0 | 240.8 | 540.3 | < 0.001 |
| F | 337.5 | 69.4 | 248.8 | 472.2 | < 0.001 |
| G | 327.7 | 53.3 | 248.8 | 413.4 | < 0.001 |
| Reference | 744.2 | 124.2 | 572.6 | 861.4 | – |
| Fish [g] (F = 0.634; p = 0.726b) | |||||
| A | 35.3 | 39.2 | 0.0 | 83.3 | 0.997 |
| B | 33.3 | 88.2 | 0.0 | 233.3 | 0.995 |
| C | 19.6 | 40.9 | 0.0 | 120.0 | 0.839 |
| D | 11.9 | 31.5 | 0.0 | 83.3 | 0.714 |
| E | 12.0 | 37.9 | 0.0 | 120.0 | 0.654 |
| F | 8.8 | 27.9 | 0.0 | 88.2 | 0.571 |
| G | 8.8 | 27.9 | 0.0 | 88.2 | 0.571 |
| Reference | 49.0 | 109.6 | 0.0 | 245.0 | – |
| Sugar total [g] (F = 44.278; p < 0.001b) | |||||
| A | 30.1 | 9.2 | 5.1 | 40.1 | < 0.001 |
| B | 1.2 | 1.6 | 0.0 | 3.8 | 1.000 |
| C | 33.7 | 3.6 | 31.3 | 43.1 | < 0.001 |
| D | 1.3 | 1.6 | 0.0 | 3.8 | 1.000 |
| E | 27.4 | 12.7 | 2.7 | 56.2 | < 0.001 |
| F | 33.3 | 2.6 | 31.3 | 39.3 | < 0.001 |
| G | 33.1 | 2.4 | 31.3 | 39.3 | < 0.001 |
| Reference | 2.2 | 2.5 | 0.0 | 5.9 | – |
| Legumes [g] (F = 43.320; p < 0.001b) | |||||
| A | 3.8 | 11.9 | 0.0 | 37.5 | < 0.001 |
| B | 0.0 | 0.0 | 0.0 | 0.0 | < 0.001 |
| C | 9.1 | 11.9 | 0.0 | 28.1 | < 0.001 |
| D | 0.0 | 0.0 | 0.0 | 0.0 | < 0.001 |
| E | 1.5 | 3.1 | 0.0 | 7.5 | < 0.001 |
| F | 0.0 | 0.0 | 0.0 | 0.0 | < 0.001 |
| G | 0.0 | 0.0 | 0.0 | 0.0 | < 0.001 |
| Reference | 43.3 | 10.5 | 26.3 | 52.5 | – |
| Nuts and seeds [g] (F = 350.946; p < 0.001b) | |||||
| A | 0.0 | 0.0 | 0.0 | 0.0 | – |
| B | 0.0 | 0.0 | 0.0 | 0.0 | – |
| C | 1.5 | 3.4 | 0.0 | 10.0 | < 0.001 |
| D | 0.0 | 0.0 | 0.0 | 0.0 | – |
| E | 0.0 | 0.0 | 0.0 | 0.0 | – |
| F | 0.0 | 0.0 | 0.0 | 0.0 | – |
| G | 0.0 | 0.0 | 0.0 | 0.0 | – |
| Reference | 30.0 | 0.0 | 30.0 | 30.0 | – |
| Whole grain cereal products [g] (F = 12.651; p < 0.001b) | |||||
| A | 252.0 | 6.3 | 250.0 | 270.0 | 0.009 |
| B | 240.0 | 0.0 | 240.0 | 240.0 | 0.094 |
| C | 184.5 | 47.8 | 50.0 | 220.0 | 0.978 |
| D | 130.0 | 0.0 | 130.0 | 130.0 | 0.003 |
| E | 218.0 | 15.5 | 200.0 | 230.0 | 0.675 |
| F | 180.0 | 0.0 | 180.0 | 180.0 | 0.896 |
| G | 187.0 | 60.7 | 90.0 | 340.0 | 0.995 |
| Reference | 196.0 | 8.9 | 180.0 | 200.0 | – |
| Red meat [g] (F = 5.374; p < 0.001b) | |||||
| A | 12.6 | 26.5 | 0.0 | 102.3 | 0.668 |
| B | 81.5 | 53.9 | 0.0 | 159.9 | < 0.001 |
| C | 16.6 | 37.9 | 0.0 | 131.2 | 0.312 |
| D | 16.7 | 52.4 | 0.0 | 191.8 | 0.380 |
| E | 56.9 | 56.3 | 0.0 | 132.5 | 0.001 |
| F | 21.3 | 43.2 | 0.0 | 115.1 | 0.103 |
| G | 21.3 | 43.2 | 0.0 | 115.1 | 0.103 |
| Reference | 0.0 | 0.0 | 0.0 | 0.0 | – |
| Processed white and red meat [g] (F = 3.534; p = 0.002b) | |||||
| A | 34.0 | 15.2 | 0.0 | 51.0 | 0.366 |
| B | 58.1 | 22.0 | 28.3 | 100.7 | 0.924 |
| C | 39.5 | 15.7 | 17.0 | 69.1 | 0.769 |
| D | 26.8 | 13.1 | 0.0 | 45.3 | 0.103 |
| E | 43.0 | 20.9 | 14.2 | 76.8 | 0.969 |
| F | 31.9 | 11.5 | 14.4 | 47.2 | 0.264 |
| G | 31.9 | 11.5 | 14.4 | 47.2 | 0.264 |
| Reference | 49.7 | 32.1 | 0.0 | 76.8 | – |
All hospitals successfully met five criteria concerning intake of protein, carbohydrate, fiber, whole grains, and vegetables and fruits. Hospitals A, B, C, D, E met eight out of thirteen criteria, while hospitals F and G met seven out of thirteen criteria. A summary of the results is presented in Table VI.
Table VI
Summary of recommendations fulfilled by hospitals
Discussion
The results of our study show a significant discrepancy between the recommendations and meals received by the patients. Although every hospital provided a “diabetic diet”, its quality was inadequate and unadjusted. The lack of appropriate nutritional patterns promoted in the hospital raises the potential for patients to make nutritional mistakes, which could negatively impact the control of DM. According to the recommendations of the Polish Diabetes Association, there is no universal diet for all people with diabetes [12]. Optimal macronutrient proportions for people with diabetes should be determined individually, taking into account age, physical activity, presence of diabetes complications, comorbidities, and personal preferences. Implementing the proper dietary recommendations can be challenging for diabetics, who are generally in good health. For those who undergo hospitalization or treatment, procedures maintaining glycemic control can be even more difficult. Failure to follow prescribed treatments, particularly dietary recommendations, is a critical issue in managing DM [18, 19].
The crucial role of healthcare providers in encouraging individuals with DM to adopt health-promoting behaviors has been highlighted in many studies [20, 21]. Research confirmed improved management of diabetes among patients who received care from a multidisciplinary team [19, 22]. Doctors and nurses play a significant role, as they interact with patients most frequently [23]. They are usually the first to notice glycemic irregularities and dietary and treatment errors. The Polish Diabetes Society emphasizes that education provided by authorized professionals (doctors, diabetes nurses, dietitian, diabetes educators) is crucial for proper diabetes management [12]. Effective communication between doctors and patients enhances patient satisfaction, boosts adherence to treatment plans, and results in better health outcomes [24]. Discussion of self-care successes and failures with physicians enables treatment to be individualized and increases the likelihood of success [25]. Detailed dietary recommendations should be individualized according to the patient’s needs and capabilities. Three out of seven examined hospitals did not have a dietician permanently available on the ward. In two of them, nutritional education was not provided at all. This presents a suboptimal scenario wherein delivering comprehensive assistance to a patient with diabetes becomes challenging.
Analysis of the menus demonstrates that they did not meet the criteria for a diet tailored to the needs of diabetic patients. The menus contained typical nutritional errors representing the nutritional pattern of the Polish population: insufficient intake of whole grain products, legumes and fish and excessive intake of meat and meat preserves [26]. Although all hospitals met the requirements regarding the amount and percentage of carbohydrates, only two out of seven hospitals met the criteria regarding the intake of mono- and disaccharides. Research and recommendations show a lack of sufficient scientific evidence for determining one optimal amount of carbohydrates in the diet of people with diabetes [10, 27]. Emphasis should be placed on high-quality, nutrient-dense carbohydrate sources that are rich in fiber. Intake of mono- and disaccharides should be limited to the minimum [12]. Consistent consumption of an adequate amount of dietary fiber is linked to a reduced risk of all-cause mortality in individuals with diabetes [28, 29]. The primary source of carbohydrates should be whole grain cereal products, especially those with a low glycemic index (GI). Encouraging carbohydrate intake from vegetables, fruits, whole grains, legumes, and dairy products is recommended over consumption from other carbohydrate sources, especially those containing added fats, sugars, or sodium [4, 27]. Low-GI diets may be useful for glycemic control and may reduce body weight in people with prediabetes or diabetes [30]. A meta-analysis [30] revealed that low-GI diets effectively reduced glycated hemoglobin, fasting glucose, BMI, total cholesterol, and LDL, but did not impact fasting insulin, HOMA-IR, HDL, triglycerides, or insulin requirements. In principle, every hospital adhered to the requirement of including two whole grain products daily. Upon closer examination, it becomes evident that this primarily consisted of whole-grain bread. Products such as oat flakes, brown rice, millet and buckwheat were either absent or only occasionally featured in other menus.
The fat composition was also inadequate. Three out of seven hospitals exhibited excessive fat intake, and only one met the criteria for limiting saturated fatty acids. According to the recommendations, the quality of fat is more important than its total quantity [12, 19]. Adhering to a Mediterranean eating pattern can enhance glycemic control and blood lipid levels and contribute to the reduction of CV risk [10]. Vegetable fats are recommended [19]. Patients are advised to increase their consumption of foods rich in long-chain omega-3 fatty acids from fatty fish and omega-3 linolenic acid. Evidence indicates that high-monounsaturated fatty acid (MUFA) diets are associated with improved glycemic control and CV disease risk or risk factors [31]. None of the menus contained seeds, nuts or fatty fish, but poultry, meat and butter were included every day in most of the meals. Given this distribution of fat sources, meeting recommendations and achieving a well-balanced diet is unfeasible.
The recommendations for protein intake for patients with diabetes align with those for the general population [12, 19]. All the examined hospitals met the stipulated protein requirements. However, the distribution of protein sources was not optimal. Animal protein predominated, surpassing plant protein by approximately 1.5 times. The prevalence of animal protein contributes to an elevated intake of saturated fatty acids, with six out of the seven surveyed hospitals falling short of the recommended limit. A closer examination of meal compositions revealed minimal inclusion of plant proteins, with legumes present in trace amounts and the absence of nuts and seeds. Legumes share several characteristics with whole grains that could potentially benefit glycemic control, including the presence of slow-release carbohydrates and a high fiber content [21]. According to the recommendations, diabetic patients should receive 4–6 meals with a 3–4 h break between them [17]. Three out of seven examined hospitals offered only three meals a day, which was insufficient and could lead to deterioration of glycemic control and increased risk of hypoglycemia. According to some interpreters, incorrect nutrition is inconsistent with current medical knowledge and should be considered a violation of the Act on Patient Rights and the Act on the Patient Ombudsman [32]. Medical entities – hospitals and clinics – are responsible for providing the proper diets. Given all the mentioned deficiencies in hospital nutrition, it is necessary to consider whether and how state authorities should oversee its quality. New legal regulations are also needed. The National Health Fund, as the authorized body, would then have a stronger basis and duty for assessing the quality of hospital nutrition and its compliance with the requirements.
Limitations: The largest limitation of the study is the relatively small number of examined hospitals, which may affect its representativeness. Nonetheless, despite the sample size, the results underscore the severity of the issue from a specific viewpoint. We analyzed 70 menus, which were received by a considerable number of patients. Each hospital’s capacity, based on its province and annual occupancy rate, allows us to estimate the total number of patient beds and hospitalization days. For example, hospital 1 has 1,035 beds, hospital 2 has 452 beds, hospital 3 has 683 beds, hospital 4 has 677 beds, hospital 5 has 363 beds, hospital 6 has 176 beds, and hospital 7 has 321 beds. Summing these data helps us determine the number of patients missing out on nutritional education, impacting the healthcare system negatively. Hospitals 1, 2, and 3 are in the Mazowieckie Voivodeship, with an average of 40.8 patients per bed per year, resulting in (2,170 × 40.8) 88,536 patients. Hospitals 4, 6, and 7 are in the Śląskie Voivodeship, with an average of 36.2 patients per bed per year, resulting in (1,174 × 36.2) 42,498.8 patients. Hospital 5 is in the Łódzkie Voivodeship, with an average of 42.4 patients per bed per year, resulting in approximately 15,391 patients annually. Adding these numbers, we get an estimated total of 146,425.8 patients. The limited number of hospitals results from the scarce availability of data, complicated access to the person responsible for hospital nutrition and not providing us with necessary data (such as portion sizes, preparation methods, and specific diets). Therefore more research on the topic is needed. Another limitation arises from the operation of the Dieta 6 program, which uses approximations to estimate nutritional values. The program also includes pre-prepared standardized dishes, such as soups, which may differ from the actual meals and slightly impact the values of the meals.
In conclusion, our current data revealed that the so-called “diabetic” diets failed to meet patient requirements. This suggests an insufficient level of public awareness on the subject [21]. Insufficient nutrition education during hospitalization may lead to potential post-discharge dietary errors leading to deterioration in glycemic regulation and lipid profiles, and heightened susceptibility to complications. In the situation where doctors and nurses are often overburdened with work and there is a small number of dietitians on the wards, meals received during a hospital stay are of particular importance – sometimes they are the only form of education. To address these challenges effectively, it is essential to implement policy reforms, initiate extensive educational campaigns, and establish regular and binding quality controls for hospital nutrition. Additionally, more research on this topic is needed to exert pressure on decision-making bodies such as the National Health Fund and the Ministry of Health. By recognizing and actively addressing the disparities uncovered in this research, we can improve the care of diabetic patients and ultimately enhance their overall health. This preliminary study not only draws attention to present challenges but also establishes a basis for promising future research opportunities.