Introduction
Alzheimer’s disease (AD) is the most common cause of dementia, and contributes to a significant disease burden worldwide [1, 2]. Aggregation and deposition of amyloid-β (Aβ) is an important pathological mechanism of AD [3].
The role of the plasminogen system in the pathogenesis of AD is closely related to Aβ. Animal experimental studies demonstrated that tissue plasminogen activator (tPA)-mediated reduction of plasminase activity could lead to Aβ deposition during aging [4, 5], and t-PA administration could reduce AD-related pathological progression by reducing the Aβ level in the brain and improving cognitive function [6], which may be related to t-PA’s involvement in Aβ clearance and neurovascular bonding [7]. However, no consensus has been reached [8, 9]. In addition to t-PA, urokinase plasminogen activator (u-PA) has also been found to protect cerebral cortex neurons from soluble Aβ-induced synaptic damage [9, 10], but no association between the two has been found in experiments [4]. In addition, a small sample case-control study found that the plasminogen activator inhibitor-1 (PAI-1) level and PAI-1/t-PA ratio were significantly elevated in patients with mild cognitive impairment and AD [11–14]. It was also found in animal experiments that the expression of PAI-1 increased during aging or Aβ deposition, and clustered around amyloid plaques [4, 15]. An increase of intracellular or extracellular PAI-1 may promote the aging of brain cells in AD patients, and aging astrocytes could induce neuronal apoptosis by secreting pathologically active molecules [16]. However, animal experiments and observational studies do not allow causal inference, and thus, the relationship between plasminogen activators and their inhibitors and AD needs to be further confirmed.
Mendelian randomization (MR), which utilizes genotype as an instrumental variable (IV) to infer associations between phenotypes and disease, avoids reverse causality inference and reflects the long-term effects of exposure on outcomes. Therefore, this study intended to explore the relationship between plasminogen activators and their inhibitors and Alzheimer’s disease through the MR method, so as to provide a reference for the prevention and control of Alzheimer’s disease.
Material and methods
Three assumptions of MR
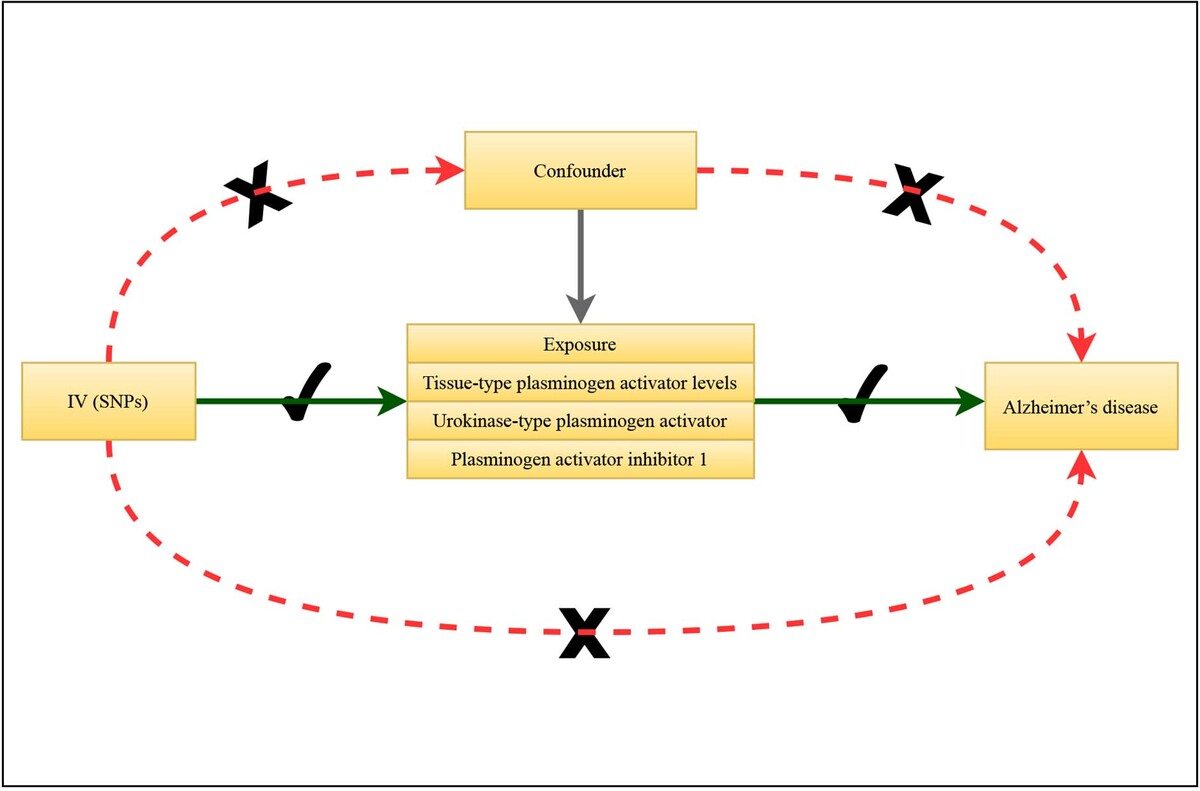
In MR research, genetic variation (single nucleotide polymorphism (SNP) is its most abundant form), which is strongly correlated with exposure factors, is selected as the instrumental variable, which refers to the exposure factors to be studied. By analyzing the association between genetic variation and exposure factors, and the association between genetic variation and outcome, the causal relationship between exposure factors and outcome could be inferred. The research needs to satisfy three assumptions: (1) the genetic variant is strongly associated with the exposure; (2) the genetic variant is independent of confounding factors of the association between exposure and outcome; (3) the genetic variant only affects the outcome via exposure. The graphical abstract shows the study procedure.
Data source
The tissue-type plasminogen activator phenotypes were extracted from 13 European ancestry cohorts up to 21,758 participants. The data provided by each cohort were fed into the 1000 Genomes Project phase 3 reference or later or to the Haplotype Reference Consortium (HRC) reference, which resulted in the testing of 21.4 M SNPs. A genome-wide association study (GWAS) was performed on two proteases – urokinase-type plasminogen activator and plasminogen activator inhibitor 1 – based on the INTERVAL study of European ancestry by Folkersen et al. [17]. The INTERVAL study included about 50,000 participants nested within a randomized trial of varying blood donation intervals. 2,731 and 831 participants were randomly selected from two non-overlapping sub-cohorts. A total of 3,301 participants (2,481 and 820 in the two sub-cohorts) remained for analysis after genetic quality control.
The summarized GWAS datasets for unspecified AD (Supplementary Table SI) were obtained from the FinnGen consortium (with genotype information for more than 16 million SNPs), which were curated, quality controlled, and harmonized in the IEU GWAS database (https://gwas.mrcieu.ac.uk/). The unspecified AD included 215,052 individuals, while the trait of unspecified AD (more controls excluded) excluded AD cases in its controls.
Data in the current study are publicly available and de-identified. Each GWAS involved obtained informed consent from participants, and received ethical approval from its respective institutions. Therefore, no ethical approval from the institutional review board (IRB) of the Sixth Hospital of Shanxi Medical University (General Hospital of Tisco) was required.
SNP screening methods
SNPs that are strongly correlated with exposure (p < 5 × 10⁻⁶) were selected to ensure that the MR correlation assumption (assumption 1) was satisfied; SNPs with LD were removed for being palindromic with intermediate allele frequencies (clump: r2 = 0.01, kb = 1000).
Pleiotropy refers to a genetic variant being associated with multiple risk factors in different causal pathways. If a genetic variant used as an IV is additionally related to another risk factor for the outcome, then either the second or the third IV assumption is violated, and the variant is not a valid IV. If pleiotropy leads to the genetic variant being associated with the outcome via a confounding variable, then the second assumption is violated. If pleiotropy leads to an alternative causal pathway from the variant to the outcome not via the exposure of interest, then the third assumption is violated.
The effect of SNPs on outcomes and exposure was harmonized so that both had the same allele. Outcome-related SNPs were removed from the IV (assumption 3).
To examine level pleiotropy, the removal of the IV may affect confounding SNPs through other exposures. Horizontal pleiotropy was tested using MREgger regression (assumption 2). “TwoSampleMR” (mr_pleiotropy_testfrom https://mrcieu.github.io/TwoSampleMR/articles/introduction.html#background R package).
Test
The strength of the association between the IV and exposure (assumption 1) was tested using r2 = 2 × EAF × (1 – EAF) × b2/SD2, F = r2*(N – 2)/(1 – r2), MAF – minor allele frequency, b – beta, SD – standard difference; K – number of IVs; N – sample size.
Cochran’s Q statistic has been used to study heterogeneity. This is a weighted sum of the squared distances of the variant-specific estimates from the overall IVW estimate.
Null hypothesis: each variant identifies the same causal parameter. J – Number of genetic variants.
If heterogeneity exists, the results and conclusions obtained need to be treated with caution.
Statistical analysis
MR analysis: The main analysis method of MR is inverse-variance weighting (IVW), and the results are based on IVW analysis results. The weighted-median method and MR-Egger are the supplementary verifications for IVW results, and if they are consistent with the IVW results, the MR analysis results are considered to be statistically significant. In this study, two-way MR analysis was performed for statistically significant results of the main analysis. In addition, MR-PRESSO was used to test the pleiotropy of heterogeneity at the result level.
IVW: Based on the fixed-effects model, the Wald ratio method was used to obtain unconfounded estimates of the genetically predicted exposure’s effect on outcome, which was the primary analysis for generating causal effect estimates in our study.
Weighted-median: A robust and consistent estimate of the effect was provided, even though nearly 50% of genetic variants were invalid instruments.
MR-Egger: A weighted linear regression was applied. However, the estimates of MR-Egger generally exhibited low precision and might be affected by outlying genetic variants.
MR-PRESSO (outlier tests): The MR-PRESSO analysis detected and attempted to reduce horizontal pleiotropy by removing significant outliers. But the MR-PRESSO outlier test required at least 50% of the genetic variants to be valid instruments, and relied on instrument strength independent of direct effect (InSIDE) assumptions.
MR-RAPS: A robust adjusted profile score was used. The profile likelihood of the Wald ratio (or ratio estimates) was maximized, accounting for weak instrument bias, pleiotropy and extreme outliers.
Results
SNP screening
First, the exposed SNPs were screened using p < 5 × 10⁻⁶, and SNPs meeting the conditions were screened out and counted (the second column of Table I). Then, the linkage imbalance was removed (the third column of Table I). Finally, SNPs related to the outcome were matched, and the final SNPs were screened (the fourth column of Table I).
Table I
Variable screening process
Main analyses
Correlation strength, pleiotropy, and heterogeneity testing was performed. The final calculated F-values were all greater than 10 (strength in Table II). This satisfied Mendelian randomization assumption 1. When the MR-Egger intercept test and MR- PRESSO global test were used for testing horizontal pleiotropy, all p- valuess were > 0.05 (Columns 4-5 in Table II), and the result showed no horizontal pleiotropy, this satisfied assumptions 2 and 3. Heterogeneity was not detected by the two heterogeneity test methods, and all the p- valuess were > 0.05 (columns 6–9 of Table II).
Table II
Horizontal pleiotropy and heterogeneity of instrumental variables
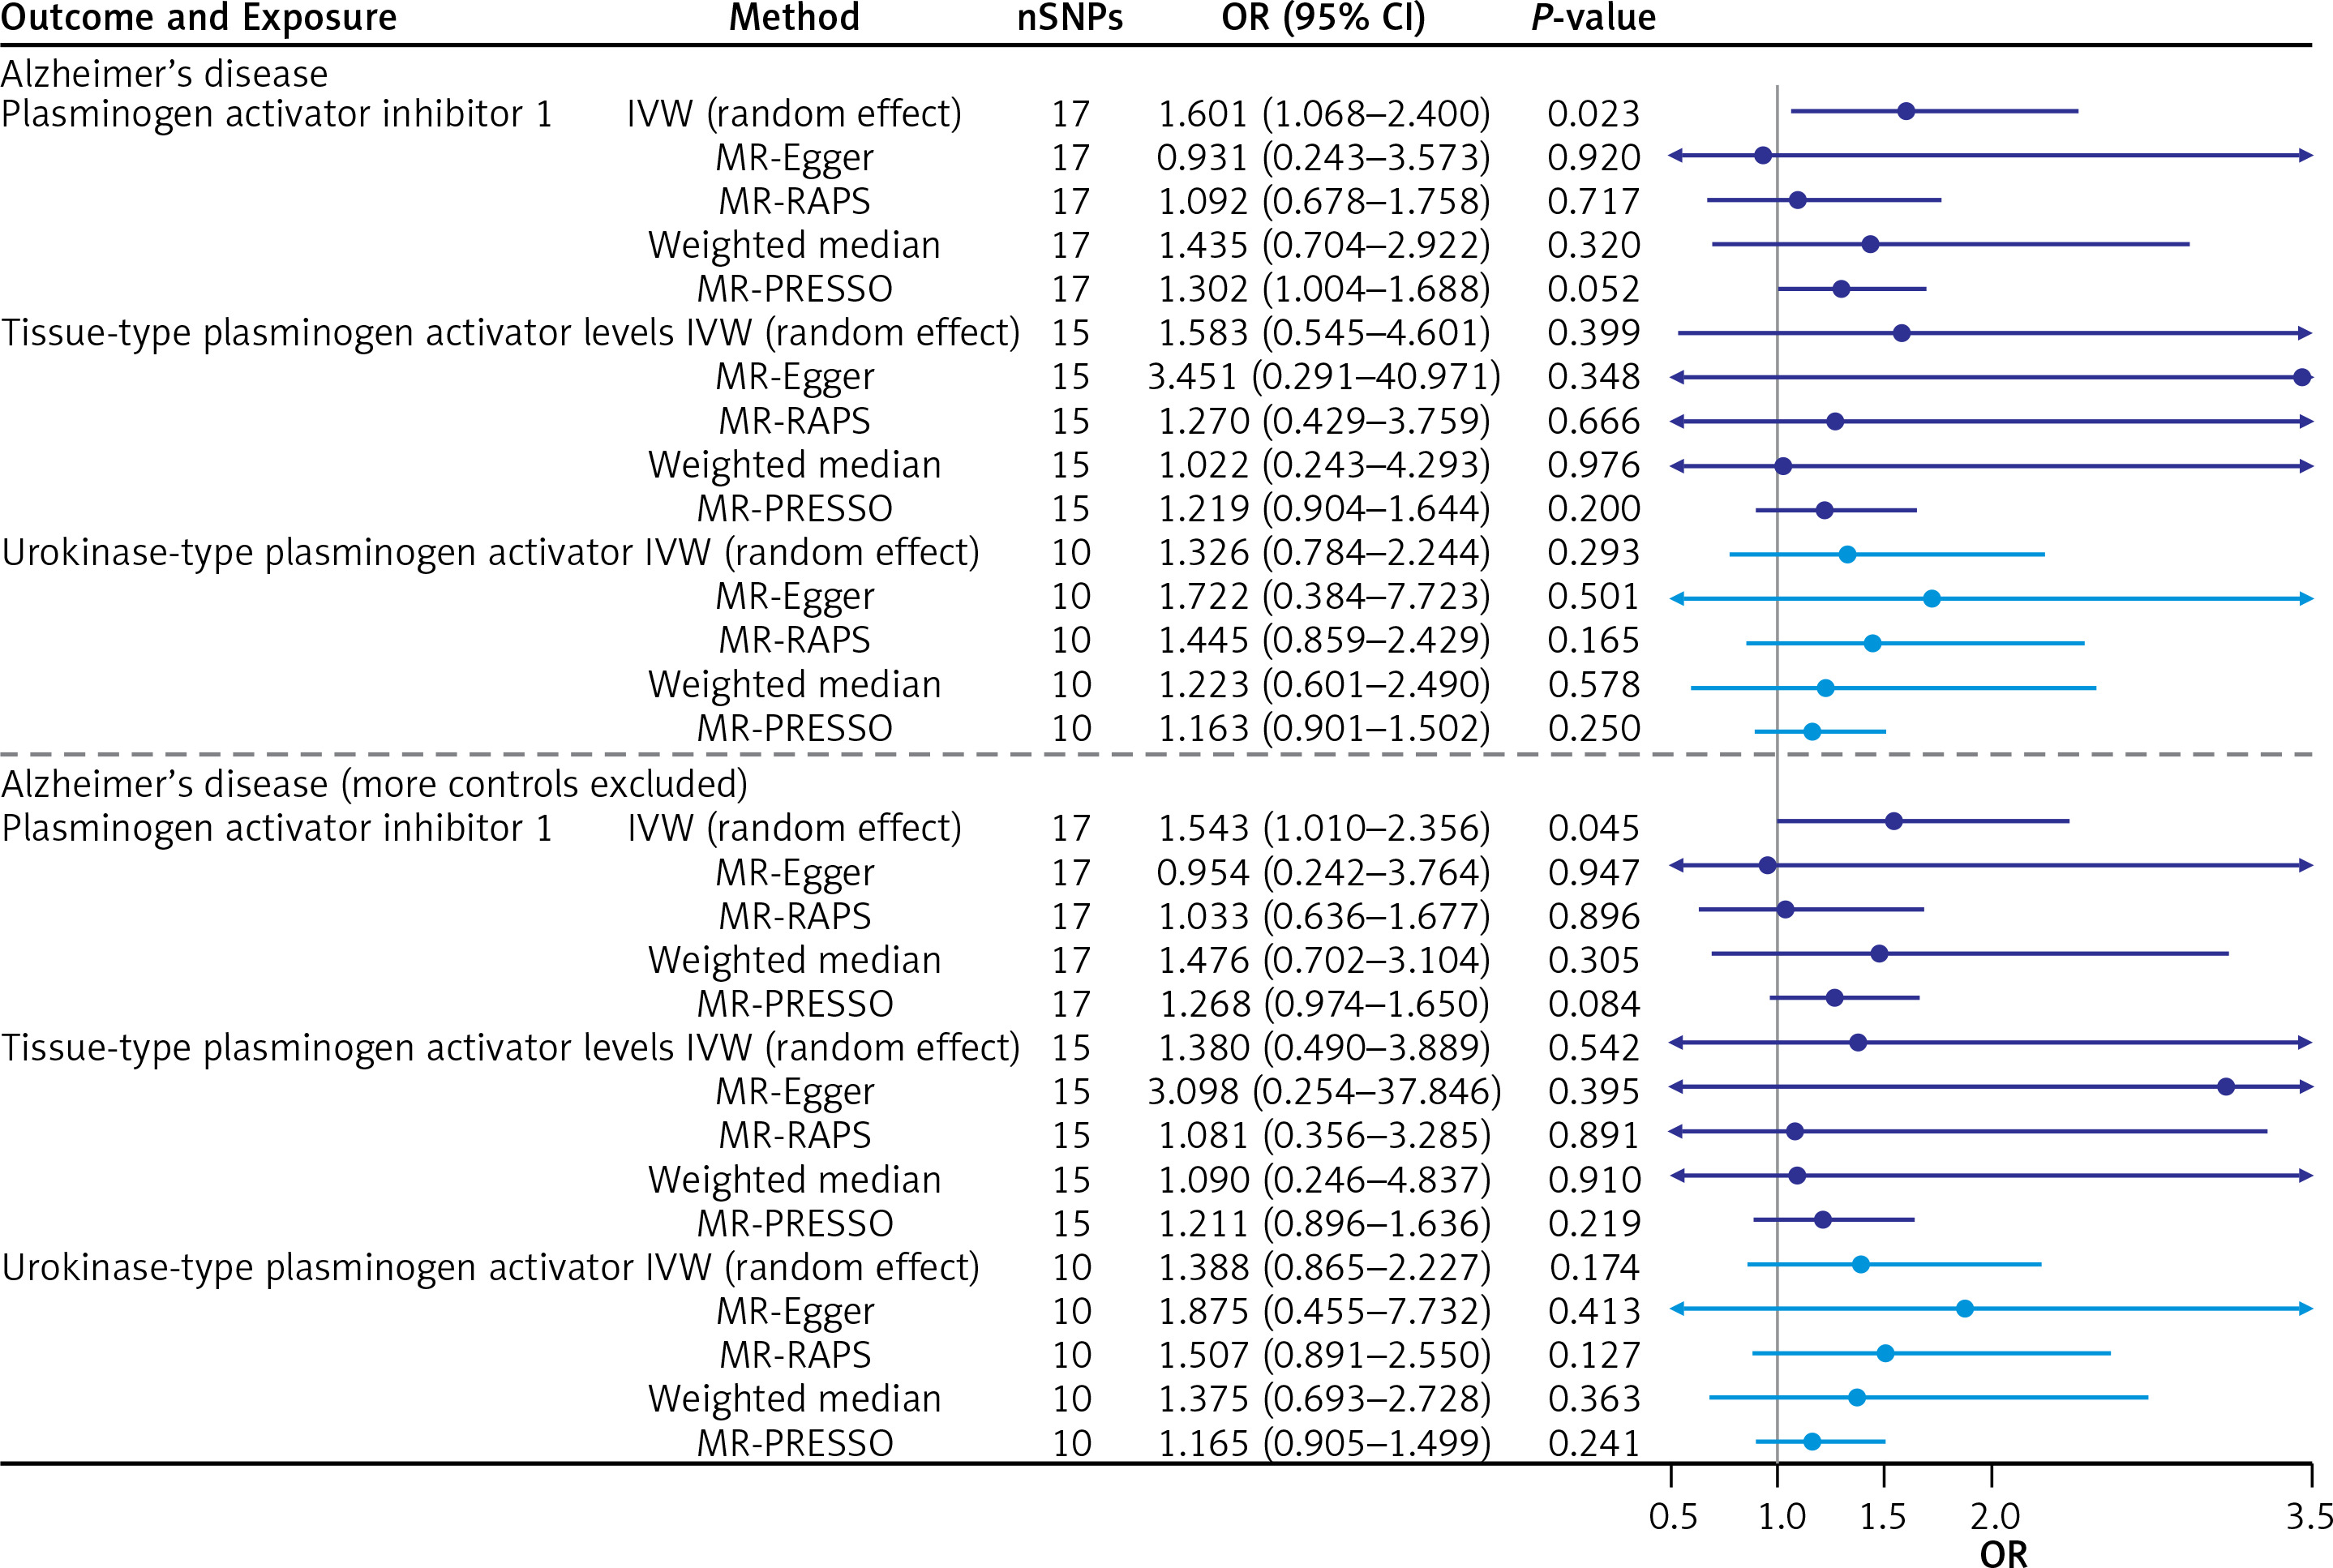
After the test was completed, MR analysis was started. In Alzheimer’s disease, the IVW effect of plasminogen activator inhibitor 1 OR (95% CI) was 1.601 (1.068–2.400), and the interval did not contain 1 and p = 0.0226, which showed that plasminogen activator inhibitor 1 was positively correlated with the risk of Alzheimer’s disease.
Sensitivity analyses
IVW model, weighted median, MR-PRESSO and MR-RAPS all showed similar results (OR value > 1). In the outcome of Alzheimer’s disease (more controls excluded), the IVW effect of plasminogen activator inhibitor 1 OR (95% CI) was 1.543 (1.010–2.356), and the interval did not contain 1 and p = 0.0448. In conclusion, plasminogen activator inhibitor 1 was positively correlated with the risk of Alzheimer’s disease (more controls excluded). IVW model, weighted median, MR-PRESSO and MR-RAPS all showed similar results (OR value > 1). Both outcomes were consistent (Table III).
Table III
MR results
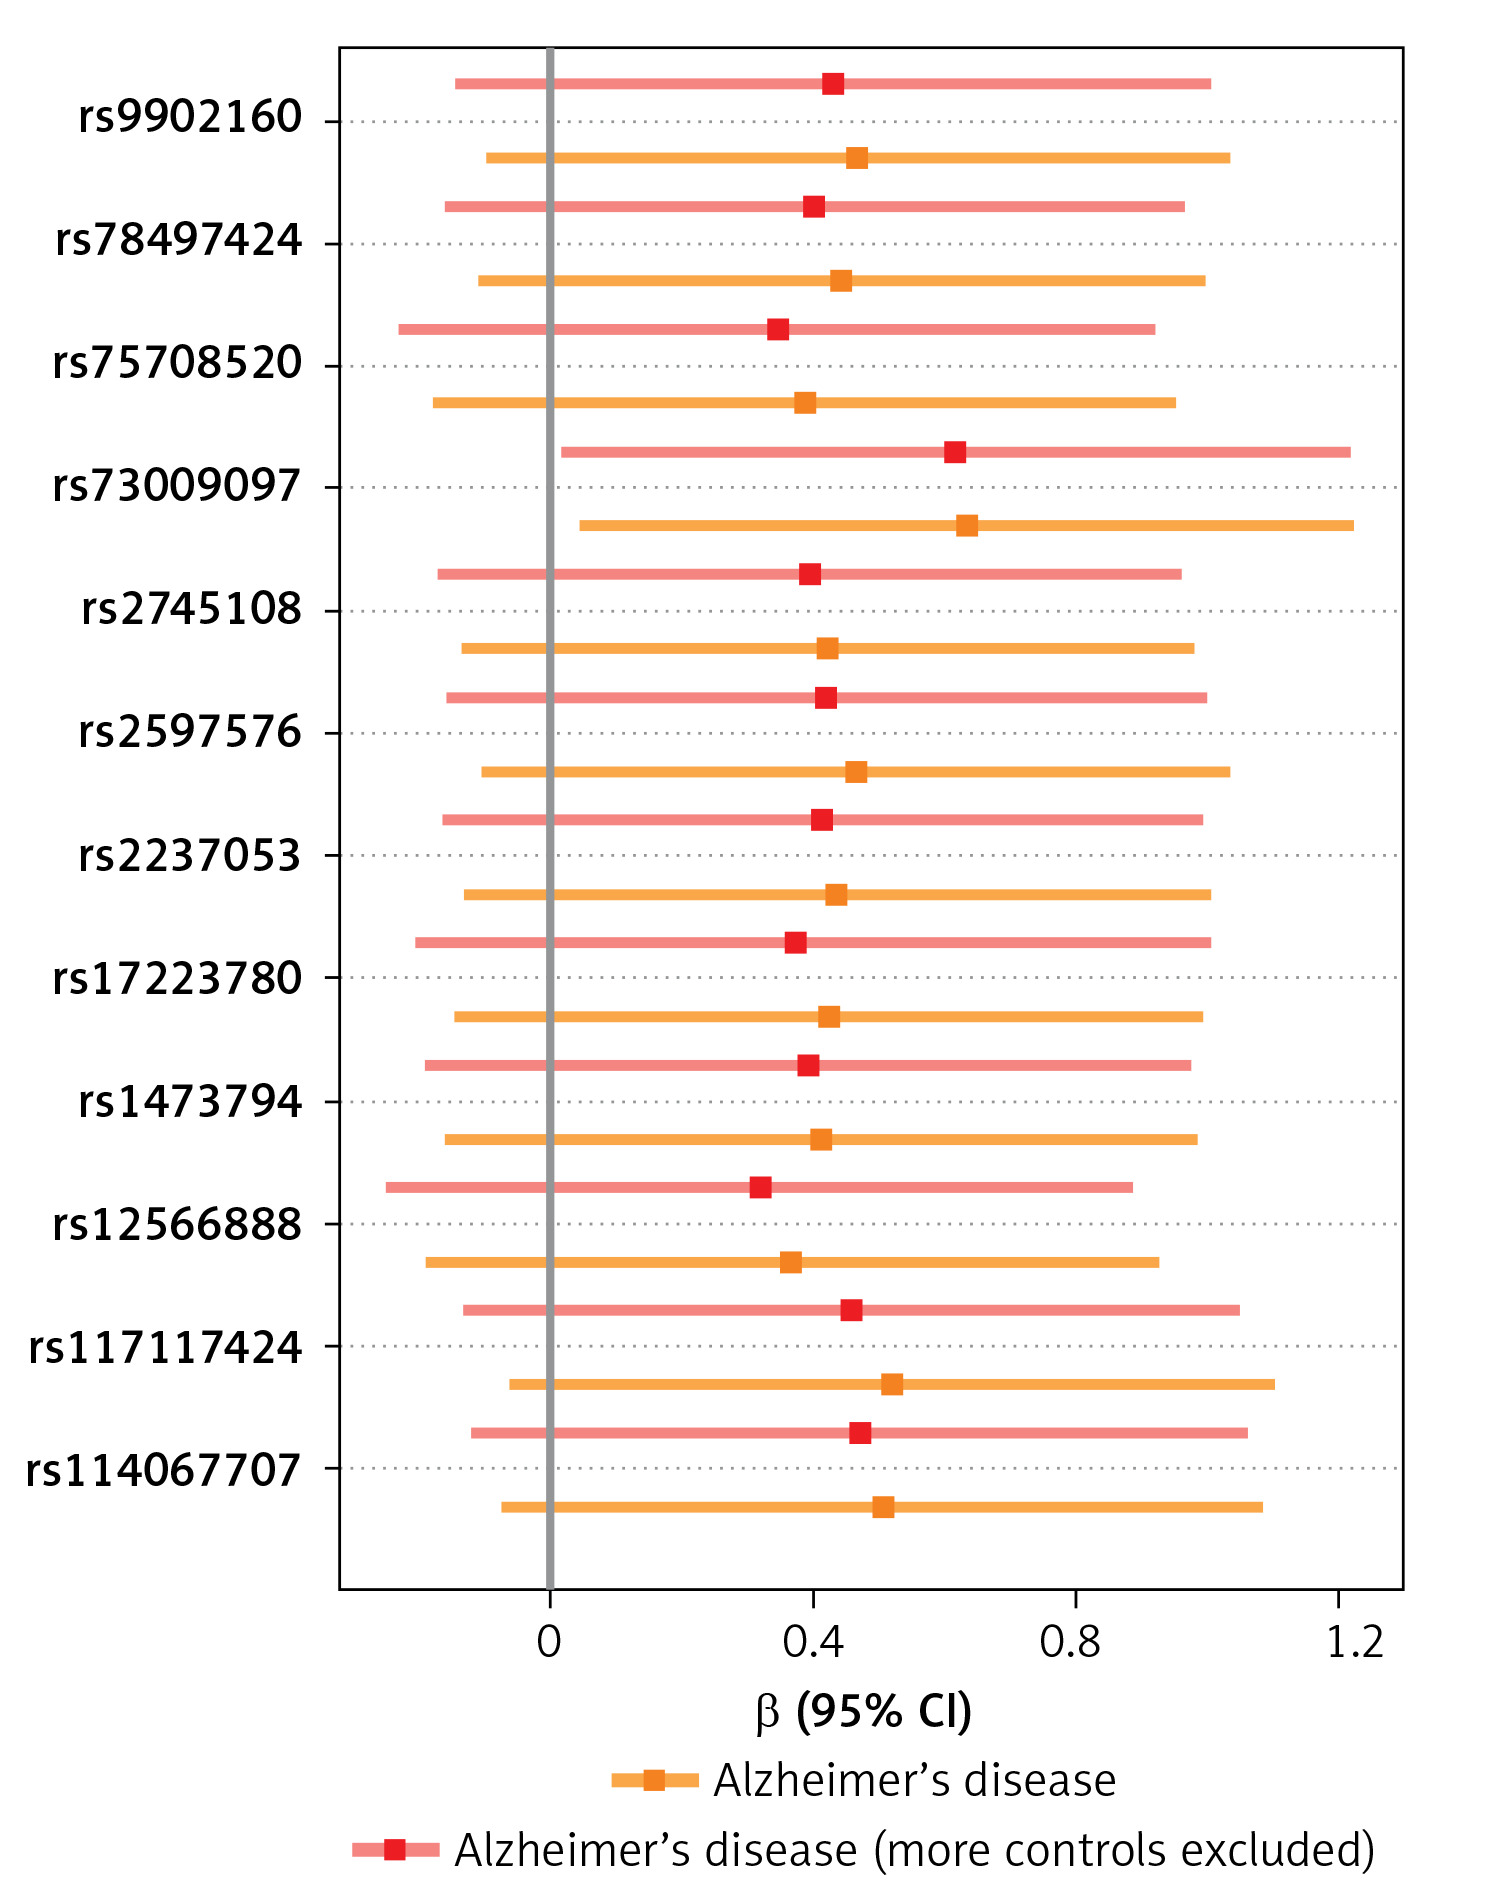
A visual scatter plot was used to further illustrate the robustness of the positive results. The fit line (blue line) of the IVW in the graphical abstract was upward (i.e. the slope was positive). It further indicated that plasminogen activator inhibitor 1 was positively correlated with Alzheimer’s disease and risk of Alzheimer’s disease (more controls excluded). The more evenly scattered points were distributed on the left and right sides of the blue line, the less heterogeneity there was. Figure 1 further illustrates that there was no heterogeneity in the selected SNPs. Leave-one-out method results for sensitivity analysis of positive results are shown in Figure 2. “Leave one out” means to gradually remove each SNP, calculate the effect of the remaining SNPs, and observe whether the result changes after the removal of each SNP. If the result changes greatly after the removal of a SNP, it indicates that there is a SNP that has a great impact on the result, which we do not want to see. The aim is to prevent false positives in the positive results obtained because the effect of one or several SNPs is too strong. As shown in Figure 3, when any SNP was removed, the IVW result point estimates (black squares in the line segment) of the remaining SNPs were to the right of OR = 1 (the vertical gray line was the dividing line of OR = 1), that is, the OR value > 1. This further demonstrated the robustness of the results. The forest plots illustrated the causal relationship of PAI-1, t-PA and u-PA with AD, as shown in Figure 4.
Figure 1
The scatter plot was drawn for positive results of plasminogen activator inhibitor 1 and the two outcomes. It can be seen that the blue line trends upward, indicating a positive correlation, which is consistent with the results shown in Table III
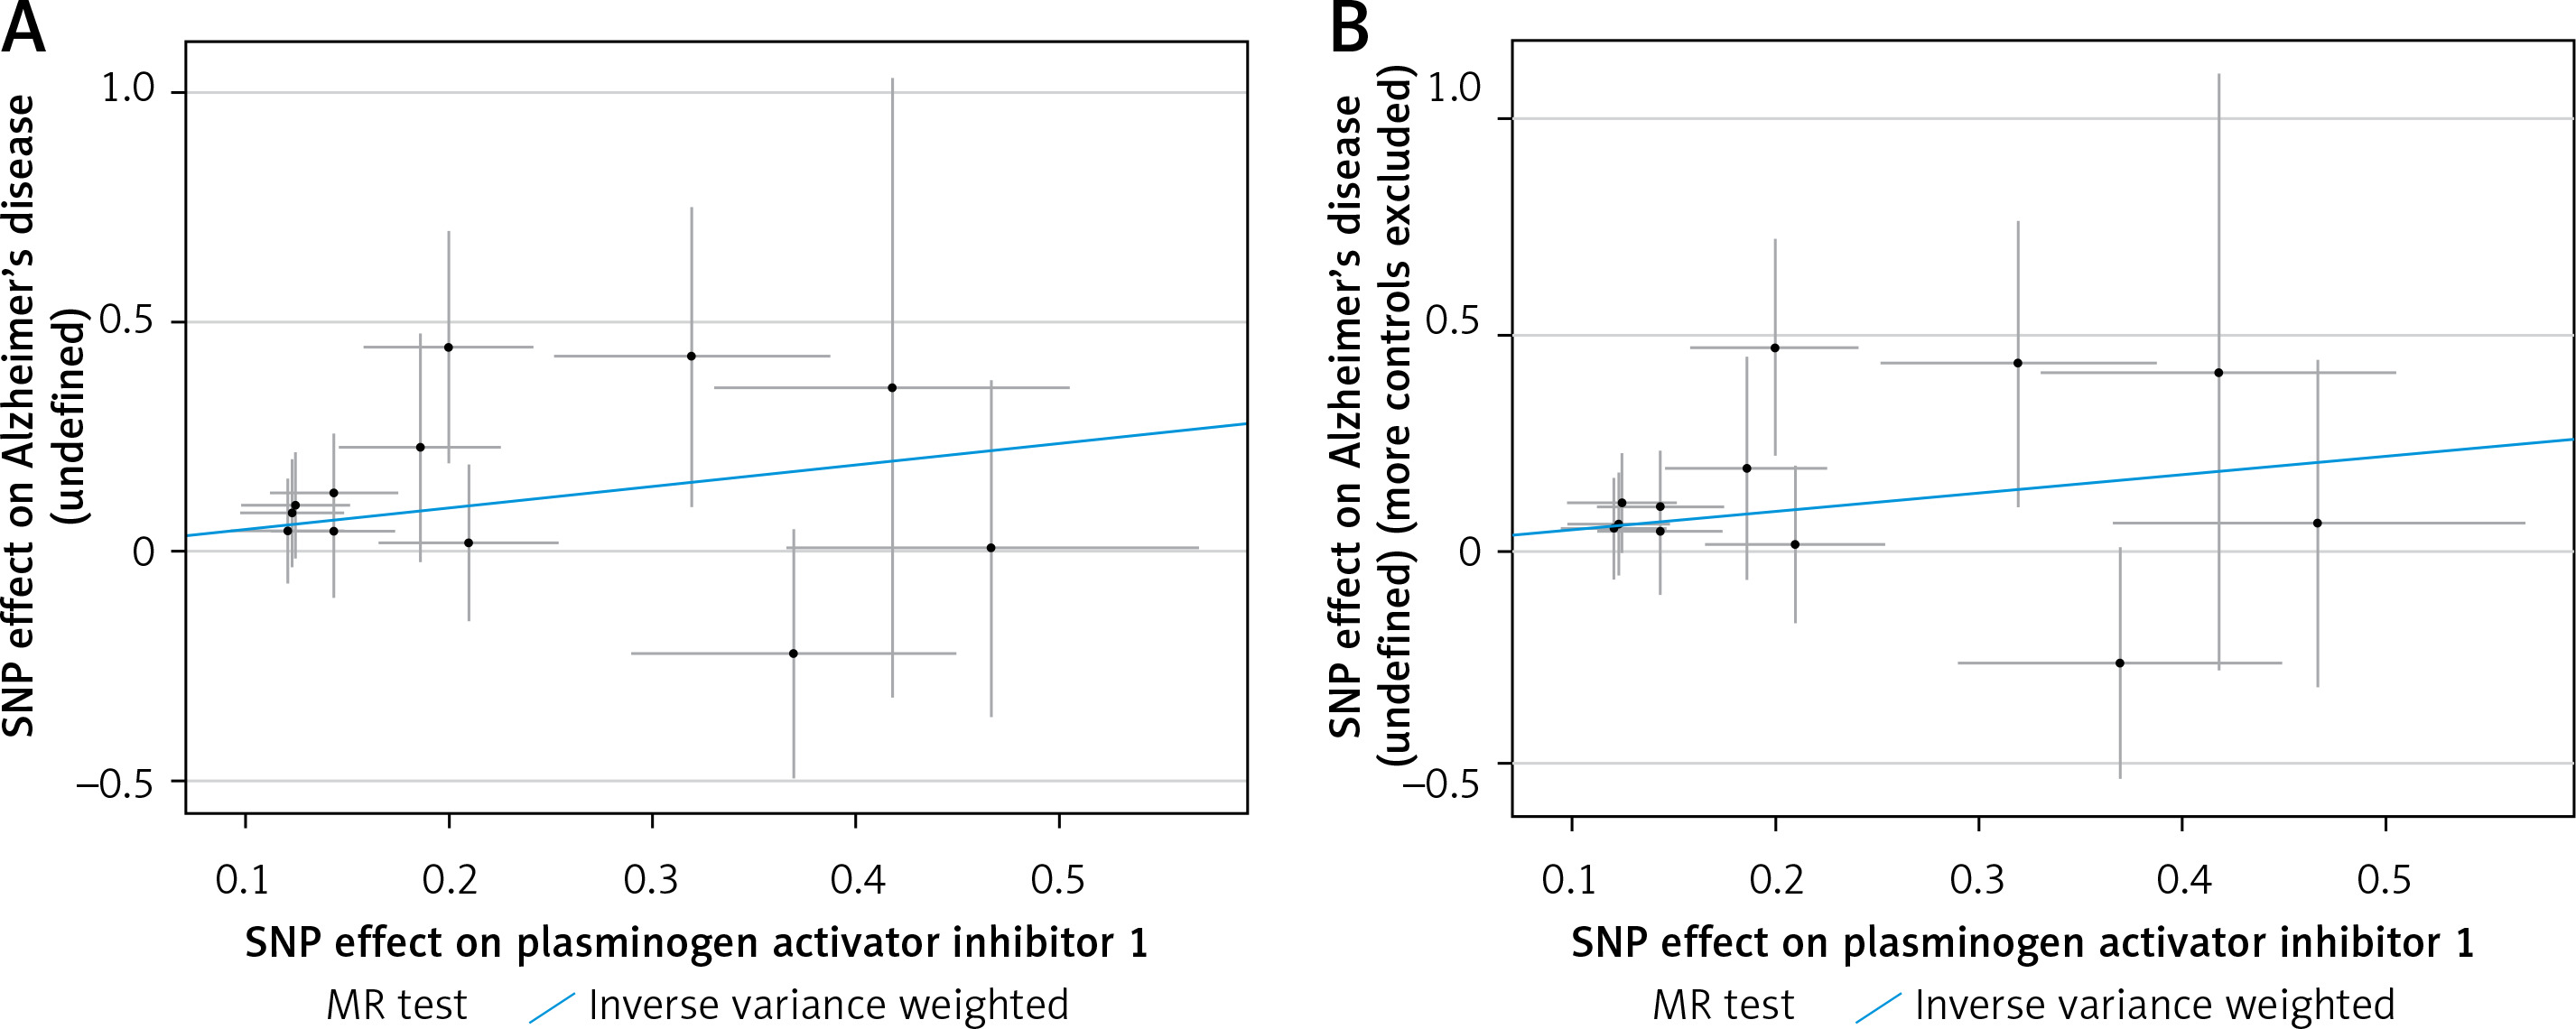
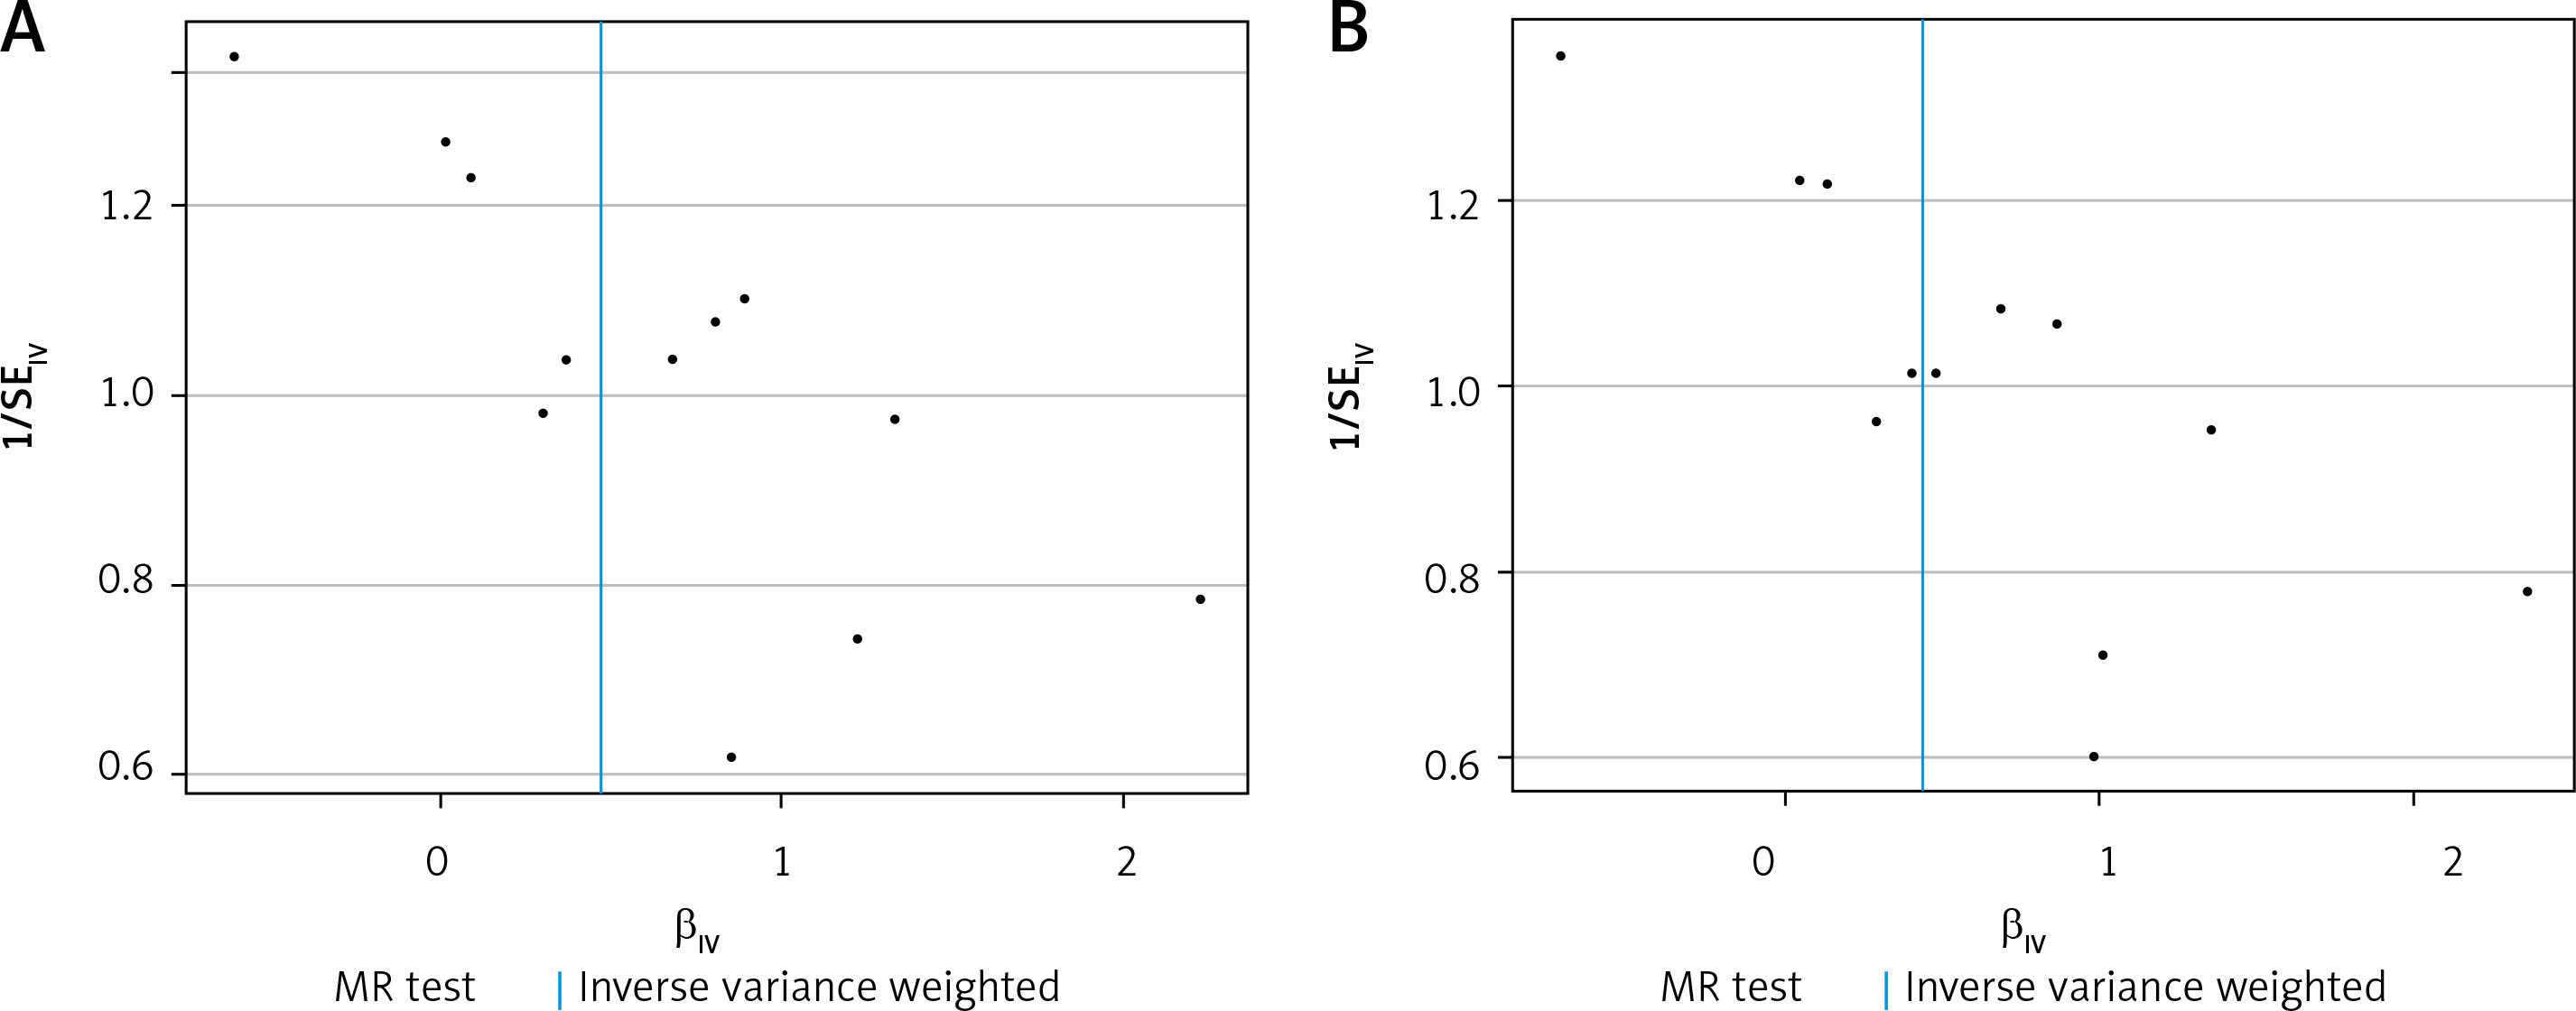
Figure 2
In the funnel plot, it can be seen that the blue line is in the middle of all SNP scatter points, indicating that the selection heterogeneity of SNPs is small
Discussion
The present study was an MR study to explore the causal relationship between plasminogen activator, plasminogen activator inhibitor and AD. In this study, we found that genetically predicted PAI-1 expression was associated with an increased risk of AD, suggesting that PAI-1 might be one of the risk factors for AD at the genetic level.
PAI-1, t-PA, and u-PA are important active substances in the fibrinolytic system, and their dynamic balance plays an important role in the normal physiological function of the body’s micro-vessels. AD, a progressive and degenerative brain disease, causes the occurrence of dementia [1, 18, 19]. AD pathology is characterized by the accumulation of amyloid, which consists of 39–43 amino acids cleaved from amyloid precursor protein (APP) [20, 21]. Aβ is neurotoxic and synaptically toxic, and the brain normally degrades and removes it [22]. An imbalance between Aβ production and clearance in the brain is central to the progression of AD. However, overproduction and deposition of Aβ result in early-onset familial AD, and decreased clearance of Aβ may be responsible for sporadic AD, which is more common than familial AD [23, 24]. Several Aβ degrading proteases have been identified as contributors to Aβ clearance, including insulin degrading enzymes, angiotensin converting enzymes, endothelin converting enzymes, neprilysins, and matrix metalloproteinases [25]. Tissue plasminogen activator (t-PA) can be involved in antibody clearance because it converts plasminogen to active plasmin, which is able to dissolve peptide fibrils [26, 27].
Earlier findings suggested that t-PA-activated plasmin may inhibit antibody aggregation and mitigate neurotoxicity. Under normal physiological conditions, PAI-1, an important inhibitor of the fibrinolytic pathway, inhibits u-PA and t-PA by forming complexes, thereby preventing the formation of plasmin [12, 28]. PAI-1 plays a variety of biological roles, including involvement in cell proliferation, apoptosis, adhesion, migration and signal transduction pathways. The expression of PAI-1 is regulated by many intrinsic (cytokines and growth factors) and extrinsic (cellular stress) factors. The gene encoding PAI-1 has multiple polymorphic sites, and the most studied site is 4G/5G polymorphism, which contains 4 or 5 (4G/5G) guanine bases at -675 of the PAI-1 promoters. When the PAI-1 gene is mutated, the level of PAI-1 increases, resulting in decreased fibrinolytic activity [11, 29, 30]. PAI-1 also plays a key role in various acute and chronic pathophysiological processes. It has been suggested that the imbalance of t-PA and PAI-1 can lead to thrombosis [15]. The level of PAI-1 in the blood of patients with cerebral infarction was significantly higher than that of normal people. In addition, the increase of blood PAI-1 level can be used as a predictor of recurrence of cerebral infarction, it is positively correlated with the recurrence of cerebral infarction, and the blood PAI-1 activity in patients with recurrent cerebral infarction is significantly higher than that in patients with primary cerebral infarction [31]. Cerebral infarction in animals is often accompanied by neurological symptoms, including convulsions, coma, and dyskinesia. If the site of cerebral infarction ruptures and causes intracranial hemorrhage, it can lead to death. Inhibition of PAI-1 expression has a thrombolytic effect, and it has certain guiding significance for predicting and treating cerebral infarction in animals [11, 23].
In this study, the genetic variation related to t-PA, u-PA, PAI-1 and AD was used as instrumental variables, and a Mendelian randomization study was conducted by screening the instrumental variables on the basis of the three basic assumptions, which helped avoid the influence of confounding factors and reverse causation. The causal association between t-PA, u-PA, PAI-1 and AD was better evaluated [32]. Secondly, the GWAS data sets on t-PA, u-PA, PAI-1 and AD are all from the largest data studies at present, and the very large sample size is also the advantage of this study. Finally, various methods were used to control the quality of the results, including the examination of the horizontal pleiotropy of the MR-Egger intercept, the treatment of weak instrumental variables by MR-RAPS and the analysis of sensitivity by the “leave-one-out” method, all of which ensured the robustness of the results and provided evidential support for the risk identification and prevention of Alzheimer’s disease [33, 34].
In addition, it is worth noting that there are some limitations of this study. The biggest concern is the pleiotropy of genetic variation in the innate environment. Pleiotropy can be divided into vertical pleiotropy, which means that SNPs affect one trait (exposure) and then another (outcome), and horizontal pleiotropy, which means that SNPs affect both traits independently. Vertical pleiotropy can be tested by MR analysis, which should avoid horizontal pleiotropy. Because SNPs may affect both traits through independent pathways, it is difficult to demonstrate that vertical pleiotropy due to exposure is not biased. In other words, SNPs as instrumental variables may also influence outcomes in ways we do not yet know. Therefore, the multi-effect problem is tested by the MR-Egger intercept in this study, and the bias caused by it is reduced as much as possible. Secondly, the GWAS data used in this study came from Europe, which may limit the generality of our study to populations in other regions. Whether there is a linear association between PAI-1 and Alzheimer’s disease needs to be further explored, and a possible threshold effect cannot be ruled out.
In conclusion, we explored the potential causal association of plasminogen activators and their inhibitors with AD. Our findings showed that genetically predicted PAI-1 expression was associated with an increased risk of AD. PAI-1 is a valuable marker for the occurrence of AD, which might provide new evidence for clinical intervention of AD.