Introduction
According to the WHO European Health Report 2012 the population of Europe is aging at an alarming pace. It is forecast that at the beginning of the 3rd decade of the 21st century, there will be over 1.2 billion postmenopausal women worldwide. Moreover, recent analyses indicated that the above numbers will have a growing tendency (the increase in the number of women over 50 years old is estimated to be over 2.5% every year). Every year over 25 million women worldwide experience menopause [1, 2]. In Poland, as well as in other developed countries, menopause occurs, on average, at the age of about 50 [3]. Menopause occurring in woman in the fifth decade of their life is a normal, physiological process associated with the reduction and finally loss of fertility caused by progressive loss of generative ovarian function. The occurring changes affect the functions that hormones, mainly estrogen, perform in the woman’s body. Thus, menopause leads to the occurrence and intensification of many psychological (mood changes including depression, irritability, memory impairment, problems with concentration) and/or somatic disorders including body composition change (anthropic processes such as osteoporosis, cachexia or sarcopenia and, on the other hand, weight gain resulting in being overweight or obese) as well as vasomotor dysfunctions (e.g. arterial hypertension, ischemic heart disease) that often manifest themselves in this period of life. Moreover, it was noted that metabolic syndrome, which comprises abdominal obesity, low high-density lipoproteins (HDL) values, hypertriglyceridemia, hyperglycemia and arterial hypertension, more frequently develops in postmenopausal women [4–6]. Elevated body weight and an unfavorable redistribution of fatty tissue characterized by an increased amount of visceral fat and reduction of so-called fat-free mass are also frequently observed in postmenopausal women, in whom the prevalence of abdominal obesity can reach 60%. This result is also observed in Poland [7]. Although this weight gain in the peri- or postmenopausal period may be explained by a slower rate of basal metabolism, incorrect or irregular eating habits including a high caloric diet and, above all, the lack of physical activity, other essential factors are also considered in the pathogenesis of overweight and obesity: estrogen and progesterone deficiency, as well as age-related reduction in the levels of several hormones, leptin, ghrelin, galanin, growth hormone and neuropeptide Y [8, 9].
Recent studies have indicated that myostatin may play a crucial role in the remodeling of body composition (mainly muscle and fat tissue). Myostatin (or growth and differentiation factor 8, GDF-8) coded by the MSTN gene is a myokine and a member of the transforming growth factor-β (TGF-β) superfamily. It is a potent bioactive factor, expressed mainly in muscles, with the ability to modulate differentiation and growth of skeletal muscles. Moreover, it can penetrate to the extracellular space as well as the circulating blood and thus exert endocrine and paracrine effects [10, 11]. In a number of species, mutations of MSTN leading to so-called “double muscling” phenotype have been described. Likewise, MSTN knockout mice and those in which the gene coding myostatin interferes with short-hairpin RNA (shRNA) demonstrate a substantial increase of muscle mass. Interestingly, MSTN mRNA was found in adipose tissue, and moreover, its impact on the differentiation of this tissue was also described. Therefore, in combination with its potent effect on skeletal muscle mass and hence on the total mass of metabolically active lean tissue it definitely affects the entire body metabolism [12, 13].
The aim of the study was to determine the relationship between the level of body fat and the concentration of myostatin protein in serum of peri- and postmenopausal women.
Taken together, the above information may help to understand the complex relation between myostatin and metabolic disturbances and the associated conditions including obesity, diabetes, cachexia and cardiovascular diseases in women during or after menopause.
Material and methods
The study included 300 Caucasian women (during or after menopause), screened and enrolled in 2015 at the Women`s Health Department, Institute of Rural Health in Lublin, Poland. All women participating in the study are workers in various institutions. We collected data regarding the participants’ menopausal status. The study was carried out at a single time point, so there was no need to follow up the patients. The inclusion criteria were age from 40 to 70 years, sedentary lifestyle and generally good condition. The exclusion criteria were smoking, addiction to alcohol and/or drugs, being on a diet, cancer and/or autoimmune diseases. The women were divided into three groups according to their reproductive status: women in the early perimenopause (n = 100): menstruating, FSH less than 20 mIU/ml; women in late perimenopause (n = 43): menstruating, FSH 20 mIU/ml or more; postmenopausal women (n = 157): not menstruating for at least 12 months. Detailed demographic and clinical data were collected at a single time point from all enrolled women, including: age, height, weight, body mass index (BMI) (underweight: < 18.49 kg/m2, normal: 18.5–24.99 kg/m2, overweight: 25–29.99 kg/m2, obese: ≥ 30 kg/m2), hormone replacement therapy (HRT) and body fat. Measurements of adipose tissue were performed using electronic skinfold calipers (Fat Gauge, Take it easy, Finesse). Body fat was evaluated at three points of the body: the thighs, biceps and abdominal fold. The percentage of body fat was compared with previously established standards [14]. According to the above standards body fat was categorized as: very low (I), low (II), optimal (III), elevated (IV) and high (V). After a detailed medical examination, peripheral blood was collected. The serum was stored at –80°C until the ELISA test was performed. In the meantime, the results of the routine biochemical tests were collected, including complete blood count, lipid panel, glucose and the following hormones: luteinizing hormone (LH), folliculotropic hormone (FSH), estradiol (E2), progesterone (PGN), testosterone (TTE), thyroid-stimulating hormone (TSH), triiodothyronine (FT3), thyroxine (FT4), cortisol, adrenocorticotropic hormone (ACTH). Serum levels of myostatin were estimated according to the protocol provided by the manufacturer (Human Myostatin (MSTN) ELISA Kit, SunRed Biotechnology Company). According to the assay validation information provided by the manufacturer, sample linear regression with the expected concentration of the correlation coefficient R is higher than 0.95 and the intra-assay variability coefficient is below 9%. Each assay was performed in 3 replications and then the mean of the results was calculated. Physical Fitness Index (PFI) was used in the assessment of physical capacity. PFI is calculated using the following formula: PFI = [(exercise time in seconds) × 100]/[2 × sum of the three measurements of heart rate (after exercise)].
All procedures performed in studies involving human participants were in accordance with the ethical standards of the institutional and/or national research committee and with the 1964 Helsinki Declaration and its later amendments or comparable ethical standards. The study design was approved by the Committee of Ethics and Research at the Medical University of Lublin (consent no. 07/2015). In order to participate in the study, written informed consent for use of clinical data and peripheral blood was obtained from each patient.
Statistical analysis
The statistical analysis of the results was performed using the following computer software: Statistica 10 (StatSoft, USA), MedCalc 10 (MedCalc Software, Belgium). The results with the values of p < 0.05 were considered statistically significant. Normality of data distribution was evaluated with the Kolmogorov-Smirnov test. Since all continuous variables selected for making comparisons (myostatin and other: demographic, anthropometric, laboratory factors) had non-normal distribution the non-parametric Mann-Whitney U-test was used. For the same reason the correlation between myostatin and other factors (as above) was determined using Spearman’s rank correlation test. Logistic regression analysis was used to evaluate the predictive value of selected factors (as above) in determining high body fat.
Results
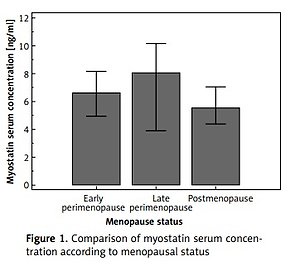
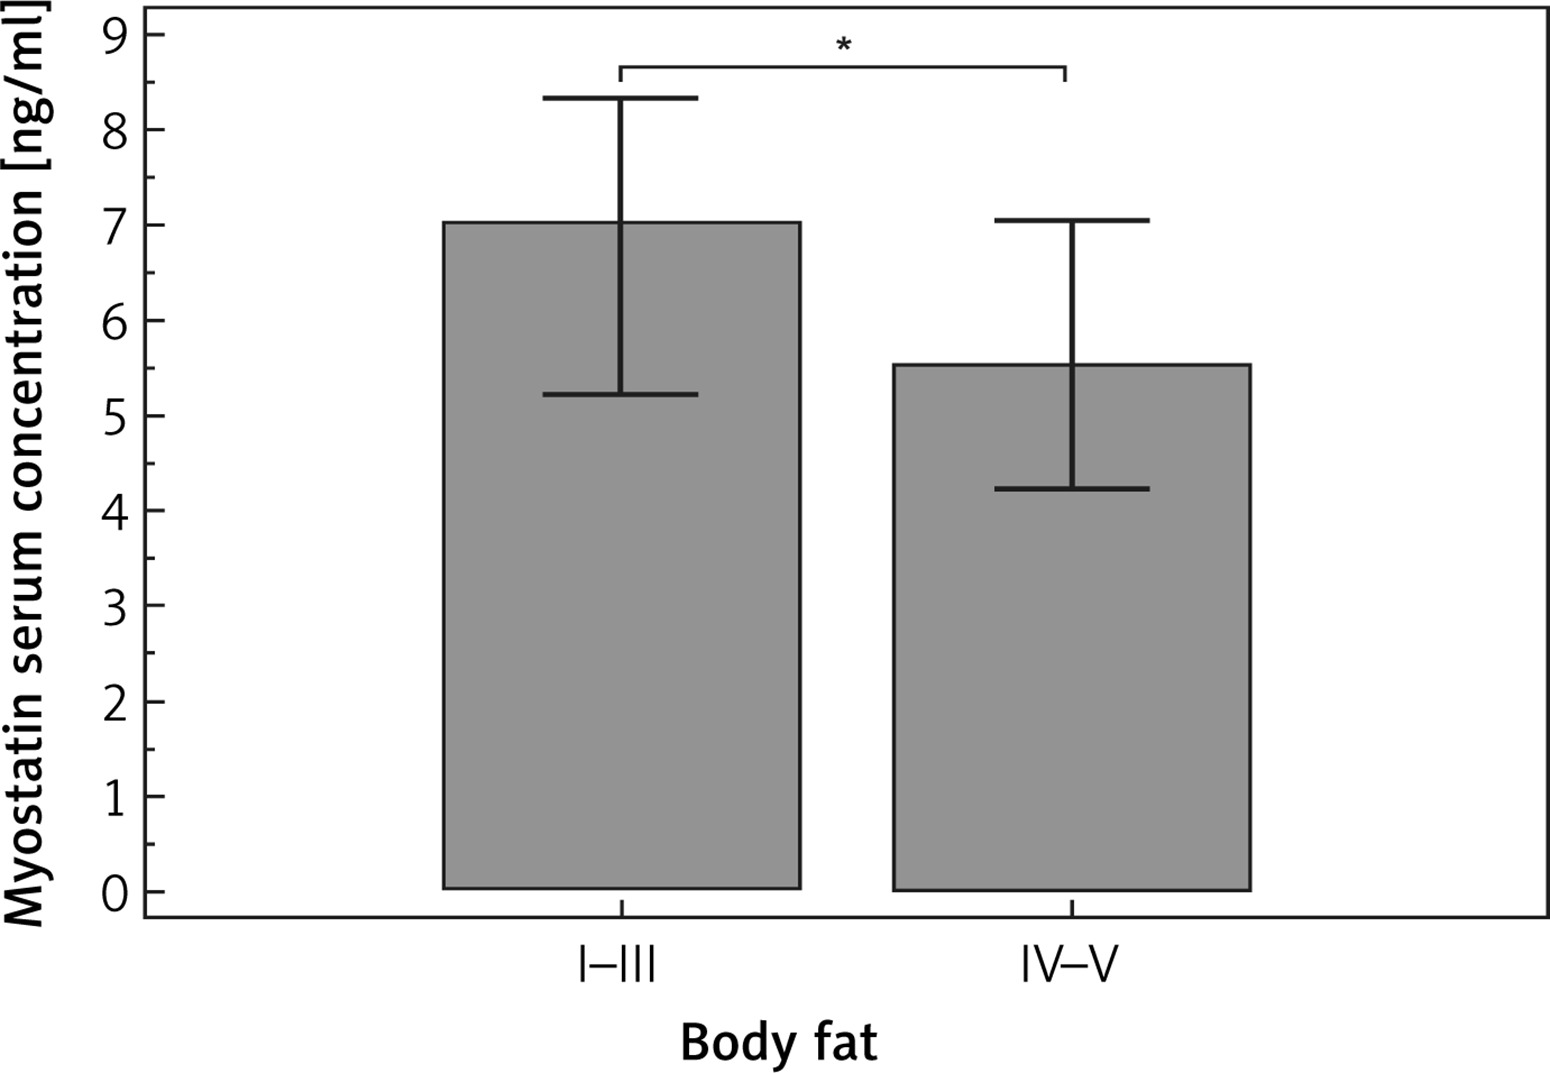
A total of 300 female subjects in the peri- or postmenopausal period were enrolled. The median age in the study group was 53 (range: 44–66) years. The mean values (and ranges) of weight and BMI were 70 (42–146) kg and 26.2 (16.8–46.6) kg/m2 respectively. In the study group, there were 0.3% underweight subjects, 43.7% women with normal weight, 39.3% overweight subjects and 16.7% women with obesity. The mean and median of the myostatin concentration in blood serum were 6.58 ±3.59 and 5.72 ng/ml respectively. Median myostatin concentration for early perimenopause (I), late perimenopause (II) and postmenopause (III) were 6.62, 8.04, 5.53, respectively (Figure 1). However, no statistically significant differences in its concentration were found among the above groups. The mean percentage of body fat was 32.7 ±6.3 (range: 16.1–50.7). The percentages of women in particular groups of body fat (I, II, III, IV and V) were 1.7%, 11%, 35.3%, 30.7% and 21.3% respectively. Basic characteristics of the study group are presented in Table I. Subgroup analysis showed significant differences in body fat level between late perimenopausal and postmenopausal women. Moreover, we noted an obvious age difference between all subgroups. However, there were no other statistically significant differences between early and late perimenopausal women; therefore these groups were considered together in further analysis. Among the studied factors only the level of HDL was significantly associated with myostatin level in blood serum. Myostatin concentration was higher in women with normal HDL (median myostatin concentrations: 6.22 vs. 3.69 ng/ml, p = 0.0304). In subgroup analysis a trend (p = 0.0594) towards such a correlation was noted only in the perimenopause group. The association between demographic, clinical and biochemical factors and myostatin concentration is presented in Table II. According to the medical data, 49 (16.3%) women received HRT. However, the use of HRT was not significantly associated with body fat (32.4 vs. 32.4%, p = 0.9333). Similarly, the use of HRT did not significantly influence myostatin concentration in blood serum (5.86 vs. 5.63 ng/ml, p = 0.7147). However, in subgroup analysis, the use of HRT was associated with the occurrence of higher concentrations of myostatin (but that was only a trend toward significance, p = 0.0563). In the case of other studied factors, correlations between body fat and well-known factors were demonstrated, as follows: weight (p = 0.003), BMI (p < 0.0001), waist-hip ratio (WHR) (p < 0.0001), waist circumference (p < 0.0001), hip circumference (p < 0.0001), neck circumference (p = 0.0001). Among the lipid panel parameters, only triglyceride (TG) was significantly associated with body fat level (we observed higher levels of myostatin in subjects with a normal level of TG; median concentrations: 94.5 vs. 85.5 mg/dl, p = 0.0113). On the other hand, in the case of the endocrine system, PGN was the only factor that was significantly related to myostatin serum concentration (we noted higher serum concentration of PGN in those with a higher level of body fat: 0.36 vs. 0.28 ng/ml, p = 0.0141). Subgroup analysis revealed that in postmenopausal women beside the known factors (anthropometric parameters), lower HDL, elevated TG, elevated glucose, lower LH, FSH and PGN were significantly associated with higher levels of body fat. Besides anthropometric parameters none of the correlations specified above was observed in the perimenopause subgroup (the only exception was the FT3 hormone). Moreover, we noted that myostatin level in blood serum was significantly lower (median concentrations: 5.5 vs. 7.0 ng/ml, p = 0.0269; Figure 2) in subjects with higher body fat levels (groups IV and V) than in those classified as having normal or low body fat level (groups I–III). However, such a relationship was not observed in subgroup analysis of peri- or postmenopausal women (the only trend to significant results was found in the latter). None of the other studied factors were significantly associated with the level of body fat (Table III).
Table I
Basic characteristics and subgroup analysis of selected factors in peri- and postmenopausal women
| Variable | K-S testpa | All | EP | LP | P | pb | |||
|---|---|---|---|---|---|---|---|---|---|
| EP and LP vs. P | EP vs. LP | EP vs. P | LP vs. P | ||||||
| Age [years] | < 0.0001 | 53; 53.1 ±4.8(44–66) | 48.00; 48.58 ±2.7 (44.00–56.00) | 60.00; 51.60 ±3.27 (46.00–52.00) | 56.00; 56.39 ±3.36 (46.00–66.00) | < 0.0001 | < 0.0001 | < 0.0001 | < 0.0001 |
| Height [cm] | 0.0020 | 164; 163.4±5.6 (138–180) | 164.00; 163.99 ±5.83 (151.00–180.00) | 164.00; 163.91 ±4.95 (156.00–174.00) | 164.00; 162.87 ±5.62 (138.00–176.00) | 0.2330 | 0.8984 | 0.2599 | 0.4745 |
| Weight [kg] | 0.0149 | 70; 70 ±12.4(42–146) | 70.00; 71.01 ±14.75 (43.00–146.00) | 67.00; 68.46 ±12.14 (47.00–102.00) | 70.00; 69.81 ±10.80 (42.00–98.00) | 0.6239 | 0.3530 | 0.9712 | 0.3021 |
| BMI [kg/m2] | < 0.0001 | 25.8; 26.2 ±4.6 (16.8–46.6) | 25.60; 26.39 ±5.14 (16.79–46.60) | 24.44; 25.47 ±4.26 (18.77–36.13) | 25.96; 26.36 ±4.36 (19.05–44.63) | 0.3333 | 0.3405 | 0.6140 | 0.1979 |
| Body fat (%) | 0.0486 | 32.4; 32.7 ±6.3 (16.1–50.7) | 32.52; 32.57 ±6.52 (16.10–48.68) | 30.47; 30.82 ±5.67 (19.92–43.97) | 33.09; 33.30 ±6.35 (18.93–50.74) | 0.0720 | 0.1391 | 0.3408 | 0.0179 |
| Myostatin [ng/ml] | < 0.0001 | 5.72; 6.58 ±3.59 (0.78–15.08) | 6.62; 6.07 ±3.85 (0.77–15.07) | 8.04; 7.33 ±4.26 (1.31–14.30) | 5.53; 6.33 ±3.41 (1.49–14.12) | 0.2311 | 0.4853 | 0.4162 | 0.2095 |
Table II
Relationships between demographic, clinical and biochemical factors and myostatin concentration
| Variable | Myostatin concentration | |||||
|---|---|---|---|---|---|---|
| All | pb | EP + LP | pb | P | pb | |
| Age [years]: | 0.8749 | 0.5730 | 0.5292 | |||
| ≤ 50 | 5.63 | 6.12 | 4.58 | |||
| > 50 | 5.93 | 7.77 | 5.62 | |||
| Height [cm]: | 0.8900 | 0.5883 | 0.3079 | |||
| ≤ 164 | 5.97 | 5.63 | 6.00 | |||
| > 164 | 5.59 | 7.66 | 4.39 | |||
| Wight [kg]: | 0.7041 | 0.8983 | 0.4850 | |||
| ≤ 70 | 5.63 | 5.61 | 5.72 | |||
| > 70 | 6.22 | 7.62 | 4.91 | |||
| BMI [kg/m2]: | 0.9726 | 0.6042 | 0.5914 | |||
| ≤ 24.99 | 5.63 | 5.60 | 5.72 | |||
| > 24.99 | 6.32 | 7.66 | 4.98 | |||
| WHR: | 0.3298 | 0.3464 | 0.7564 | |||
| ≤ 0.85 | 5.72 | 7.15 | 5.41 | |||
| > 0.85 | 5.94 | 6.05 | 5.94 | |||
| Waist circumference [cm]: | 0.4211 | 0.7419 | 0.3919 | |||
| ≤ 0.88 | 5.58 | 5.63 | 5.05 | |||
| > 0.88 | 7.03 | 7.66 | 6.50 | |||
| Hip circumference [cm]: | 0.5769 | 0.4813 | 0.9190 | |||
| ≤ 104 | 5.63 | 5.60 | 5.65 | |||
| > 104 | 6.62 | 7.77 | 4.99 | |||
| Neck circumference [cm]: | 0.5701 | 0.4308 | 0.9054 | |||
| ≤ 36 | 5.63 | 5.60 | 5.69 | |||
| > 36 | 6.23 | 7.66 | 4.84 | |||
| Total cholesterol [mg/dl]: | 0.9213 | 0.8812 | 0.9131 | |||
| ≤ 190 | 6.03 | 7.82 | 4.97 | |||
| > 190 | 5.69 | 7.02 | 5.62 | |||
| HDL [mg/dl]: | 0.0304 | 0.0594 | 0.1872 | |||
| ≤ 45 | 3.69 | 3.68 | 3.55 | |||
| > 45 | 6.22 | 7.23 | 5.67 | |||
| LDL [mg/dl]: | 0.8765 | 0.6989 | 0.9504 | |||
| ≤ 115 | 5.32 | 5.42 | 5.05 | |||
| > 115 | 6.22 | 7.46 | 5.58 | |||
| TG [mg/dl]: | 0.0687 | 0.0256 | 0.7749 | |||
| ≤ 150 | 6.11 | 7.73 | 5.53 | |||
| > 150 | 4.27 | 3.88 | 5.73 | |||
| Glucose [mg/dl]: | 0.2175 | 0.4543 | 0.3808 | |||
| ≤ 99 | 6.50 | 7.62 | 5.72 | |||
| > 99 | 4.38 | 4.72 | 4.37 | |||
| LH [mIU/ml]: | 0.2044 | 0.0621 | 0.5939 | |||
| ≤ 54 | 5.66 | 6.62 | 5.53 | |||
| > 54 | 8.40 | 11.21 | 6.38 | |||
| FSH [mIU/ml]: | 0.2306 | 0.7516 | – | |||
| ≤ 116.3 | 7.15 | 7.15 | 5.53 | |||
| > 116.3 | 5.51 | 4.87 | – | |||
| E2 [pg/ml]: | 0.3832 | 0.6963 | 0.6825 | |||
| ≤ 32.2 | 5.67 | 7.62 | 5.59 | |||
| > 32.2 | 6.23 | 7.03 | 5.32 | |||
| PGN [ng/ml]: | 0.0261 | 0.1594 | 0.2143 | |||
| ≤ 0.73 | 5.53 | 5.60 | 5.28 | |||
| > 0.73 | 7.84 | 7.92 | 7.58 | |||
| TTE [ng/dl]: | 0.5659 | – | 0.3902 | |||
| ≤ 76 | 5.83 | 7.09 | 5.51 | |||
| > 76 | 7.66 | 4.98 | 10.33 | |||
| TSH [µIU/ml]: | 0.0948 | 0.2697 | 0.1691 | |||
| ≤ 4.78 | 6.06 | 7.15 | 5.62 | |||
| > 4.78 | 3.53 | 3.83 | 3.06 | |||
| FT3 [pg/ml]: | 0.7230 | – | 0.7053 | |||
| ≤ 4.2 | 5.83 | 6.23 | 5.53 | |||
| > 4.2 | 8.32 | 7.09 | 8.32 | |||
| FT4 [ng/dl]: | – | 0.2530 | – | |||
| ≤ 1.76 | 5.94 | 9.95 | 5.58 | |||
| > 1.76 | 2.79 | 6.62 | 2.79 | |||
| Cortisol [µg/dl]: | 0.2908 | 0.1336 | 0.9426 | |||
| ≤ 22.4 | 6.00 | 7.46 | 5.53 | |||
| > 22.4 | 4.65 | 4.45 | 4.84 | |||
| ACTH [ng/l]: | 0.2074 | 0.1253 | 0.6559 | |||
| ≤ 63.6 | 4.84 | 4.77 | 4.95 | |||
| > 63.6 | 6.50 | 8.01 | 5.62 | |||
| PFI: | 0.7005 | 0.4728 | 0.8469 | |||
| ≤ 55 | 6.22 | 7.38 | 5.67 | |||
| > 55 | 5.22 | 5.22 | 5.19 | |||
| HRT: | 0.7476 | 0.1027 | 0.0563 | |||
| No | 5.78 | 7.30 | 4.84 | |||
| Yes | 5.86 | 3.70 | 6.31 | |||
[i] Myostatin concentration was expressed as median (ng/ml), pb – Mann-Whitney U-test (non-parametric), EP – early perimenopause, LP – late perimenopause, P – postmenopause, BMI – body mass index, WHR – waist-hip ratio, HDL – high-density lipoprotein, LDL – low-density lipoprotein, TG – triglyceride, LH – luteinizing hormone, FSH – follicle-stimulating hormone, E2 – estradiol, PGN – progesterone, TTE – testosterone. TSH – thyroid-stimulating hormone, FT3 – triiodothyronine, FT4 – thyroxine, ACTH – adrenocorticotropic hormone, PFI – physical fitness index, HRT, hormone replacement therapy.
Table III
Relationship between demographic, clinical and biochemical factors and body fat level
| Variable | Body fat | ||||||||
|---|---|---|---|---|---|---|---|---|---|
| All | EP + LP | P | |||||||
| Low (n = 144) | High (n = 156) | pb | Low (n = 68) | High (n = 75) | pb | Low (n = 69) | High (n = 88) | pb | |
| Age [years] | 53 (44–66) | 54 (44–64) | 0.1472 | 49 | 49 | 0.3032 | 56.00 | 57.00 | 0.2855 |
| Height [cm] | 164 (146–180) | 163 (138–176) | 0.0001 | 165 | 163 | 0.0023 | 164.00 | 163.50 | 0.0233 |
| Weight [kg] | 67 (42–146) | 71 (45–98) | 0.0003 | 69 | 70 | 0.2408 | 67.00 | 72.50 | 0.0030 |
| BMI [kg/m2] | 24.3 (16.8–46.6) | 26.8 (18.8–44.6) | < 0.0001 | 24.3 | 26.6 | 0.0282 | 24.34 | 27.08 | 0.0001 |
| WHR | 0.78 (0.69–0.94) | 0.85 (0.70–0.98) | < 0.0001 | 0.78 | 0.85 | < 0.0001 | 0.78 | 0.84 | < 0.0001 |
| Waist circumference [cm] | 80 (64–108) | 90 (68–120) | < 0.0001 | 80 | 90 | < 0.0001 | 80.00 | 91.00 | < 0.0001 |
| Hip circumference [cm] | 102 (84–136) | 107 (88–136) | < 0.0001 | 102 | 107 | 0.0136 | 102.00 | 108.00 | < 0.0001 |
| Neck circumference [cm] | 35 (28–44) | 36 (30–44) | 0.0001 | 34 | 36 | 0.0093 | 35.00 | 36.00 | 0.0031 |
| PFI | 50.6 (30.4–73.2) | 51.1 (30.1–73.6) | 0.3216 | 50.0 | 50.0 | 0.9088 | 50.8 | 51.9 | 0.2799 |
| Total cholesterol [mg/dl] | 211.5 (119–335) | 213 (129–330) | 0.7047 | 86 | 89 | 0.2330 | 223.00 | 217.00 | 0.3396 |
| HDL [mg/dl] | 67 (34–112) | 63 (38–114) | 0.0679 | 66 | 63 | 0.7054 | 67.00 | 62.50 | 0.0296 |
| LDL [mg/dl] | 122.7 (53.4–248.8) | 128.3 (55.4–224.8) | 0.7588 | 115.6 | 120 | 0.5009 | 136.40 | 135.20 | 0.4069 |
| TG [mg/dl] | 85.5 (23–256) | 94.5 (38–388) | 0.0113 | 86 | 89 | 0.2330 | 83.00 | 97.50 | 0.0215 |
| Glucose [mg/dl] | 89 (64–210) | 90 (69–202) | 0.1200 | 90 | 90 | 0.6145 | 87.00 | 91.00 | 0.0064 |
| LH [mIU/ml] | 28.9 (1.2–96.6) | 25.8 (0.6–107.6) | 0.3490 | 8.5 | 5.5 | 0.0521 | 36.10 | 32.25 | 0.0482 |
| FSH [mIU/ml] | 52.6 (1.5–133.7) | 54.9 (2.2–155.8) | 0.5578 | 10.7 | 9.4 | 0.1192 | 83.04 | 74.47 | 0.0258 |
| E2 [pg/ml] | 20 (10–480) | 23 (12–482) | 0.3368 | 64 | 85.5 | 0.6062 | 15.00 | 13.50 | 0.6106 |
| PGN [ng/ml] | 0.28 (0.15–20.8) | 0.36 (0.15–23.3) | 0.0141 | 0.66 | 0.49 | 0.6375 | 0.26 | 0.17 | 0.0090 |
| TTE [ng/dl] | 31.9 (10–81.9) | 33 (7.4–91.2) | 0.8562 | 31.4 | 34.4 | 0.8446 | 33.08 | 29.10 | 0.9676 |
| TSH [µIU/ml] | 1.44 (0.16–6.35) | 1.32 (0.11–7.19) | 0.1899 | 1.34 | 1.54 | 0.2611 | 1.26 | 1.35 | 0.4079 |
| FT3 [pg/ml] | 3.2 (2.4–3.9) | 3.2 (2.1–5) | 0.2105 | 3.2 | 3.2 | 0.0304 | 3.20 | 3.20 | 0.5631 |
| FT4 [ng/dl] | 1.09 (0.75–1.53) | 1.12 (0.72–1.57) | 0.6718 | 1.1 | 1.1 | 0.7958 | 1.09 | 1.11 | 0.7130 |
| Cortisol [µg/dl] | 11.3 (4.1–29.6) | 11.8 (4.8–34.9) | 0.0943 | 11.7 | 10.8 | 0.2362 | 12.80 | 11.65 | 0.1566 |
| ACTH [ng/l] | 12.1 (1.01–50.8) | 11.3 (1–33.0) | 0.2042 | 12.4 | 11.1 | 0.3142 | 11.93 | 11.35 | 0.4129 |
| Myostatin [ng/ml] | 7.0 (1.1–14.3) | 5.5 (0.8–15.1) | 0.0269 | 7.7 | 5.6 | 0.1837 | 6.2 | 5.0 | 0.0790 |
[i] Body fat was expressed as median and range (%), Low body fat: groups I–III, high body fat: groups IV-V, pb – Mann-Whitney U-test (non-parametric), EP – early perimenopause, LP – late perimenopause, P – postmenopause, BMI – body mass index, WHR – waist-hip ratio, HDL – high-density lipoprotein, LDL – low-density lipoprotein, TG – triglyceride, LH – luteinizing hormone, FSH – follicle-stimulating hormone, E2 – estradiol, PGN – progesterone, TTE – testosterone, TSH – thyroid-stimulating hormone, FT3 – triiodothyronine, FT4 – thyroxine, ACTH – adrenocorticotropic hormone, PFI – physical fitness index.
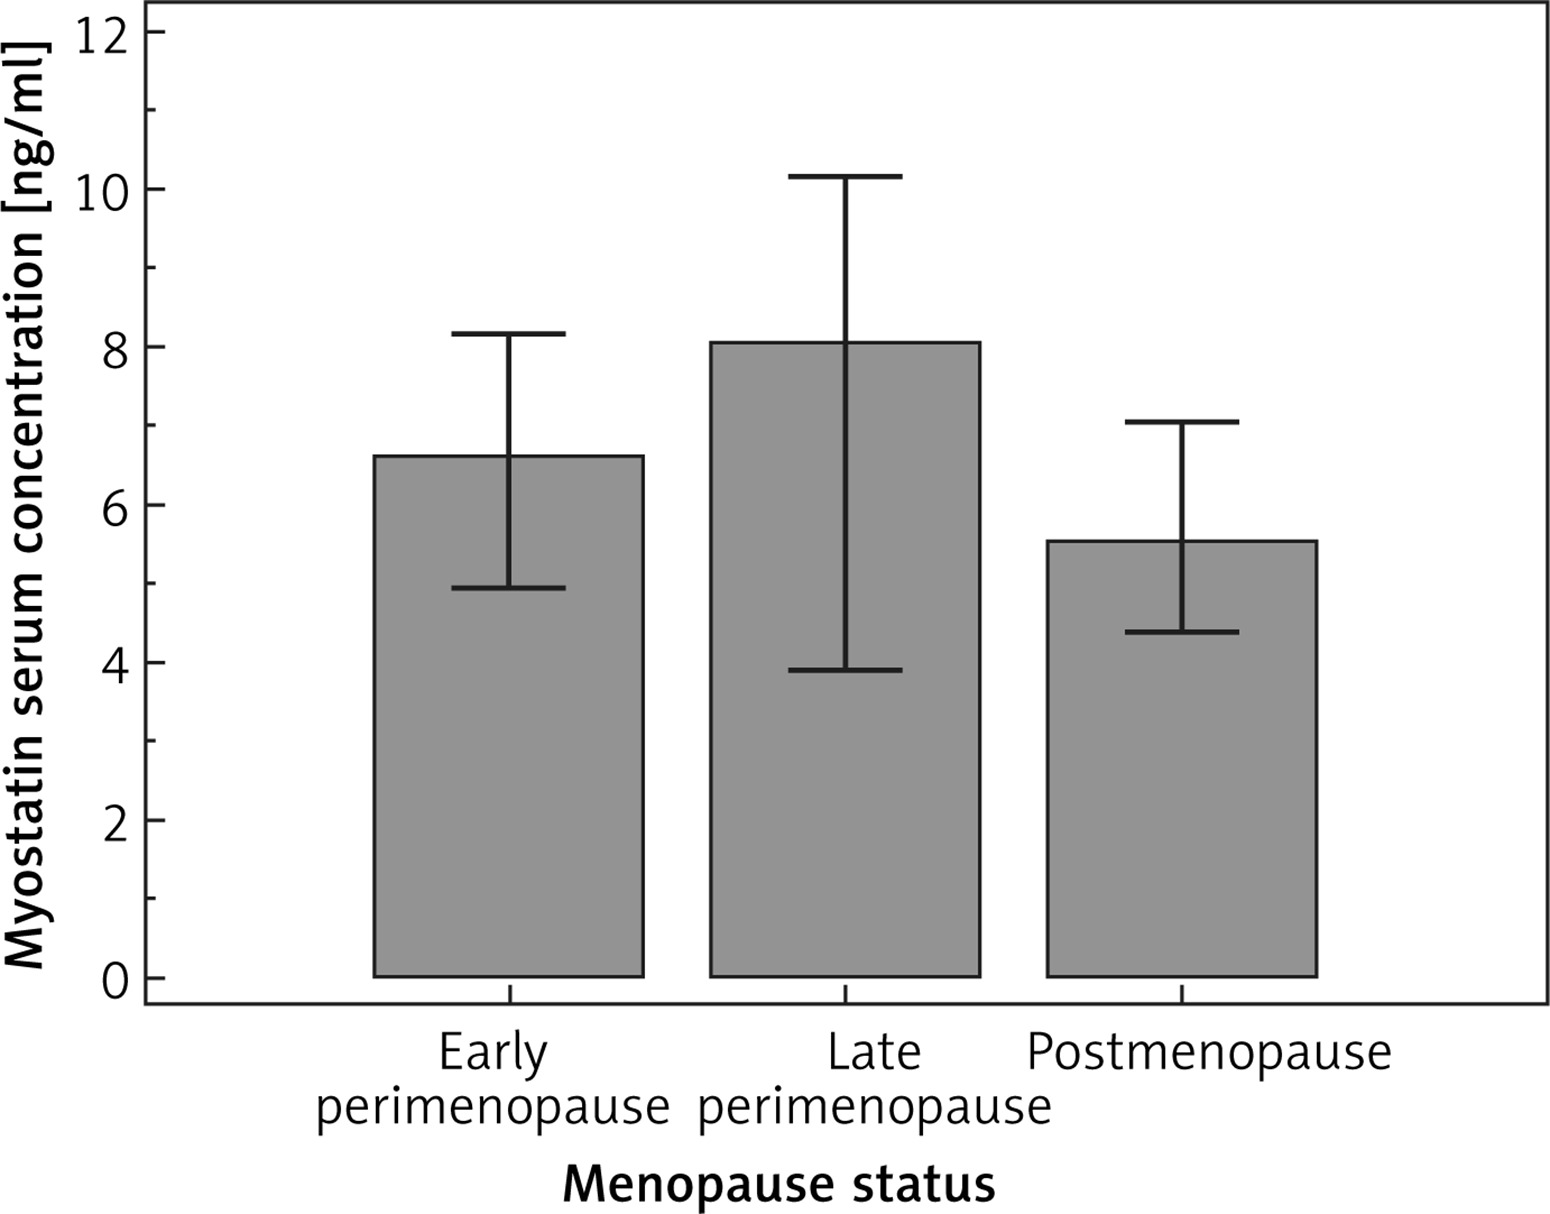
Figure 2
Comparison of myostatin serum concentration according to body fat classification
*p = 0.0269.
Among the studied factors only selected hormones (PGN, ACTH, TSH) and HDL were significantly correlated with myostatin level in blood serum. Myostatin concentration showed a weak positive correlation with PGN in the study group (rho = 0.155, p = 0.0108). In subgroup analysis such a correlation was noted only in the postmenopausal group (rho = 0.194, p = 0.020). Moreover, in this group, myostatin was negatively correlated with TSH (rho = –0.179, p = 0.0323), whereas it was positively correlated with HDL (rho = 0.181, p = 0.0305). In the perimenopause group only ACTH was correlated with myostatin serum concentration (positive correlation, rho = 0.199, p = 0.0252). The correlations between selected factors and myostatin serum concentration are presented in Table IV. Regression analysis revealed that in the study group only WHR (p < 0.0001), PFI (p = 0.0454) and myostatin serum concentration (p = 0.0463) were independent predictive factors of the occurrence of high body fat. In the perimenopausal group significant independent factors which predict high body fat were WHR (p < 0.0001) and FT4 (p = 0.0343). On the other hand, in the post-menopausal group, only WHR (p < 0.0001) was an independent predictive factor of high body fat. Regression analysis results are presented in Table V.
Table IV
Spearman’s correlation between myostatin and other selected variables
| Variable | All | EP + LP | P | |||
|---|---|---|---|---|---|---|
| rho | pc | rho | pc | rho | pc | |
| Age [years] | –0.011 | 0.8517 | 0.046 | 0.6058 | 0.060 | 0.4791 |
| Height [cm] | –0.004 | 0.9426 | 0.076 | 0.3966 | –0.106 | 0.2084 |
| Weight [kg] | 0.024 | 0.6941 | 0.082 | 0.3613 | –0.040 | 0.6376 |
| BMI [kg/m2] | 0.029 | 0.6336 | 0.065 | 0.4661 | –0.007 | 0.9337 |
| WHR | –0.088 | 0.1472 | –0.077 | 0.3912 | –0.085 | 0.3113 |
| Waist circumference | –0.022 | 0.7247 | 0.015 | 0.8696 | –0.042 | 0.6184 |
| Hip circumference [cm] | 0.078 | 0.2030 | 0.152 | 0.0883 | 0.005 | 0.9491 |
| Neck circumference [cm] | –0.001 | 0.9895 | 0.089 | 0.3191 | –0.080 | 0.3444 |
| BF [%] | –0.078 | 0.2003 | –0.063 | 0.4843 | –0.099 | 0.2398 |
| Total cholesterol [mg/dl] | 0.019 | 0.7502 | 0.024 | 0.7858 | 0.016 | 0.8455 |
| HDL [mg/dl] | 0.078 | 0.1991 | –0.025 | 0.7838 | 0.181 | 0.0305 |
| LDL [mg/dl] | 0.008 | 0.8936 | 0.059 | 0.5135 | –0.017 | 0.8418 |
| TG [mg/dl] | –0.096 | 0.1159 | –0.118 | 0.1882 | –0.084 | 0.3169 |
| Glucose [mg/dl] | 0.008 | 0.8947 | 0.063 | 0.4831 | –0.042 | 0.6148 |
| FSH [mIU/ml] | –0.037 | 0.5458 | –0.034 | 0.7070 | 0.087 | 0.3005 |
| LH [mIU/ml] | 0.007 | 0.9108 | 0.002 | 0.9828 | 0.090 | 0.2832 |
| E2 [pg/ml] | 0.056 | 0.3621 | –0.003 | 0.9735 | –0.023 | 0.7815 |
| PGN [ng/ml] | 0.155 | 0.0108 | 0.076 | 0.3984 | 0.194 | 0.0202 |
| TTE [ng/dl] | 0.062 | 0.3123 | 0.020 | 0.8204 | 0.081 | 0.3372 |
| TSH [µIU/ml] | –0.064 | 0.2979 | 0.045 | 0.6187 | –0.179 | 0.0323 |
| FT3 [pg/ml] | 0.072 | 0.2393 | 0.023 | 0.7981 | 0.116 | 0.1659 |
| FT4 [ng/dl] | 0.052 | 0.3971 | 0.041 | 0.6433 | 0.056 | 0.5076 |
| Cortisol [µg/dl] | 0.028 | 0.6461 | 0.029 | 0.7421 | 0.052 | 0.5394 |
| ACTH [ng/l] | 0.060 | 0.3280 | 0.199 | 0.0252 | –0.064 | 0.4496 |
| PFI | –0.068 | 0.2659 | –0.079 | 0.3796 | –0.038 | 0.6505 |
[i] rho – Spearman’s rank correlation coefficient, pc – Spearman’s rank correlation test (non-parametric), EP – early perimenopause, LP – late perimenopause, P – postmenopause, BMI – body mass index, WHR – waist-hip ratio, HDL – high-density lipoprotein, LDL – low-density lipoprotein, TG – triglyceride, LH – luteinizing hormone, FSH – follicle-stimulating hormone, E2 – estradiol, PGN – progesterone, TTE – testosterone, TSH – thyroid-stimulating hormone, FT3 – triiodothyronine, FT4 – thyroxine, ACTH – adrenocorticotropic hormone, PFI – physical fitness index.
Table V
Multivariate analysis of the role of selected factors in prediction of high body fat (IV-V) occurrence
| Independent variables | All | EP + LP | P | |||
|---|---|---|---|---|---|---|
| Coefficient | Pd# | Coefficient | Pd# | Coefficient | Pd# | |
| Age [years] | 0.041 | 0.3846 | –0.098 | 0.3086 | 0.026 | 0.7641 |
| BMI [kg/m2] | –0.047 | 0.4034 | –0.227 | 0.0377 | 0.097 | 0.2577 |
| WHR | 34.400 | < 0.0001 | 42.349 | < 0.0001 | 40.046 | < 0.0001 |
| Neck circumference [cm] | 0.053 | 0.5676 | 0.213 | 0.1940 | 0.062 | 0.6729 |
| Total cholesterol [mg/dl] | –0.014 | 0.6252 | –0.042 | 0.3639 | –0.007 | 0.9139 |
| HDL [mg/dl] | –0.777 | 0.3394 | –2.215 | 0.1109 | –0.146 | 0.9322 |
| LDL [mg/dl] | 0.025 | 0.5391 | 0.086 | 0.1923 | –0.004 | 0.9632 |
| TG [mg/dl] | 0.007 | 0.5018 | 0.020 | 0.2408 | 0.001 | 0.9433 |
| Glucose [mg/dl] | –0.007 | 0.6557 | –0.017 | 0.4405 | 0.002 | 0.916 |
| FSH [mIU/ml] | –0.008 | 0.3722 | –0.034 | 0.0778 | 0.005 | 0.7193 |
| LH [mIU/ml] | 0.0001 | 0.9935 | 0.030 | 0.2674 | –0.021 | 0.4699 |
| E2 [pg/ml] | –0.001 | 0.775 | –0.001 | 0.7378 | –0.062 | 0.0591 |
| PGN [ng/ml] | –0.072 | 0.1811 | –0.106 | 0.1122 | –3.174 | 0.1228 |
| TTE [ng/dl] | 0.006 | 0.5312 | –0.001 | 0.9569 | 0.029 | 0.0697 |
| TSH [µIU/ml] | 0.059 | 0.7326 | –0.180 | 0.5652 | –0.045 | 0.8536 |
| FT3 [pg/ml] | –0.129 | 0.836 | 1.264 | 0.2233 | –2.027 | 0.0884 |
| FT4 [ng/dl] | –1.573 | 0.227 | –5.106 | 0.0343 | 0.143 | 0.9397 |
| Cortisol [µg/dl] | –0.050 | 0.194 | –0.134 | 0.0963 | –0.041 | 0.5338 |
| ACTH [ng/l] | –0.025 | 0.3033 | –0.010 | 0.8089 | –0.018 | 0.6213 |
| PFI | 0.045 | 0.0454 | 0.049 | 0.1345 | 0.056 | 0.1269 |
| Myostatin [ng/ml] | –0.057 | 0.0463 | –0.044 | 0.5697 | –0.040 | 0.0624 |
[i] pd – logistic regression analysis, #overall model fit: p < 0.0001, EP – early perimenopause, LP – late perimenopause, P – postmenopause, BMI – body mass index, WHR – waist-hip ratio, HDL – high-density lipoprotein, LDL – low-density lipoprotein, TG – triglyceride, LH – luteinizing hormone, FSH – follicle-stimulating hormone, E2 – estradiol, PGN – progesterone, TTE – testosterone, TSH – thyroid-stimulating hormone, FT3 – triiodothyronine, FT4 – thyroxine, ACTH – adrenocorticotropic hormone, PFI – physical fitness index.
Discussion
The elevated body weight and an unfavorable redistribution of adipose tissue frequently observed in postmenopausal women may have many causes. However, there is growing evidence that myostatin may play a key role in the process of remodeling of body composition (which also concerns fat tissue). In our study we noted that not only known clinical or biochemical factors (e.g. WHR, TG or PGN) but also serum myostatin level may be associated with body fat level. On the other hand, myostatin concentration seems to be associated with HDL level. Moreover, we did not detect any associations between HRT use and either the level of body fat or myostatin concentration in blood serum.
It has been reported that during or after the menopause period dyslipidemias occur more frequently, and this seems to be an important risk factor leading to cardiovascular diseases. Moreover, after menopause elevated levels of apolipoprotein A, low-density lipoprotein (LDL) fraction of cholesterol and total cholesterol as well as a decrease of the HDL fraction of cholesterol are often observed. Both decreased HDL and increased LDL are independent risk factors for ischemic heart disease. Despite the fact that menopause does not directly influence the fasting glucose level, it leads to a progressive decrease in glucose-stimulated insulin secretion. Moreover, in most tissues insulin resistance becomes more pronounced, which subsequently may result in higher risk of diabetes type 2 development. Han et al. noted that patients with type 2 diabetes mellitus had a lower serum myostatin level compared to healthy volunteers (matched by age and gender). In their study, the lower level of myostatin was independently related to metabolic syndrome, central obesity, increased TG and, similarly to our results, decreased HDL. They suggested that a higher myostatin level is related to favorable metabolic profiles, and therefore it may be a useful biomarker for metabolic disorders. On the other hand, in the study by Ma et al. (in southern Chinese women) serum myostatin was positively correlated only with TG (no significant association was found with HDL) [13, 15–20].
Currently there are limited data on the influence of myostatin on body fat in women during or after menopause. Most studies were performed on mice or cell line models and focused more on the body composition characterized by muscle tissue status. However, some of them have also raised the problem of the effect of myostatin on adipose tissue remodeling. In animal models using myostatin-deficient mice, a phenotype of increased myogenesis accompanied by reduced fat mass was observed [21–24]. Furthermore, the inhibition of adipogenesis in human mesenchymal stem cells or 3T3-L1 preadipocytes exposed to recombinant myostatin protein was reported [25, 26]. On the other hand, cachexia-like phenotype (including both muscle and fat reduction) was demonstrated in nude mice with an increased level of recombinant myostatin [27]. Contrary to the above studies, Guo et al. found that the deletion of adipose-specific myostatin had no influence on fat level or metabolic balance [28]. However, when compared to liver or skeletal muscle, adipose tissue showed low myostatin expression, so deletion of adipose-specific myostatin may not significantly affect the total level of myostatin in circulation and, consequently, the change of adipose or muscle metabolism. One of the potential mechanisms of myostatin-induced metabolism change is the alteration of insulin sensitivity. In myostatin knockout mice increased AMP-activated kinase activity in skeletal muscle as well as increased Glut4 levels, Akt and phosphorylated Akt were observed [29]. When human myoblasts were stimulated for 24 h with myostatin, a significant (about 50%) decrease of Akt phosphorylation was observed [30]. Also in vivo, after insulin stimulation, p-Akt increased in the mechanism of elevated insulin sensitivity, thus suggesting that myostatin action may be altered during hyperinsulinemia [31]. Other authors have suggested that the absence of myostatin causes enhanced peripheral tissue fatty acid oxidation and elevated thermogenesis, which ultimately leads to increased fat utilization and reduced adipose tissue mass [32].
There are a few limitations of our study that should be discussed. First of all, we did not collect detailed data on the type of diet used by the surveyed women. In addition, we did not monitor the subjects’ physical exercise or any other physical activity before the study. The above information could certainly have a significant impact on the level of body fat as well as myostatin concentration in blood serum. All measurements were performed only at a single time point, which makes it difficult to precisely evaluate the relationship between circulating MSTN levels, adiposity and lean mass, in the context of hormonal alterations (and also the use of HRT) at the time of the menopausal transition. We used skinfold measurements for body fat assessment, which in many cases may fail to provide insight into visceral versus subcutaneous body fat. We did not collect data on lean mass, which could be very informative in the context of the main function of myostatin. However, the study group was relatively large and homogeneous (all tested women were of peri- or postmenopausal age and white-collar workers doing office work, and almost all investigated women stated in the questionnaires that they had followed a varied diet and performed only minimal physical activity). Further studies are necessary to evaluate the influence of particular diets and physical exercise on myostatin concentration and signaling in menopausal women.
To sum up, the existing knowledge allows us to suggest that myostatin exerts its effect on both skeletal muscle mass (as a negative regulator of development and regeneration preventing hyperplasia or hypertrophy of this tissue) and body fat mass (directly by anti-adipogenic influence or indirectly by decreasing its inhibitory effect, resulting in increase of muscle mass). The above processes may undergo substantial changes within the peri- or post-menopause period.
In conclusion, elevated body fat in peri- and postmenopausal women is related to a decreased level of serum myostatin.