Introduction
MicroRNAs belong to the category of small, 17-25-nucleotide, single-stranded, non-coding RNAs, whose main function is post-transcriptional regulation of gene expression. These molecules are regarded as the “key” ones in the gene regulatory network [1]. The influence of microRNAs on the profile of gene expression cannot be ignored in the tumor transformation process. Various levels of microRNA expression have been observed in many cancers, including bladder cancer [1–4]. Molecular analyses indicated the existence of two main pathways visible in bladder cancer pathogenesis, where microRNA has a crucial role. These are the signaling pathways of genes FGFR3/RAS and TP53 [2, 5].
Receptor 3 of the fibroblast growth factor, FGFR3, belongs to the group of receptor tyrosine kinases. It plays a significant role in cell diversification and division as well as in angiogenesis. FGFR3 gene mutations are rarely found in cancers and their occurrence has only been detected in bladder and cervical cancers [6]. In bladder cancer (BC), FGFR3 gene mutations are found in about 80% of patients in non-invasive stages. These mutations are much rarer in invasive cancers, constituting approximately 16% of cases. The study has shown that FGFR3 oncogenic function is associated with the stimulation of signaling pathways such as RAS/MAPK, the activation of which depends on adaptor proteins GRB2 and SOS. SOS is the factor changing the guanine nucleotide GDP into GTP, thereby activating protein RAS. MicroRNA 99a-5p (miR-99a-5p) has its anchor point at the mRNA level, which is this oncogene. About 60% of patients with invasive bladder cancer have changes in the gene TP53 [7]. It is one of the most important tumor suppressors, described as the guardian of the genome. Protein P53 coded by this gene is an inhibitor of cell growth, which leads to arresting the cell cycle and/or apoptosis. In both mentioned pathways, microRNA plays a significant role as a negative regulator of gene expression at the post-transcriptional level. Besides other genes, microRNA 19a-3p (miR-19a-3p) targets the suppressor gene PTEN (phosphatase and tensin homolog). The product of this gene is a negative regulator of the PI3K/Akt pathway, and therefore it is involved in regulating basic cell processes, including proliferation and apoptosis. It is the result of cell cycle control at the transfer point from stage G1 to S.
The purpose of the study was to analyze changes in miR-99a-5p and miR-19a-3p expression in samples of BC patients’ tumor tissues and to determine whether the observed changes in the expression level of the above-mentioned microRNAs can be used as a diagnostic and prognostic marker in bladder cancer.
Material and methods
The tested group consisted of tumor tissue samples stored in the tissue bank in the Department of Clinical Genetics, the Chair of Clinical and Laboratory Genetics, Medical University of Lodz. The tumor tissues were taken during the TURBT examination (transurethral resection of bladder tumor) at the Urology Ward of the University Clinical Hospital, Military Memorial Medical Academy in Lodz. The official permission to conduct examinations was granted by the Bioethics Advisory Commission at Lodz Medical University, No. RNN/62/15/ KE/M, and the patients signed the formal consent. The fragments selected for RNA isolation were submerged in the special stabilization RNAlater solution (Sigma) and stored at –20°C until the isolation time. The tests were carried out on a group of 60 patients with diagnosed bladder cancer (details presented in Table I). The age range was 40–89, with the average 69.4. Most of the patients were male (49/60 – 81.7%). All the tumors were of urothelial origin. Forty (66.7%) patients in the group suffered from non-invasive bladder cancer, among whom 20 (33.35%) patients were in stage Ta and 20 (33.35%) patients in stage T1. The last 20 (33.3%) patients were diagnosed with invasive bladder cancer in stage T2. The criterion which decided about the patients’ selection for the tested group was the histopathological recognition, confirmed by a clinical physician. The additional criteria were: primary tumor patients and patients with no oncology treatment history. Tumors were graded according to the WHO classification and staged using the TNM criteria [8–10]. Progressive disease was defined as progression to stage T2 or higher stage of disease, development of nodal or distant metastases. The control group (C) consisted of 20 patients admitted to the Urology Ward. They underwent control cystoscopy, the aim of which was to confirm or to exclude tumor changes in the bladder. The examination did not reveal any tumor changes. All the controls were age and sex matched and had no history of any tumors.
Table I
Characteristics of patients
Methods
The MirVana miRNA Isolation Kit (Life Technologies, Cat No 1556) was used to isolate microRNA from the tumor tissues. The whole procedure was followed in accordance with the producer’s guidelines. After the completion of the isolation procedure, the amount and purity of the obtained microRNA were determined, applying the spectrophotometric method on the NanoDrop ND-1000 instrument. The purity measurement of the obtained extracts is the relationship A260/230 and A260/280. It is accepted that for good quality nucleic acids it is respectively 1.8–2.2 and 1.8–2.0. The measurement results of the samples selected for further analysis met the required criteria.
The next step was to conduct the synthesis reaction of cDNA on the microRNA transcript using the miRCURY LNA Universal RT microRNA PCR set (Exiqon. Cat No. 203351, T100 Thermal Cycler, Bio-Rad), following the manufacturer’s protocol (briefly: 5× Reaction Buffer 2 μl, Reverse Transcriptase, 50 U/μl 1 μl, Synthetic RNA Spike ins 0.5 μl, microRNA 5 ng/μl 2 μl, Nuclease-free Water 4.5 μl). First, all the samples were diluted until the final concentration of 5 ng/μl in a 10 μl volume was obtained. The RNA Spike-in synthetic transcript, attached to the set, was used for quality control of the described reaction. The cDNA obtained in this way was stored at –20°C, and then it was used as a transcript for the real time-PCR (CFX96 Real-Time PCR Detection System, Bio-Rad). The expression level of the selected microRNAs was assessed using the miRCURY LNA Universal RT microRNA PCR set (Exiqon, Cat No. 203403). The first step involved preparing the 1/80 dilution of the obtained cDNA by suspending 5 μl of the reaction mixture containing cDNA in 395 μl of the Ultra Pure Water. Validated hsa-mir-99a-5p and hsa-mir-19a-3p were used for the amplification (hsa-mir-19a-3p: 5′UGUGCAAAUCUAUGCAAAACUGA3′ and hsa-mir-99a-5p: 5′AACCCGUAGAUCCGAUCUUGUG3′). In addition, the commercial set which was used in our tests provided double control. Firstly, there was internal control as the so-called RNA Spike-in UniSp6, the synthetic transcript, enabled validity and quality control of all the stages of our analysis, starting from the microRNA isolation. Secondly, there was also endogenous control. Reference microRNA hsa-mir-103a-5p was used to normalize the measures of the expression level of the selected markers. Each sample was run in duplicate at a final volume of 10 μl containing 5 μl of ExiLENT SYBR Green master mix, 2× concentrated, PCR primer mix 1 μl, diluted cDNA 4 μl. Each PCR included no template control and all of them were negative. The PCR reaction was heated to 95°C for 10 min; after that there were 40 cycles of 95°C for 10 s and 60°C for 1 min. The specificity of the reaction was checked through the analysis of the melting curve of PCR reaction products.
Methods of analysis of obtained results
The ΔΔCt method, also defined as the comparative method, was applied to determine the relative expression level of the examined microRNAs. The method is based on mathematical calculations which enable one to determine the relative difference in the expression level of the tested marker between unknown samples and the reference. The first stage consisted of the analysis of marked threshold cycles (Ct) in the amplification reaction of the examined microRNAs and the control microRNAs for both the tested and control group. The calculated expression level of each patient was normalized against the endogen control – miR-103a-5p. After that, the difference of the tested and the control microRNAs (ΔCt) was calculated for individual samples. The calculations were performed using the formula FC = 2–ΔΔCt . The results obtained in this way are expressed as the multiple of the control trial [11]. The obtained values were divided into the classes of increased, decreased or unchanged expression levels on the basis of the calculated average ±2 SEM (standard error of the mean).
Statistical analysis
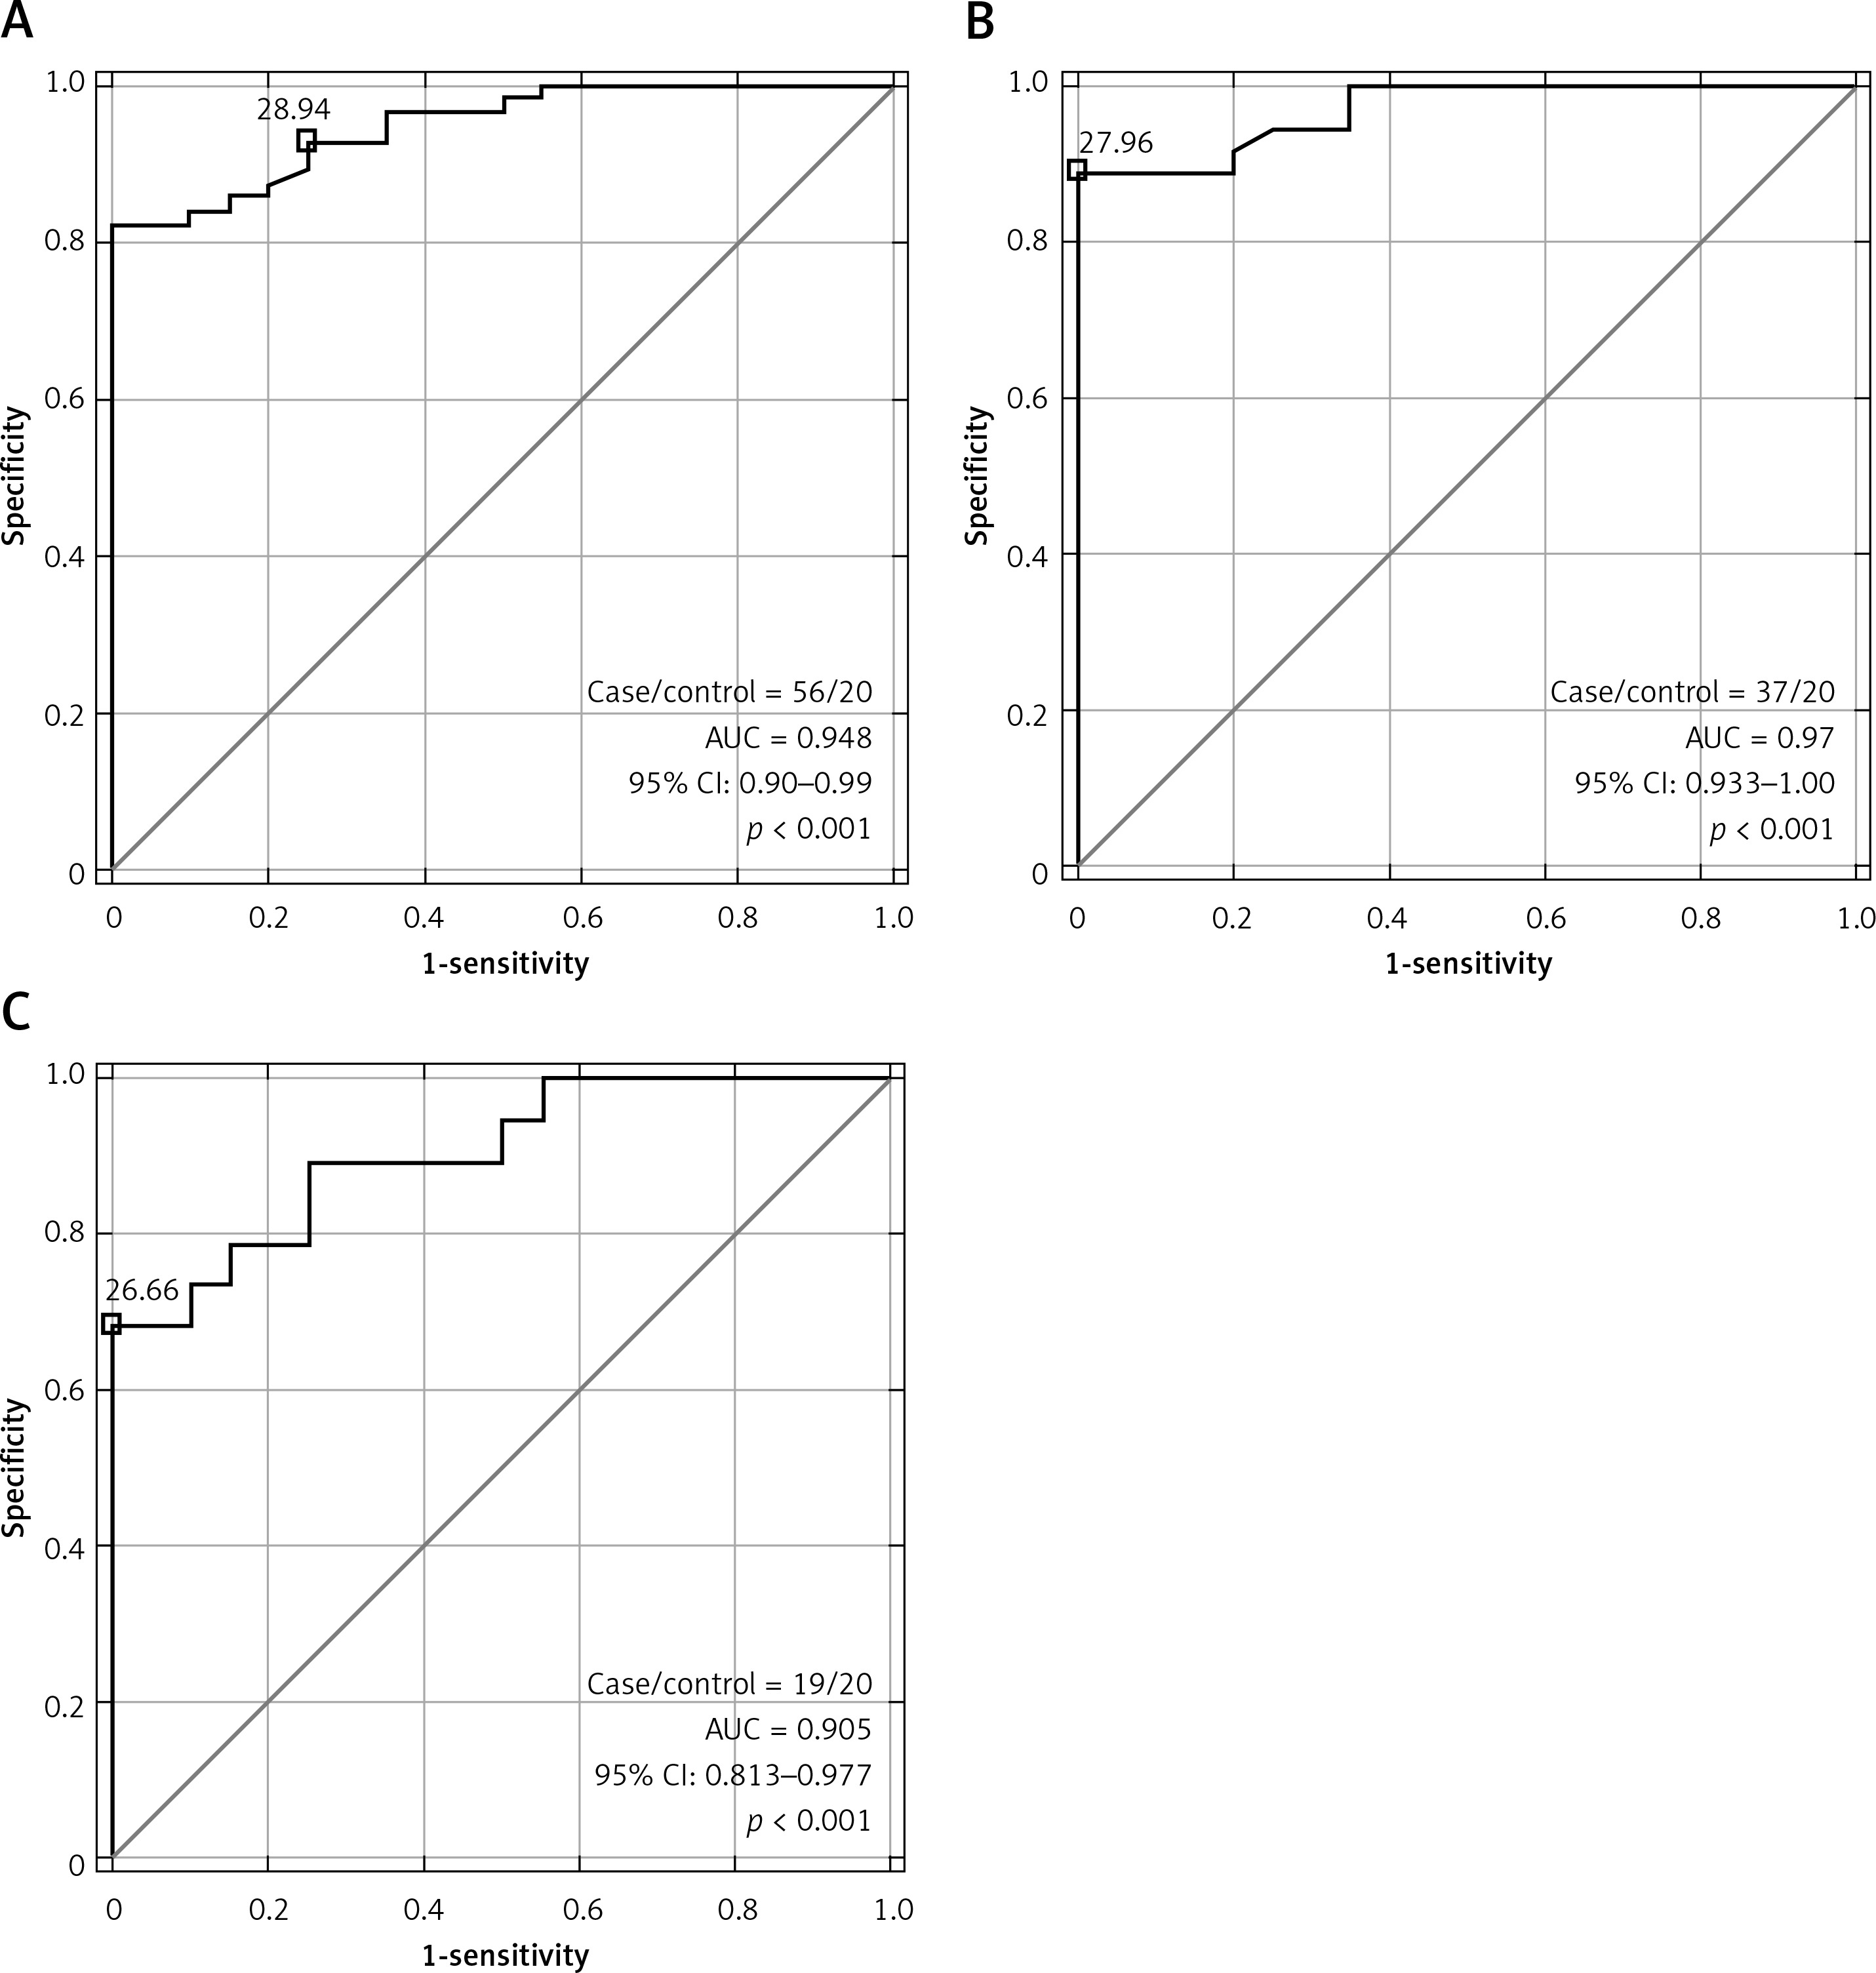
The program Statistica 13, Stat-Soft Inc was used to make statistical calculations. The normality of the distribution of variables was verified by the Shapiro-Wilk test and parametric test. The analysis of the unrelated variables was performed with the t test and Mann-Whitney U test. The analysis of relationships between the expression of the selected microRNAs and the selected clinical parameters was carried out by means of the accurate Pearson’s χ2 test. The value p < 0.05 was accepted as the threshold of statistical difference or correlation significance. The area under the receiver operating characteristic curve (ROC) was calculated (results presented in Table II and Figure 1).
Table II
T test results of miRs for the appropriate subgroup of patients
| t test for HG | Progression (yes/no: 26/11) | Recurrence (yes/no: 13/24) | Stage (TaT1/T2: 18/19) |
|---|---|---|---|
| miR19a | 0.2780225 | 0.37691 | 0.014332 |
| miR99 | 0.228834 | 0.281592 | 0.451997 |
| t test for LG | Progression (yes/no: 6/13) | Recurrence (yes/no: 14/5) | Stage (TaT1/T2 = 19/0) |
| miR19a | 0.21001* | 0.033884* | – |
| miR99 | 0.1598295 | 0.035877 | – |
| t test for TaT1 | Progression (yes/no: 16/21) | Recurrence (yes/no: 22/15) | Grade (HG/LG: 18/19) |
| miR19a | 0.4116115 | 0.3017835 | 0.0315435 |
| miR99 | 0.1862725 | 0.075472 | 0.4197025 |
| t test for T2 | Progression (yes/no: 16/3) | Recurrence (yes/no: 5/14) | Grade (HG/LG = 19/0) |
| miR19a | 0.264414 | 0.3949525 | – |
| miR99 | 0.1658645 | 0.2444815 | – |
Results
The statistical analysis using the non-parametric Mann-Whitney U test indicated significant statistical differences in the expression level of the two selected microRNAs, miR-19a-3p and miR-99a-5p, between the tumor tissue and the normal urothelium (miR-99a-5p p = 0.34262, miR-19a-3p p < 0.001).
Analysis of microRNA-19a-3p expression level
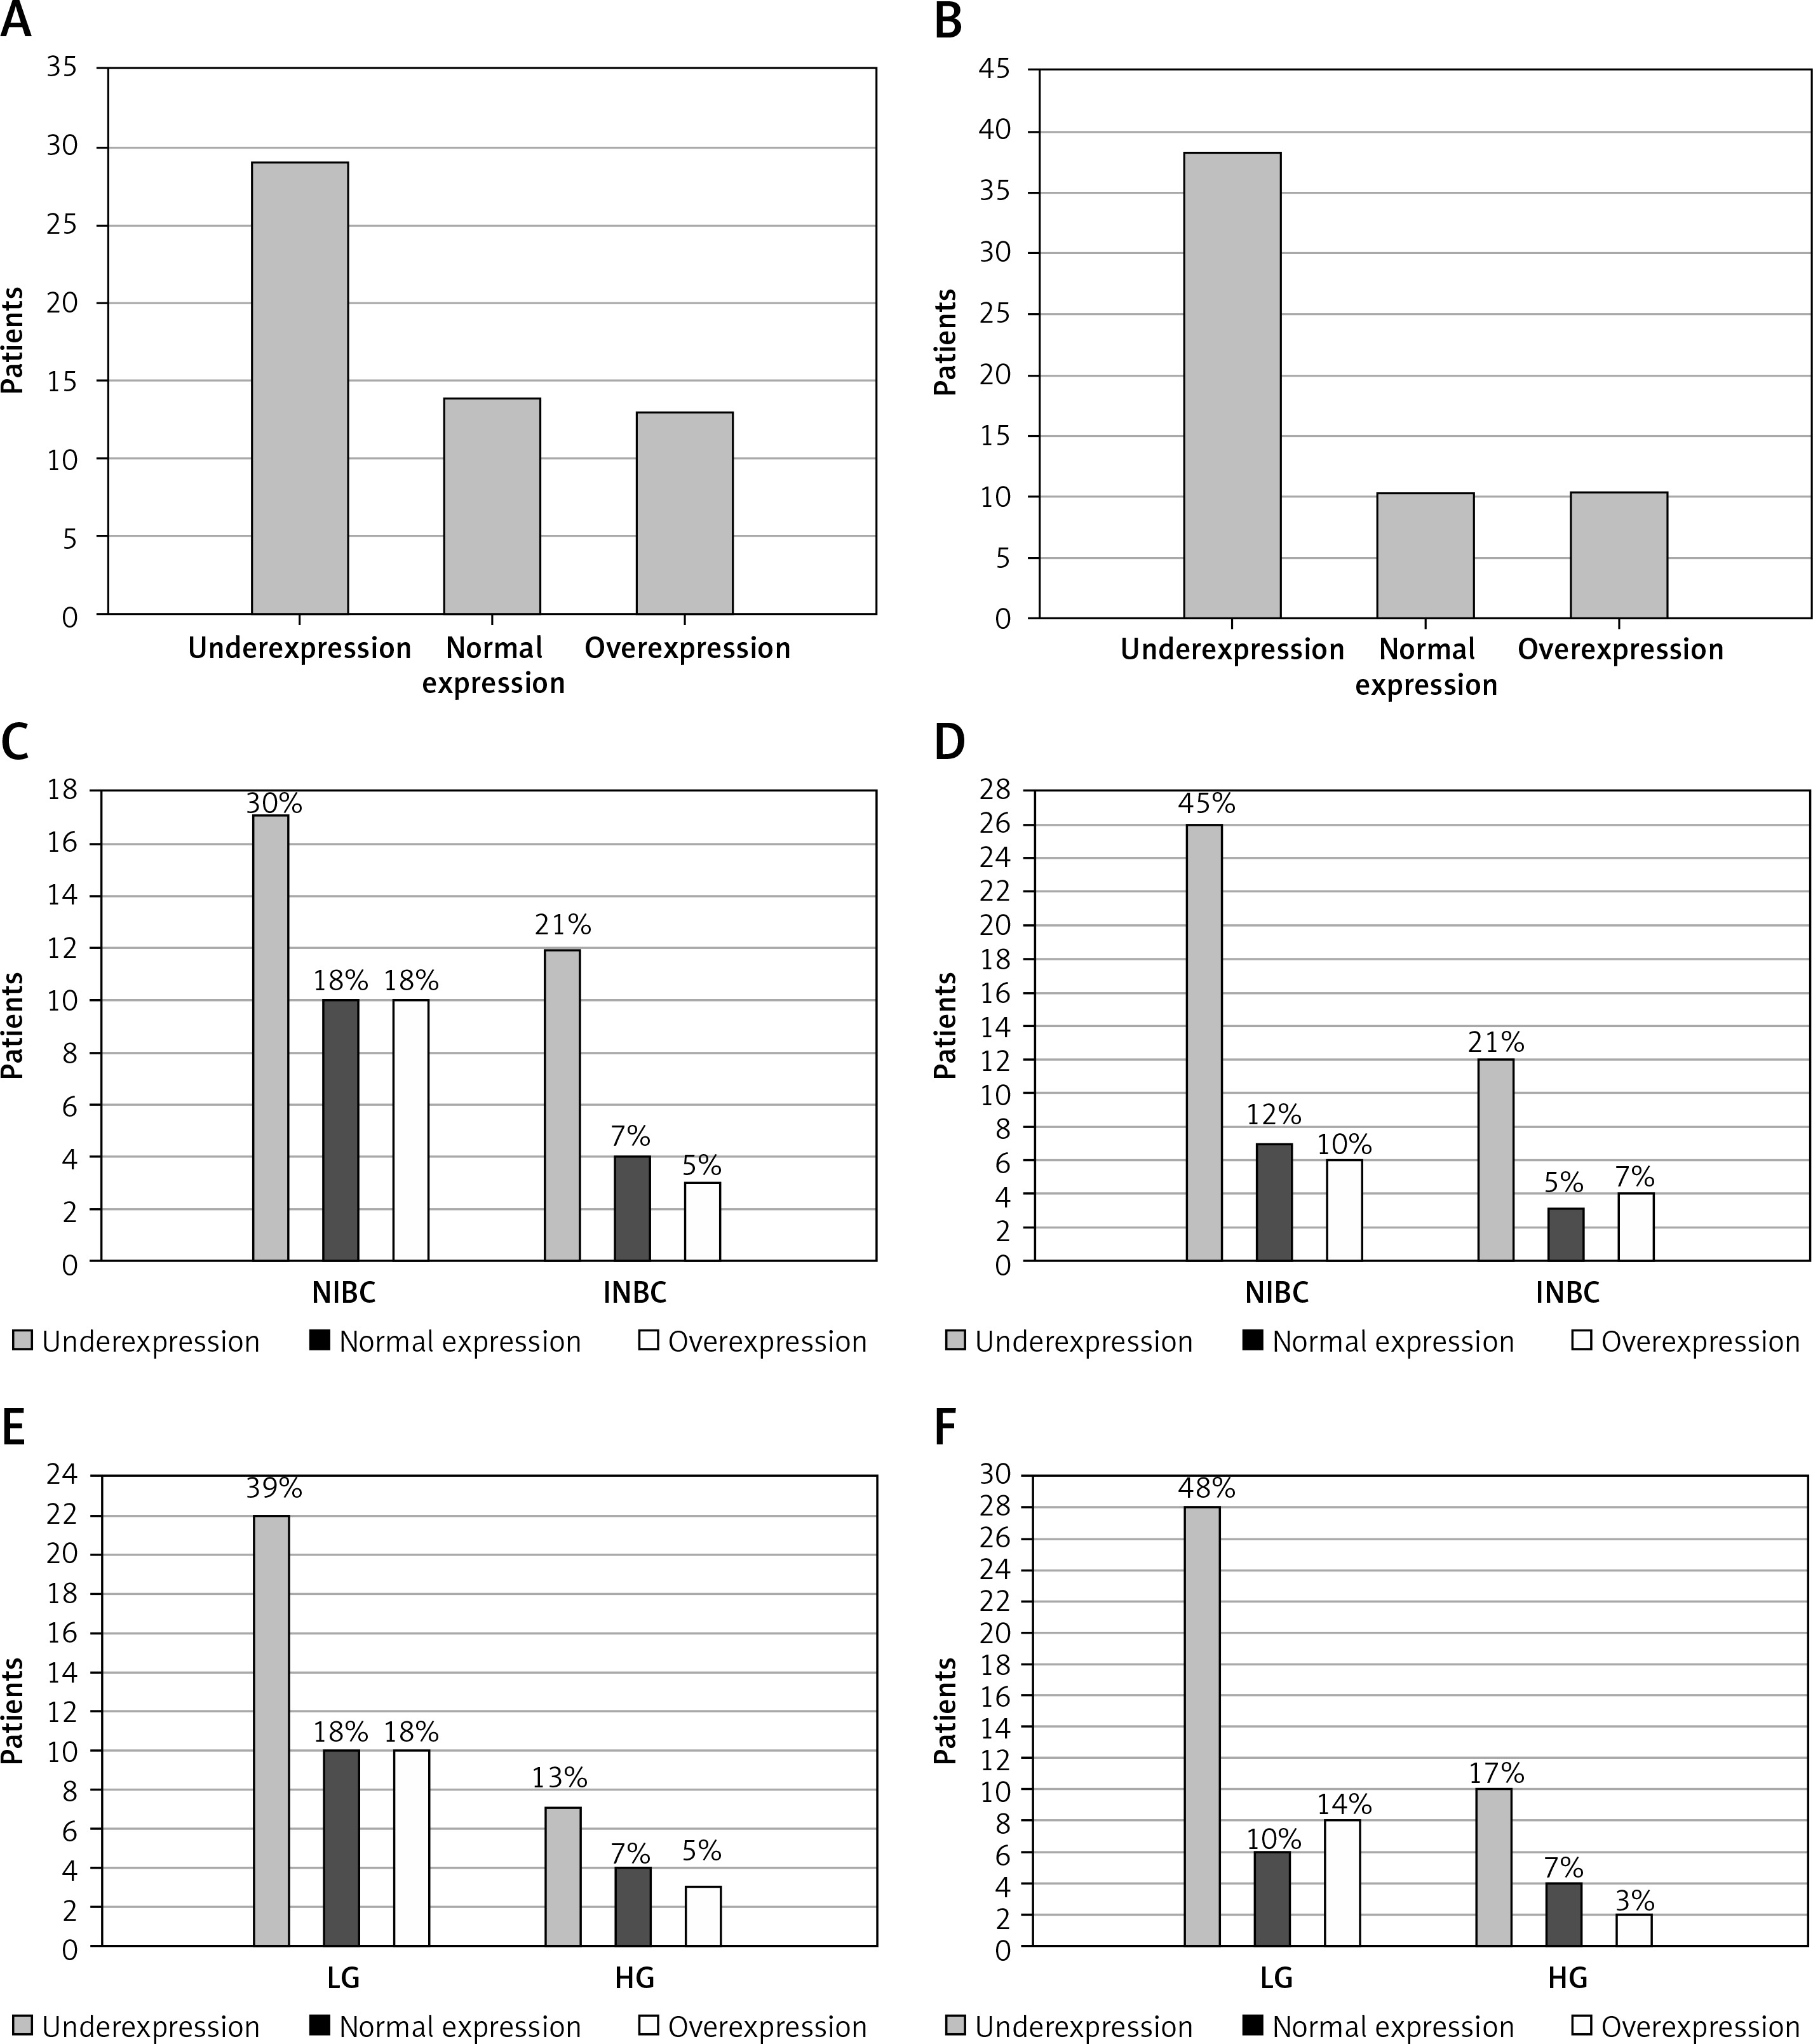
Fifty-six patients were subjected to analysis (37 with NINBC and 19 with INBC); 4 patients were rejected due to unsuccessful amplification in the rt-PCR reaction. Decreased expression was observed in most cases – 29 (51.8%) patients. Thirteen (23.2%) patients had increased expression whereas an unchanged expression level was observed in 14 (25%) patients.
Analysis of microRNA-99a-5p expression level
Fifty-eight patients were subjected to analysis (39 with NINBC and 19 with INBC); 2 patients were rejected due to unsuccessful amplification in the rt-PCR reaction. The expression level of the tested microRNA was mostly decreased – 38 (65.5%) patients. The other 20 patients had an unchanged expression level (17.25%) or an increased expression level (17.25%). Results presented in Figure 2.
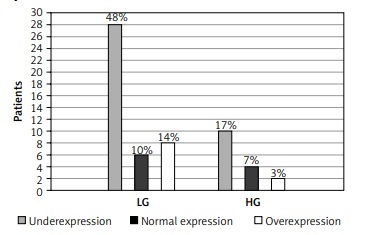
Figure 2
Expression level of miR-19a-3p (A) and miR-99a-5p (B) in tumor tissue compared to the control group. Results based on normalization to miR-103a-5p. Analysis of changes in expression level according to clinical stage: miR-19a-3p (C), miR-99a-5p (D) and grade of cancer: miR-19a-3p (E), miR-99a-5p (F)
NIBC – non-invasive bladder cancer, INBC – invasive bladder cancer, LG – low grade, HG – high grade.
There was an analysis of the expression levels of the two tested microRNAs, miR-19a-3p and miR-99a-5p, in terms of stage and grade. Pearson’s χ2 test was applied for it. The analysis at the 95% significance level showed no statistically significant relationships.
No correlation was found between the expression level of the tested microRNAs and other clinical parameters, smoking or occupational exposure. Also no statistical relationship was found between the patients’ sex or age and the expression level of the analyzed markers.
The t test was applied to assess the average values of individual miRs for the appropriate subgroup of patients. Only miR-19a was found to be statistically significant in all the subgroups (LG, HG, TaT1, T2) compared to the control group (p < 0.001 for all subgroups). Moreover, the analysis for progression and/or recurrence showed that only miR-19a differentiated patients in TaT1 and T2 stages in HG. In the group of patients in a high grade, those in clinical stage TaT1 are characterized by significantly low values of miR-19a-3p in comparison to the patients of the same grade and more advanced stage (T2). Similarly, in the group of TaT1 patients with a low grade of the disease, miR-19a-3p values are significantly higher than for patients with the same stage and higher grade. However, both miRs differentiated patients who have recurrence from those without recurrence (results presented in Table II). Receiver operating characteristic curve analysis showed that only miR-19a-3p is a classifier with a significantly different area under the curve (AUC) compared with the control group. Moreover, it helps to differentiate patients in both stage and grade (demonstrated in Table III and Figure 1).
Table III
Results of area under receiver operating characteristic curve (ROC)
Discussion
Bladder cancer is one of the most frequent urinary tract tumors [12]. In Poland it is the fifth cause of death from malignant diseases diagnosed in male patients. At present, urine sediment cytology with cystoscopy is the primary tool in bladder cancer diagnosis and the stage and grade recognized in histopathological examination are the most reliable prognostic markers [10]. The high risk of recurrence and progression of the disease towards invasive changes makes it important to identify markers enabling both diagnosis of changes in the early stage and monitoring of patients. Numerous scientific reports suggest that besides TP53 gene mutation, other molecular factors are of significant importance in bladder cancer etiopathogenesis [2, 3], that is, post-transcriptional regulation of expression of genes involved in carcinogenesis by small non-coding RNA molecules – microRNAs.
The presented analyses of the miR-19a-3p expression level showed that the expression was decreased in 51% of patients and overexpression was observed only in 23.3% of the tested group. As it is assumed in many scientific reports, there may be a relationship between this microRNA and the suppressor gene PTEN. For example, the research of Feng et al. [13] showed that at the mRNA level, the target for miR-19a-3p in bladder cancer may be the above-mentioned gene. The analyses were performed with the Western blot techniques, and later they were confirmed with the “PTEN expression plasmid” technique. There were also miR-19a-3p expression analyses performed on cell lines and on 100 tumor tissue samples obtained from bladder cancer patients using real-time polymerase chain reaction (rt-PCR). They revealed that the expression level of this molecule is increased considerably in bladder cancer patients, which additionally correlates with a more invasive bladder cancer phenotype. Our research pointed to the opposite tendency in terms of expression. Moreover, it did not confirm the relationship between the expression level and tumor stage or grade, but we found that miR-19a-3p is a good classifier for bladder cancer patients compared to healthy people. In addition, Feng et al. made an assessment of the miR-19a expression level in blood plasma, obtaining results similar to those in tissue. They concluded that the loss of function of miR-19a can promote cell growth of bladder cells. According to Shi et al. [14], there were some publications which also pointed to decreased miR-19a-3p expression in bladder cancer patients; however, the anchor point for this molecule was not identified at the mRNA level. It is possible that the microRNA is responsible for the regulation of other genes the relationship with which is not known yet. For instance, the research presented by Bush et al. [15], and confirmed by the tests with the reporter probe, showed that the direct target gene for miR-19a-3p is the gene for 5-LO (5-lipoxygenase), the enzyme included in the leukotriene biosynthesis pathway, whose deregulations can also lead to the development of tumors. Lu et al. [16] researched the significance of microRNA for prostate cancer using samples of patients’ tumor tissues for tests. They showed that miR-19a-3p is responsible for regulation of the suppressor gene BTG1 (B-cell translocation gene 1) and its expression is increased in tumors. The above-mentioned examples refer to piloting examinations, which are also an introduction to analysis of miR-19a-3p as a marker in tumor diagnosis, which was confirmed in our study. miR-19a-3p is useful in differentiating LG and HG patients in the TaT1 stage. A recently published study showed that miR-19a could promote the invasion and epithelial-mesenchymal transition (EMT) of bladder cancer cells through inhibiting the expression of RhoB [17].
Regarding the other microRNA 99a-5p, which was analyzed in this study, its decreased expression was observed in most of the examined patients (65%). Performing analyses on cell lines and on 100 tumor tissue samples of bladder cancer patients using the rt-PCR technique, Feng et al. also observed decreased expression of this microRNA, which correlated with a more malignant cancer phenotype [18]. What is more, they obtained similar results when using those patients’ blood plasma for their analyses. Catto et al. carried out tests on 72 samples of normal and changed urothelium and on 6 cell lines [19]. Analyzing 322 microRNAs with the microarray and rt-PCR techniques, they investigated the relationships between the level of the selected markers and the stage. Among those markers, the expression of miR-99a was significantly decreased, especially in non-invasive bladder cancer patients. Similar results were observed by Wu et al., who carried out examinations on the T24 and EJ cell lines with the Western blot techniques and reporter probe tests [20]. They observed a decreased expression level of this microRNA, which related to the overexpression of its target gene – the FGFR oncogene. Moreover, Liu et al. reported that miR-99a expression inhibited bladder cell proliferation and the cell cycle [21]. Bladder cancer patients with low expression of miR-99a had a poor survival rate in their study. Tsai et al. confirmed that miR-99a markedly inhibits the growth of bladder cancer cells via dual inhibition of mTORC1 and mTORC2 [22]. Finally, Inamoto et al. found that overexpression of miR-99a is associated with high risk of an aggressive phenotype [23]. In our study miR-99a and miR-19a discriminate patients in LG with and without recurrence.
Another point of our analysis worth concentrating on is the question whether using control miR-103-5p had any effect on the ultimate results of the conducted tests. Hofbauer et al. used the same endogenous controls in their study. They assumed that it does not necessarily apply to any of the used miRs [24]. We analyzed the results of Peltier et al., which revealed that miR-103 and miR-191 were the most stable microRNAs in terms of their expression in tissue material from lung cancer patients and in 13 other kinds of unaffected tissues [25]. The microarray technique was used for their tests. Ratert et al., who also worked on the microRNA expression level in urothelial tumors with the rt-PCR technique, selected two groups of reference microRNAs using the microarray technique [26]. Based on the observed results, they stated that the combination of miR-101, miR-125a-5p, miR-148b and miR-151-5p or the combination of miR-148b, miR-181b and miR-874 is most accurate for obtaining the most reliable results. Referring to the above, in the analyses of Feng et al. and Han et al., U6 snRNA (U6 small nuclear RNA) was used as the reference [18, 27]. In the tests of Catto et al., three reference RNA markers were applied and the normalization was done using their average Ct [19]. The authors, however, do not give any information on the types of RNA molecules which were used. Other examples are the research of Hirata et al., who chose GAPDH (glyceraldehyde 3-phosphate dehydrogenase gene) and U48 snRNA. Jia et al. decided on miR-92b. In our opinion, the selection of the right microRNA for expression level normalization with the rt-PCR technique is a vital element influencing the reliability of the results [28, 29]. Most of the above-presented results were obtained in some introductory research, which was carried out on small groups of patients and on cell lines with different methods and devices.
In conclusion, microRNAs are essential molecules regulating genetic material translation. In comparison to normal urothelium, significant differences were observed in tumor tissue. Moreover, miR-19a-3p in our tested group was useful to differentiate between low and high grade disease in NINBC stages. Furthermore, miR-19a-3p and miR-99a-5p were able to distinguish patients with LG disease into groups with or without recurrence. It might be a potential non-invasive marker of recurrence. It is necessary to conduct further analysis in urine or plasma on a bigger group of patients.