Introduction
Diabetic nephropathy (DN) is one of the most common complications of patients with type I or type II diabetes mellitus and has been posited to be the second leading cause of end-stage renal disease, and approximately 1/5 of type I and 1/3 of type II diabetic patients are plagued by DN [1, 2]. Microalbuminuria and an increase in urinary albumin excretion rate (UAER; ≥ 20 µg/min) are considered as the early physiological changes in response to renal dysfunction [3]. Although extensive underlying pathogenic mechanisms have been investigated in various renal cells, including podocytes, glomeruli mesangial cells and glomerular endothelial cells [4, 5], the potential molecular targets have not been completely expounded in the pathological process of DN.
microRNAs (miRs) as a new class of non-coding RNAs have been implicated in various physiological and pathological processes via post-transcriptional repression of target gene expression [6]. Interestingly, numerous miRs are already used as therapeutic and diagnostic markers in a variety of diseases, including DN [7, 8]. A systematic review using bioinformatic analysis for evaluating the association between miR expression and DN revealed that five up-regulated miRs, miR-21-5p, miR-29a-3p, miR-126-3p, miR-214-3p, and miR-342-3p, and one down-regulated miR, miR-192-5p, are involved in the pathogenesis of DN [9]. Glomerular endothelial cell-specific miRs, such as miR-146a, 155 and miR-497, are activated in high glucose condition and contribute to glomerular endothelial injury [8, 10]. In addition, serum miR-130b and miR-21 and urinary miR-192, let-7c-5p, miR-29c-5p and miR-15b-5p have been reported as potential diagnostic biomarkers for DN [11–14]. Four differentially expressed miRs, miR-21-3p, miR-378-3p, miR-16-5p and miR-29a-3p, in plasma are closely correlated with the pathological grade of patients with DN [15].
In the present study, we used miR microarray analysis to explore miR expression profiling in high glucose-treated human glomerular endothelial cells, and found that 126 miRs were significantly differentially expressed in glomerular endothelial cells in response to high glucose stimulation. The expression of the top 6 miRs, miR-372-3p, miR-15a, miR-555, miR-let-7i-5p, miR-621 and miR-646, wasa observed in high glucose-stimulated glomerular endothelial cells using RT-qPCR, and the results demonstrated that miR-372-3p was noteworthy for glomerular endothelial cell dysfunction. Moreover, we also measured the expression level of miR-372-3p in the serum of patients with DN to evaluate whether miR-372-3p might be a valuable diagnostic factor for DN screening. Furthermore, we discovered that fibroblast growth factor-16 (FGF-16), which belongs to the FGF-9 subfamily and mainly exerts protective effect on heart [16], as a direct target of miR-372-3p was associated with high glucose-induced glomerular endothelial cell dysfunction.
Material and methods
Patients and specimens
Fifty-seven healthy controls (HC), fifty-three type 1 diabetes mellitus (T1DM) and one hundred and eighteen type 2 diabetes mellitus (T2DM) patients with DN were enrolled in the Weifang City Traditional Chinese Medical Hospital from January 2015 to December 2018. Clinical and laboratory characteristics of HC and T1DM or T2DM patients with DN were summarized as shown in Table I. The diagnostic criteria of T1DM and T2DM were adopted as described previously [17]. The inclusion and the exclusion criteria of T1DM or T2DM patients with DN were as follows: inclusion criteria were patients diagnosed with DN combined with T1DM or T2DM and age less than 80 years; exclusion criteria were kidney transplantation, nondiabetic nephropathy, acute cerebrovascular events, acute coronary events and acute infectious diseases, malignant tumor, chronic rheumatic disease, and thyroid function abnormalities. Whole blood (10 ml) was collected from all participants, and plasma was separated as described previously [18]. Signed informed consent forms were obtained from all patients. Our study was approved by the Ethics Committee of the Weifang City Traditional Chinese Medical Hospital.
Table I
Clinical and laboratory characteristics of HC and patients with DN
| Parameter | HC (n = 57) | T2DM patients with DN (n = 118) | T1DM patients with DN (n = 53) |
|---|---|---|---|
| Age [years] | 52.6 ±14.7 | 54.7 ±12.1 | 30.2 ±18.9* |
| Gender (M/F) | 31/26 | 63/55 | 27/26 |
| BMI [kg/m2] | 23.8 ±3.2 | 28.4 ±3.9* | 21.5 ±3.41 |
| Duration of DN [years] | – | 4.6 ±1.7 | 3.8 ±1.5 |
| FBG [mmol/l] | 4.83 ±0.68 | 7.15 ±1.41* | 10.63 ±1.61* |
| HbA1c (%) | 5.12 ±0.45 | 8.33 ±1.66* | 9.65 ±2.05* |
| Scr [µmol/l] | 52.5 ±5.2 | 78.5 ±8.5* | 100.4 ±9.7* |
| eGFR [ml/min/1.73 m2] | 129.4 ±20.55 | 70.6 ±25.1* | 65.3 ±26.9* |
Cell culture
Human glomerular endothelial cells were obtained from ScienCell Research Laboratories (Carlsbad, CA, USA) and cultured in Dulbecco’s modified Eagle’s medium (DMEM; Gibco; Thermo Fisher Scientific, Inc., Waltham, MA, USA), containing 10% fetal calf serum (Gibco; Thermo Fisher Scientific, Inc.), 10% L-glutamine, 0.5% penicillin/streptomycin, with 5% CO2 atmosphere at 37°C.
Microarray assays
Microarray analysis was performed using Agilent Human miRNA (8*15K) V14.0 arrays of Ribobio (Guangzhou, China), as described previously [19]. In brief, after the human glomerular endothelial cells’ exposure to high glucose (30 mM) or normal glucose (5 mM), miR expression profiling was detected using miR microarray assays (n = 3 in each group). The miRNeasy Mini Kit (Qiagen, Inc., Valencia, CA, USA) was used to extract total RNA, according to the manufacturer’s protocol. miRs were labeled with Hy3 or Hy5 fluorescence using the miRCURY Array Power Labeling Kit (Exiqon) to obtain the fluorescent probe that can be hybridized with the chip. The labeled probe was hybridized with the miRCURY chip under the standard conditions using the MAUI hybridization system. An Agilent scanner and the Feature Extraction 10.7.1.1 software (Agilent Technologies) were used to obtain the microarray raw data. Microarray results were analyzed using the GeneSpring GX 12.5 software (Agilent Technologies). Differentially expressed miRs were selected out according to |Log2fold change| ≥ 1, p < 0.05 and a false discovery rate < 0.05. The hierarchical clustering analysis was performed using MeV software (version 4.2.6).
RNA isolation and RT-qPCR
The miRNeasy Mini Kit (Qiagen, Inc., Valencia, CA, USA) was used to extract total RNA, according to the manufacturer’s protocol. The TaqMan RT kit and TaqMan MicroRNA assay (Thermo Fisher Scientific, Inc.) were used to perform RT-qPCR assay of miRs using the Applied Biosystems StepOne-Plus Real-Time PCR System. The reaction was performed via 40 amplification cycles using the following protocol: 95°C for 3 min, 95°C for 45 s, 55°C for 15 s, and 72°C for 50 s. miRs expression levels were calculated using the 2–ΔΔCt method, as previously described [20]. U6 was used as an internal control. The primers used for PCR were as follows: miR-372-3p: forward, 5’-TTTCACGA-CGCTGTAAACTCGCA-3’, and reverse, 5’-GTGCA-GGGTCCGAGGT-3’; miR-15a forward, 5’-TAGCA-GCACATAATGGTTTGTG-3’, and reverse, 5’-GTGCAGGGTCCGAGGT-3’; U6 forward, 5’-CTCGCTTCGGCAGCACA-3’, and reverse, 5’-AACGCTTCACGAATTTGCG-3’.
MTT assay
Glomerular endothelial cell proliferation was monitored using a MTT Cell Proliferation/Viability Assay kit (R&D Systems, Inc., Minneapolis, MN, USA) according to the manufacturer’s protocol.
Nitric oxide (NO) production
The level of NO in cellular supernatant was detected using the bioactive ELISA assay (Elabscience Biotechnology Co., Ltd., Wuhan, China) with a SpectraMax M5 ELISA plate reader (Molecular Devices, LLC, Sunnyvale, CA, USA), according to the manufacturer’s protocol.
Malondialdehyde (MDA)
Glomerular endothelial cells were lysed with extraction buffer and centrifuged (12000×g, 10 min, 4°C) for collecting supernatant. MDA was detected using a commercial kit from the Nanjing Jiancheng Bioengineering Institute (Nanjing, China).
Caspase-3 activity
Glomerular endothelial cells lysates were prepared and incubated with anti-caspase 3 (cat. no: 9662; dilution: 1 : 50; Cell Signaling Technology, USA). Immunocomplexes were incubated with peptide substrate in assay buffer for 2 h at 37°C. Release of p-nitroaniline was measured at 405 nm using an ELISA reader (MD SpectraMax M5, USA) according to the manufacturer’s instructions.
Western blotting
Western blotting assay were determined as previously described [21]. eNOS (cat. no: 9586; dilution: 1 : 1,000) and p-eNOS (cat. no: 9571; dilution: 1 : 1,000) primary antibodies were purchased from Cell Signaling Technology. FGF-16 (cat. no: sc-376214; dilution: 1 : 1,000) antibody was purchased from Santa Cruz Biotechnology. Anti-β-actin (cat. no. sc-130065; 1 : 2,000; Santa Cruz Biotechnology) was used as the control antibody.
Cell apoptosis assay
The cell apoptosis assay was determined as previously described [22]. The Annexin V-FITC apoptosis detection kit was purchased from Invitrogen (Carlsbad, Calif, USA). The samples were analyzed using a flow cytometer (BD Biosciences, Franklin Lakes, NJ, USA).
Cell transfection and plasmid constructs
miR-372-3p mimics (5’-AAAGUGCUGCGACAU-UUGAGCGU-3’), inhibitors (5’-ACGCUCAAAUGUCG-CAGCACUUU-3’) and scramble sequence (5’-CUAUGUGUCUCUGUAUAGUUAGC-3’) were synthesized by RiboBio (Guangzhou, China) and transfected with into glomerular endothelial cells using Lipofectamine 2000 (Invitrogen) for 48 h at 37°C according to the manufacturer’s protocol. A mammalian expression plasmid designed to specially express the full-length open reading frame of human FGF-16 without 3’-UTR, which did not contain the conserved complementary sequence binding with miR-372-3p, was purchased from GeneCopoeia, Inc. (Rockville, MD, USA). An empty plasmid served as the negative control. Vector-Con and vector-FGF-16 were transfected into HCC cells using Lipofectamine 2000 for 48 h at 37°C, according to the manufacturer’s protocols.
Luciferase reporter gene assay
The wild-type (WT) or mutant-type (Mut) 3′-UTR of FGF-16 were inserted into the multiple cloning sites of the luciferase expressing the pMIR-REPORT vector (Ambion; Thermo Fisher Scientific, Inc.). The luciferase activity was measured using the Dual Luciferase Reporter Assay System (Promega, USA) on a Luminoskan Ascent Microplate Luminometer (Thermo Fisher Scientific, Waltham, MA, USA).
Statistical analysis
Data were presented as the mean ± standard error of the mean. Statistical analysis was performed using SPSS software version 19.0 (IBM Corp., Armonk, NY, USA) and GraphPad Prism version 7.0 (GraphPad Software, Inc., La Jolla, CA, USA). Student’s t-test was used to analyze two-group differences. Differences between multiple groups were analyzed by one-way analysis of variance, followed by a post-hoc Tukey test. Receiver operating characteristic (ROC) curves and the area under the ROC curve (AUC) were used to assess the potential for using plasma miR-372-3p and miR-15a as diagnostic biomarkers of DN. Binary logistic regression analysis was used to combine the expression level of miR-372-3p and miR-15a as combined diagnostic markers for DN. The maximum value of the Youden index was used as a criterion for selecting the optimum cut-off point. P < 0.05 was considered to indicate a statistically significant difference.
Results
miRs expression profiles in high glucose-stimulated glomerular endothelial cells
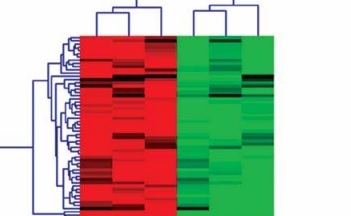
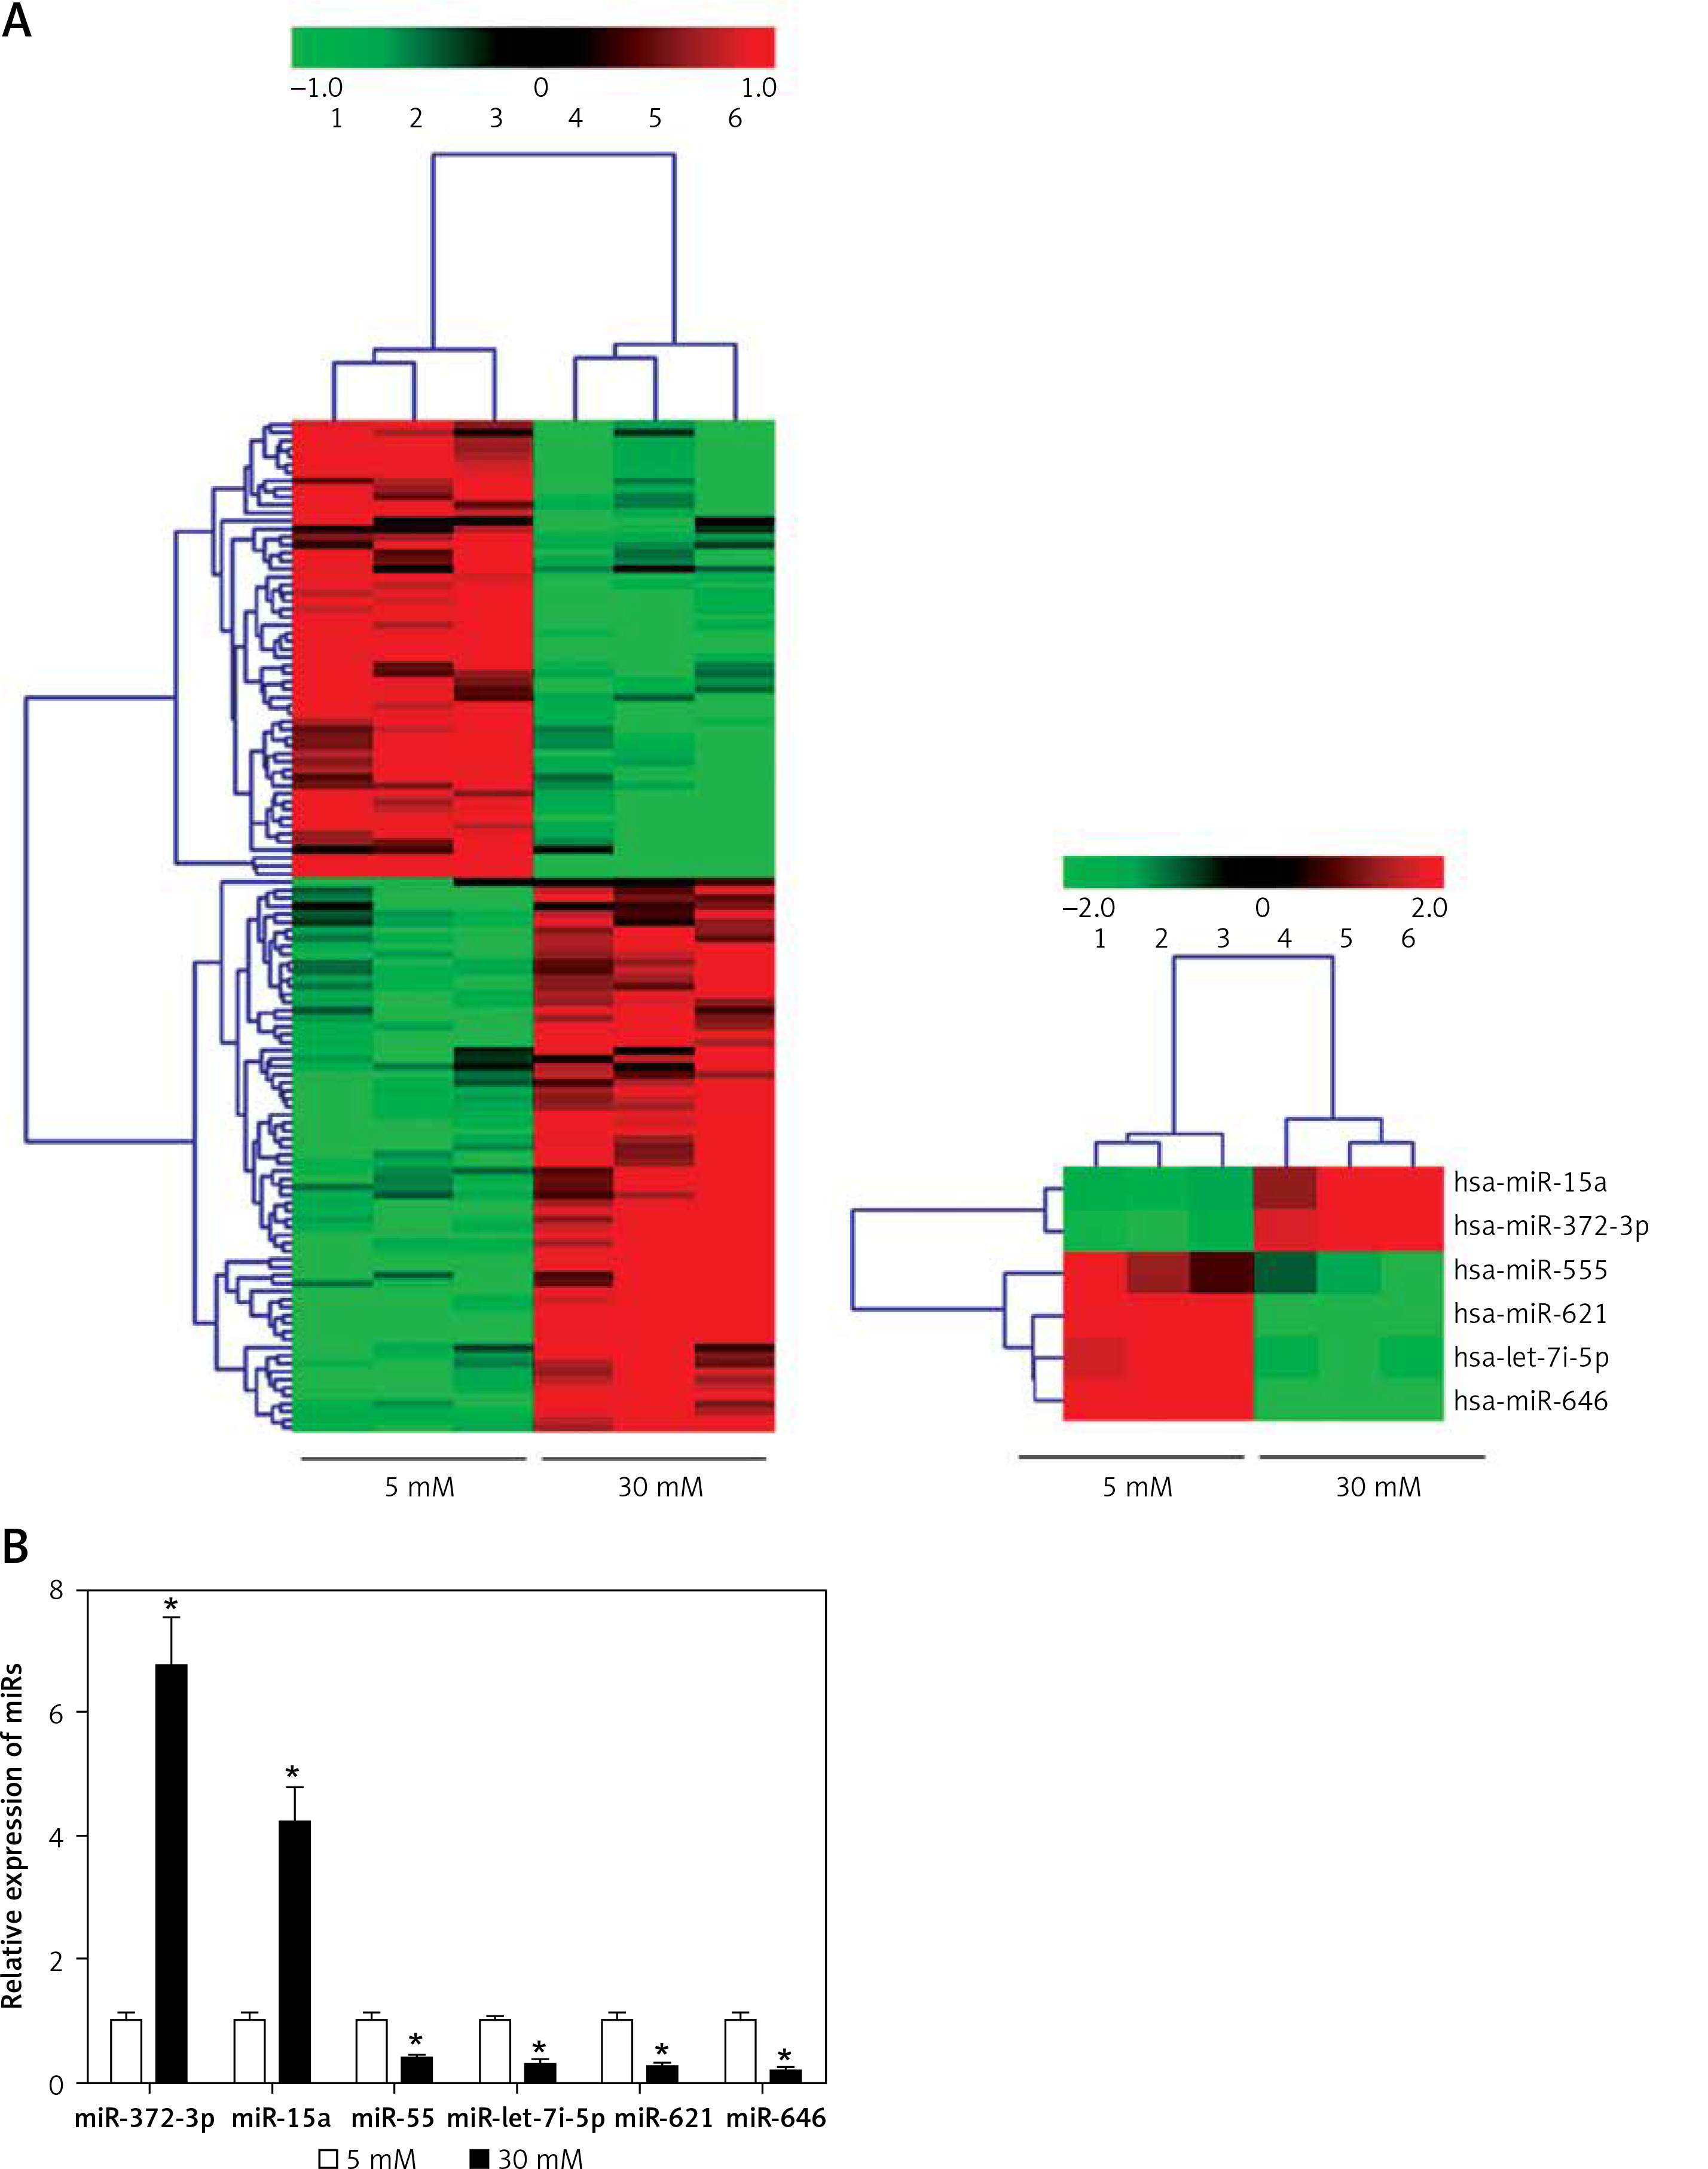
Specific miRs responsive to high glucose stimulation in glomerular endothelial cells were identified to excavate valuable therapeutic targets for the treatment of DN. miRs microarray assays were used to analyze differentially expressed miRs. A total of one hundred and twenty-six miRs, which were selected out according to |Log2fold change| ≥ 1, p < 0.05 and false discovery rate < 0.05, were found to be significantly and differentially expressed between normal glucose and high glucose-treated glomerular endothelial cells (Figure 1 A). To further investigate the function of miRs in pathophysiological conditions of glomerular endothelial cells, we focused on the top six differentially expressed miRs, comprising two up-regulated miRs (miR-15a and miR-372-3p) and four down-regulated miRs (miR-555, miR-let-7i-5p, miR-621 and miR-646). We also validated these miRs’ expression levels in high glucose-stimulated glomerular endothelial cells using RT-qPCR assays (Figure 1 B). Finally, miR-372-3p was considered as the most sensitive miR in response to high glucose-stimulated glomerular endothelial cells and selected for further study.
Figure 1
A – miR expression profiles in high glucose-stimulated glomerular endothelial cells. miR microarray assays were used to analyze differentially expressed miRs in glomerular endothelial cells in response to high glucose. B – The expression levels of the top six differentially expressed miRs, comprising two up-regulated miRs (miR-15a and miR-372-3p) and four down-regulated miRs (miR-555, miR-let-7i-5p, miR-621 and miR-646), in high glucose-stimulated glomerular endothelial cells were measured using RT-qPCR assays. *P < 0.05 compared with normal glucose group. 5 mM glucose represents normal glucose level; 30 mM glucose represents high glucose level
Knockdown of miR-372-3p reverses high glucose-induced glomerular endothelial cell dysfunction
After transfection with miR-Con or miR-372-3p inhibitors into high glucose-treated glomerular endothelial cells, MTT assays were performed to detect the effects of high glucose and miR-372-3p inhibitors on glomerular endothelial cell proliferation. Compared with the normal glucose-treated group, cell viability was significantly repressed in glomerular endothelial cells stimulated by high glucose for 48 h and 72 h, while miR-372-3p loss-of-function markedly reversed high glucose-induced glomerular endothelial cell growth inhibition (Figure 2 A). In addition, transfection with miR-Con into glomerular endothelial cells had no obvious effect on cell viability in high glucose (30 mM)-stimulated cells (Figure 2 A). Previous studies have reported that high glucose can impair production of endothelial nitric oxide synthase (eNOS) and NO, which performs the predominant role in endothelial cell dysfunction by regulating oxidative stress [5, 23]. Reduced phosphorylation of eNOS at Ser1179 has been observed in high glucose-stimulated glomerular endothelial cells and both diabetic mouse and rat [24, 25]. Our results also indicated that high glucose treatment significantly decreased NO production and the protein expression of phosphorylated eNOS at Ser1179, while knockdown of miR-372-3p dramatically accelerated NO production and the protein expression of phosphorylated eNOS at Ser1179 in high glucose-stimulated glomerular endothelial cells (Figures 2 B, 3 C). Next, we analyzed the effects of high glucose and miR-372-3p on MDA production, which is a critical index of lipid peroxidation [26]. High glucose treatment observably triggered an MDA level increase in glomerular endothelial cells. Transfection with miR-372-3p inhibitors significantly lowered the high glucose-induced MDA level (Figure 2 D). Furthermore, miR-372-3p inhibitors had the ability to prevent high glucose-induced cell apoptosis, reflecting the reduced apoptotic cell proportion and caspase 3 level in glomerular endothelial cells (Figures 2 E, D).
Figure 2
Knockdown of miR-372-3p reverses high glucose-induced glomerular endothelial cell dysfunction. A – After transfection with miR-372-3p inhibitors or miR-Con into glomerular endothelial cells in the presence of normal (5 mM) or high glucose (30 mM), cell viability was monitored using MTT assay; B – NO production in cellular supernatant was detected using colorimetric assay kit; C – eNOS and phosphorylated eNOS were measured using western blotting; D – MDA level in supernatant was detected using colorimetric assay kit Annexinv-FITC double staining (E) and caspase3 level (F) in supernatant were used to assess cell apoptosis
*P < 0.05 means 30 mM + inhibitors group vs. 30 mM + miR-Con group. **P < 0.001 means high glucose group (30 mM) vs. normal glucose group (5 mM).
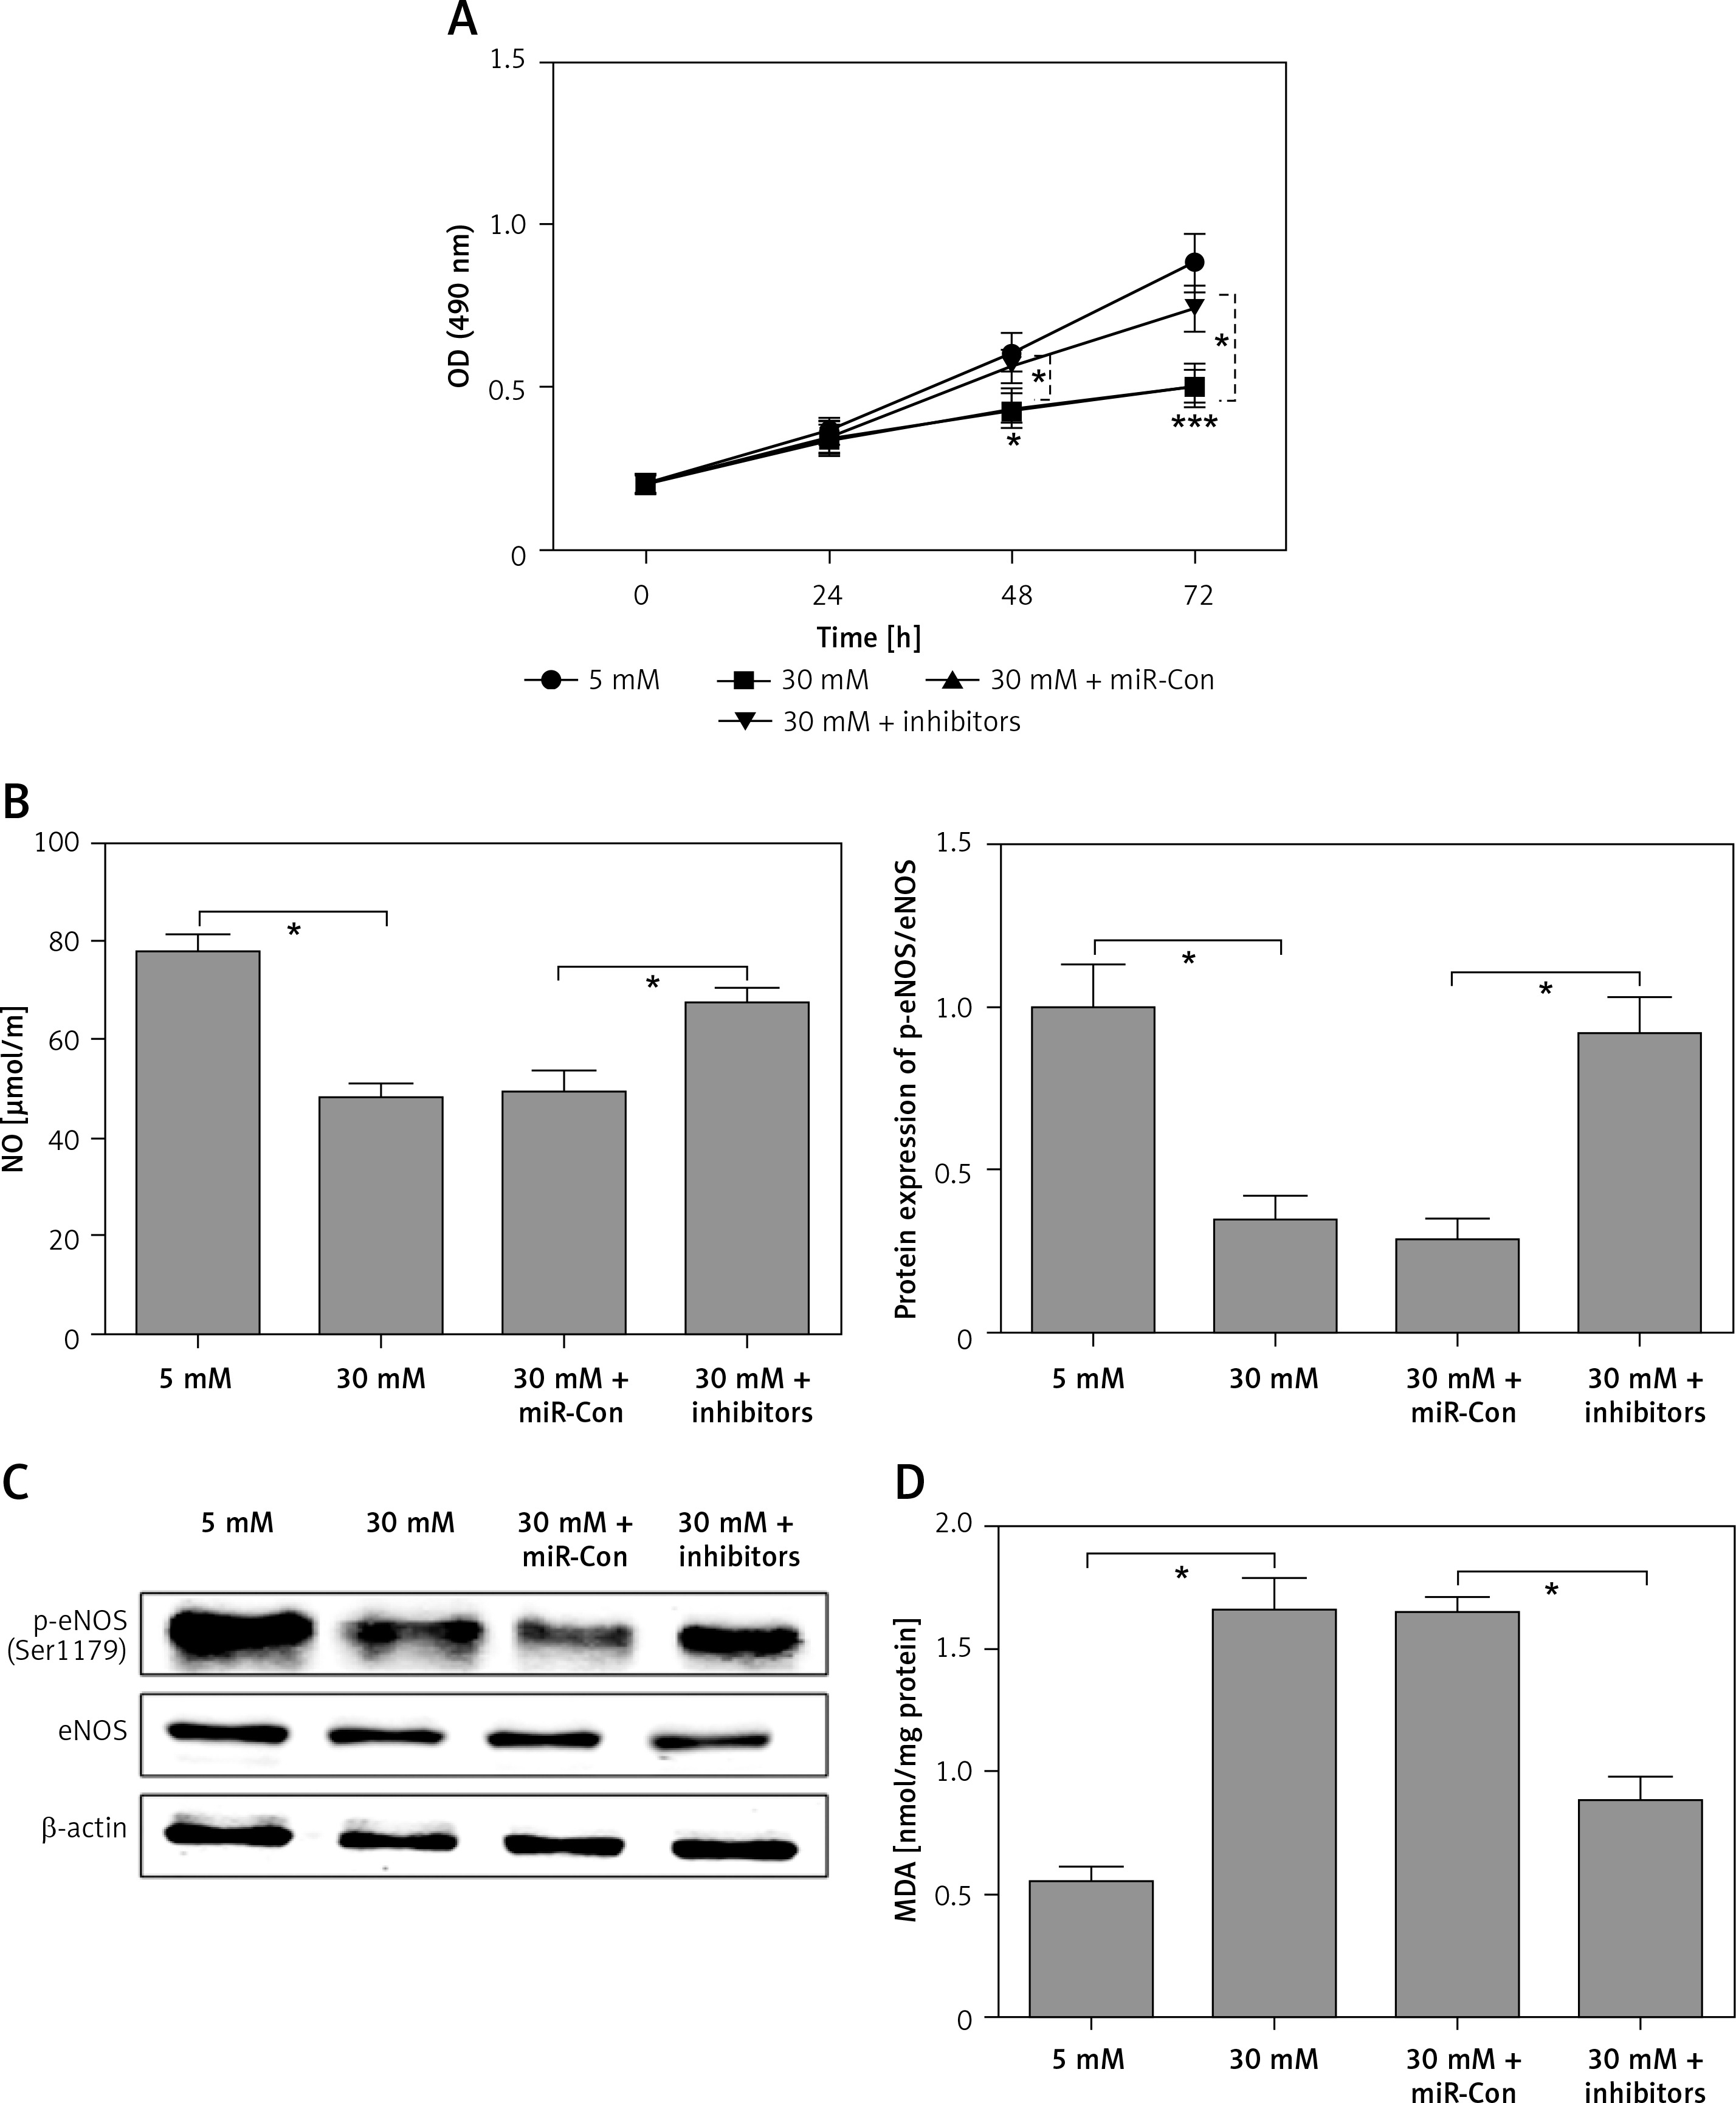
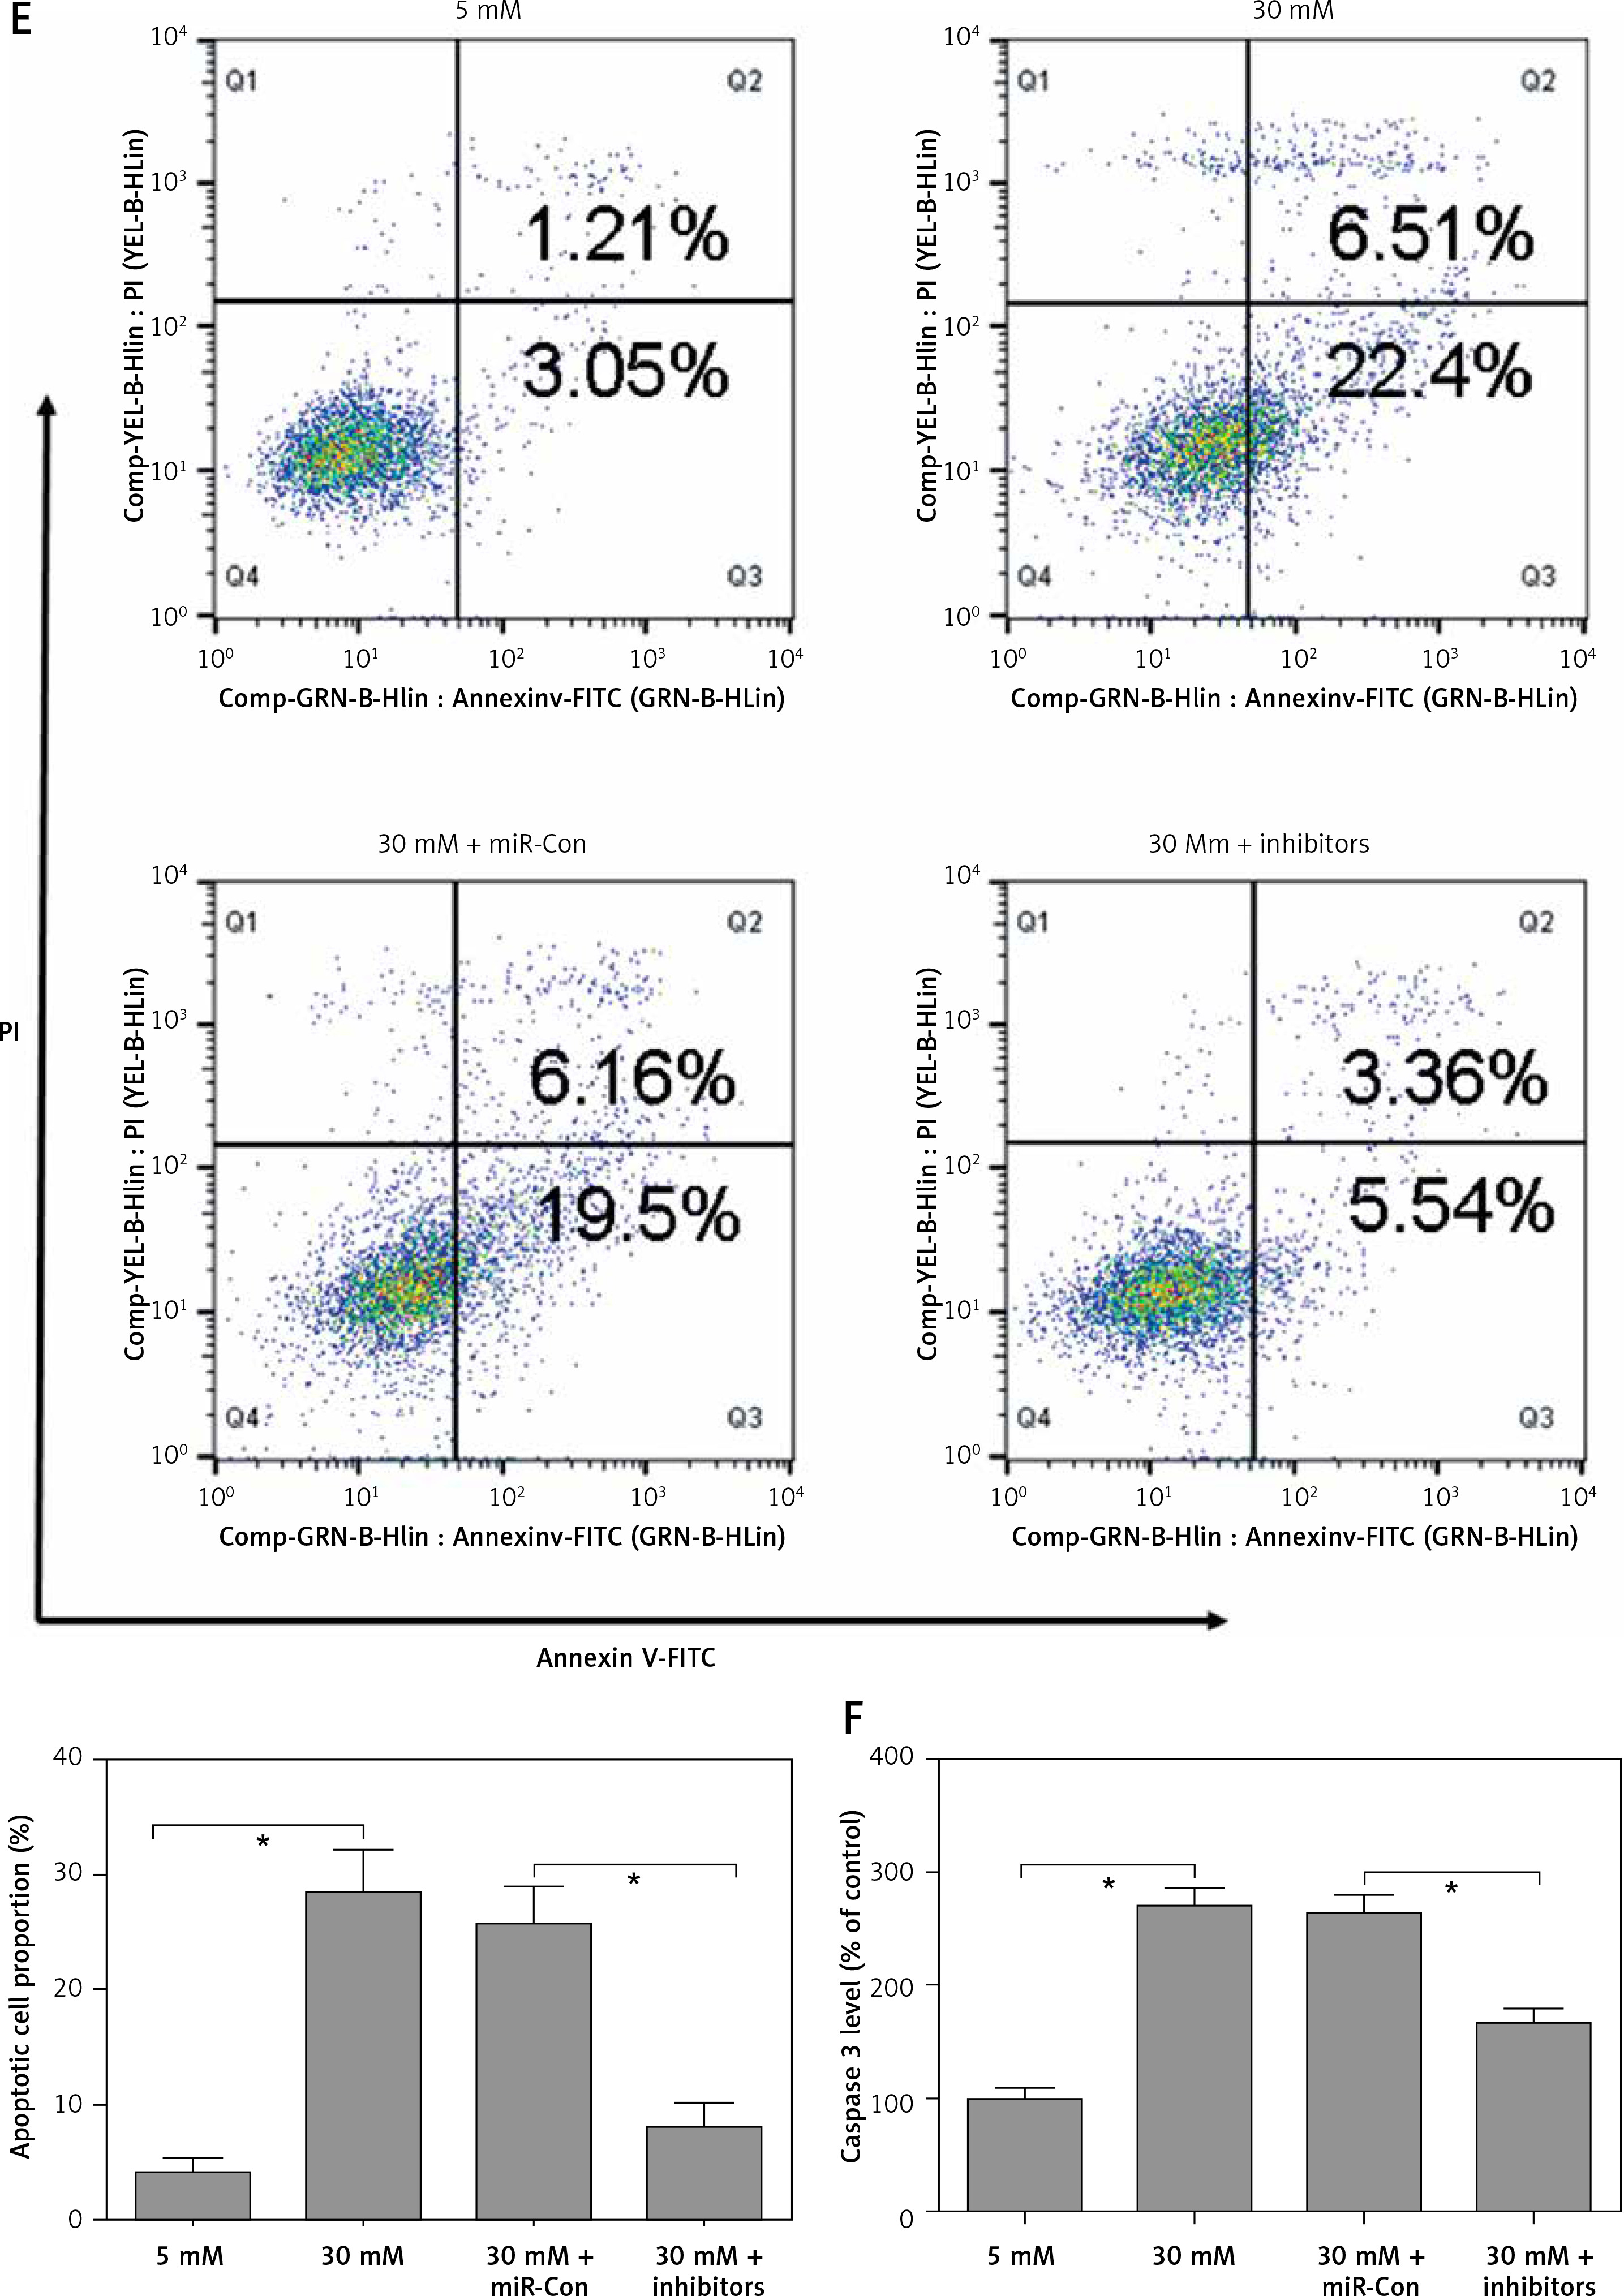
Figure 3
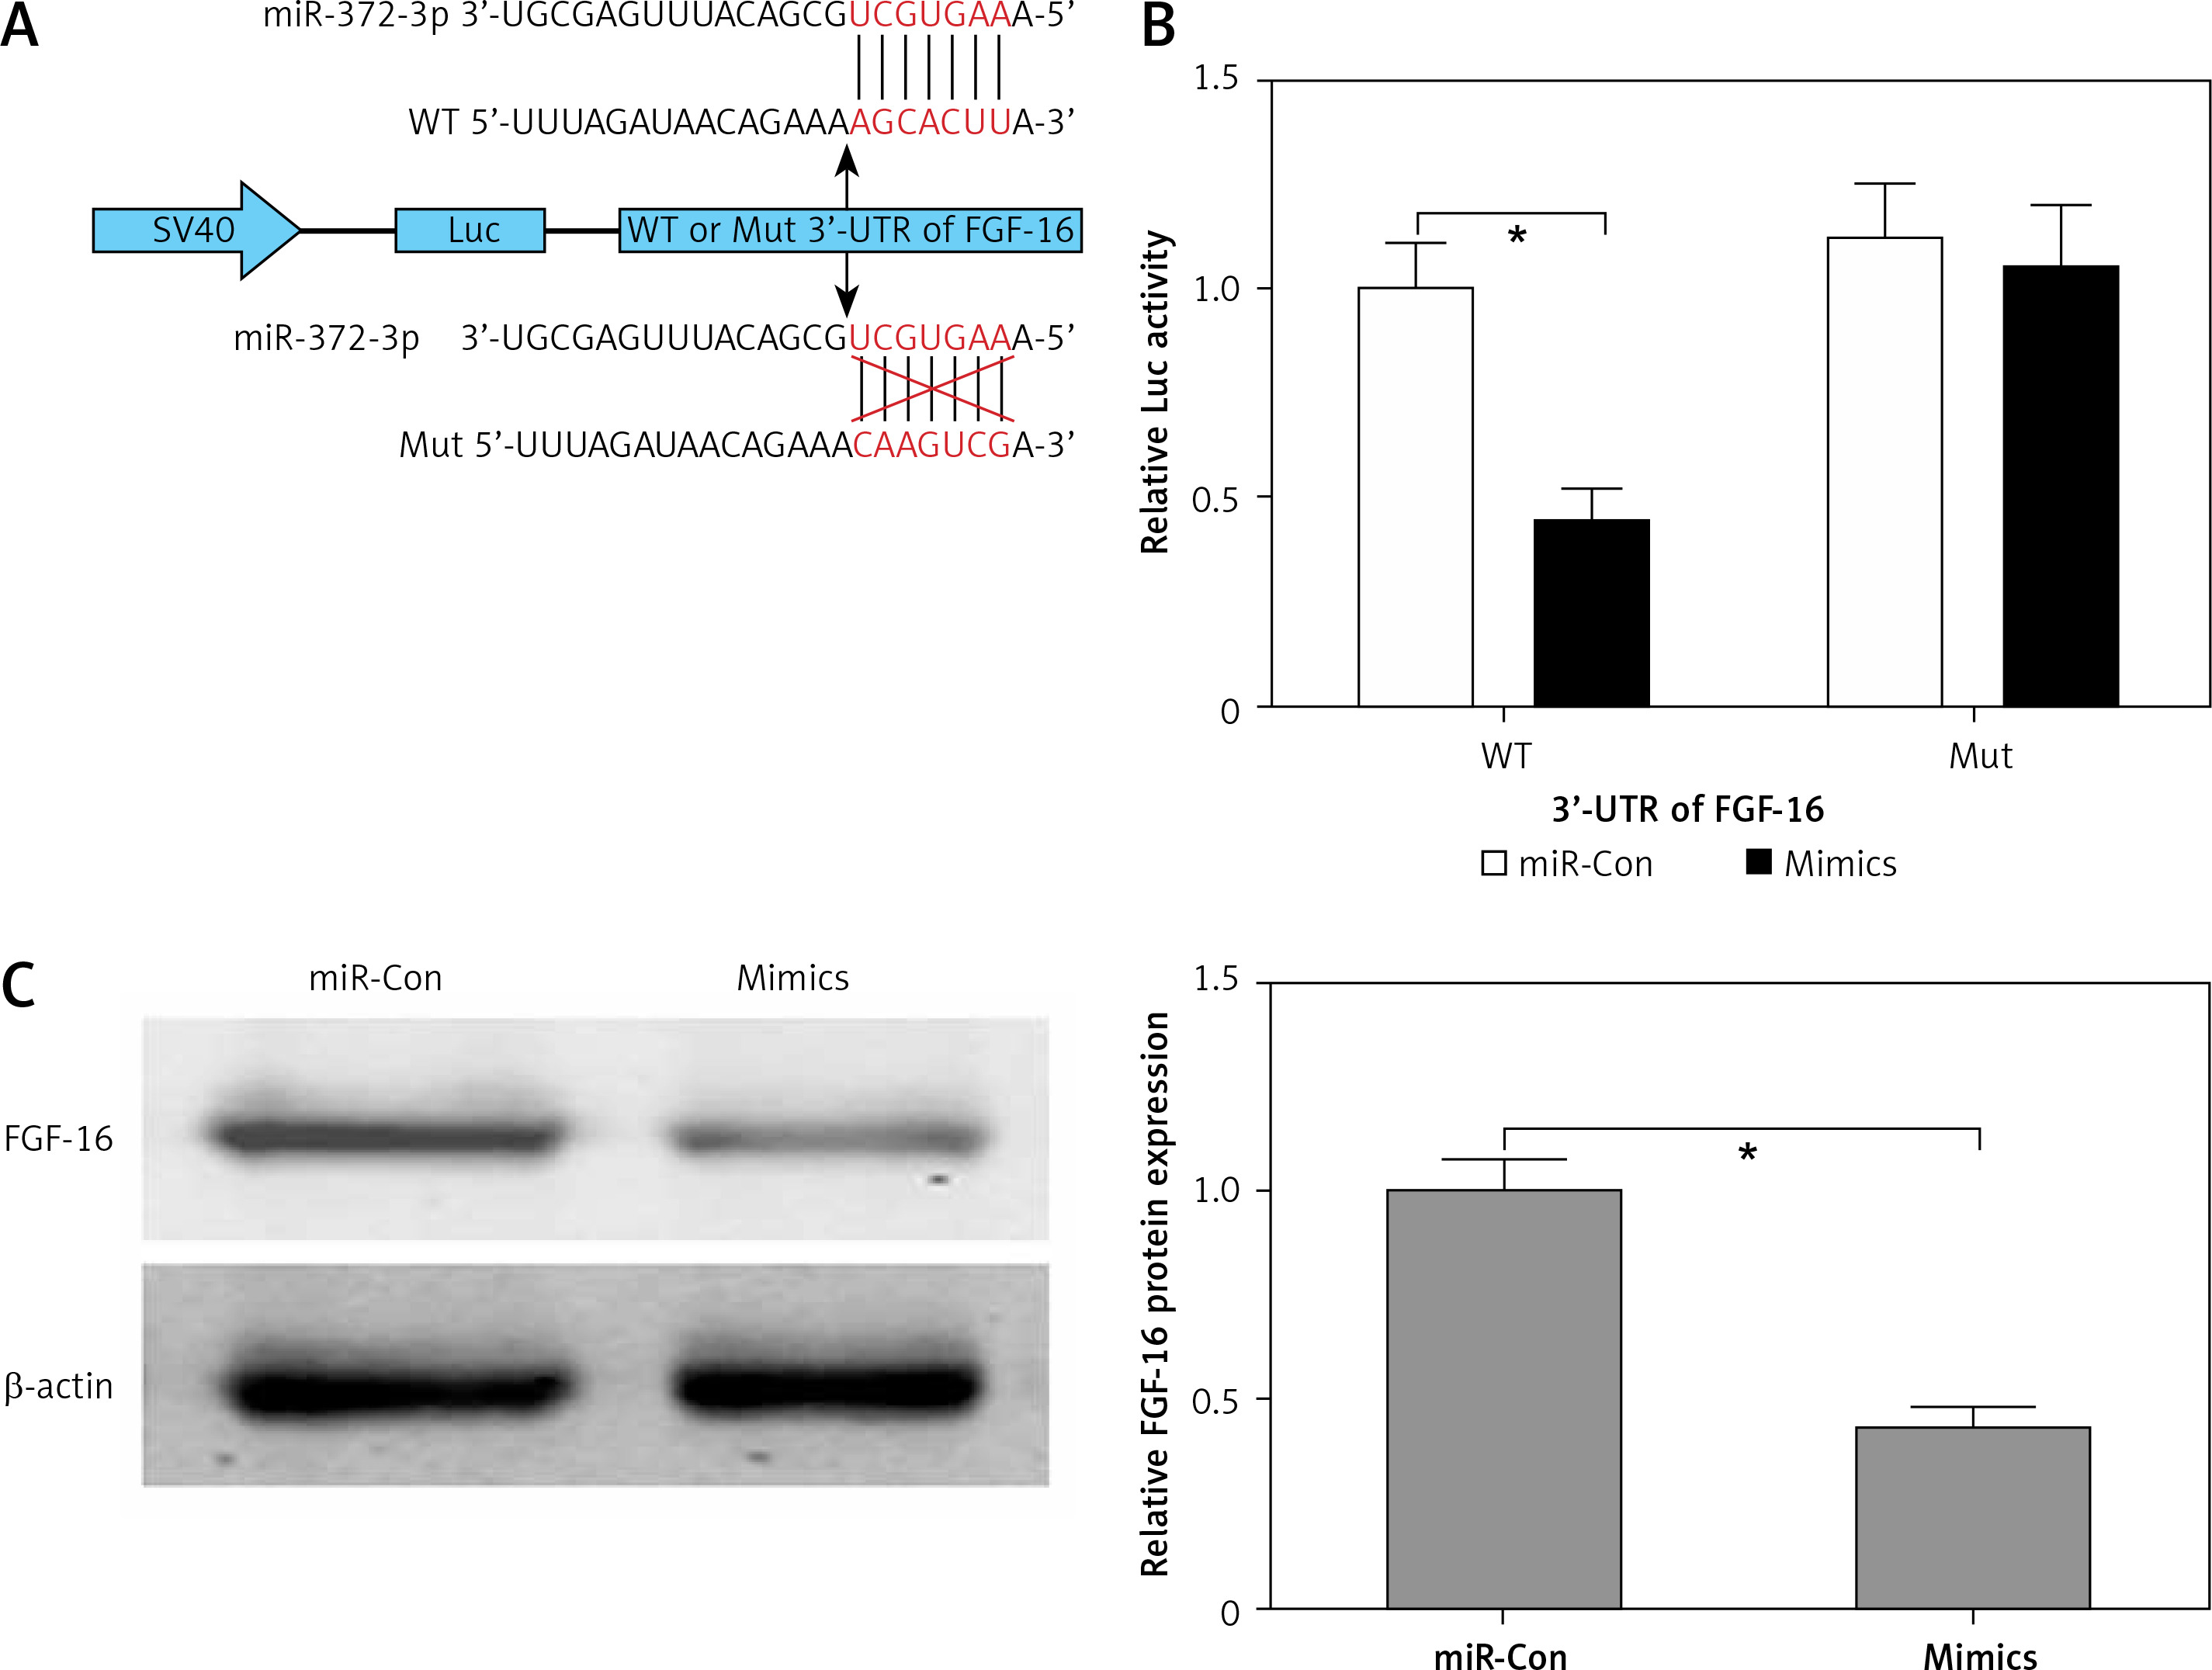
FGF-16 was a direct target of miR-372-3p. A – A conserved complementary pairing sequence between the 3’-UTR of FGF-16 and miR-372-3p was predicted using bioinformatics algorithm. B – Luciferase reporter gene assay. C – After transfection with miR-372-3p mimics or miR-Con into glomerular endothelial cells, FGF-16 protein expression was measured using western blotting
*P < 0.05.
FGF-16 is a direct target of miR-372-3p
The bioinformatics algorithm revealed that a conserved complementary pairing sequence was observed between the 3’-UTR of FGF-16 and miR-372-3p (Figure 3 A). Luciferase activity assay indicted that transfection with miR-372-3p mimics into glomerular endothelial cells containing the WT 3’-UTR of FGF-16 led to a significant decrease in luciferase activity, suggesting that miR-372-3p could directly bind to the 3’-UTR of FGF-16 (Figure 3 B). Subsequently, the protein expression of FGF-16 was dramatically reduced in glomerular endothelial cells transfected with miR-372-3p mimics compared with these cells transfected with miR-Con (Figure 3 C). These results demonstrated that miR-372-3p could regulate FGF-16 protein expression via post-transcriptional repression.
Overexpression of FGF-16 alleviates high glucose-induced glomerular endothelial cell dysfunction
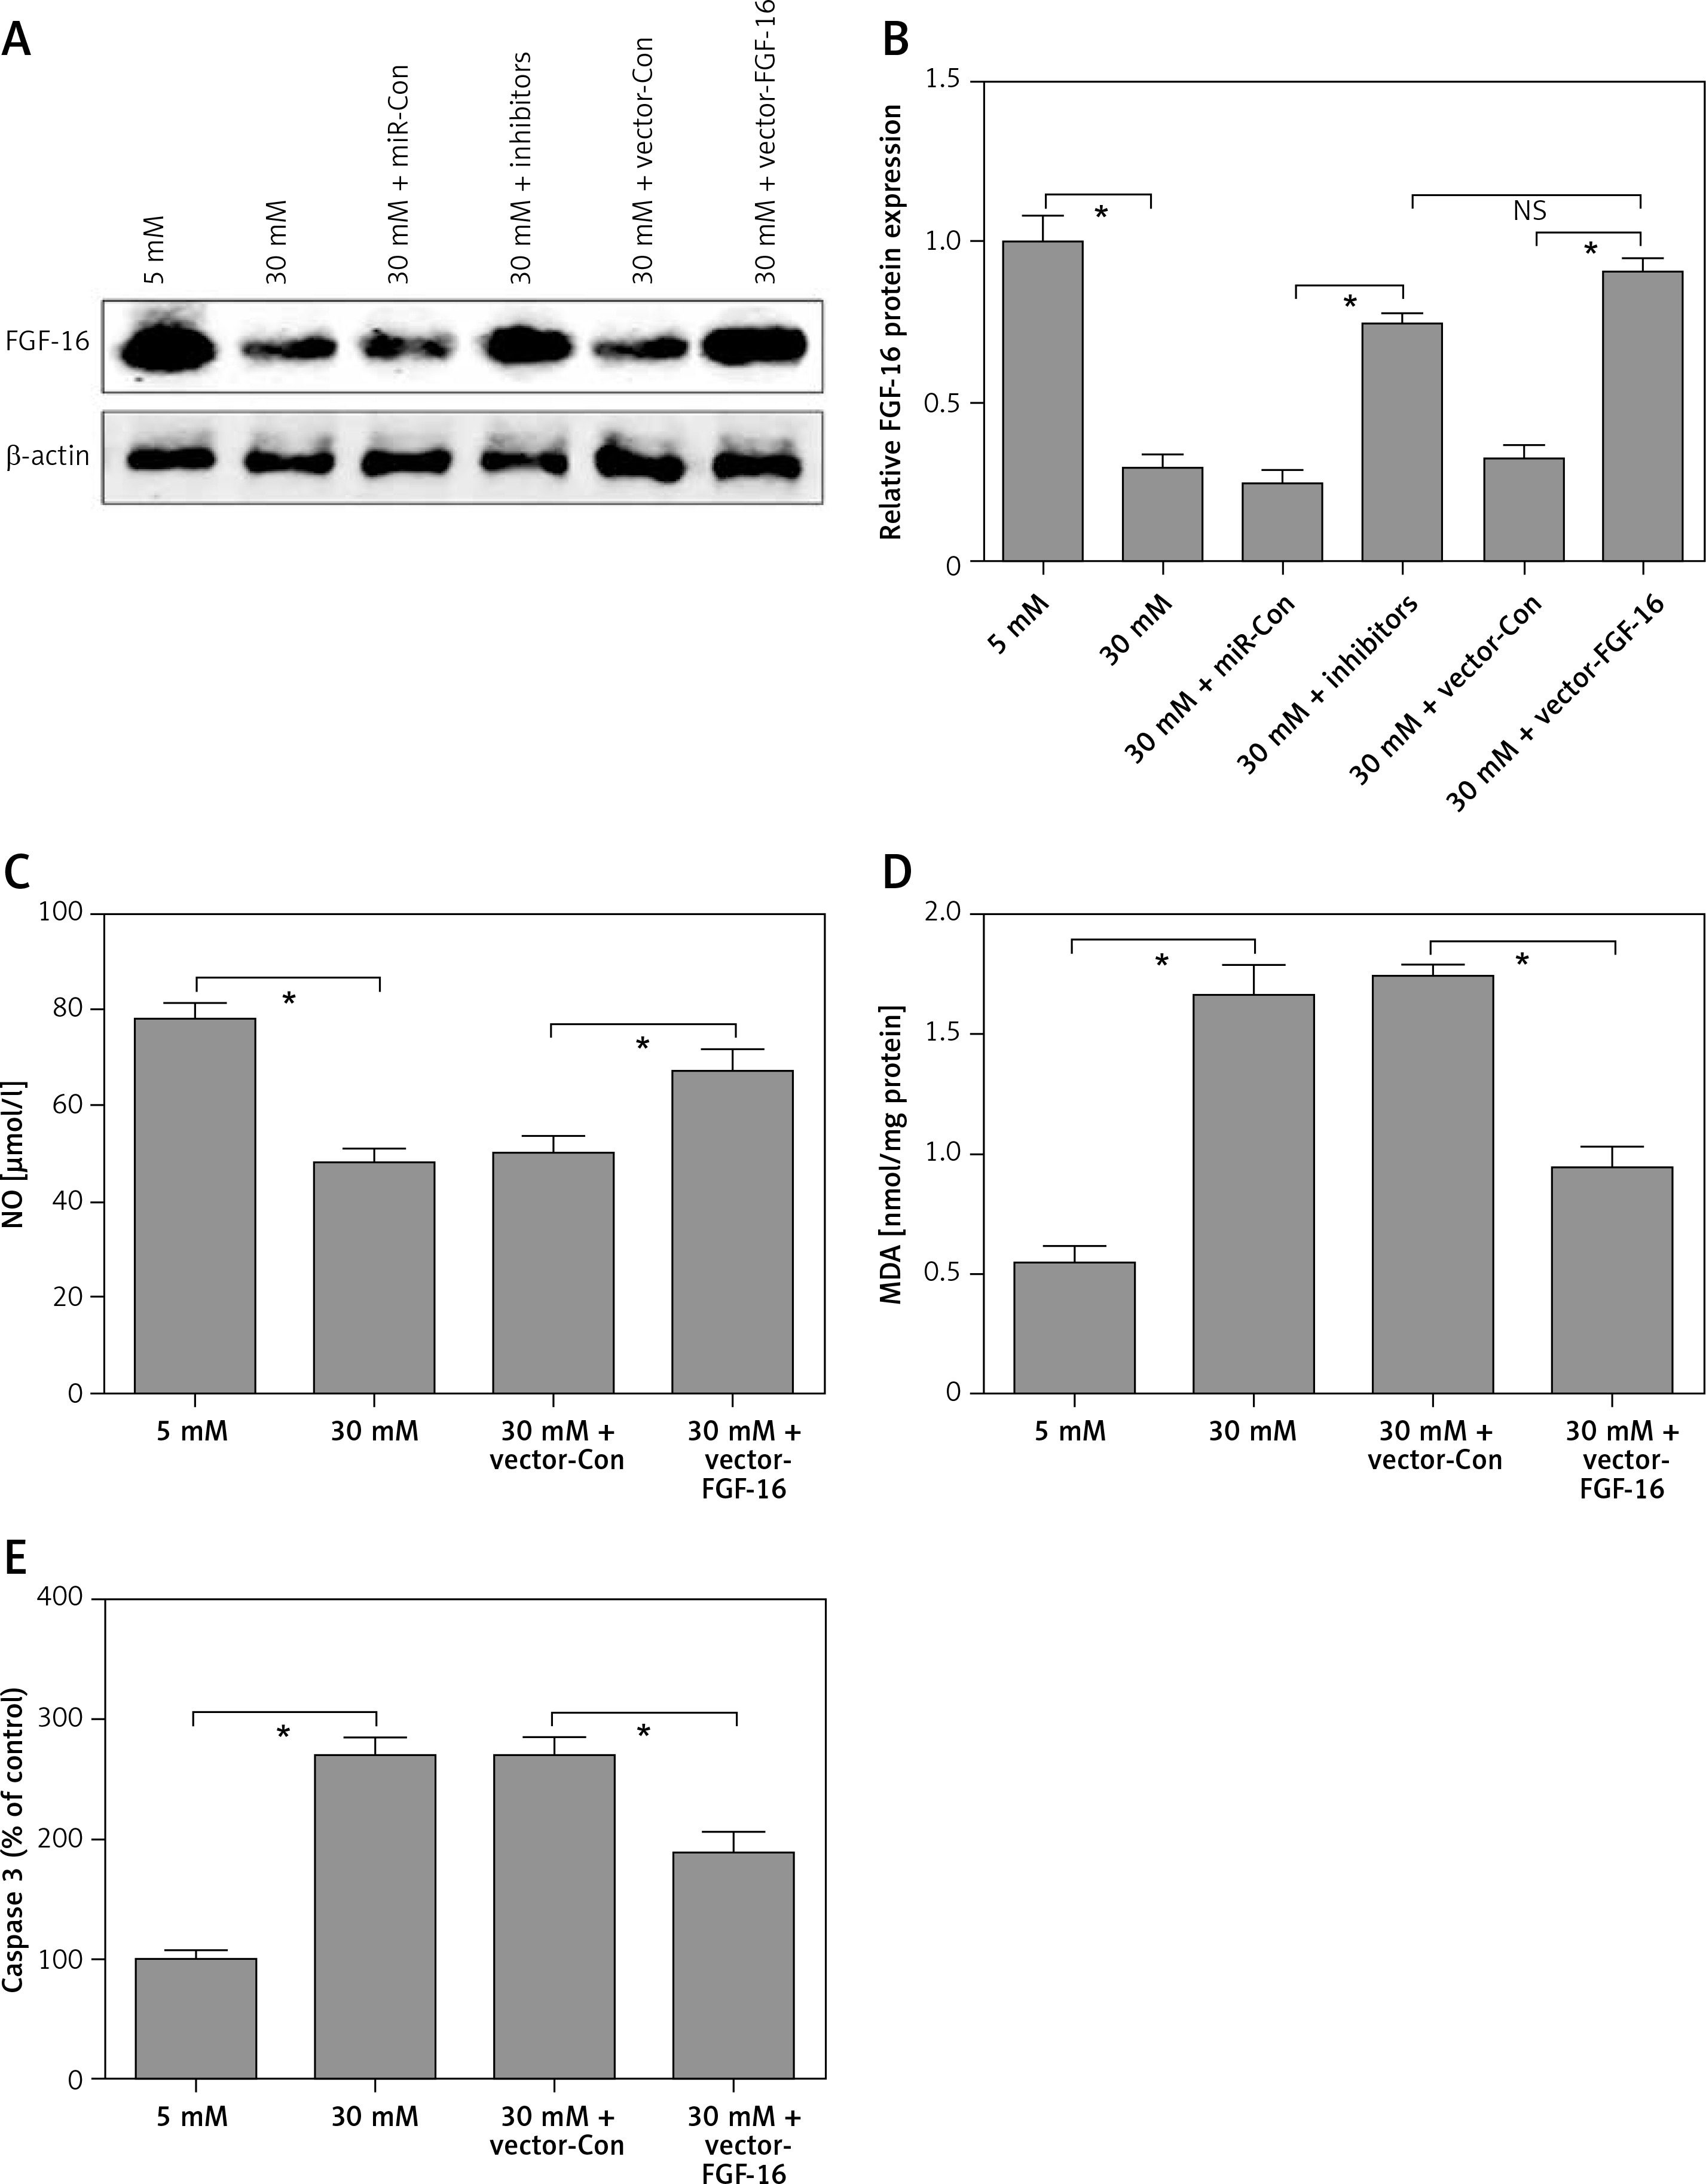
To further investigate the roles of FGF-16 in the process of high glucose-induced glomerular endothelial cell damage, we measured the effect of high glucose or miR-372-3p inhibitors on FGF-16 protein expression. High glucose stimulation significantly decreased the protein expression of FGF-16 in glomerular endothelial cells, while knockdown of miR-372-3p abolished the high glucose-induced inhibition of FGF-16 protein expression (Figures 4 A, B). We also found that transfection with FGF-16 overexpressed vectors into glomerular endothelial cells rescued the high glucose-induced reduction of FGF-16 protein expression (Figures 4 A, B). Transfection with FGF-16 overexpressed vectors or miR-372-3p inhibitors into high glucose-exposed glomerular endothelial cells possessed an equal effectiveness to improve FGF-16 protein expression (Figures 4 A, B). In addition, high glucose-triggered reduction of NO production (Figure 4 C), an increase in MDA (Figure 4 D), caspase 3 level (Figure 4 E) and apoptotic cell proportion (Figure 4 F) were abrogated by transfection with overexpressed FGF-16 plasmids into glomerular endothelial cells. These findings showed that overexpression of FGF-16 might protect against high glucose-induced glomerular endothelial cell dysfunction.
Figure 4
Overexpression of FGF-16 alleviates high glucose-induced glomerular endothelial cells dysfunction. A, B – After transfection with miR-Con, miR-372-3p inhibitors, vector-Con or vector-FGF16 into glomerular endothelial cells in the presence of normal (5 mM) or high glucose (30 mM), FGF-16 protein expression was measured using western blotting. After transfection with vector-FGF-16 or vector-Con into glomerular endothelial cells in the presence of normal (5 mM) or high glucose (30 mM), NO (C) and MDA (D) production in cellular supernatant were detected using colorimetric assay kit; caspase 3 level in supernatant (E) and Annexin V-FITC double staining (F) were used to assess cell apoptosis
*P < 0.05. NS – not significant.

miR-372-3p is a potential diagnostic factor for DN
Compared with HC, the expression levels of miR-372-3p and miR-15a in plasma were significantly increased in T1DM (Figures 5 A, B) and T2DM (Figures 5 C, D) patients with DN. To explore whether miR-372-3p and miR-15a could serve as the diagnostic markers for DN, ROC with AUC was used to evaluate the diagnostic significance of miR-372-3p and miR-15a in DN. The ROC curve showed that the AUC of miR-372-3p and miR-15a was 0.805 (95% CI: 0.771–0.893) and 0.722 (95% CI: 0.625–0.819) for DN diagnosis in patients with T1DM, respectively (Table II, Figure 6 A). The sensitivity and specificity of miR-372-3p and miR-15a for DN diagnosis in patients with T1DM were 0.660 and 0.947, and 0.679 and 0.719, respectively (Table II and Figure 6 A). These results suggested that the diagnostic significance of miR-372-3p might be superior to miR-15a for DN diagnosis in patients with T1DM. In addition, ROC analysis was performed in the combination of miR-372-3p and miR-15a for DN diagnosis in patients with T1DM. The AUC of miR-372-3p combined with miR-15a was 0.865 (95% CI: 0.793–0.936), with sensitivity of 0.679 and specificity of 0.947 (Table II, Figure 6 A). These findings suggested that the diagnostic significance of the miR-372-3p combined with miR-15a might be better than miR-372-3p or miR-15a for DN diagnosis alone.
Table II
Performance of miR-372-3p and miR-15a in the differential diagnosis of DN from HC
Figure 5
miR-372-3p and miR-15a were up-regulated in plasma of T1DM or T2DM patients. miR-372-3p and miR-15a expression levels in plasma were measured using RT-qPCR in T1DM (A, B) and T2DM (C, D) patients
*P < 0.05.
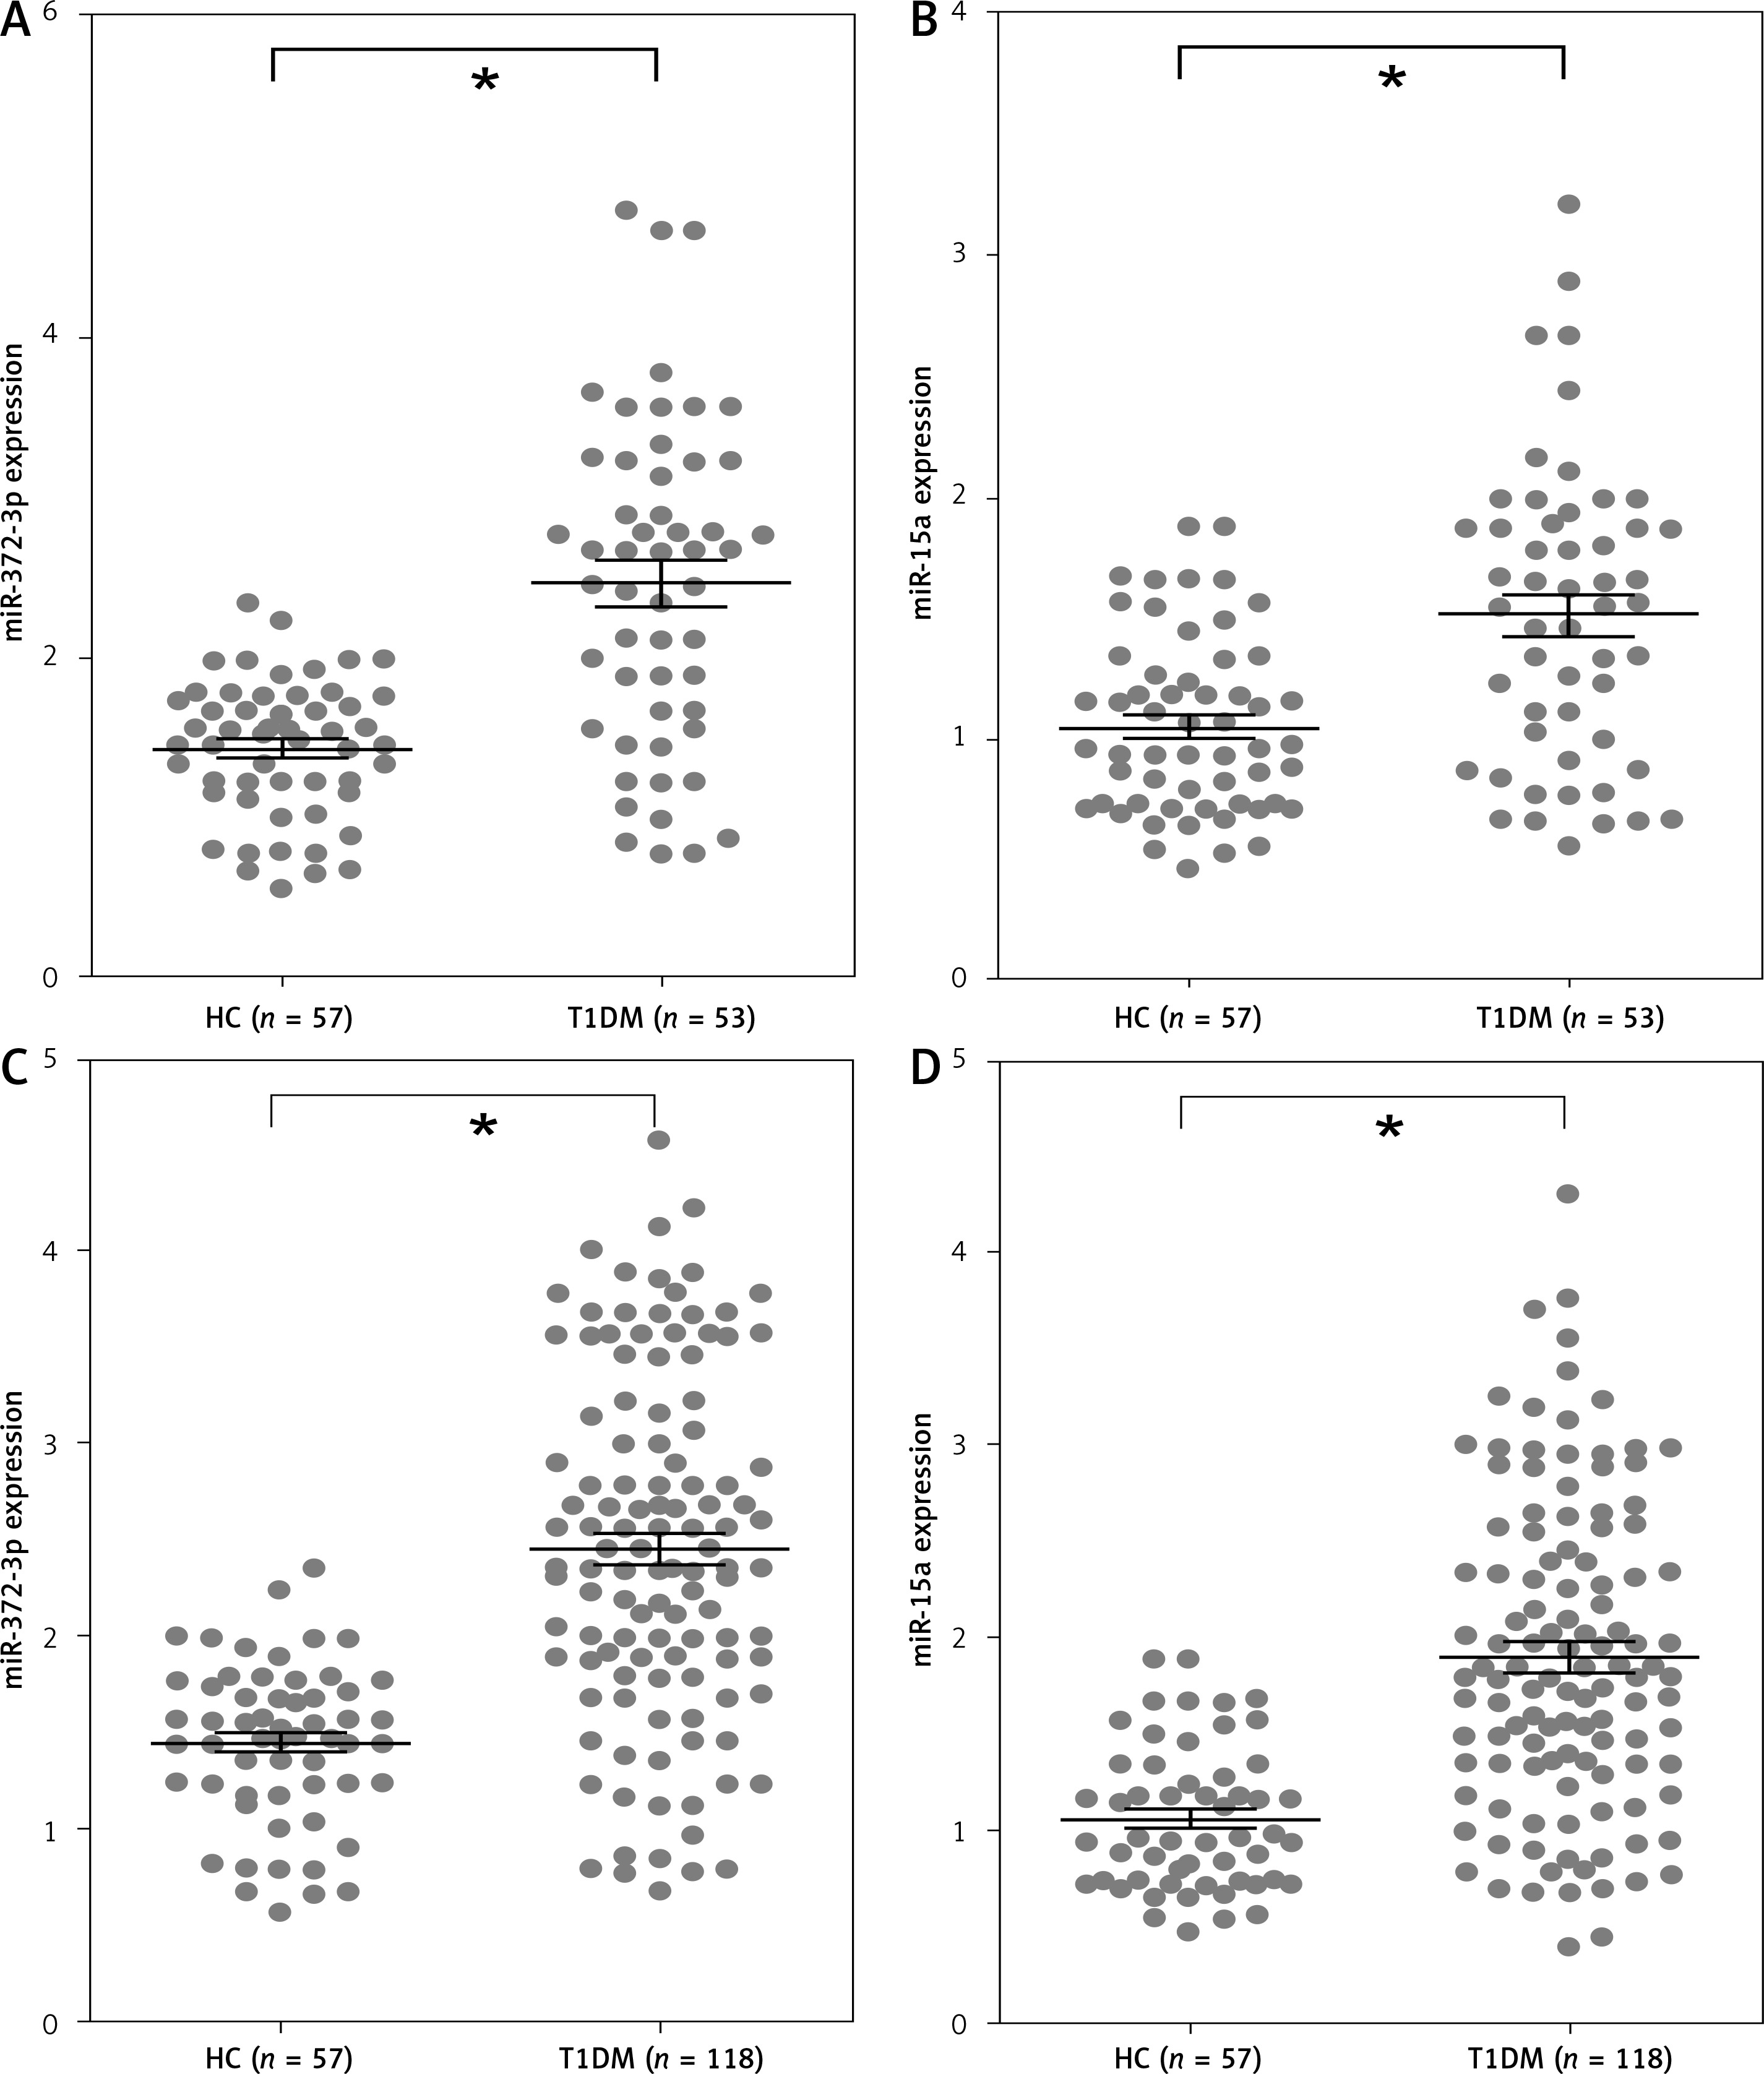
Figure 6
miR-372-3p is a potential diagnostic factor for DN. Receiver operating characteristics (ROC) curves were drawn with the data of plasma miR-372-3p and miR-15a levels from 57 healthy controls and 53 patients with T1DM (A), as well as 57 healthy controls and 118 patients with T2DM (B). Using binary logistic regression analysis, the ROC curves were drawn with the data of plasma miR-372-3p combined with miR-15a for DN diagnosis
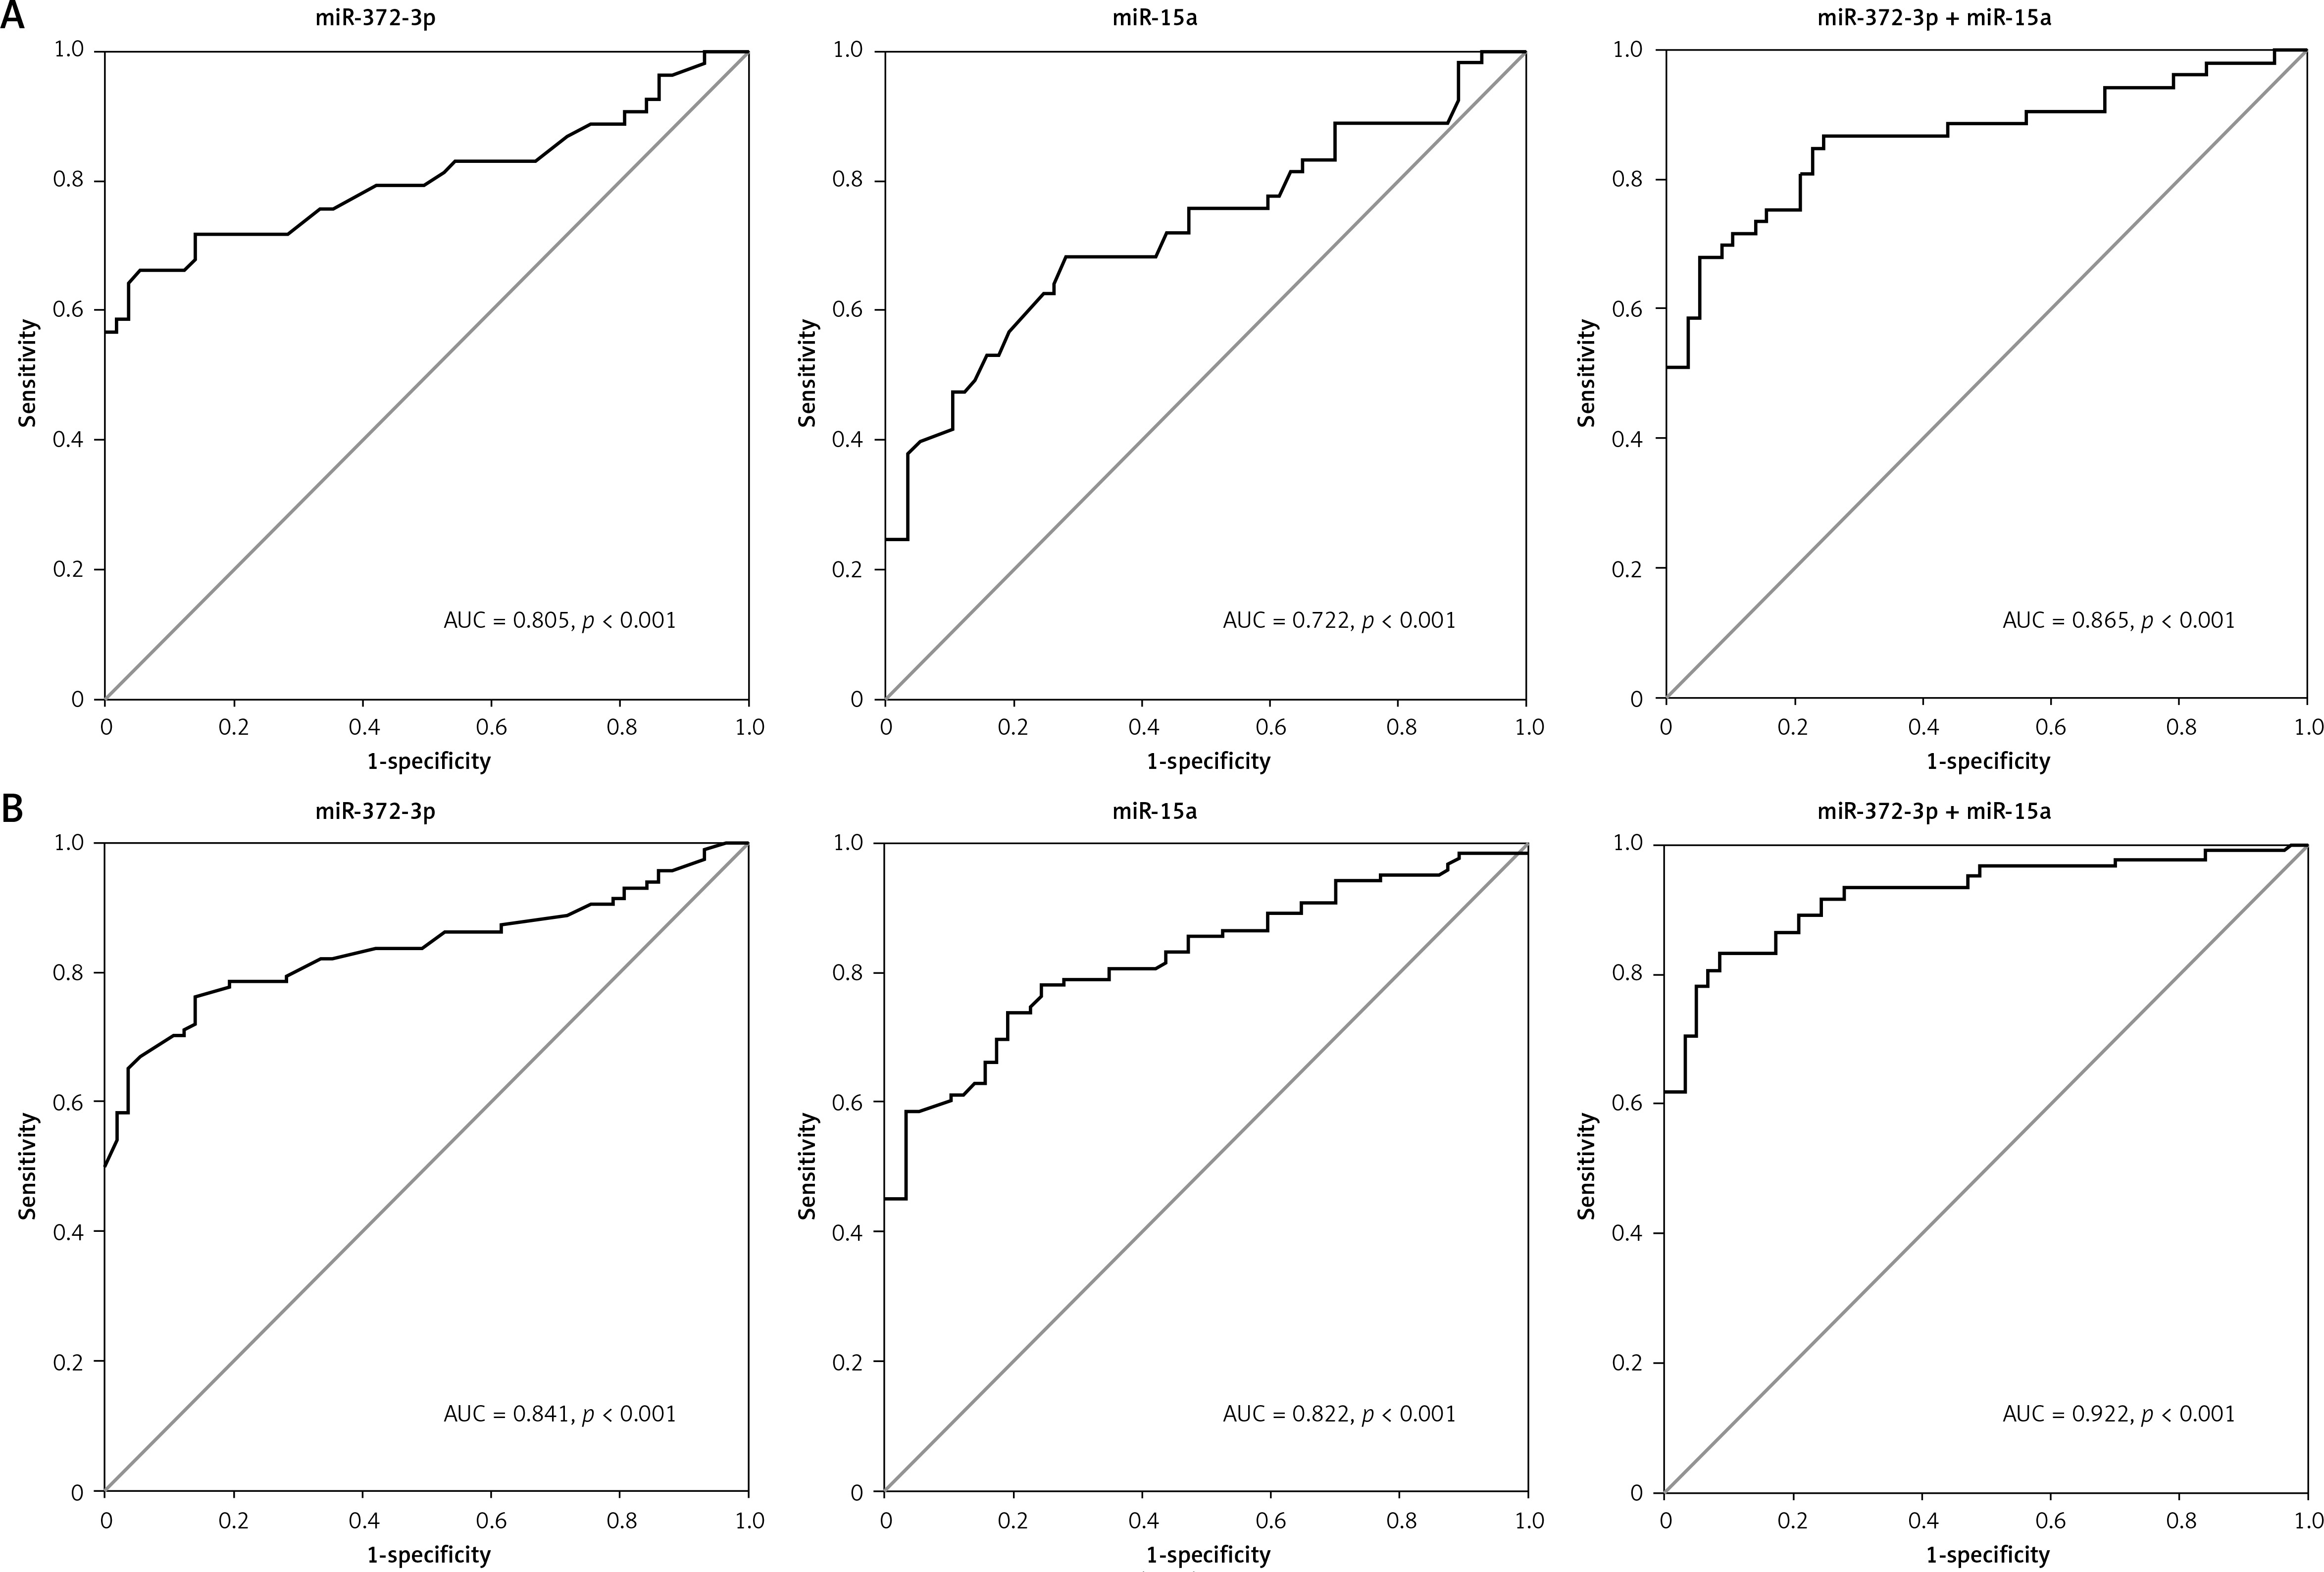
We also found that miR-372-3p combined with miR-15a for DN diagnosis in patients with T2DM showed a good sensitivity (0.831) and specificity (0.912) with a high AUC value (0.922 with 95% CI: 0.883–0.961). These results also indicated that the diagnostic significance of miR-372-3p might be superior to miR-15a for DN diagnosis in patients with T2DM, while miR-372-3p combined with miR-15a possessed a higher clinical value in the diagnosis of DN in patients with T2DM (Table II and Figure 6 B).
Discussion
In our study, we carried out a miR microarray for exploring the underlying molecular mechanisms of high glucose-induced glomerular endothelial cell damage. Our results demonstrated that miR-372-3p expression level was elevated in high glucose-stimulated glomerular endothelial cells and might be closely related to high glucose-induced glomerular endothelial cell dysfunction, reflecting that it induced cell growth inhibition and apoptosis, inhibited eNOS/NO system activity and promoted MDA production. Also, we observed that FGF-16 as a direct target of miR-372-3p could be post-transcriptionally repressed by miR-372-3p and performed cytoprotection in high glucose-induced glomerular endothelial cell injuries. We also revealed that miR-372-3p and miR-15a were sensitive and specific markers for the diagnosis of DN patients with T1DM or T2DM. More importantly, combination of miR-372-3p and miR-15a showed a higher positive diagnostic rate for distinguishing T1DM or T2DM patients with DN from healthy subjects. These results corroborated the view that miR-372-3p might possess important pathogenetic and diagnostic implications for DN.
Recently, miRs have been authenticated as key mediators in the pathogenesis of DN, suggesting that circulating miRs may serve as potential markers for evaluating DN progression [9]. Circulating and urinary miRs are identified as promising noninvasive biomarkers for DN diagnosis, which contributes to the stability and detectability of miRs in body fluids and exosomes [27]. Several studies have revealed that serum, plasma and urinary miRs, including urinary exosome-derived miRs, can be developed as biomarkers for DN screening [13–15, 28, 29]. For instance, plasma miR-21-5p, miR-29a-3p and miR-126-3p are deregulated in the progression of DN [30, 31]. Murray et al. highlight that serum miR-372-3p is significantly elevated in pediatric patients with extracranial malignant germ-cell tumors (GCTs) compared with healthy volunteers, and miR-372-3p (AUC = 1.00; p = 0.001) enables sensitive diagnosis of pediatric extracranial malignant GCTs [32, 33]. miR-15a has been identified as a potential diagnostic biomarker for stroke (specificity = 98.7%) [34]. Wang et al. document miR-15a as a biomarker to distinguish sepsis from systemic inflammatory response syndrome in human subjects (AUC = 0.858, 95% CI: 0.800–0.916, sensitivity = 68.3%, specificity = 94.4%) [35]. In the present study, miR-372-3p and miR-15a were significantly up-regulated in the plasma of T1DM and T2DM patients with DN compared with HC. ROC analysis revealed that the diagnostic value of miR-372-3p, miR-15a or miR-372-3p combined with miR-15a in T2DM patients (AUC = 0.841, p < 0.001; AUC = 0.822, p < 0.001 or AUC = 0.922, p < 0.001) with DN was better than that in T1DN patients (AUC = 0.805, p < 0.001; AUC = 0.722, p < 0.001 or AUC = 0.865, p < 0.001) with DN.
miR-372-3p has been reported as a serum biomarker for cancer diagnosis and as an oncogene promoting cancer cell proliferation and invasion [36, 37]. However, its precise function in high glucose-induced glomerular endothelial cell dysfunction remains unclear. In our study, the increased miR-372-3p expression in glomerular endothelial cells might be due to the high glucose stimulation. Experimental measurements demonstrated that knockdown of miR-372-3p in glomerular endothelial cells impeded the development of high glucose-induced endothelial disorders. Importantly, a target gene, FGF-16, of miR-372-3p was associated with high glucose-induced glomerular endothelial cell dysfunction. In agreement with cytoprotection of miR-372-3p loss-of-function in glomerular endothelial cells, overexpressed FGF-16 showed the ability to attenuate high glucose-induced cell injuries. These results suggested that miR-372-3p/FGF-16 might play a key role in maintaining endothelial homeostasis.
FGF-16 is predominantly expressed in the heart and plays a crucial role in postnatal cardiac development [38]. FGF-16 has been described as being inhibited in the pathological processes of cardiotoxicity [39]. Moreover, FGF-16 as a growth factor exhibits significant mitogenic activity for primary embryonic brown adipocytes [40]. FGF-16 has also been reported to promote endothelial cell migration, while it fails to induce endothelial cell proliferation [41]. We observed that exposure of glomerular endothelial cells in high glucose resulted in a decrease in FGF-16 protein expression, suggesting that downregulation of FGF-16 might predispose to high glucose-induced glomerular endothelial cell injuries due to its protective effects in endothelial homeostasis.
In conclusion, our results suggest that miR-372-3p might be considered as a potential glucose responsive miRNA participating in high glucose-induced glomerular endothelial cell dysfunction and as a potential diagnostic biomarker for DN screening.