Introduction
Osteoporosis (OP) is a chronic systemic disease characterized by a decrease in bone density and mass, increasing the risk of fractures and significantly impacting patients’ quality of life while also elevating the socioeconomic burden [1]. The number of individuals at high risk for osteoporotic fractures is rising worldwide, with over 9 million people experiencing osteoporotic fractures each year [2]. Although previous studies have investigated various aspects of the pathogenesis of OP, such as environmental factors, immune responses, nutritional status, medications, and epigenetic changes [3], the underlying mechanism is not fully understood. Therefore, further research on the genetic mechanisms is necessary to deepen our understanding of the pathogenesis of OP.
Bone is a tissue that undergoes constant remodeling, involving both formation and destruction. This process is tightly regulated and can be disrupted by various factors, including hormonal changes. Furthermore, inflammation disrupts bone metabolism and promotes bone resorption. An increasing body of research on bone remodeling processes suggests that IR plays a significant role in the development of OP [4]. Inflammation is characterized by the overproduction of cytokines such as tumor necrosis factor (TNF), IL-1, IL-6, and IL-17. The overexpression of these cytokines during inflammation leads to excessive bone resorption, primarily through the overactivation of osteoclasts. Additionally, certain cytokines can impair osteoblast function. In inflammatory conditions, bone resorption is enhanced by the activation of inflammatory cells and mediators, leading to compromised balance in bone remodeling [5]. This condition may also adversely affect the skeletal system, leading to OP, fractures, and other bone-related diseases. In concrete terms, activated T cells specifically secrete a significant amount of the osteoclastogenic factor, which is encoded by the threonine synthase-like 2 gene homolog [6]. This factor is released and directly stimulates the formation of osteoclasts, resulting in bone resorption and damage, ultimately accelerating the progression of OP. Amarasekara et al. found that the IR gene regulates the metabolism of osteocyte populations [7]. Zhang et al. discovered that inhibiting inflammatory pathways can increase bone mass by preventing osteoclast-mediated bone resorption [8]. Moreover, numerous studies have shown that IR-related genes, such as IL-10 and nucleotide-binding oligomerization domain 2 (NOD2), are related to OP [9, 10]. IR is a complex physiologic process that involves multiple cytokine responses and gene expression. Although the promotion of OP by IR has been extensively studied, the specific mechanism remains unclear, necessitating further research.
Mendelian randomization (MR) is a powerful method for determining causal relationships between exposures and outcomes, using genetic variation as IVs [11]. This methodology is notably accurate and dependable, as it effectively mitigates the influence of confounding factors and minimizes the risks of reverse causation [12]. However, the intricate structure of linkage disequilibrium (LD) within the genome may lead to closely related variants that are not necessarily causally associated [13]. Furthermore, these genetic variants have the potential to influence DNA methylation (DNAm), gene expression, hormone levels, and the levels of inflammatory factors. Consequently, multi-omics integration has emerged as a promising approach in the post-GWAS era for identifying critical regulators and exploring therapeutic targets in OP. For instance, building on the MR analysis, the SMR method was introduced to enhance the inference of genetic associations between various molecular traits (such as gene expression, DNAm, or protein abundance) and relevant diseases [14]. Compared with traditional MR analyses, SMR, using the top cis-QTL as the exposure, can achieve greater statistical power when the exposure and outcome are derived from two independent samples with substantial sample sizes [14]. Up to now, limited MR studies have identified the potential genetic association between IR and OP. Therefore, this study aimed to explore the genetic relationship between IR proxied by IR-related genes and OP using multi-omics data (including eQTL data and mQTL data).
Material and methods
Ethical considerations
Data used in our study were publicly available, and further ethical approval was not required.
Study design
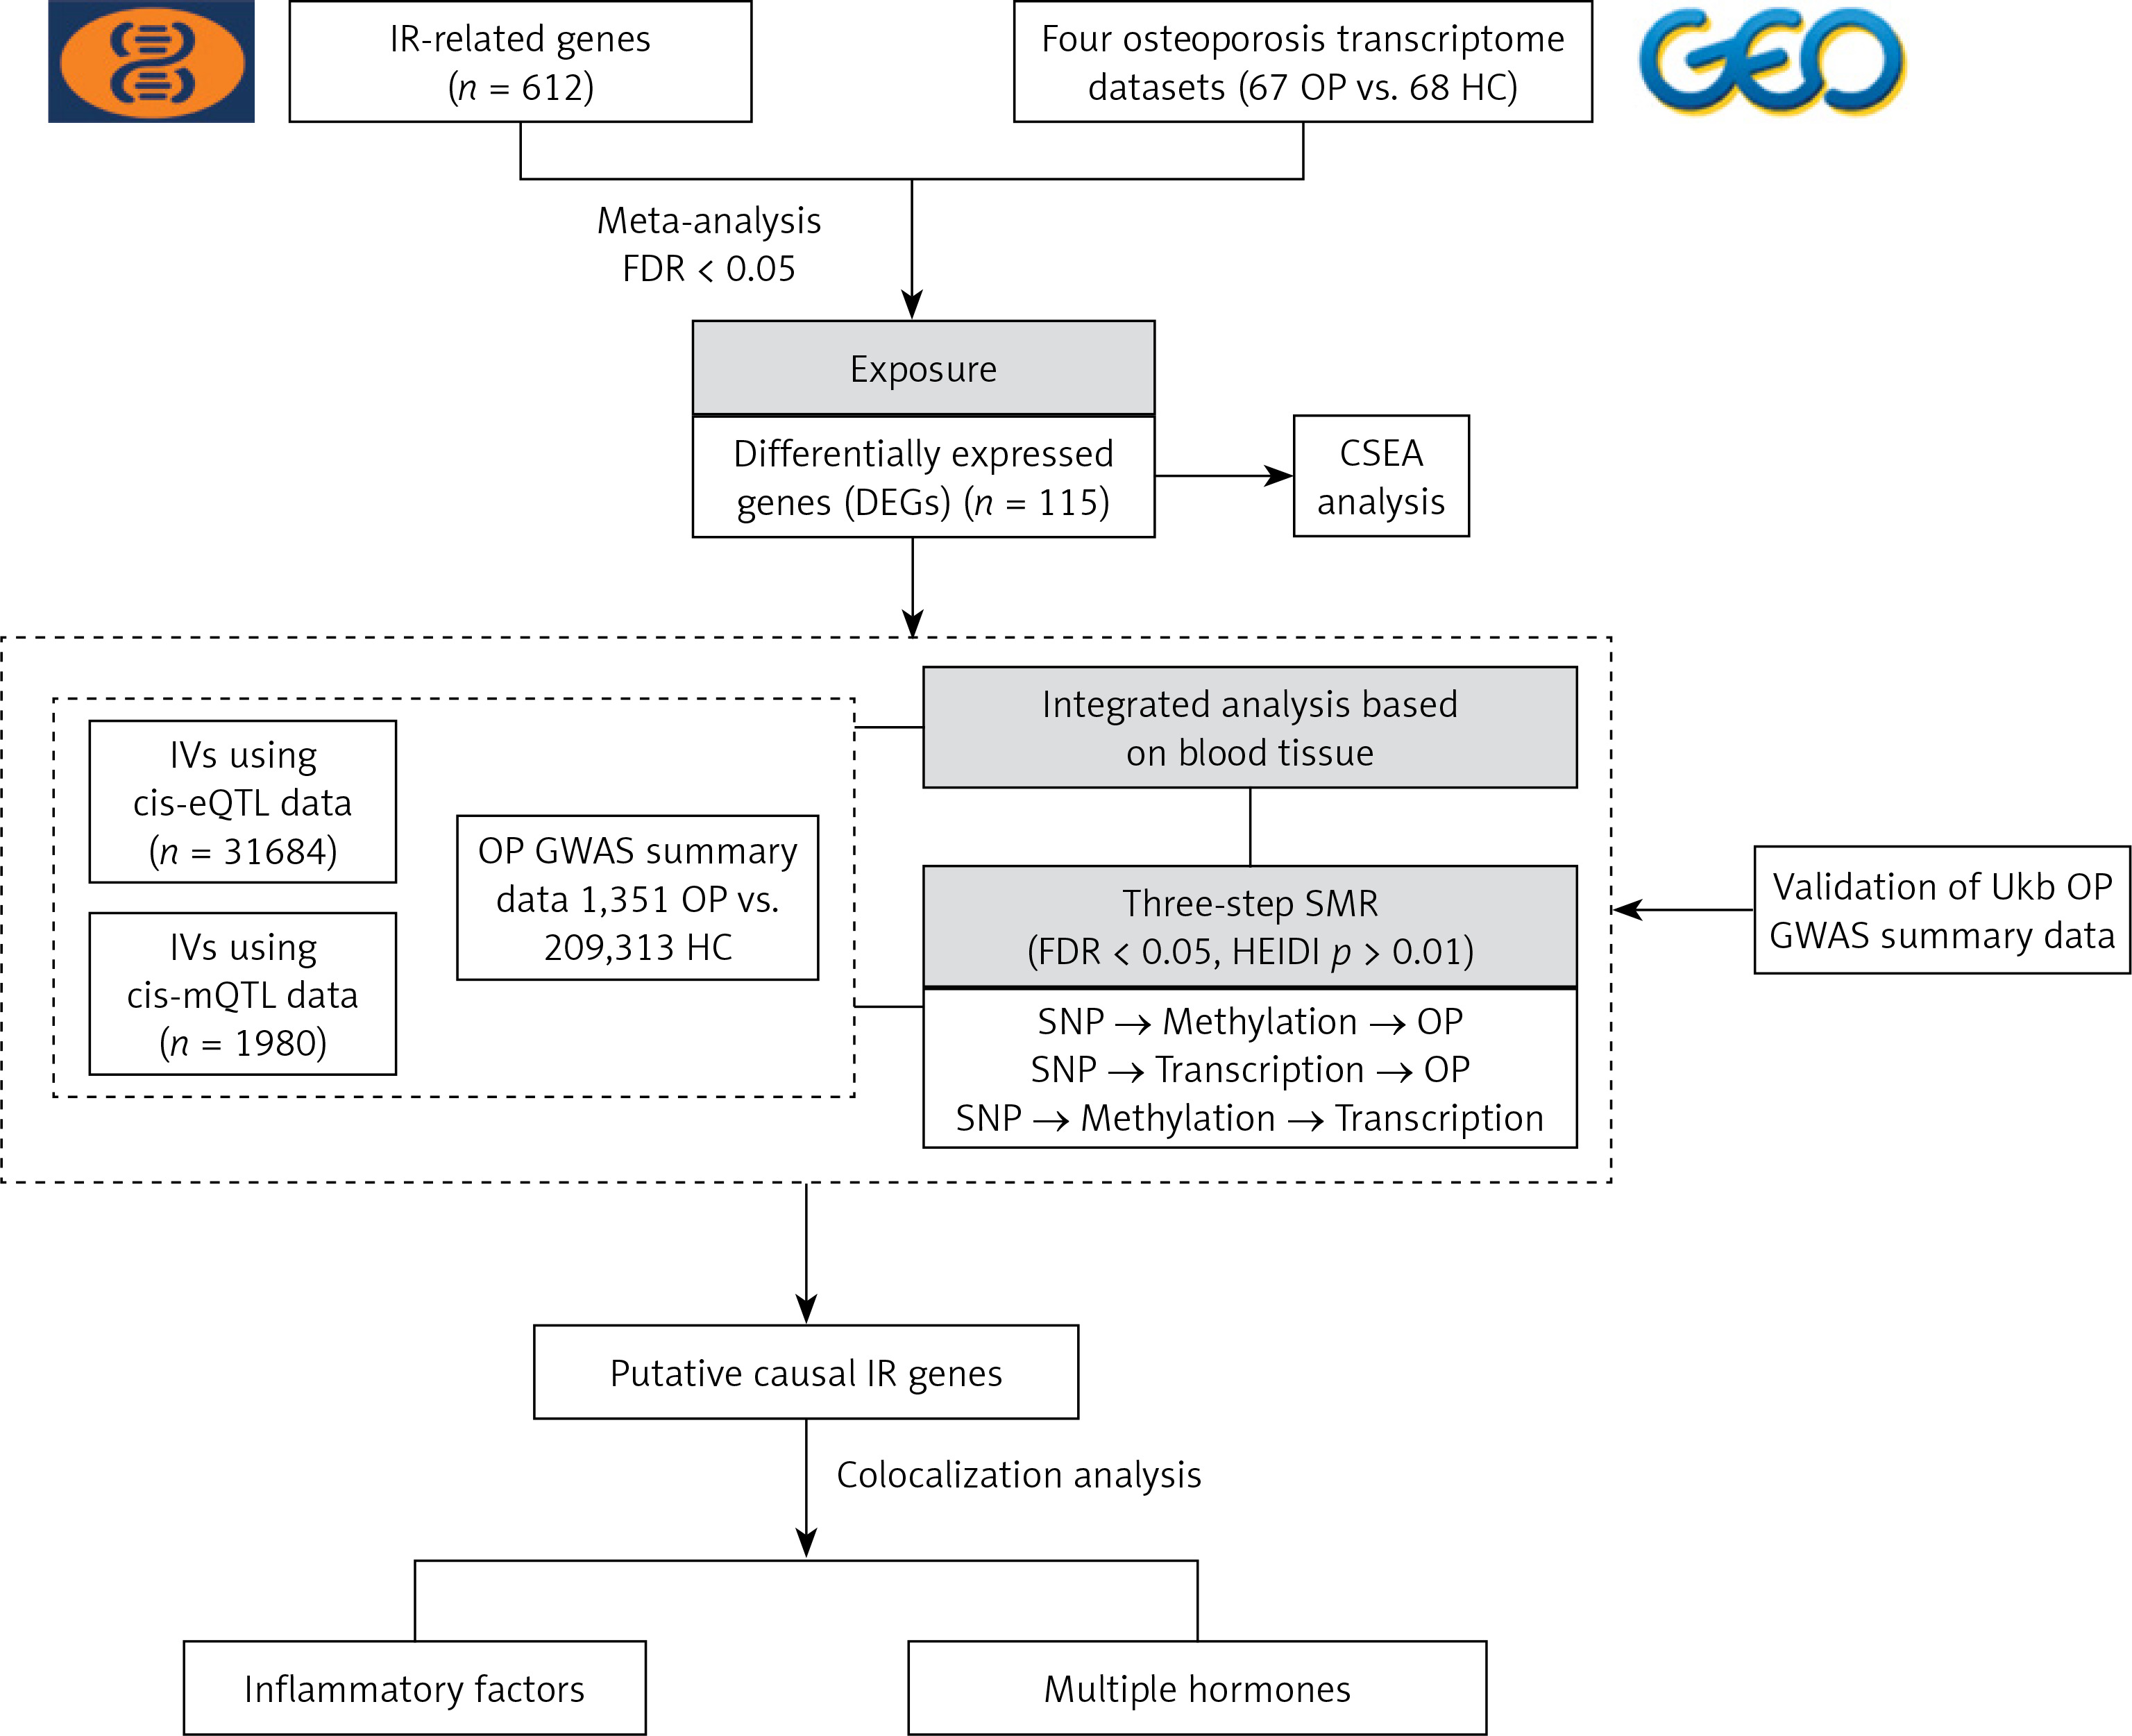
Figure 1 presents the design and workflow of this study. Initially, 612 genes with a relevance score of 15 or higher were identified as IR genes by retrieval from the GeneCards database (v5.10, https://www.genecards.org) using “inflammatory response” as the keyword. Four OP transcriptome datasets were found in the GEO database [15–17] and meta-analyzed to identify DEGs related to IR in OP. Then, IVs of the IR-related genes extracted from eQTLs and mQTLs were used as proxies for IR. Their association with OP was investigated through SMR analysis. Furthermore, to enhance the reliability of our findings, we conducted the heterogeneity in dependent instruments (HEIDI) test and Bayesian colocalization analysis. Only IR-related genes that passed both the HEIDI test and colocalization analysis were deemed candidate genes for OP. In the present study, summarized GWAS data of OP from both the FinnGen and the UK Biobank were used as the primary discovery dataset, while summarized GWAS data of OP from the UK Biobank were used as the replication dataset to validate our results. Finally, colocalization analysis was performed to evaluate the shared genetic effects between blood gene expression and inflammatory factors as well as various hormones.
Figure 1
Workflow of the study. A series of analyses were performed to identify candidate causal IR genes associated with OP onset. IR-related genes were sourced from the GeneCards database. Transcriptome datasets including OP cases and controls (HC) were obtained from the GEO database, and meta- analysis was conducted to identify DEGs, followed by cell type-specific expression analysis (CSEA). Integration of GWAS summary and cis-eQTLs/ cis-mQTLs data from the blood used three-step SMR methods, which prioritized putative blood IR genes and their regulatory elements associated with the risk of OP (FDR < 0.05; P_HEIDI > 0.01). The UK Biobank database was used to validate the aforementioned genes and their regulatory components. Additionally, colocalization analysis was conducted to reveal potential interactions between the gene expression of presumed causal genes and inflammatory factors as well as various hormones (PP.H4 > 0.5)
IR – inflammatory response, OP – osteoporosis, GEO – Gene Expression Omnibus, DEG – differentially expressed genes, eQTL – Gene expression quantitative trait locus, mQTL – DNA methylation quantitative trait locus, GWAS – genomewide association study, SMR – summary data-based Mendelian randomization analysis, FDR – false discovery rate, HEIDI – heterogeneity in dependent instruments.
Data sources
The eQTL IVs of IR-related genes were sourced from eQTLGen and included the genetic data of blood gene expression in 31,684 individuals derived from 37 datasets [18]. The mQTL IVs of IR-related genes were generated from a meta-analysis of two European cohorts: the Brisbane Systems Genetics Study (n = 614) and the Lothian Birth Cohorts (n = 1366) [13]. The current study focused only on cis-eQTLs and cis-mQTLs, which constituted single-nucleotide polymorphisms (SNPs) within a 1 Mb distance from the start and end of the gene (FDR < 0.05).
GWAS data of OP for the discovery study were obtained by integrating two databases: FinnGen and UK Biobank. This summary data for OP included 8 international cohorts and 210,664 individuals (1,351 cases and 209,313 controls) [19, 20]. To validate our findings, we used different OP GWAS data (1,955 cases and 278,169 controls) provided by the UK Biobank for the replication study [19]. More data information is presented in Supplementary Table SXIII).
Statistical analysis
We used SMR analysis to investigate the genetic relationship between IR, as represented by IR-related genes, and OP. In the current SMR analysis, the most significantly associated top cis-QTLs of IR-related genes were chosen as IVs. Importantly, for specific IR-related genes that presented multiple significant cis-QTLs with identical p-values, we selected the cis-QTL with the highest absolute Z-score as the primary cis-QTL. Additionally, we checked the consistency of allele frequency of each SNP between pairwise datasets, including QTL data, GWAS data, and LD reference data. SNPs with allele frequency differences < 0.20 between any pair of the data sets were included. Furthermore, to minimize bias caused by heterogeneity, the HEIDI test was rationally employed. Of note, a p-value of HEIDI > 0.01 suggested no heterogeneity, implying that the result was reliable [21]. Finally, we used FDR correction to avoid false genetic association. Only IR-related cis-QTLs that passed FDR correction (P_SMR corrected by FDR < 0.05) and the HEIDI test (P_HEIDI > 0.01) were allowed to undergo further colocalization analyses. Both SMR analysis and HEIDI tests were performed using SMR software for Windows version 1.3.1.
Meta-analysis of DEGs
Four transcriptome datasets (GSE56815, GSE13850, GSE35958, and GSE7158) (67 cases and 68 controls) were obtained from the GEO database. A linear regression model was employed to identify DEGs. Confounding factors such as age, sex, and menopause may affect the results [22], so we chose them as covariables for correction. DEGs were analyzed individually in the four gene expression datasets and subsequently integrated through a fixed-effects meta-analysis using the R package metafor.
SMR and colocalization analysis
Multiple SMR tools were developed to determine whether the effects of SNPs on phenotypes are mediated by molecular features such as gene expression or DNAm. Colocalization analyses were performed to examine common variants that may be responsible for multiple traits; integration of GWAS data with other molecular QTL data through SMR and colocalization improved identification of causal SNPs via specific pathways.
Blood tissue analysis used the SMR multi-tool to determine the causal inference of IR genes and the 1000 Genomes European reference to calculate LD. A three-step SMR analysis was performed: (1) SNPs were instruments, blood gene expression was exposure, and OP was the outcome; (2) SNPs were instruments, blood DNAms were exposure, and OP was the outcome; (3) SNPs were instruments, blood DNAms were exposure, and blood gene expression was the outcome. The third step included only significant signals from steps 1 and 2. The final candidate signals were defined as those that (1) passed the three-step SMR analysis (FDR < 0.05); (2) were suggestively significant genome-wide (p < 1 × 10⁻⁵) in all eQTLs and mQTLs; and (3) had no HEIDI test results, with p > 0.01.
We selected colocalization analysis to assess the potential interactions between the expression of IR genes and inflammatory factors as well as various hormones in blood tissues. This method is used to assess the presence of a shared causal variant in the region for two traits. Analysis was performed using the coloc R package with PP.H4 > 0.5 as the threshold for the shared genetic effects between the two traits. The sources of GWAS data for inflammatory factors and hormones can be found in the Supplementary File.
Cell type-specific enrichment and regulatory component annotation
The Cell type-Specific Enrichment Analysis Database (CSEA-DB, https://bioinfo.uth.edu/CSEADB/) was used to investigate whether DEGs are specific to any cell type. We focused on cell types present in blood, bone, and muscles.
The regulatory signature enrichment of DNAm sites was assessed using eFORGE (http://eforge.cs.ucl.ac.uk/), including chromatin status (active and inactive) and histone marker (H3K4me1) annotation. The regions of individual DNAm sites were annotated at http://grch37.ensembl.org/.
Results
Meta-analysis of differentially expressed IR-related genes between patients with OP and HC
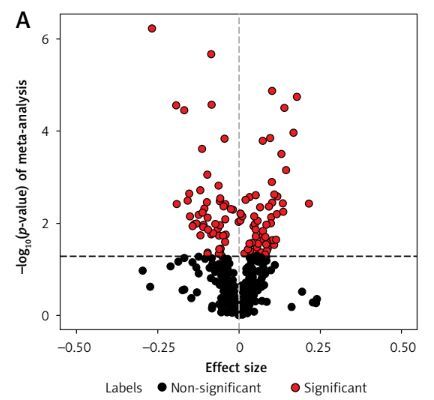
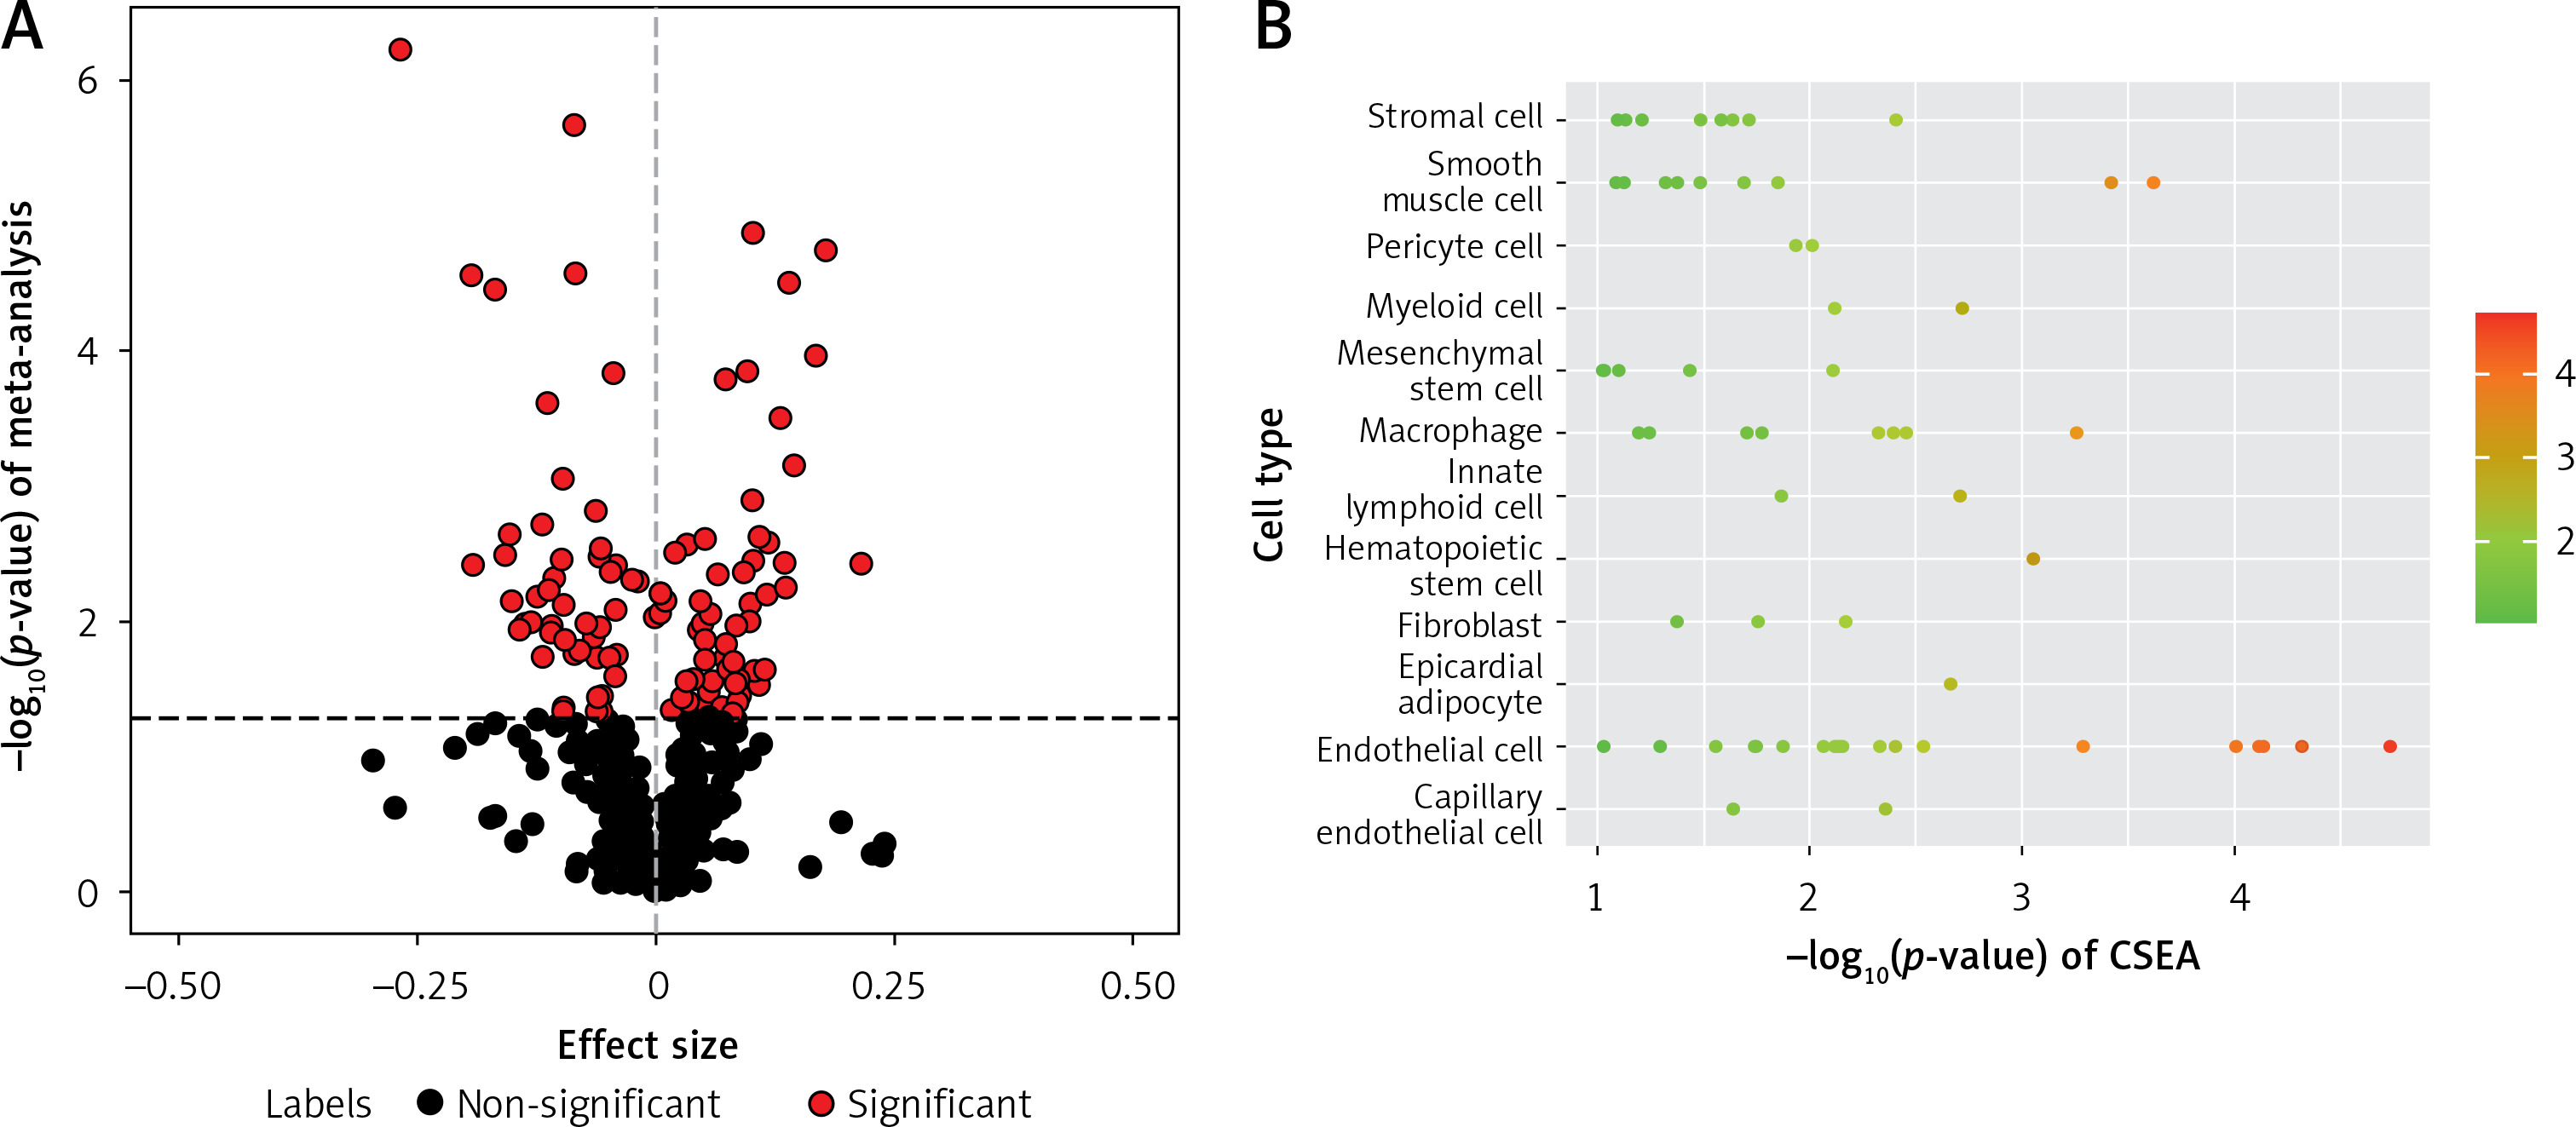
Using the linear regression model, we individually analyzed four OP transcriptome datasets (GSE56815, GSE13850, GSE35958, and GSE7158) (67 OP cases and 68 controls) (Supplementary Table SI) to identify DEGs in patients with OP. Meanwhile, 612 IR genes with a correlation score ≥ 15 were obtained from the GeneCards database (Methods section; Supplementary Table SII). A meta-analysis was conducted to identify 115 differentially expressed IR-related genes in patients with OP (p < 0.05; Figure 2 A, Supplementary Table SIII). In addition, we conducted CSEA for 115 DEGs. Among the 12 enriched cell types, we found significant enrichment of IR genes in smooth muscle cells (Figure 2 B, Supplementary Table SIV).
Figure 2
Meta-analysis of four gene expression datasets between patients with OP and HC. A – In total, 115 of 612 genes presented in all four OP transcriptome data were assessed for expression differences between patients with OP and HC. The volcano plot shows the meta effect sizes on the x-axis, while the y-axis indicates the -log10-transformed meta p- valuess. Red dots represent 116 significant DEGs, and black dots represent non-significantly expressed genes. The dashed line indicates the significance threshold with p < 0.05 corrected for the number of gene tests. B – The Cell type-Specific Enrichment Analysis Database was used to investigate whether DEGs were specific to any cell type. The y-axis indicates the cell types derived from the blood. Dots represent 12 cell types. The dashed line is the significance threshold with p < 0.05.
OP – osteoporosis, HC – healthy controls, DEG – differentially expressed genes.
Integration of OP GWAS and IR-related eQTL/mQTL data from the blood
A three-step SMR method was used, and only the significant results in all three SMR analyses that passed sensitivity checks were interpreted as suggestive causal genes (“Methods” section). A total of 115 IR-related DEG cis-eQTLs and their cis-mQTLs were integrated with the largest available GWAS summary statistics for OP.
In the first step, 13 IR-related genes (FDR < 0.05, P_HEIDI > 0.01) were identified by integrating blood eQTLGen data (n = 31,684) with OP GWAS data (Supplementary Table SV). In the second step, we identified 1638 DNAm probes by integrating the same OP GWAS results and mQTL summary statistics from the meta-analysis of Brisbane Systems Genetics Study and Lothian Birth Cohorts (n = 1980) (Supplementary Table SVI). In the third step, further integration analysis of putative OP-causal cis-eQTL and cis-mQTL data prioritized 7 DNAm probes potentially regulating 5 neighboring genes, namely, ARPC1B, FAS, CHUK, TRPC6, and TRPV1 (FDR < 0.05, P_HEIDI > 0.01) (Supplementary Table SVII). These CpG sites are significantly enriched in the transcription start sites of peripheral blood cells. Examples are (1) primary monocytes from peripheral blood (p = 9.3 × 10⁻³), (2) primary B cells from peripheral blood (p = 1.42 × 10⁻³), and (3) primary T cells from cord blood (p = 6.81 × 10⁻³) (Supplementary Table SVIII). Evident enrichment of the transcription start sites was found in the three cell types.
Putative OP-causal genes mediated by blood methylation regulation of gene expression
Through a three-step SMR analysis, we first considered the FAS gene as a potential pathogenic gene. Significant SNP signals associated with the FAS gene were identified during OP GWAS, eQTL, and mQTL data analysis. The DNAm probe cg09221159 is located in the region 718 kbp upstream of the FAS gene. The methylation level in this region is negatively correlated with FAS gene expression (betaSMR = –0.162; FDR = 0.002; P_HEIDI = 0.19) and OP incidence (betaSMR = –0.579; FDR = 0.021; P_HEIDI = 0.98), while FAS gene expression is positively correlated with OP incidence (betaSMR = 0.089; FDR = 0.034; P_HEIDI = 0.24). Overall, the findings suggest that low DNAm levels of the FAS gene may upregulate its expression, thereby increasing the risk of OP (Figures 3 A, B).
Figure 3
Three-step SMR analysis prioritized putative causal IR genes and mechanisms in OP using blood tissue. A, C – Locus zoom plots showing the consistent genetic effects from OP GWAS, cis-mQTL, and cis-eQTL near FAS and CHUK (from upper to lower panels, all minimum p < 1 × 10⁻⁵). B, D – hree-step SMR indicating significant causal relationships between gene expression and OP onset mediated by methylation (FDR < 0.05, P_HEIDI > 0.01). From left to right: SMR between gene expression and OP GWAS, SMR between gene methylation and OP GWAS, and SMR between gene methylation and expression
IR – inflammatory response, OP – osteoporosis, eQTL – gene expression quantitative trait locus, mQTL – DNA methylation quantitative trait locus, GWAS – genome-wide association study, SMR – summary data-based Mendelian randomization analysis, FDR – false discovery rate, HEIDI – heterogeneity in dependent instruments.
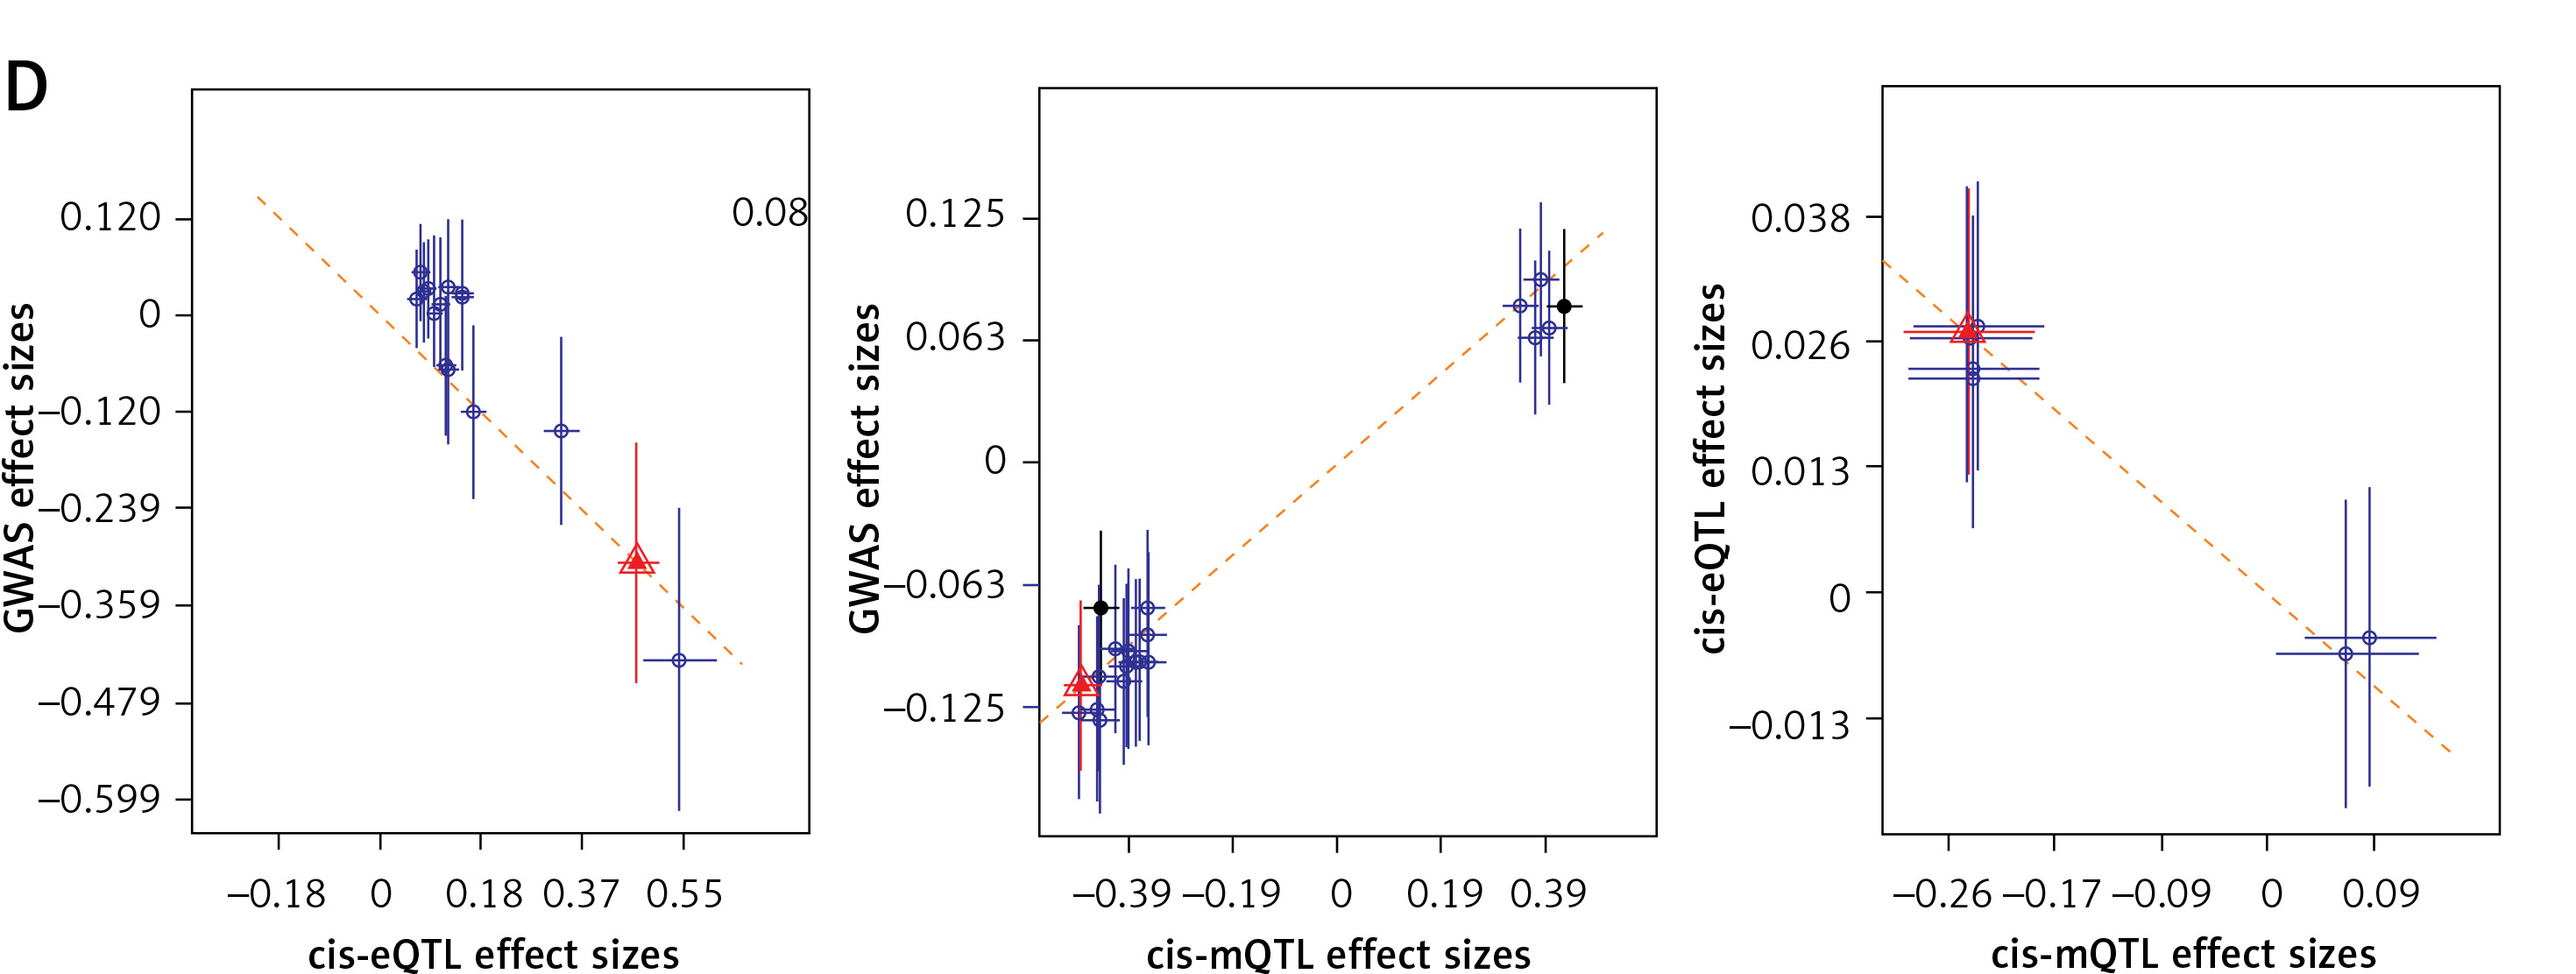
Another gene deemed to be crucial is the CHUK gene (Figures 3 C, D). The DNAm probe cg03679755 is located in the region 73 kbp upstream of the CHUK gene. A higher level of methylation at this site would inhibit the transcription of the CHUK gene (betaSMR = –0.031; FDR = 8.23 × 10⁻⁵; P_HEIDI = 0.16), thereby increasing the risk of developing OP (betaSMR = 0.011; FDR = 0.049; P_HEIDI = 0.07). Conversely, a higher level of transcription of the CHUK gene would decrease the risk of developing the disease (betaSMR = –0.656; FDR = 0.039; P_HEIDI = 0.16).
Putative OP-causal genes involved in inflammatory factors and multiple hormone interactions
We classify 0.5 < PP.H4 < 0.8 as moderate-strength colocalization evidence, and PP.H4 > 0.8 as high-strength colocalization evidence. Factors that meet the criteria for moderate-strength evidence include TNF-related activation cytokine, IL-1α, interleukin-12 subunit beta, growth hormone levels, osteoprotegerin levels, free androgen index, and C-X-C motif chemokine 9. Factors that meet the criteria for high-strength evidence include T-cell surface glycoprotein CD5 and estradiol levels (to be interpreted with caution).
Based on SMR and colocalization analysis, we prioritized FAS as a candidate IR causal gene in OP associated with inflammatory factors and several hormones (Figure 4 A) (Supplementary Table SIX, SXI). Our findings indicate that increased expression of FAS likely contributes to the onset of OP (betaSMR = 0.089; FDR = 0.034; P_HEIDI = 0.24). Additionally, SNPs that regulate FAS expression may influence the levels of inflammatory cytokines and hormones, as observed in the colocalization analysis. The expression of the FAS gene facilitates the onset and progression of OP. After excluding hormones and inflammatory factors having weaker associations with bone metabolism, we found that both estrogen (PP.H4 = 0.95) and IL-1α (PP.H4 = 0.65) exert a shared genetic influence on FAS gene expression (Supplementary Tables SX, SXII).
Figure 4
SMR and colocalization analyses prioritized blood causal IR genes and interactions with inflammatory factors and various hormones in OP. The left panels indicate the SMR between gene expression and OP GWAS (all SMR FDR < 0.05, P_HEIDI > 0.01), while the right panels show the locus comparisons between cis-eQTLs and mbQTLs by colocalization analysis (all PP.H4 > 0.5). The r2 value indicates the LD between the variants and the top SNPs. A, B – the FAS and CHUK genes, respectively
IR – inflammatory response, OP – osteoporosis, eQTL – gene expression quantitative trait locus, mQTL – DNA methylation quantitative trait locus, GWAS – genome-wide association study, SMR – summary data-based Mendelian randomization analysis, FDR – false discovery rate, LD – linkage disequilibrium, HEIDI – heterogeneity in dependent instruments, SNPs – single-nucleotide polymorphisms.
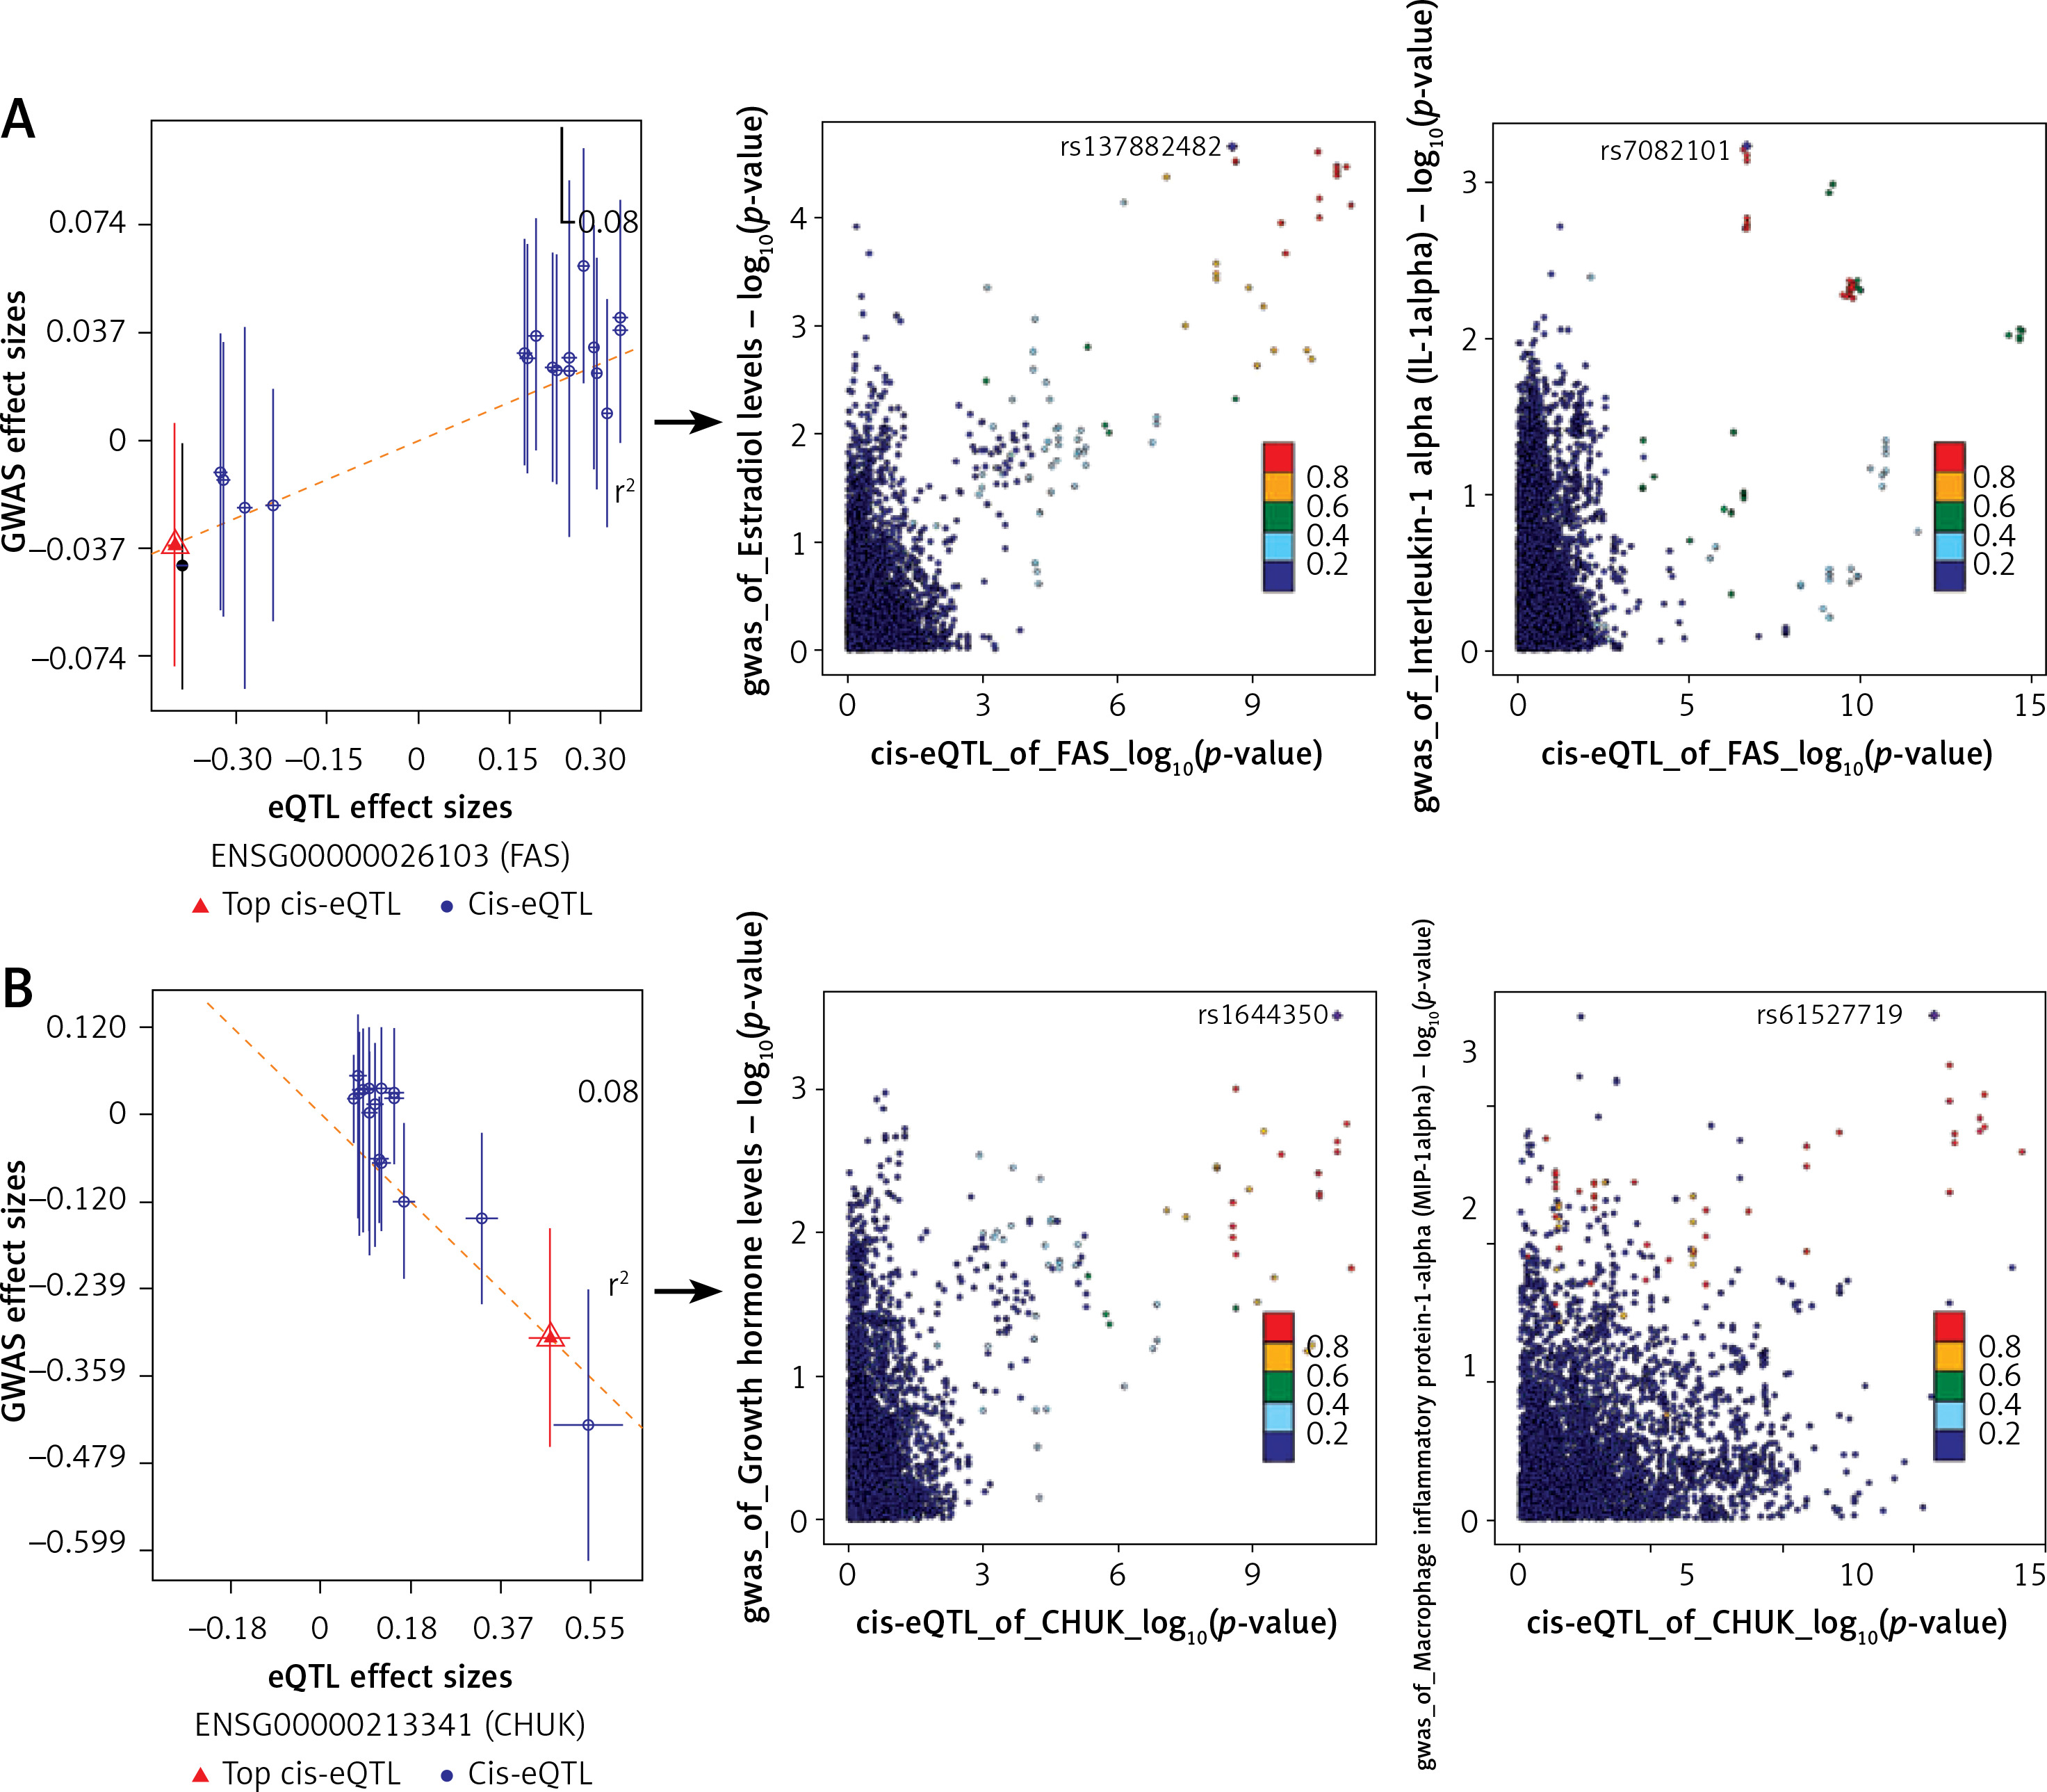
The CHUK gene (Figure 4 B) (Supplementary Tables SIX, SXI) is another significant gene that is closely associated with the risk of OP (betaSMR = –0.656; FDR = 0.039; P_HEIDI = 0.16). After excluding hormones and inflammatory factors having weaker associations with bone metabolism, we found that CHUK exhibits a shared genetic effect with growth hormone (PP.H4 = 0.59) and MIP-1α (PP.H4 = 0.62) (Supplementary Table SX, SXII). Consequently, genetic variations in the CHUK gene may modulate its expression, influence hormone levels, and alter inflammatory factor levels, all of which are closely associated with the risk of OP.
Discussion
To our knowledge, this is the first study to identify the putative IR-causing genes and underlying mechanisms in OP from blood tissue samples using a multi-omics integrated approach. We identified 115 IR-related DEGs in OP from a pool of 612 potential IR-related genes, based on a comprehensive meta-analysis of transcriptome data. Using large-scale QTL data and GWAS summary data, we conducted SMR analysis to investigate the association between IR genes and the risk of OP. By integrating the SMR analysis with the HEIDI test, we found that the expression levels of two IR-related genes were associated with the risk of OP. Specifically, elevated expression levels of the FAS gene were associated with an increased risk of OP, while higher expression levels of the CHUK gene were linked to a decreased risk of OP. Additionally, colocalization analysis demonstrated that FAS shares genetic variants with estrogen and IL-1α, whereas CHUK shares variants with growth hormone and MIP-1α. Consequently, this study enhances our understanding of the causal relationship between IR genes and OP, elucidating the underlying genetic interaction mechanisms.
The human FAS gene/CD95 is located on chromosomal region 10q23.31 and encodes a mature protein composed of 319 amino acids [23]. As a member of the TNF receptor family, it plays a critical role in the nuclear factor kappa-light-chain-enhancer of activated B cells (NF-κB) signaling pathway [24]. Previous studies have confirmed its significant role in human physiology. In recent decades, genetic variants of FAS have been associated with autoimmune diseases [25], osteoarthritis [26], and acute lung injury [27]. However, limited reports exist on the relationship between FAS and OP. In the present study, we found that high expression of the FAS gene is associated with an increased risk of OP. Additionally, we discovered that DNAm in the upstream region of FAS negatively regulates FAS expression, suggesting a connection between DNAm, FAS expression, and the risk of OP. The association can be reasonably explained through two possible mechanisms. First, FAS plays a key role in the receptor activator of nuclear factor kappaB (RANK)/RANK ligand (RANKL) signaling pathway [28], which promotes osteoclast differentiation and induces bone resorption [29]. Notably, bone loss is primarily regulated by the RANK/RANKL system, the main mechanism responsible for the induction, activation, and survival of osteoclasts [30, 31]. Some studies have demonstrated that inhibiting the RANKL/RANK axis can enhance bone mass by preventing osteoclast-mediated bone resorption [8]. AS2690168, a RANK/RANKL signaling pathway inhibitor, has been shown to alleviate pain associated with OP and slow its progression [32]. Furthermore, several tests have revealed that stimulating RANKL expression in osteocytes can increase bone resorption, resulting in bone loss in mice [33]. Secondly, FAS induces the process of apoptosis, which may be influenced by oxidative stress (OS) [29, 34]. OS leads to dysfunction of bone marrow mesenchymal stem cells, resulting in decreased osteogenic ability and increased differentiation into adipose tissue [35]. Osteoblasts can produce antioxidants, such as glutathione peroxidase, to protect cells from damage caused by reactive oxygen species [36]. During bone resorption, osteoclasts generate superoxide, and OS enhances the differentiation and function of osteoclasts [37]. Melatonin is an antioxidant that has been shown to inhibit the generation of osteoclasts [38]. In in vivo experiments, melatonin supplementation has a positive effect on the bone mass of ovariectomized mice [39]. Other studies have shown that the FAS gene may promote the differentiation of bone marrow mesenchymal stem cells by regulating the expression of peroxisome proliferator-activated receptor gamma and fatty acid-binding protein 4, and inhibit lipid accumulation during the differentiation process, thereby increasing bone mass and maintaining the health of the bone microenvironment [40, 41]. In summary, most studies suggest that FAS may accelerate OP progression by promoting the RANK/RANKL signaling pathway or by inducing OS. Other studies indicate that the FAS gene could regulate the expression of peroxisome proliferator-activated receptor gamma and fatty acid-binding protein 4, promoting the differentiation of bone marrow mesenchymal stem cells and inhibiting lipid accumulation during the differentiation process, thereby increasing bone mass and slowing the progression of OP. This may explain why, despite the causal relationship between FAS and osteoporosis being statistically significant (FDR < 0.05), the 95% confidence interval of the OR still includes 1.
The CHUK gene encodes the inhibitor of kappa B kinase complex, a direct upstream activator of the NF-κB signaling pathway. During mitochondrial stress, the NF-κB essential modulator is recruited to the mitochondria. This recruitment triggers two processes: mitochondrial autophagy and reverse recruitment of the inhibitor of kappa B kinase complex, leading to activation of the NF-κB signaling pathway [42]. Thus, CHUK may trigger an IR while maintaining bone homeostasis and reducing the risk of OP through the mitochondrial autophagy pathway. Previous research on CHUK has predominantly focused on tumors [43], developmental disorders [44] and inflammation-related diseases [45]. However, studies examining the relationship between CHUK and OP remain limited. This study suggests that elevated CHUK expression may correlate with a reduced risk of OP, while DNAm inhibits CHUK expression. Mitochondrial autophagy is widely observed in bone tissue. Mitochondria play a critical role in regulating intracellular calcium transport and ion homeostasis by providing adenosine triphosphate and facilitating calcium signaling [46]. In osteoblasts, mitochondria secrete vesicles that promote bone formation, thereby influencing the osteogenic process [47]. Mitochondrial autophagy is essential for maintaining mitochondrial function. Recent studies have indicated that under conditions of chronic inflammation, inhibition of mitochondrial autophagy can activate the wingless-integrated/β-catenin signaling pathway, which, in conjunction with Runt-related transcription factor 2 and bone morphogenetic proteins, triggers the differentiation of osteoblasts [48, 49]. Thus, mitophagy plays a pivotal role in bone remodeling. Research has demonstrated that activation of mitochondrial autophagy via inhibition of the mechanistic target of rapamycin/phosphoinositide 3-kinase pathway suppresses senescence in bone marrow mesenchymal stem cells and enhances their osteogenic function [50–52]. Additionally, research has shown that resveratrol protects osteoblast function by activating the sirtuin 1-mediated mitochondrial autophagy pathway [53]. Furthermore, mitophagic cell death in osteoclasts may be associated with the expression of bone resorption-related proteins [54]. In conclusion, CHUK may impede the progression of osteoporotic conditions by regulating mitochondrial autophagy; however, further research is required to elucidate the specific mechanisms through which CHUK decelerates the development of OP.
By integrating multi-omics studies from various tissues, researchers can analyze GWAS signals to prioritize relevant genes and disease mechanisms. Our study identified the colocalization of genetic regulations of FAS expression and hormones, as well as inflammatory factors. Estradiol, IL-1α, and FAS gene expression exhibit common genetic effects, indicating a potential interaction among this gene, hormones, and inflammatory factors. Estradiol can induce the apoptosis of pre-osteoclasts by regulating Fas ligand in osteoblasts, thereby maintaining bone homeostasis [55]. Additionally, estradiol intake has been shown to stimulate osteoblast proliferation and collagen gene expression, thereby slowing down the progression of OP in postmenopausal women [56, 57]. IL-1α stimulates bone turnover by increasing bone resorption and blood calcium levels, exerting long-term local effects mediated by prostaglandins [58]. CHUK has common genetic effects with growth hormone and MIP-1α. Growth hormone increases bone density, promotes bone formation, and enhances the biomechanical strength of fracture healing by stimulating osteoblast proliferation and activity, showing significant effects in the treatment of osteoporotic fractures [59]. MIP-1α plays a critical role in bone remodeling and metabolism by promoting the formation and activity of osteoclasts [60]. The high expression in various bone destruction-related diseases makes it a potential target for bone disease treatment.
Tissue- and cell-specific gene expression has been shown to yield valuable insights into regulatory mechanisms and biological processes underlying disease. The site of onset for OP is in the bone, and studying the genetic influence on gene expression using eQTL data from bone tissue may be more meaningful. However, there is currently a lack of public databases related to bone tissue. This study conducted CSEA on 115 DEGs related to IR. Among the 12 enriched cell types, smooth muscle cells were significantly enriched. This finding suggests that smooth muscle cells may be involved in the regulation of skeletal inflammation. Previous studies have found that smooth muscle cells may influence bone metabolism by altering the bone microenvironment [61]. Further exploration is needed into the mechanisms between IR-related genes and OP, and future studies could utilize public databases on smooth muscle tissue for in-depth analysis.
Some limitations of this study are worth acknowledging. First, the dataset used in our research integrates four OP transcriptome datasets, and the quality and measurement errors of different data sources may not be consistent, which could potentially affect the reliability of the results. Therefore, we conducted linear regression model analysis on each dataset separately and adjusted for potential confounding factors that could affect gene expression levels, such as age, gender, and menopausal status, to ensure the authenticity of the research data. Although we adjusted for available covariates in the datasets, including age, gender, and menopausal status, some potential confounding factors, such as medication use, could not be accounted for due to their absence in the original studies. A common challenge in the field is the varying degree of standardization of phenotype information across public databases such as GEO. Second, although the OP outcome indicators in this study encompass populations from various ethnic groups, the blood eQTL and mQTL data used as exposure factors are predominantly derived from European populations. To enhance the robustness and generalizability of the study’s findings, we chose to rely on data from European populations. However, this approach may introduce issues such as insufficient sample size and population stratification bias. Therefore, future research should consider including more data from diverse population groups to produce more reliable conclusions. Third, although peripheral blood samples are convenient and non-invasive, they may not fully capture tissue-specific gene expression and epigenetic changes that occur in bone cells, which are directly related to the pathophysiology of OP. Bone tissue, with its unique cellular composition and microenvironment, may contain specific eQTL and mQTL that are more closely related to the processes driving bone metabolism and remodeling. We reviewed the literature, but unfortunately, we were unable to find data related to bone tissue. Nevertheless, there are several reasons why peripheral blood data were chosen. First, obtaining bone tissue samples from OP patients presents challenges and is highly invasive, especially in large clinical cohorts where such tissue-specific data are more difficult to obtain. Second, peripheral blood can reflect systemic biological changes, including factors that may influence bone health, such as inflammation, endocrine signals, and metabolic alterations. Therefore, although peripheral blood may not provide direct insights into bone-specific molecular pathways, it still offers valuable information regarding the broader systemic factors contributing to the risk of OP. We acknowledge that the lack of bone tissue data represents a significant gap in this study. In future research, the use of bone biopsies or imaging techniques to analyze gene expression and DNAm in bone tissue holds the potential to provide more targeted efforts in directly understanding the molecular mechanisms of OP. Third, there is currently no universally accepted threshold standard for colocalization analysis. Different studies set thresholds based on their specific objectives to balance sensitivity and specificity. For instance, Chen et al. defined PP.H4 > 0.5 as “moderate evidence” for the preliminary identification of potential colocalization signals [62]. This threshold is particularly useful in multi-tissue or cross-omics analyses, as it helps reduce the risk of false negatives [63–66]. Similarly, Xu et al., in a comparable multi-omics study, directly adopted PP.H4 > 0.5 as the criterion for colocalization evidence [67]. Most studies tend to use higher thresholds (e.g., 0.75 or 0.8) to increase specificity. However, such an approach may miss true signals, especially in the presence of heterogeneity or weak effect sizes. Our study integrates multi-omics data (mQTL, eQTL, pQTL, and GWAS), and thus requires a balance between discovery potential and false positive control during the exploratory phase. Therefore, we retained signals with moderate confidence to guide subsequent experimental validation. Finally, trans-regulatory elements, including transcription factors, enhancers, and noncoding RNA, play key roles in regulating gene expression and may influence susceptibility to OP by affecting key biological pathways. However, considering that cis-regulatory elements have more direct and specific biological effects than trans-regulatory elements [68], we used cis-eQTL/cis-mQTL data from human blood as the exposure factor. Future studies could explore the interaction of these genes with trans-regulatory elements by using transcriptomics data, chromatin immunoprecipitation sequencing, or CRISPR-based techniques to identify enhancer regions, transcription factors, and noncoding RNA involved in their regulation. These studies will provide greater insight into the complex regulation of gene expression in OP and identify potential therapeutic targets.
In conclusion, this study explored the genetic association between IR and OP based on a multi-omics MR approach. The findings highlighted the significant role of IR-related genes, such as FAS and CHUK, in the pathogenesis of OP. Moreover, the newly discovered IR-related genes interacting with multiple hormones and inflammatory factors warrant further functional-level investigation to elucidate the underlying biological mechanisms. This research contributes to the understanding of IR in OP and identifies potentially novel therapeutic targets for clinical application.