Introduction
Atopic dermatitis (AD), the most common chronic inflammatory dermatosis, is clinically characterized by intense pruritus and recurring eczematous lesions [1]. This condition exhibits a striking age-dependent prevalence, affecting 15–20% of children compared to only 5–10% of adults [2]. The pathogenesis of AD remains uncertain and intricate. The current understanding of AD’s causes includes genetic predisposition and environmental triggers, skin barrier disruptions, microbial community imbalances, and immune system dysregulation [1, 3]. As a chronic condition with variable clinical presentations, AD management primarily focuses on maintaining epidermal barrier function through emollient use. For more resistant cases, treatment options expand to include biologic therapies, phototherapy, and immunomodulators. However, the lack of targeted treatments for severe AD underscores the urgent need to better understand its underlying mechanisms and develop more effective therapies.
Drug discovery and optimization are protracted, costly, and fraught with risk [4]. The traditional drug development pipeline encompasses multiple rigorous phases, including target validation, compound screening, lead optimization, preclinical efficacy and toxicity assessments, clinical trials, and ultimately regulatory approval and commercialization. Despite these extensive efforts, the overall success rate of clinical drug development remains alarmingly low at 10–15% [5, 6]. A major contributing factor to this high attrition rate is the frequent failure of late-stage clinical candidates, primarily because early-stage target selection failed to accurately predict therapeutic efficacy [7]. Notably, emerging evidence suggests that genetically supported drug targets demonstrate significantly higher therapeutic potential, offering promising opportunities to improve development success rates [8].
The integration of genetic research findings into drug target research is a promising avenue that generates novel methodologies for the advancement of pharmaceutical development. Mendelian randomization (MR), a powerful genetic epidemiological approach, employs genetic variants as instrumental variables (IVs) to infer causal relationships between exposures and outcomes while addressing key limitations of observational studies, including confounding and reverse causation [9, 10]. By leveraging quantitative trait loci (QTLs) as IVs, MR analysis has successfully identified novel drug targets across multiple diseases [11–17]. This methodology not only enhances the precision of therapeutic effect estimation but also holds significant potential to accelerate drug development.
In this study, we applied an integrative multiomics framework to identify and validate potential drug targets for AD. Specifically, we performed two-sample MR and colocalization analyses by integrating data on druggable genes, blood eQTLs, and two independent AD genome-wide association study (GWAS) datasets to infer causal relationships between gene expression and AD risk. Validation was carried out with pQTL dataset data, and the causal effects of putative druggable genes on five other inflammatory dermatoses were also explored. Finally, we characterized the cellular and spatial expression patterns of candidate targets through integrated single-cell RNA sequencing (scRNA-seq) and spatial transcriptomics (ST) data, providing multi-dimensional evidence to prioritize therapeutic candidates.
Material and methods
Exposure data sources
A total of 4,302 druggable genes located on the autosomal chromosomes with HGNC nomenclature were identified [18]. These are 1,375 protein targets that are currently under clinical development, 646 proteins associated with drug targets and compounds, and 2,281 proteins associated with members of major drug target families. Given the observation that cis-eQTLs exhibited greater proximity to the target gene in the context of drug development investigations, we acquired cis-eQTLs within a range of ±1 megabase (Mb) from the eQTLGen consortium’s peripheral blood study (n = 31,684) [19]. For protein-level validation, we analyzed pQTL data derived from a GWAS of plasma proteins measured by 4,907 aptamers in 35,559 Icelandic individuals (Supplementary Table SI). Genes showing consistent cis-eQTL associations in both discovery and replication phases were further examined using this pQTL resource, including analysis of significant cis-pQTLs identified in the original study’s supplemental data. Significant cis-pQTLs from the original study’s supplemental data were analyzed.
Outcome data sources
Atopic dermatitis
The genetic summary data for AD was obtained from a recent large-scale meta-analysis study involving 796,661 individuals of European ancestry (Supplementary Table SI). The dataset encompassed sources from the Estonian Biobank (11,187 cases and 125,537 controls), FinnGen (8,383 cases and 236,161 controls), and the UK Biobank consortium (2,904 cases and 412,489 controls) [20]. FinnGen required cases to be entered using the International Classification of Diseases, Tenth Revision (ICD-10) code L20, ICD-9 number 6918, or ICD-8 code 691. Participants having the ICD-10 code L20 were judged to have AD in both the Estonian Biobank and the UK Biobank. Both FinnGen and the Estonian Biobank’s association models used age, sex, and genetic features such as the top 10 genetic main components. FinnGen modified models for genotyping batches. The UK Biobank study accounted for many confounders, such as age, sex, age × sex, age2, age2 × sex, and the first 10 genetic main components. Replication data were obtained from the EArly Genetics and Life Course Epidemiology (EAGLE) Consortium’s 10,788 AD patients and 30,047 controls (excluding the 23andMe study) [21]. The EAGLE Consortium diagnosed AD by self-report or dermatological examination.
Five inflammatory dermatoses
GWAS summary statistics for psoriasis (9,267 cases; 364,071 controls), rosacea (1,195 cases; 211,139 controls), and acne (2,787 cases; 361,140 controls) were made public by the FinnGen consortium [22]. The EAGLE Consortium released GWAS summary data on eczema with 10,788 cases and 30,047 controls [21]. Summary results were obtained from the greatest GWAS meta-analyses for vitiligo (4,680 cases; 29,586 controls) [23].
IV selection
We initially identified cis-eQTLs within ±100 kb of gene probes in 2,630 druggable genes. Second, for potential IVs to be selected, the SNP-phenotype association level must meet the genome-wide significance threshold (p < 5 × 10⁻⁸). Furthermore, minor allele frequency (MAF) < 0.01 was eliminated. Fourth, to ensure the independence of IVs without linkage disequilibrium (LD), SNPs with R2 > 0.1 (window size = 10,000 kb) were filtered based on the 1000 Genomes European reference panel. We assessed weak IV bias using the F-statistic (beta2/se2) [24]; an F-statistic greater than 10 indicates that there is little evidence of weak IVs. The IVs’ directionality was evaluated by exploiting the MR Steiger filtering estimate to determine whether the SNP had a stronger association with the exposure than with the outcome. SNPs not meeting this criterion were eliminated (Supplementary Tables SII, SIII).
Mendelian randomization
We applied MR to assess causal relationships between druggable gene expression and AD risk using summary-level genetic data. The analysis excluded SNPs when exposure-related SNPs were unavailable in outcome GWAS datasets. We implemented strict allele harmonization procedures to ensure consistency between exposure and outcome data. For SNPs with discordant effect alleles across datasets, we performed strand alignment adjustments. Palindromic SNPs were removed due to their inherent allele ambiguity, as previously described [25]. For single SNP instruments, we employed the Wald ratio method [26]. Multiple SNP analyses primarily used the inverse-variance weighted method (IVW) [27, 28]. Weighted median and MR-Egger regression estimators are employed to evaluate the robustness of the findings [29]. The weighted median method presents a median estimate of all SNP effect values sorted by weight, with consistent results even if up to 50% of IV is invalid [30]. The MR-Egger regression method was used to evaluate pleiotropy, taking into account the existence of the intercept. The MR-Egger intercept test was used to conduct pleiotropy testing. Cochran’s Q test was employed to identify the existence of heterogeneity in IVs [28].
Bayesian colocalization analysis
Bayesian colocalization analysis was performed to determine whether two traits share the common causal variant rather than being linked owing to LD. The analysis was conducted using the default parameters in the “coloc” package (https://github.com/chr1swallace/coloc). As indicated, colocalization analysis calculates posterior probability for five hypotheses regarding shared genetic associations. PP.H0 indicates no genetic association for either trait in the region. PP.H1 suggests an association only for trait 1. PP.H2 indicates an association only for trait 2. PP.H3 represents an association for both traits but with distinct causal variants. PP.H4 provides evidence for shared causal variants between traits. The analysis included all cis-eQTLs within ±1 Mb of each gene without LD or p-value filtering. Colocalization analysis uses coloc.abf algorithms. We considered PP.H4 > 80% as strong evidence for colocalization and designated such genes as potential therapeutic targets.
Leveraging MR and colocalization analysis, we also explored causal relationships between candidate target genes and five other inflammatory skin diseases. To evaluate therapeutic potential, we queried DrugBank and ChEMBL databases for relevant small-molecule compounds. ClinicalTrials.gov provided additional information on clinical development status.
Discovery analyses used a Bonferroni-corrected threshold of p < 2.16e-05 (0.05/2316). Replication analyses required p < 0.005 (0.05/10). Other analyses used p < 0.05 as the significance threshold. All analysis was conducted exploiting the “TwoSampleMR” and “coloc” packages in R software (version 4.3.1).
Single-cell RNA-sequencing data acquisition and processing
In this study, scRNA-seq data were obtained from the GSE153760 dataset in the GEO database [31], which includes 7 healthy controls (HC) and 8 AD patients. Data processing used the “Seurat” package (v4.4.0) with the following workflow. First, quality control (QC) removed cells expressing fewer than 200 or more than 7,000 genes and those with mitochondrial content exceeding 20% conducted by the “PercentageFeatureSet” function. Second, data normalization was carried out using the “NormalizeData” function, followed by identification of the top 2,000 highly variable genes (HVGs) with the “FindVariableFeatures” function. We then conducted principal component analysis (PCA) on the HVGs using the “RunPCA” function. To correct for batch effects, the “RunHarmony” function was employed. Cell clusters were identified with the “FindClusters” function (resolution = 0.5) and visualized in the Harmony space through the “RunTSNE” function. Marker gene identification for each cluster was accomplished through the “FindAllMarkers” function, focusing on genes with at least a 0.25 logFC increase compared to other cell clusters. Finally, we visualized IL2RA expression patterns using both the “FeaturePlot_scCustom” and “DotPlot” functions.
Spatial transcriptomic sequencing data acquisition and processing
We obtained ST-seq data from the GEO dataset GSE197023, consisting of 6 HC and 6 lesional skin (LS) samples from AD patients [31]. The ST data were processed and analyzed using the “Seurat” package, similar to the methods applied for scRNA-seq data. Samples with fewer than 100 spot counts were excluded. The filtered ST-seq data were then normalized using the “NormalizeData” and “SCTransform” functions. The top 5,000 HVGs were selected based on their consistent variability across datasets. Dimension reduction was performed using PCA on each sample individually before integration, using the “RunPCA” function. The Seurat objects were then integrated into a single ST dataset using the “SelectIntegrationFeatures”, “FindIntegrationAnchors”, and “IntegrateData” functions. Canonical correlation analysis (CCA) and “Harmony” were employed to correct for batch effects across samples. Afterward, clusters were identified using the “FindNeighbors” and “FindClusters” functions. These clusters were annotated based on marker genes identified in previous studies. Finally, the expression levels and spatial distribution of IL2RA were determined.
Gene expression analysis using integrated ST-seq and scRNA-seq data
Additionally, cell-type mapping of ST-seq data with scRNA-seq data was performed using the “FindIntegrationAnchors” and “TransferData” functions. Cell types within the ST data were identified using the “CreateAssayObject” function. The expression levels, as well as the cellular and spatial distribution of IL2RA, were determined.
Results
Research design
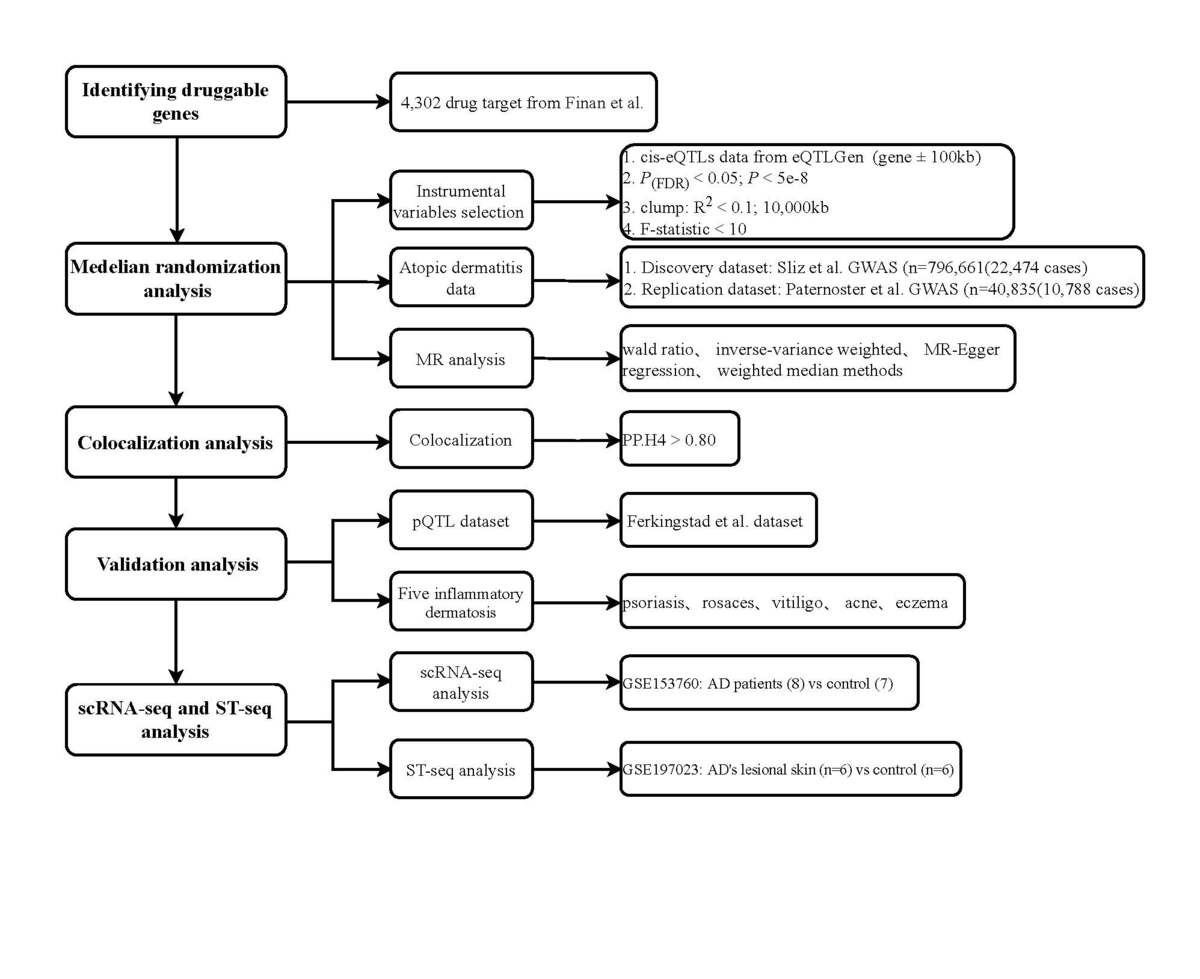
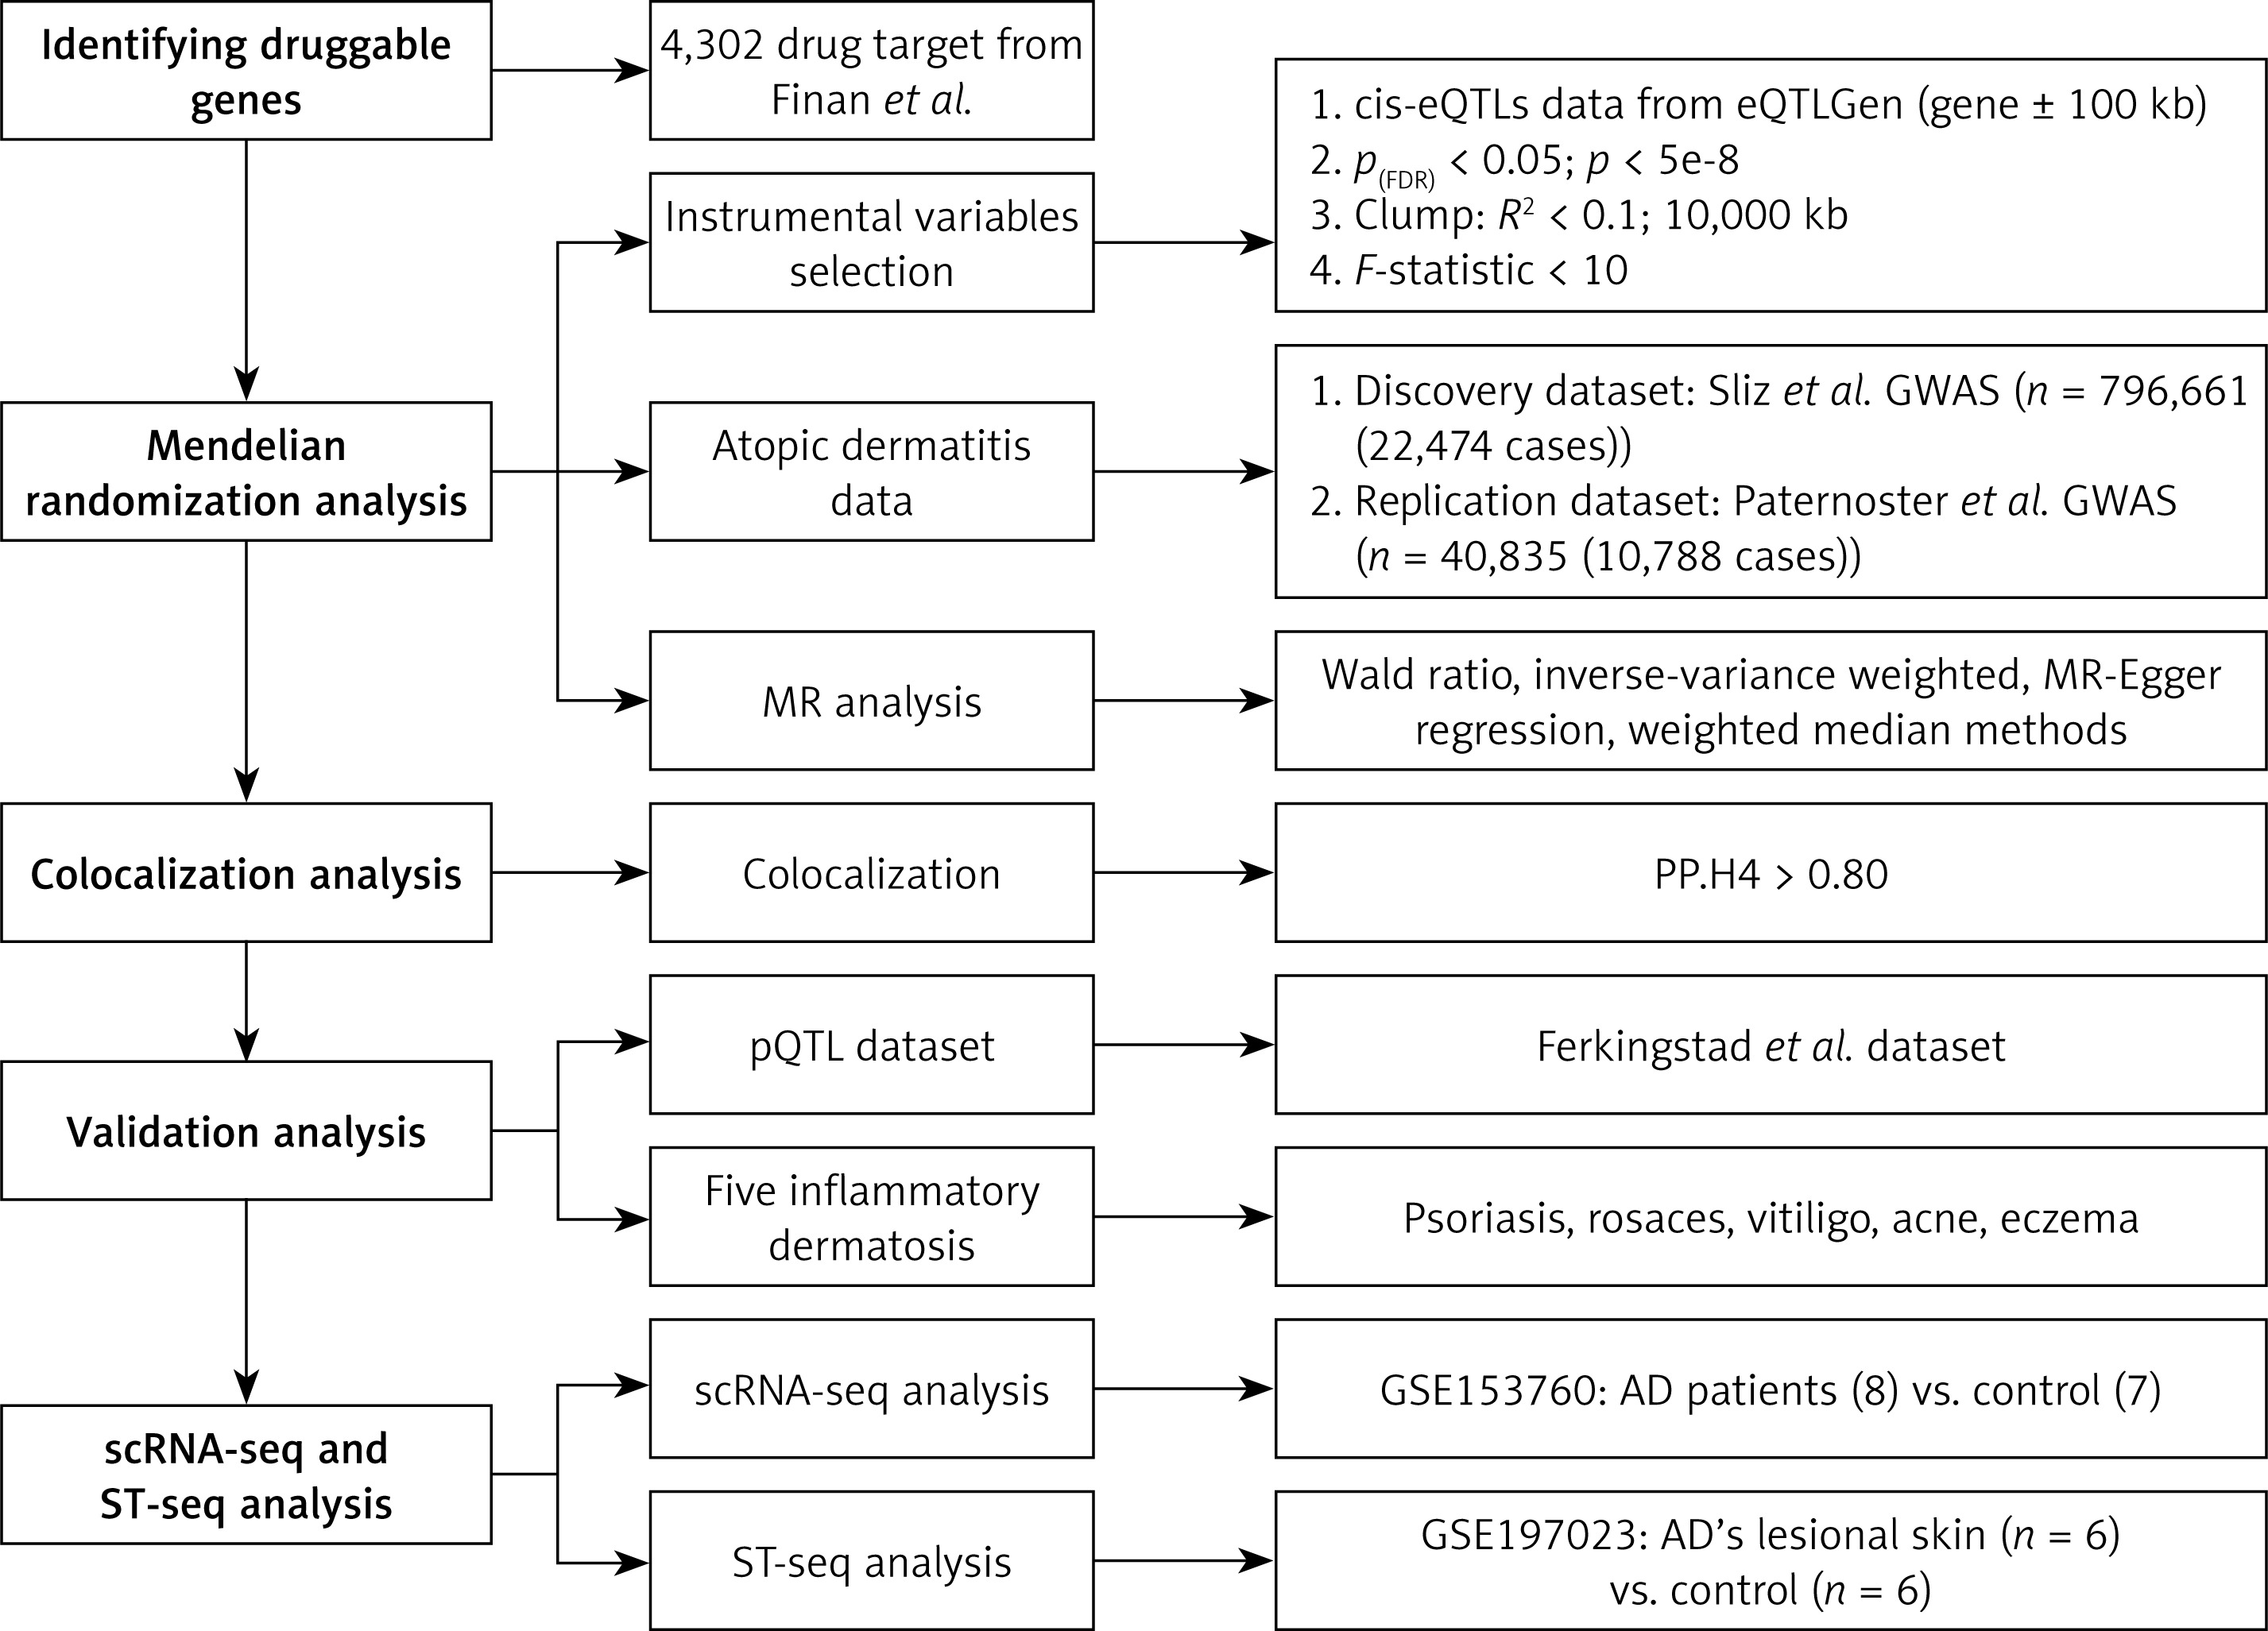
The study design consisted of six consecutive analytical steps (Figure 1). First, druggable genes were identified. Then, appropriate IVs for these genes were determined. Following that, MR analysis of the gene expression-AD relationship was performed in both the discovery and replication cohorts. Additionally, colocalization analysis was carried out to detect common causal variations. Furthermore, the validation process used pQTL datasets and conducted cross-disease MR/colocalization analyses involving five additional inflammatory dermatoses. Additionally, druggability and the progress of clinical development of drugs were assessed. Finally, candidate gene expression profiles were characterized with scRNA-seq and ST-seq analysis.
Discovery cohort findings
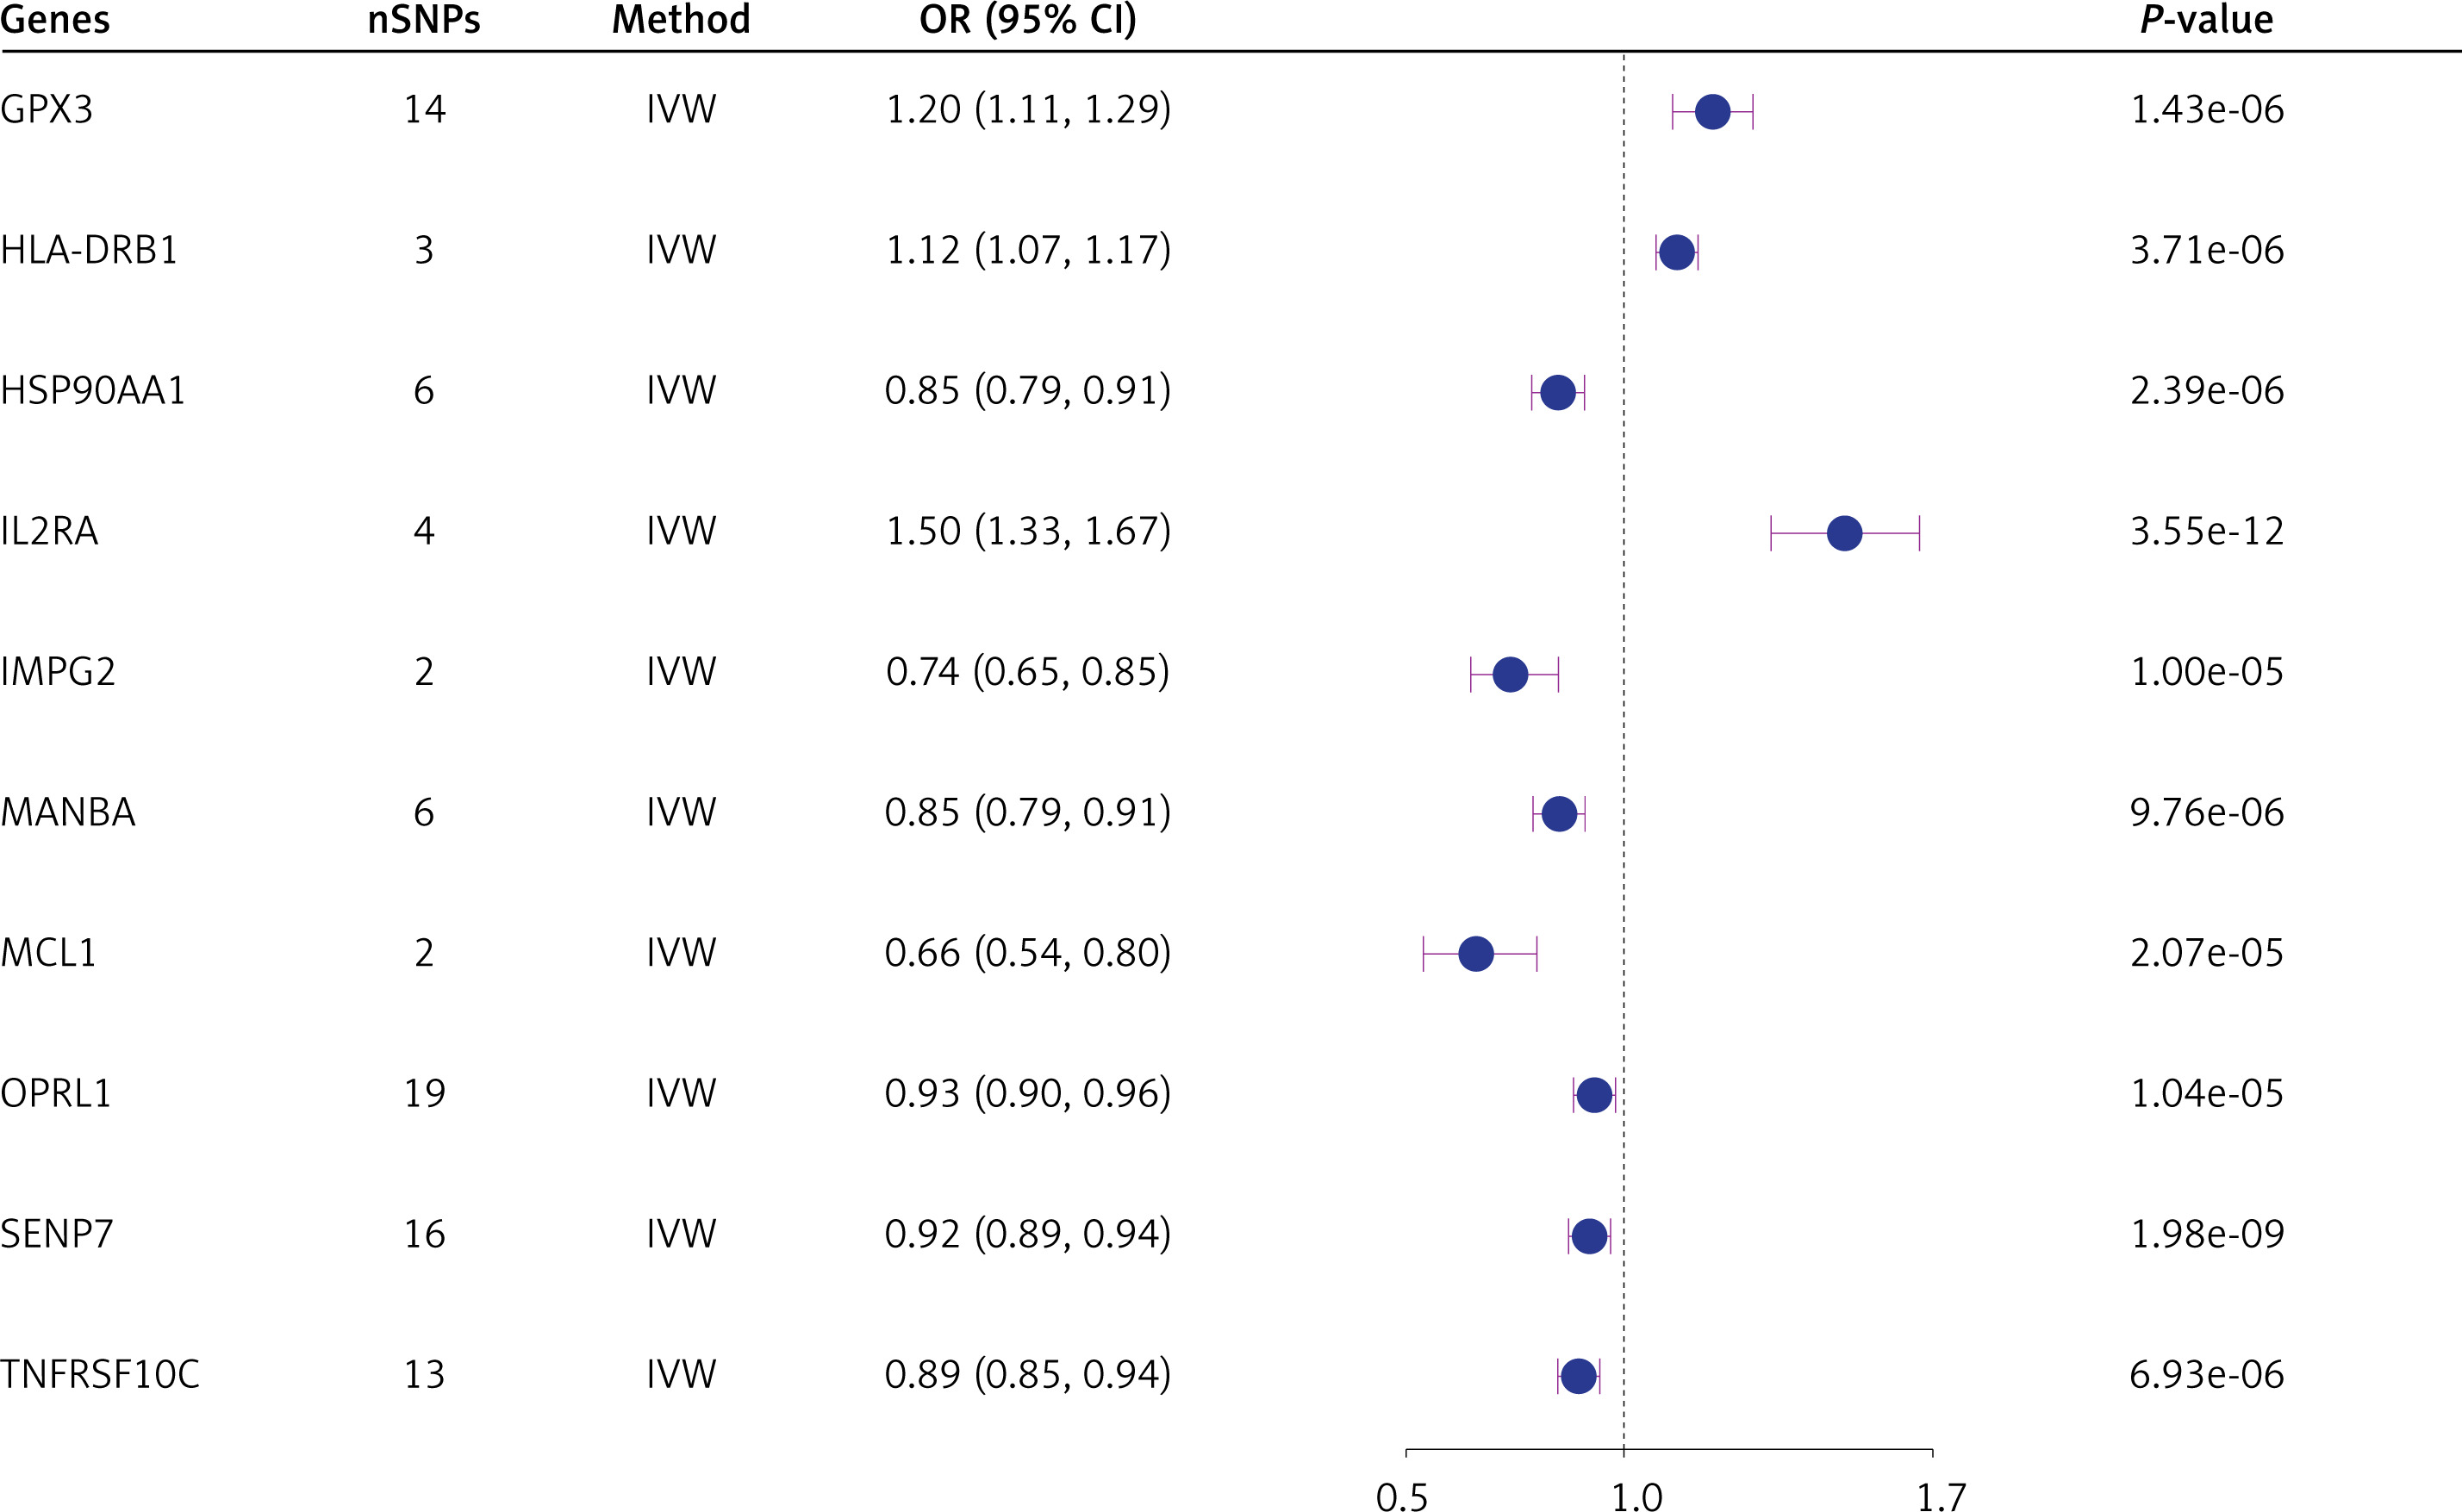
Ultimately, the MR analysis results for 2,316 druggable genes were obtained. MR research found ten genes that were strongly linked to the risk of AD (Figure 2). Among these, the expression of the druggable genes GPX3, HLA-DRB1, and IL2RA was associated with an increased risk of AD (OR = 1.20; 95% CI: 1.11, 1.29; p = 1.43e-6; OR = 1.12; 95% CI: 1.07, 1.17; p = 3.71e-06; OR = 1.50; 95% CI: 1.33, 1.67; p = 3.55e-12 [IVW]) (Figure 2). The expression of the druggable genes HSP90AA1, IMPG2, MANBA, MCL1, OPRL1, SENP7, and TNFRSF10C has an inhibitory effect on the risk of AD. No association between the expression of the remaining druggable genes and the risk of AD was detected (p > 2.16-05) (Figure 2). For the 10 significant druggable genes identified above, our analyses showed no evidence of heterogeneity among the IVs (Q_pval > 0.05). Furthermore, MR-Egger intercept tests confirmed the absence of significant pleiotropic effects (Pleiotropy_pval > 0.05) (Supplementary Table SIV).
Replication cohort validation
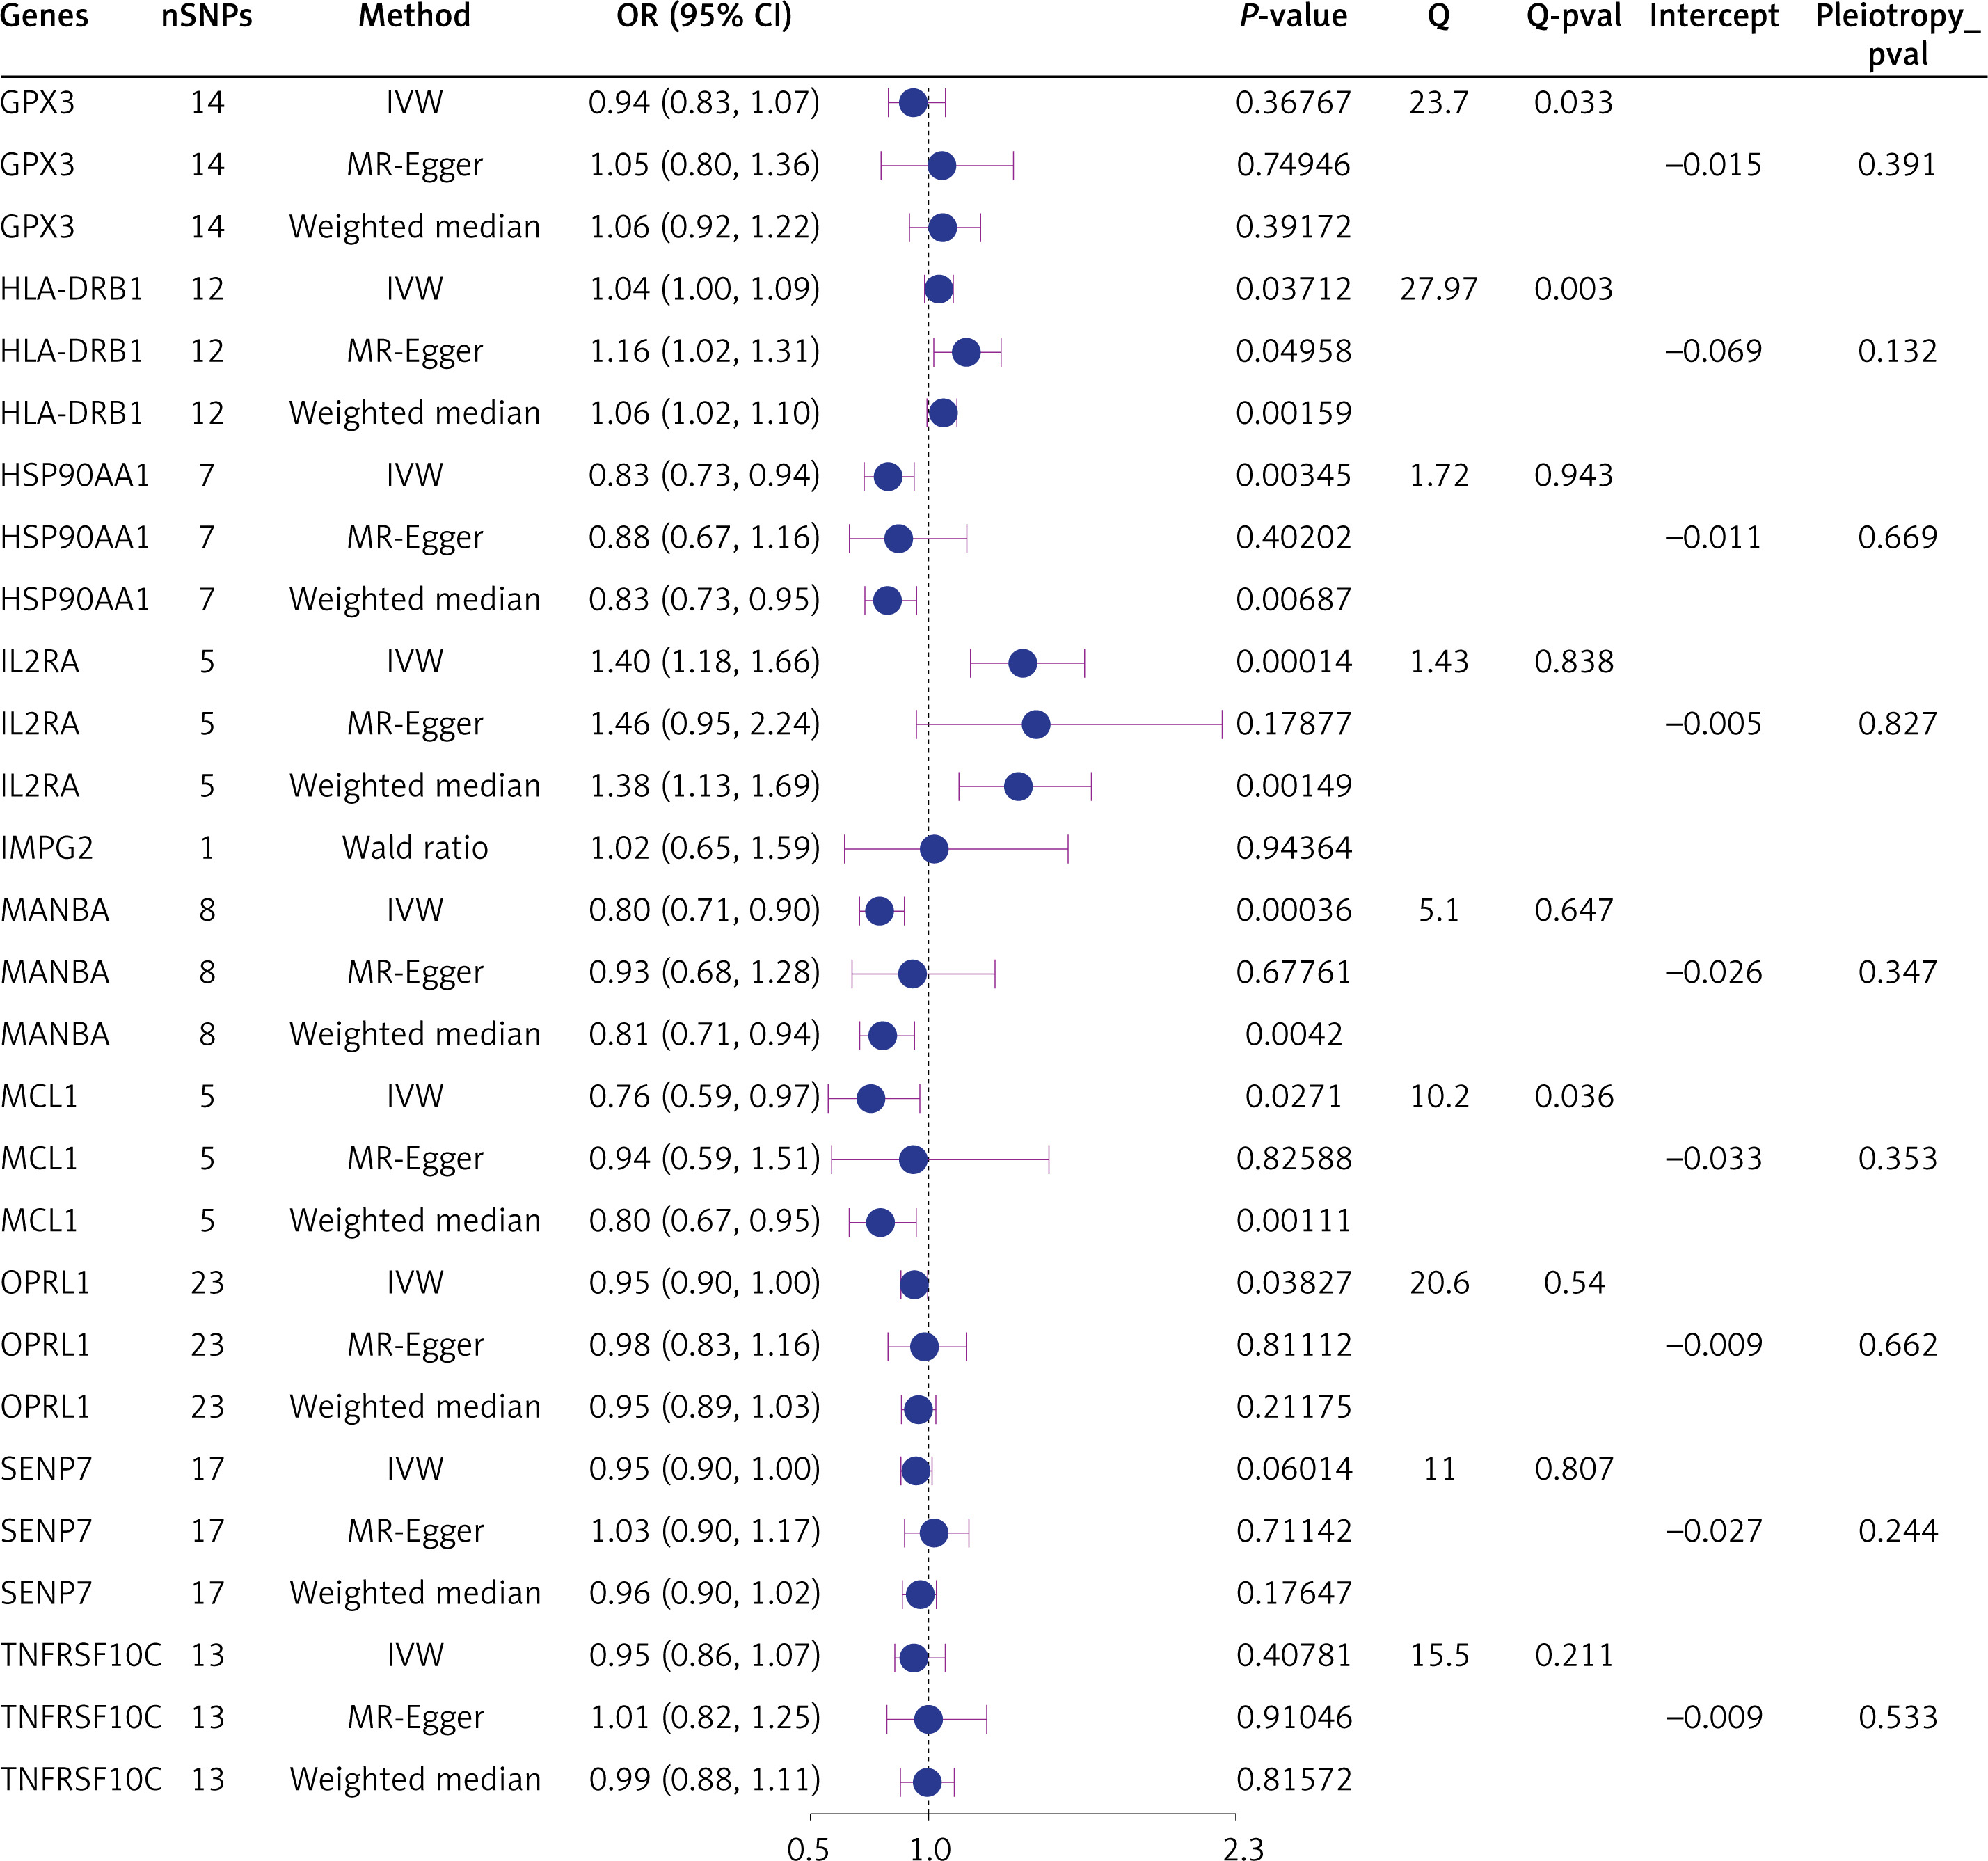
We validated the ten significant druggable genes in an independent AD cohort. The IVW results showed that expression of three druggable genes (HSP90AA1, IL2RA, and MANBA) remained significant after Bonferroni correction (p < 0.005, 0.05/10 genes), consistent with the discovery dataset (Figure 3). Nominal significance was observed in the expression of the druggable genes HLA-DRB1, MCL1, and OPRL1 (p < 0.05 [IVW]) (Figure 3). While part of heterogeneity was observed (Q_pval < 0.05), the MR-Egger intercept test ruled out horizontal pleiotropy (Pleiotropy_pval > 0.05) (Figure 3).
Colocalization analysis
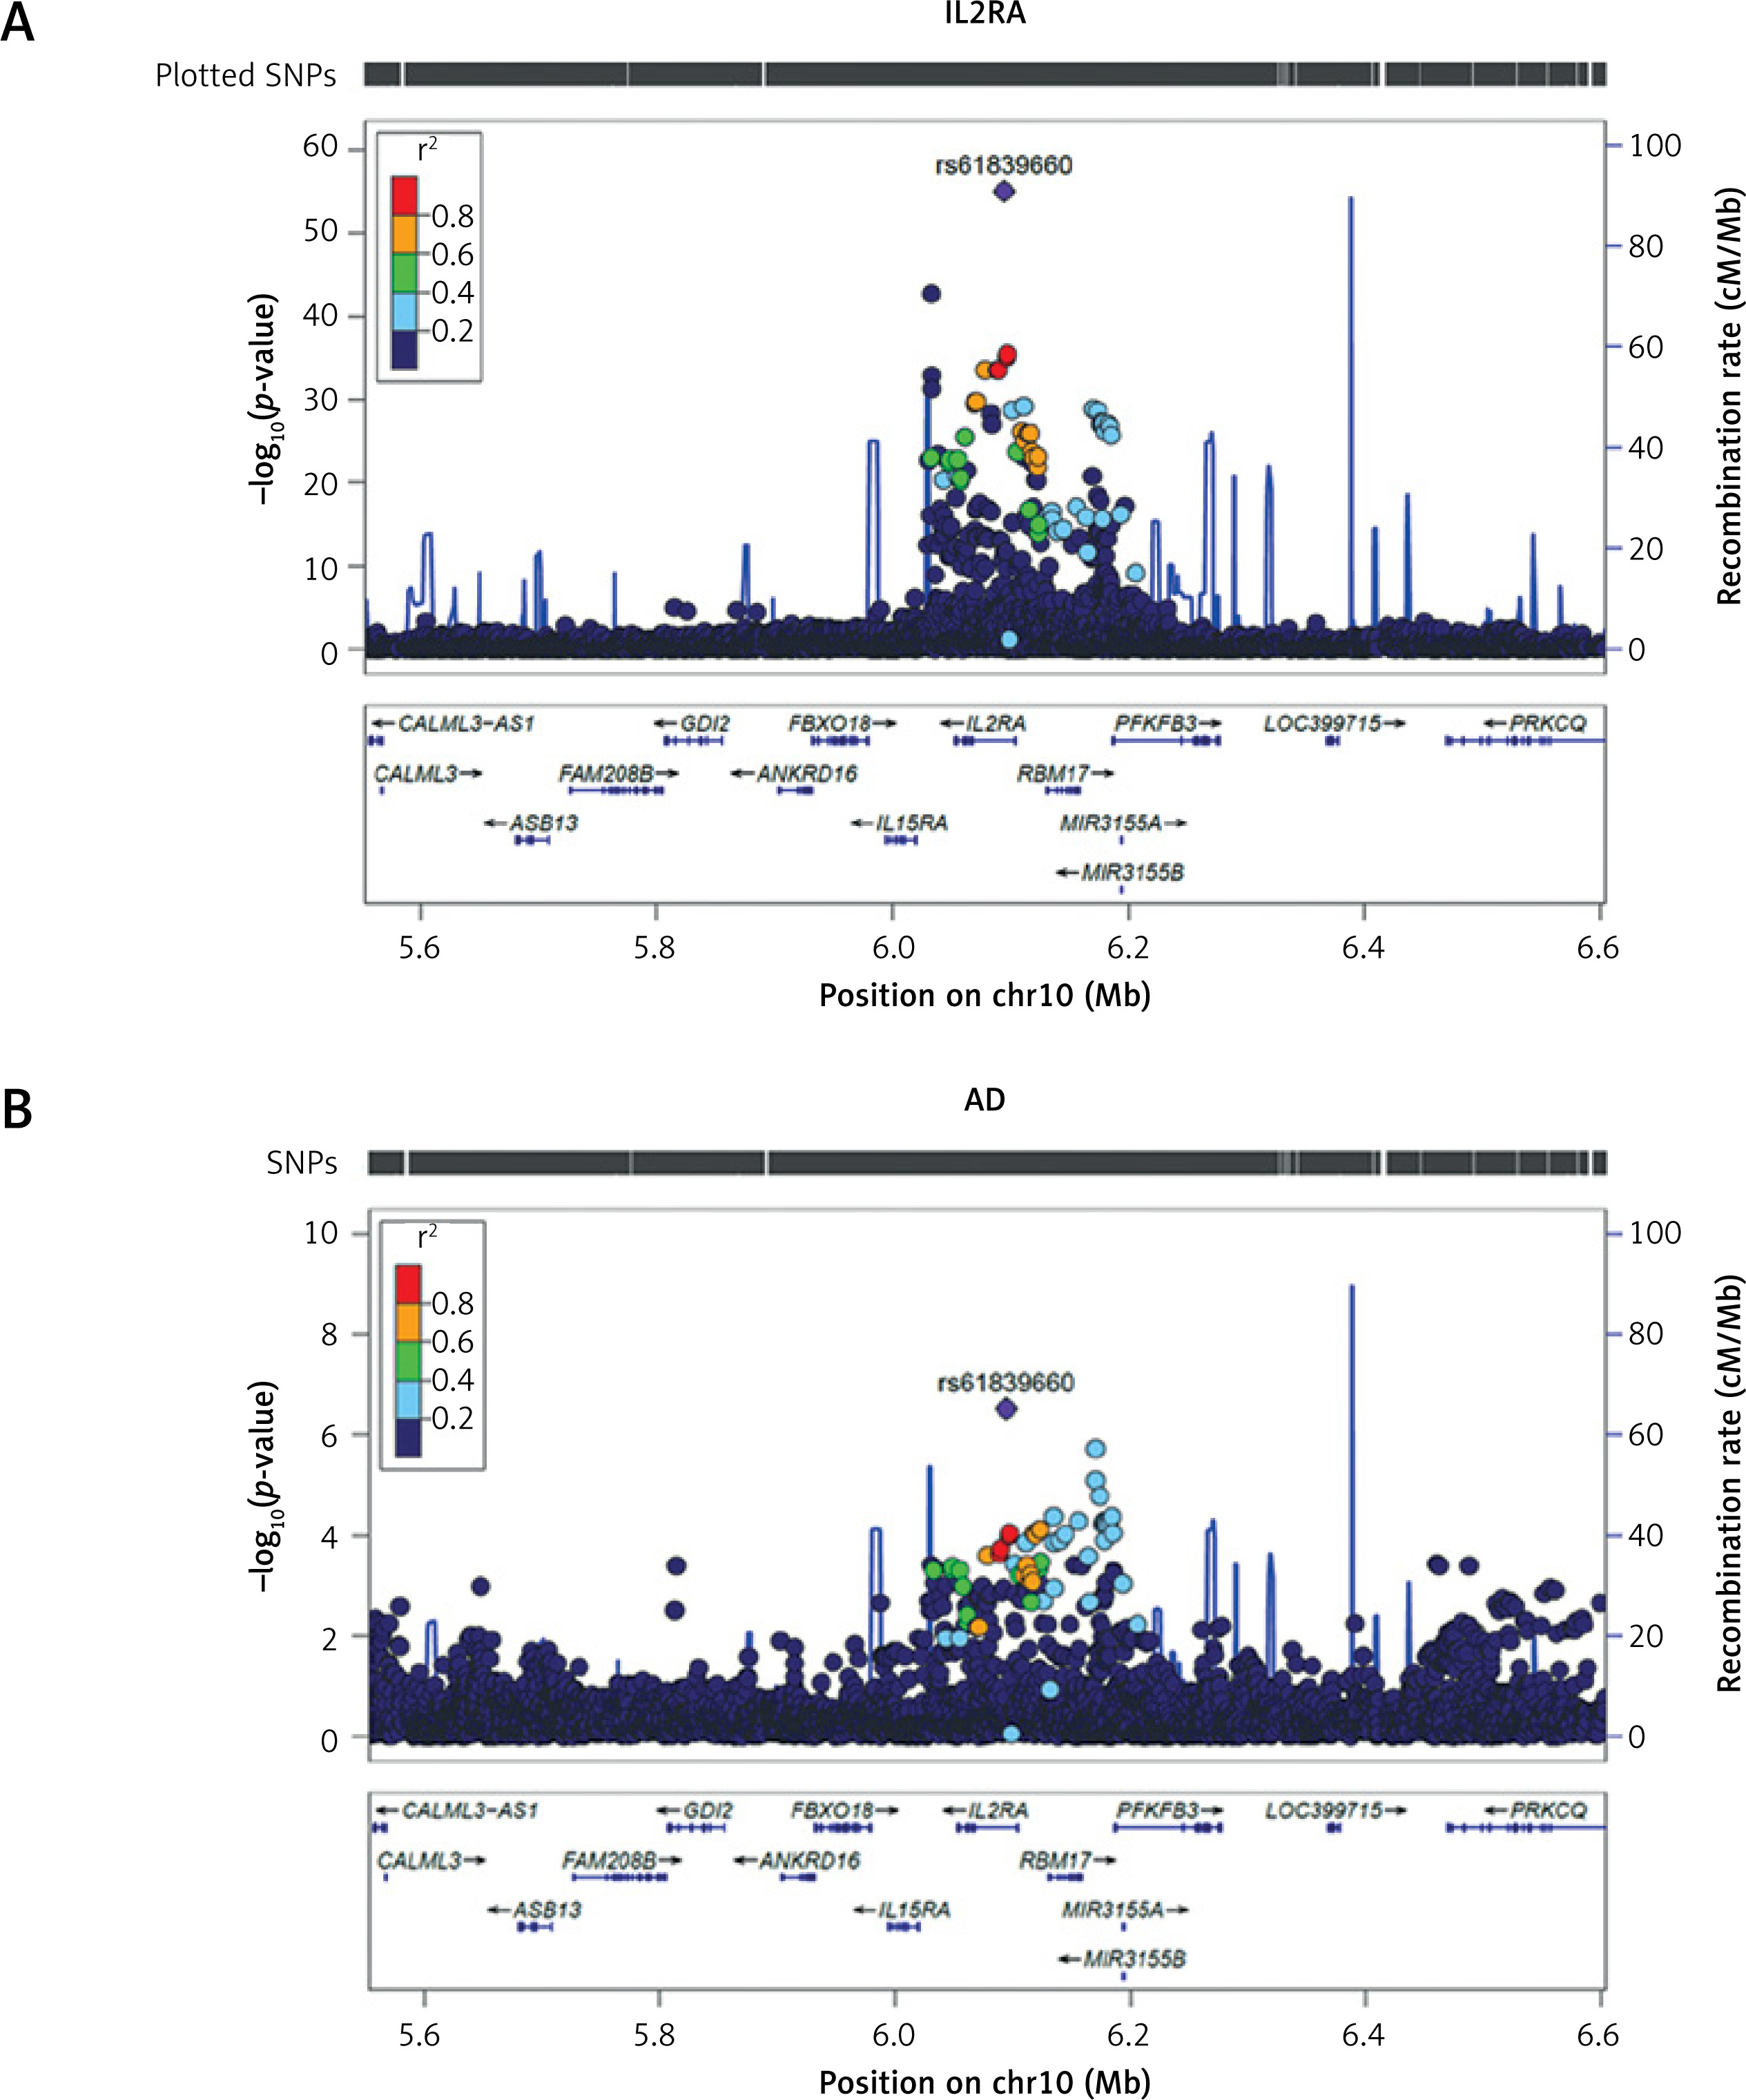
For genes significant in both discovery and replication cohorts, we examined shared genetic architecture with AD. IL2RA showed strong colocalization evidence (rs61839660, PP.H4 > 0.8) (Supplementary Table SIV; Figure 4), while HSP90AA1 and MANBA demonstrated no colocalization (Supplementary Table SV; Figure 4).
Figure 4
LocusZoom plot of the IL2RA locus (±500 kb) in relation to atopic dermatitis. Regional Manhattan plot showing SNP associations within the IL2RA locus. A – rs61839660 was used as a proxy for serum IL2RA expression. B – rs61839660 and its flanking 500 kb region on either side in atopic dermatitis (AD)
pQTL dataset
The finding revealed a statistically significant positive impact on the IL2RA protein-associated cis-pQTL (rs12722489) and the risk of AD (Supplementary Tables SVI, SVII), which aligns with the direction of impact in the primary discoveries.
Five inflammatory dermatoses
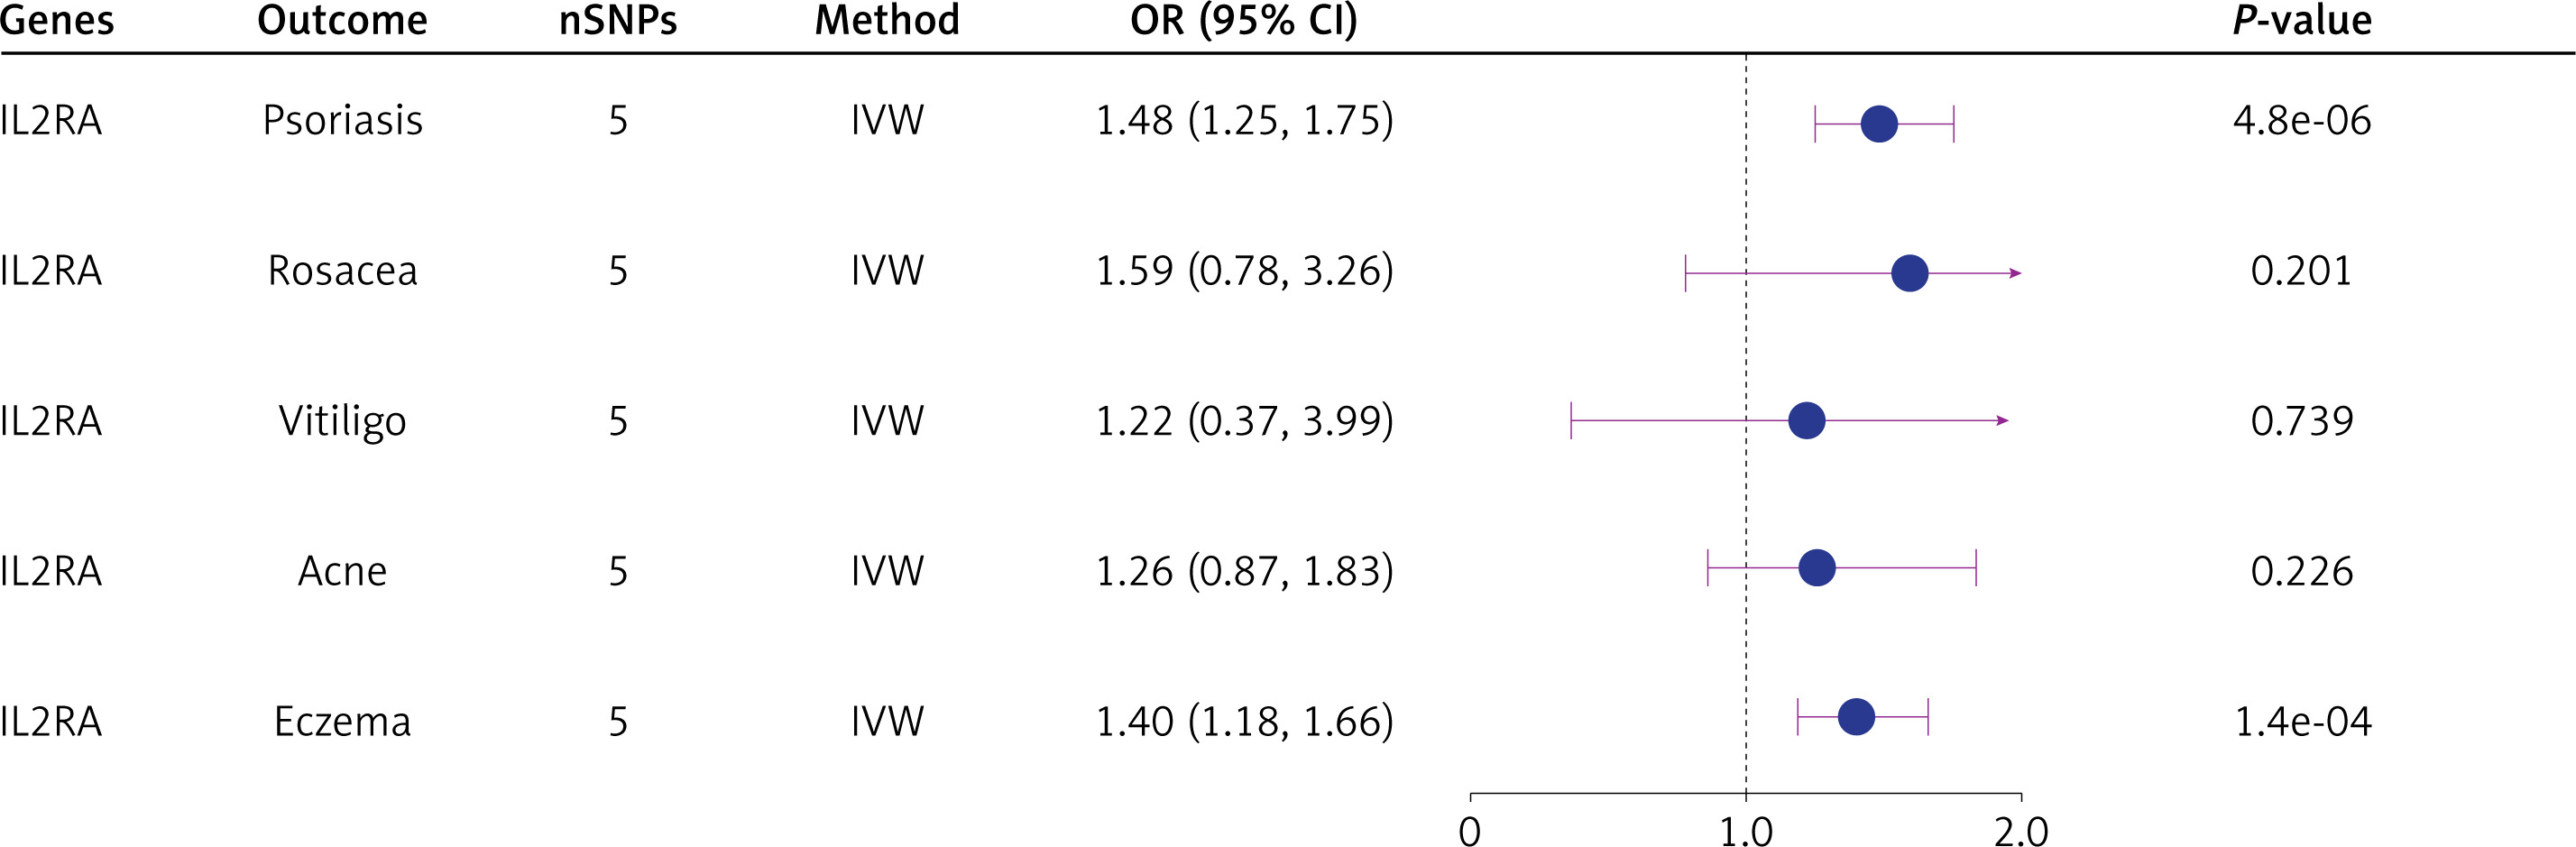
Elevated IL2RA expression increased the risk of psoriasis (OR = 1.48; 95% CI: 1.25, 1.75; p = 4.8e-06) and eczema (OR = 1.40; 95% CI: 1.18, 1.66; p = 1.4e-04), but showed no association with vitiligo, rosacea or acne (p > 0.05) (Figure 5). However, colocalization analyses found no shared variants between IL2RA and these dermatoses (Supplementary Table SVIII).
Identify druggability and clinical development status
A systematic review of DrugBank and ChEMBL databases revealed that most small-molecule drugs targeting IL2RA are currently in either approved or investigational stages (Supplementary Table SIX). The approval of aldesleukin has been granted for the treatment of metastatic renal cell carcinoma in adults. Denileukin diftitox has been approved to treat cutaneous T-cell lymphoma. Basiliximab is a monoclonal anti-C25 antibody (IL2RA) approved for prophylactic treatment of kidney transplant rejection. Furthermore, multiple IL2RA inhibitors are undergoing clinical trials, with a primary focus on organ transplant rejection (Supplementary Table SX).
Identification of IL2RA expression in AD based on scRNA-seq and ST-seq data
Current evidence indicates that IL2RA expression is associated with a high risk of AD. Therefore, we further investigated IL2RA expression at both cellular and tissue levels. After QC, a total of 33,162 cells and 33,408 genes were retained for further analysis (Supplementary Figures S1 A–D). Cells were then clustered and annotated using canonical markers (Figures 6 A–C, E; Supplementary Figures S1 E–G), including keratinocytes (KRT14 and KRT10), melanocytes (PMEL and MLANA), natural killer cells (GZMB and NKG7), T cells (IL7R and CD3D), phagocytes (LYZ and F13A1), mast cells (TPSAB1 and TPSB2), fibroblasts (COL6A2 and COL1A2), endothelial cells (RAMP2 and CLDN5), and smooth muscle cells (ACTA2 and TAGLN). We observed increased proportions of keratinocytes and phagocytes in AD compared to HC (Figure 6 D). IL2RA expression was noted in T cells and natural killer cells within AD samples (Figure 6 F), suggesting its involvement in AD-related immune modulation.
Figure 6
Identification of IL2RA gene expression in AD using scRNA-seq and ST-seq data. A–C – t-SNE plots showing the nine major cell types in all samples (A), HC samples (B), and AD samples (C). D – Bar plots illustrating the distribution of cell types in HC and AD samples. E – Bubble plots displaying the expression of the top two marker genes in each cell type. F – t-SNE plots depicting IL2RA gene expression in major cell types within HC and AD samples. G – Spatial scatter pie plots showing the annotated regions in skin tissue. H – Bubble plots presenting IL2RA gene expression in the annotated regions. I – Spatial scatter pie plots showing the annotated cell types in the capture location
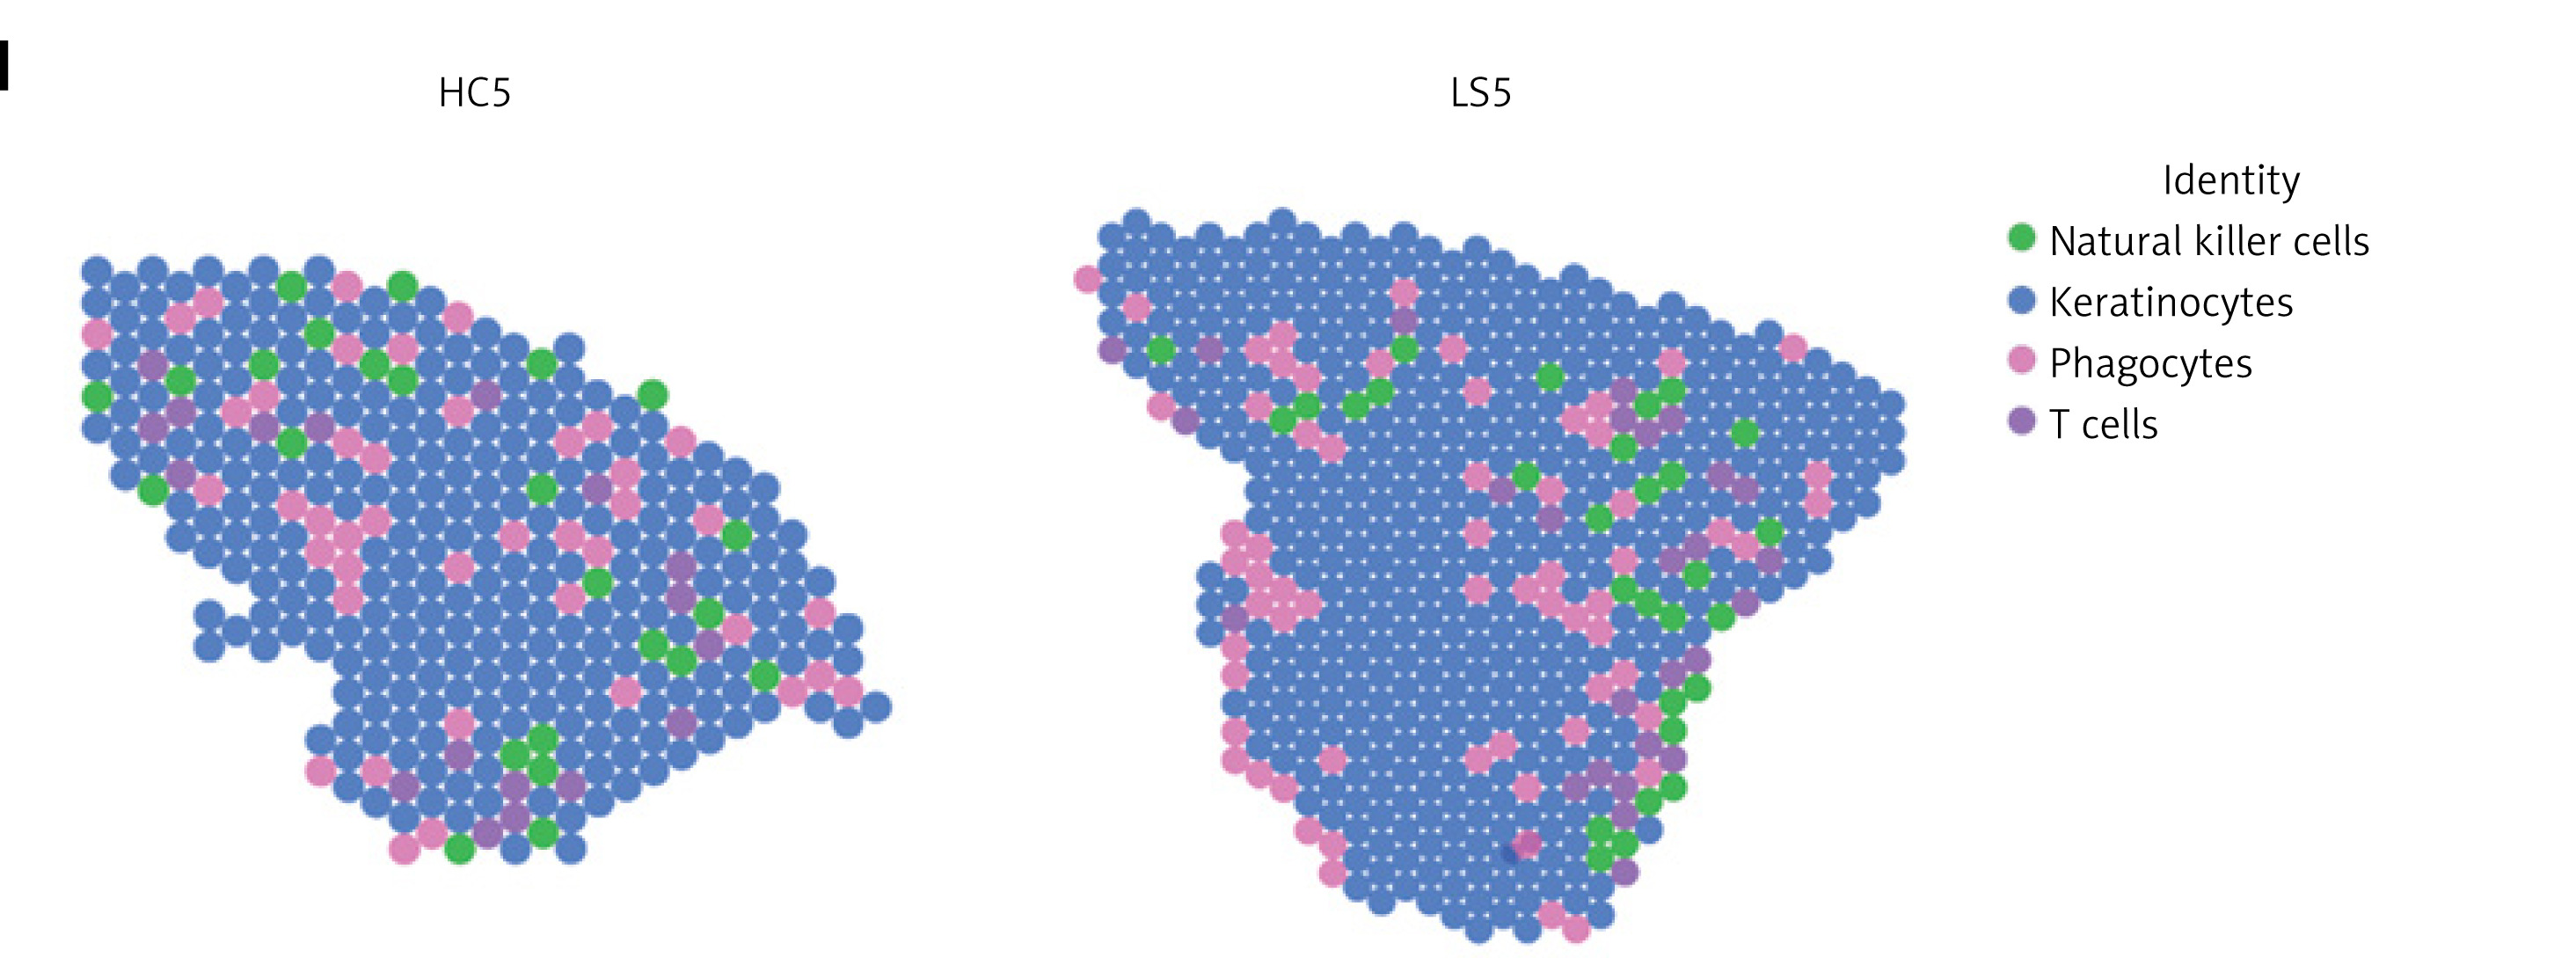
Furthermore, ST-seq data were obtained, processed, and clustered (Supplementary Figures S2 A, B; S3 A). A total of 7 regions were identified: upper epidermis (niche 5), lower epidermis (niches 3 and 18), leukocyte infiltration (niches 0, 4, 8, and 16), ECM/fibroblast (niches 1, 2, 6, 7, 9, 10, 14, and 15), sweat gland (niche 11), fibroblast (niche 12), smooth muscle cell (niche 13), and hair follicle (niche 17) (Figure 6G; Supplementary Figure S3 B). IL2RA expression was prominent in leukocyte infiltration zones (Figure 6 H). Following cell-type mapping, four cell types were identified: natural killer cells, keratinocytes, phagocytes, and T cells (Figure 6 I). Phagocytes and T cells were predominantly enriched in the leukocyte infiltration region, consistent with the scRNA-seq analysis.
Discussion
This study employed integrative multi-omics to systematically assess the causal significance of druggable genes in AD. We leveraged GWAS and eQTL data to conduct MR and colocalization investigations, identifying greater IL2RA expression as a potential cause of increased AD risk, with pQTL validation at the protein level. While MR associated higher IL2RA expression with a higher risk of psoriasis and eczema, colocalization analysis provided no evidence. Notably, scRNA-seq and ST revealed a relationship between IL2RA expression and T and NK cells in leukocyte infiltration zones in AD tissues.
IL2RA, namely interleukin 2 receptor a subunit, which is also known as CD25, represents the a chain of the interleukin-2 receptor, characterized by a short cytoplasmic region and low affinity. IL2RA is widely regarded as the predominant molecular marker for regulatory T cells due to its continuous and elevated expression on resting and activated regulatory T cells (Tregs). The receptor plays a role in the modulation of immunological tolerance through Treg activity. Tregs exert a suppressive effect on the activation and proliferation of autoreactive T cells. Currently, little is known about the underlying mechanism by which greater IL2RA expression contributes to increased susceptibility to AD. We propose the following potential hypotheses. IL2RA interacts with IL2 on CD8+ T cells, facilitating the generation of memory cytolytic T lymphocytes, which subsequently convert into memory T cells [32]. Memory T cells play a crucial role in the infiltration of inflammatory T cells in the development of AD [33]. Furthermore, IL2RA plays a crucial role in the formation and operation of Tregs. Regulatory T cells stimulate the initiation of innate inflammation following a breach in the skin barrier through the activation of TGF-β [34]. Additionally, therapeutic interventions targeting IL2RA may hold promise for AD treatment. The monoclonal antibody basiliximab, which specifically binds CD25, has demonstrated clinical efficacy in psoriasis management by suppressing hyperactive T cell responses. Given the shared pathophysiology of T cell dysregulation in both psoriasis and AD, this therapeutic approach warrants further investigation for potential application in AD treatment strategies [35, 36].
This study offers several significant advantages. It is the first to identify potential drug targets for AD using MR analysis. Second, drug research and development is a lengthy, resource-intensive process with a low success rate. By focusing on druggable genes, this study aims to enhance the efficacy of AD treatments and improve the success rate of drug development. Specifically, our research has identified IL2RA as a potential drug target for AD. Additionally, the integration of scRNA-seq and ST-seq data allowed us to provide biological evidence for IL2RA-related inflammation in AD. By using cis-eQTLs as IVs for druggable gene expression and combining GWAS and eQTL datasets for MR analysis, we addressed limitations commonly associated with observational studies and randomized controlled trials, such as small sample sizes, confounding, reverse causality, and feasibility issues. This approach also helps minimize the risk of horizontal pleiotropy, which can violate the assumptions of MR. Furthermore, our MR study explored the impact of IL2RA gene expression on five other inflammatory skin diseases, revealing potential alternative indications. Finally, we identified several targeted small molecule inhibitors currently under development, providing guidance for future drug development efforts targeting these pathways.
Several limitations of this study should also be noted. Foremost, excluding the potential impact of pleiotropy entirely poses challenges in MR studies. Furthermore, trans-eQTL SNPs (SNPs and gene centers > 5 Mb) may exert a significant influence on regulatory networks. However, our research merely concentrated on the cis-eQTLs of the druggable genes [19]. Although a Bayesian colocalization strategy was employed in this study under the premise that two traits are associated with a common genetic variant, the scenario involving multiple causative variants has not been extensively investigated [37]. Moreover, it is imperative to conduct clinical trials to assess the efficacy and safety of this putative drug target in the treatment of AD. Furthermore, the study was restricted to people of European descent, therefore constraining the applicability of the results to other populations. Finally, the findings necessitate basic experimental validation of IL2RA in specimens from AD patients, although ethical limitations in biopsy collection and limited access to untreated lesions present hurdles.
In conclusion, our study indicates a potential causal relationship between increased expression of the IL2RA gene and a greater risk of AD. Nevertheless, our investigation yielded no support regarding the impact of IL2RA gene expression on the remaining five inflammatory dermatoses. The present investigation highlights the potential of IL2RA inhibitors as therapeutic targets for the treatment of AD. Further research is required to enhance comprehension of the pathogenesis of AD, and it is imperative to assess the potential efficacy of IL2RA inhibitors in the treatment of AD by conducting preclinical and clinical studies.