Introduction
Prostate adenocarcinoma (PC) is the most common cancer among men, with the cancer mortality approximately 16% per year [1]. The mortality risk after radical prostatectomy could be predicted using a grading system based on histopathological examination of postoperative material [2]. The histologic grading of PC is still based on the standard Gleason score (GS) [3] and the prognosis is closely negatively correlated with this grading. In the 2014 International Society of Urological Pathology proposed a modification of the aforementioned scale, reorganizing the previous GS into a 5-grade system [4]. However, the proper grading may be difficult, because of the multifocal growth of PC.
Prostate adenocarcinoma development is related to various errors in DNA. One of the major DNA error types arises because of single or double-strand breaks (DSBs). These errors are repaired by specific molecular pathways in which DSB repair proteins such as MDC1 and TP53 are involved. In this process, the TP53BP1 is involved by the MDC1 protein, which causes activation of downstream effector molecules and the initiation of repair [5]. BRCA1 and BRCA2 proteins are also involved in DSB repair. Studies show that loss of their specific functions in this pathway causes genomic instability and is connected with higher risk of breast, ovarian and pancreas cancers and PCs [6–9].
Another type of DNA errors stems from changes in the base sequence of the DNA and is recognized by the DNA mismatch repair (MMR) pathway. It results from the incorrect DNA replication made by DNA polymerase, wrong linked bases or the impact of drugs [10, 11]. Mistakes in DNA are detected by the MutSα complex. This complex is a homodimer and consists of MSH2 and MSH6 proteins [10]. The assembly of the MutSα complex with the hMutLα complex, which consists of MLH1 and PMS2 proteins, creates the hMutLα-hMutSα-heteroduplex complex. A formed complex initiates repair of the mismatch defects [11].
Conventionally, the loss of MMR proteins is associated with the development of adenocarcinomas, mostly colorectal cancers and also squamous cell carcinomas [11, 12]. The germline mutation in one of the MMR genes, such as MLH1, MSH2, MSH6 or PMS2, leads to hereditary nonpolyposis colon carcinoma (Lynch syndrome) [13–15].
The accumulation of DNA mutations could be caused by dysfunction of DNA repair pathways. An interesting question is whether there is a correlation between MMR protein alterations and histological grade of cancer. The grading of PC is specific and well defined, due to the fact that the authors of the current study wanted to investigate the association between MLH1, MSH2, MDC1 and TP53BP1 and Gleason pattern (GP) and GS.
Moreover, the results of this study could indicate the relevance of this protein expression assessment as valuable information in deciding on follow-up or adjuvant treatment, e.g. adjuvant radiotherapy. On the basis of this study we supposed that alterations in TP53BP1 might have significant value for selection of the treatment after prostatectomy, e.g. between immediate adjuvant radiotherapy and hormone therapy.
Material and methods
Patients and tissue samples
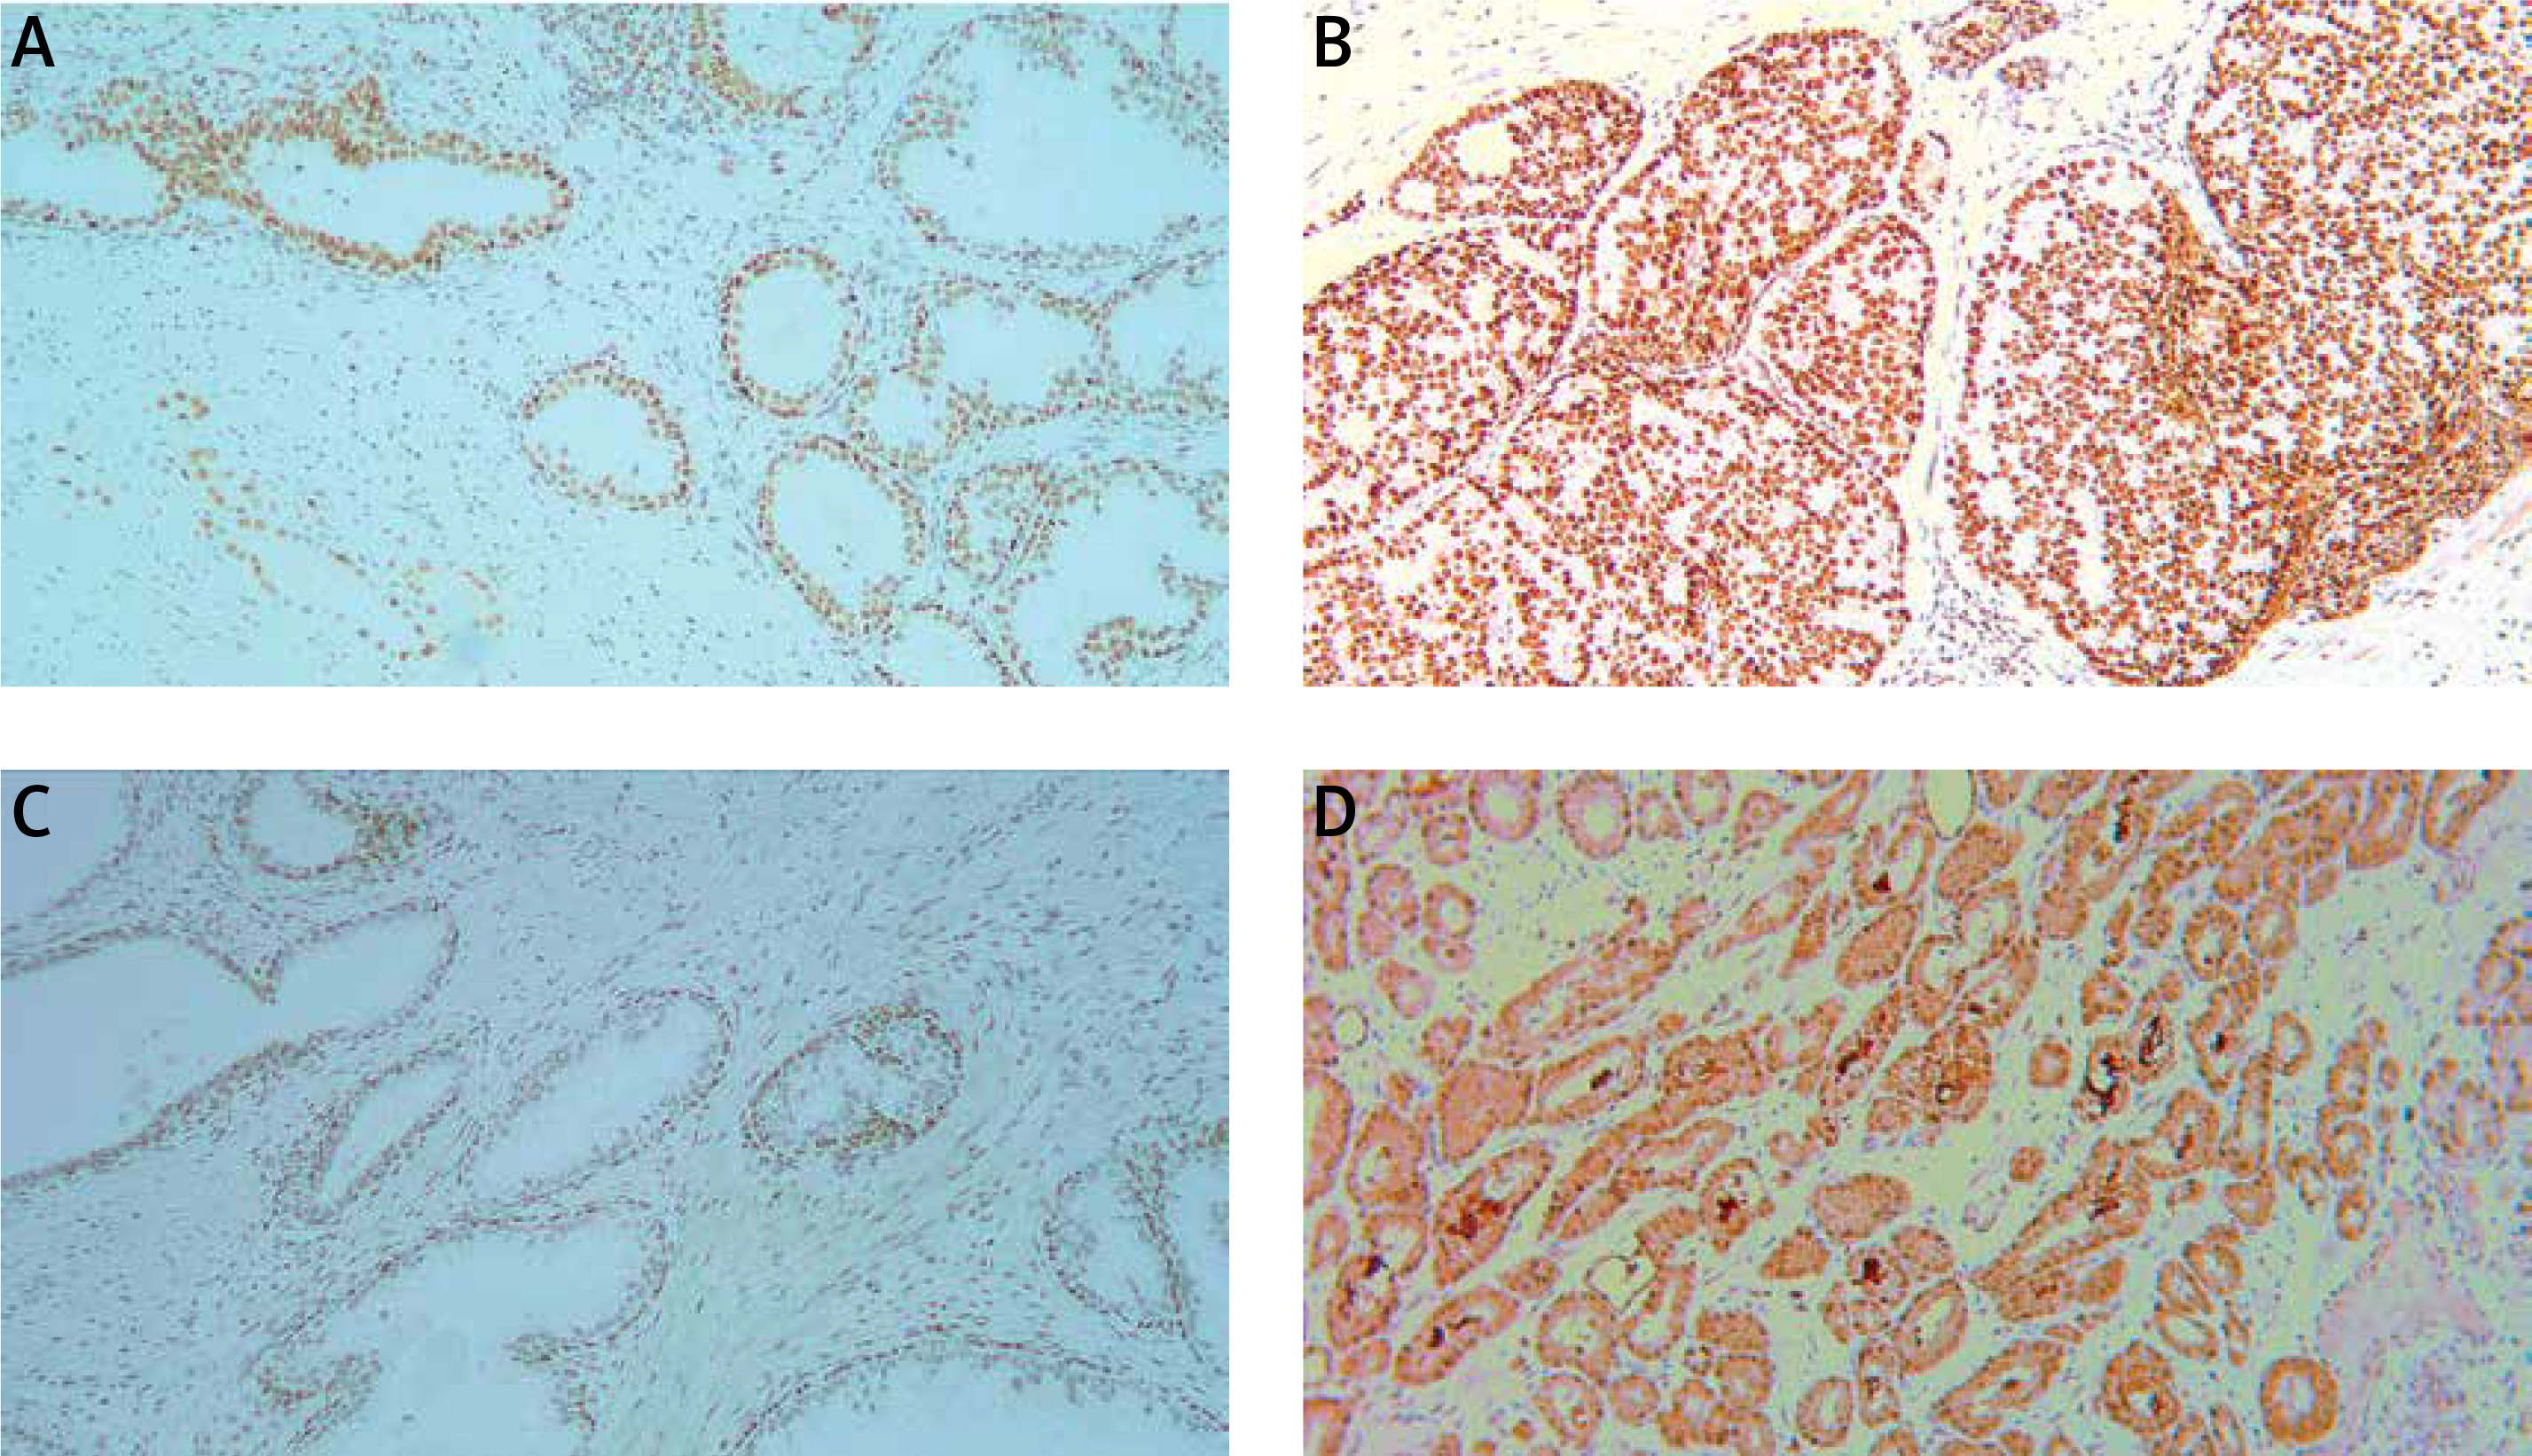
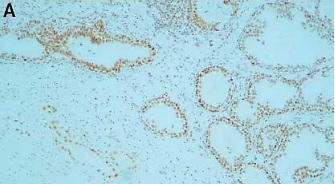
The study included 500 prostates with lymph nodes from patients who underwent radical prostatectomy for prostate carcinoma. The patients were aged between 52 and 78. All the material was fixed in 10% buffered formalin and processed according to the standard protocol. Finally, paraffin blocks were prepared. The inclusion criteria for material used in this study were the clear-cut diagnosis of PC that fits the Gleason classification criteria, and the presence of sufficient material for further work. Moreover, we specified the group and selected 26 patients in whom lymphadenectomy was performed during prostatectomy, N status was available and there were metastases to lymph nodes. Afterwards we selected a group of 26 patients with N status described as N0. Finally we created a group of the 52 most suitable cases. Subsequently, two independent pathologists verified specimens of those cases. We divided chosen specimens into 3 groups. The current study was focused on alterations of protein expression between different GS and GP, whereas for the further part of this study we needed a group with metastases to lymph nodes.
The first group included 29 specimens of GS 7, the second group 29 specimens of GS 8, and the third group 18 specimens of GS 9. Furthermore, we evaluated separately areas with the highest protein expression (hot spots) for GP 3, 4 and 5. For expression of the MDC1 protein, we evaluated 72 hot spots for GP3, 149 hot spots for GP4, and 13 hot spots for GP5. For expression of the TP53BP1 protein, we evaluated 62 hot spots for GP3, 116 hot spots for GP4, and 14 hot spots for GP5. For expression of the MLH1 protein, we evaluated 69 hot spots for GP3, 155 hot spots for GP4, and 10 hot spots for GP5. For expression of the MSH2 protein, we evaluated 77 hot spots for GP3, 133 hot spots for GP4, and 18 hot spots for GP5.
Selected places of specimens were evaluated by Remmele-Stegner immunoreactive score [16].
The expression of each examined protein among specimens was evaluated in reference to GS and GP.
Methods
The formalin-fixed, paraffin-embedded (FFPE) tissue specimens were cut into 3 μm paraffin sections, using a rotary microtome (Accu-Cut SRM 200; Sakura, Torrance, CA, USA). The sections were mounted on microscopic slides providing superior adhesion (SuperFrost Plus; Menzel-Glaser, Braunschweig, Germany). For deparaffinization, rehydration, and antigen retrieval, paraffin sections were pre-treated with a high-pH buffer (Epitope Retrieval Solution) in an automated PT-link system (Dako; Agilent Technologies, Inc., Santa Clara, CA, USA). Thereafter, immunohistochemical staining was performed using rabbit polyclonal anti-MDC1 (1 : 200, Sigma-Aldrich; HPA006915), rabbit polyclonal anti-53BP1 (1 : 300, Novus Biologicals; NB100-304), rabbit monoclonal anti-MLH1 (1 : 100, Abcam; ab92312), mouse monoclonal anti-MSH2 (1 : 200, BD Pharmingen; G219-1129) and using the visualization system EnVision FLEX + HRP (Dako; Agilent Technologies, Inc. Inc., Santa Clara, CA, USA) on an Autostainer Link 48 platform according to well-known protocols [17, 18]. Finally, the slides were counterstained with hematoxylin, dehydrated in an alcohol gradient, cleared in xylene, and mounted (Dako; Agilent Technologies, Inc.).
Antigen expression for each studied antibody was evaluated by the Remmele-Stegner immunoreactive score [16].
The expression of each examined protein among specimens was evaluated in reference to the GS and GP. Three sections for every case were chosen, after which 3 different fields of view were evaluated and the average of those results was calculated. Positive controls were performed by immunohistochemical staining on every specimen on its own tissue without cancer involvement. The power of magnification was ×20.
Statistical analysis
All statistical analyses were performed using Statistica version 13 (StatSoft) and Microsoft Excel 2007. The comparative studies were analyzed statistically using the nonparametric Kruskal-Wallis test. The p-value < 0.05 was considered statistically significant. The expression values of analyzed proteins were presented as the median and 25th and 75th percentiles.
Results
Association of MSH2 expression with Gleason score and Gleason pattern
In 97% of cases nuclear expression and in 68% of cases cytoplasmic expression of the MSH2 was revealed. Statistical analysis demonstrated a significant correlation between GP and nuclear expression of MSH2 (p = 0.004) (Figure 1 A).
Figure 1
Box plot of data with correlation between Gleason pattern and protein expression. A – Correlation between Gleason pattern and nuclear expression of MSH2 protein. B – Correlation between Gleason pattern and cytoplasmic expression of MLH1 protein
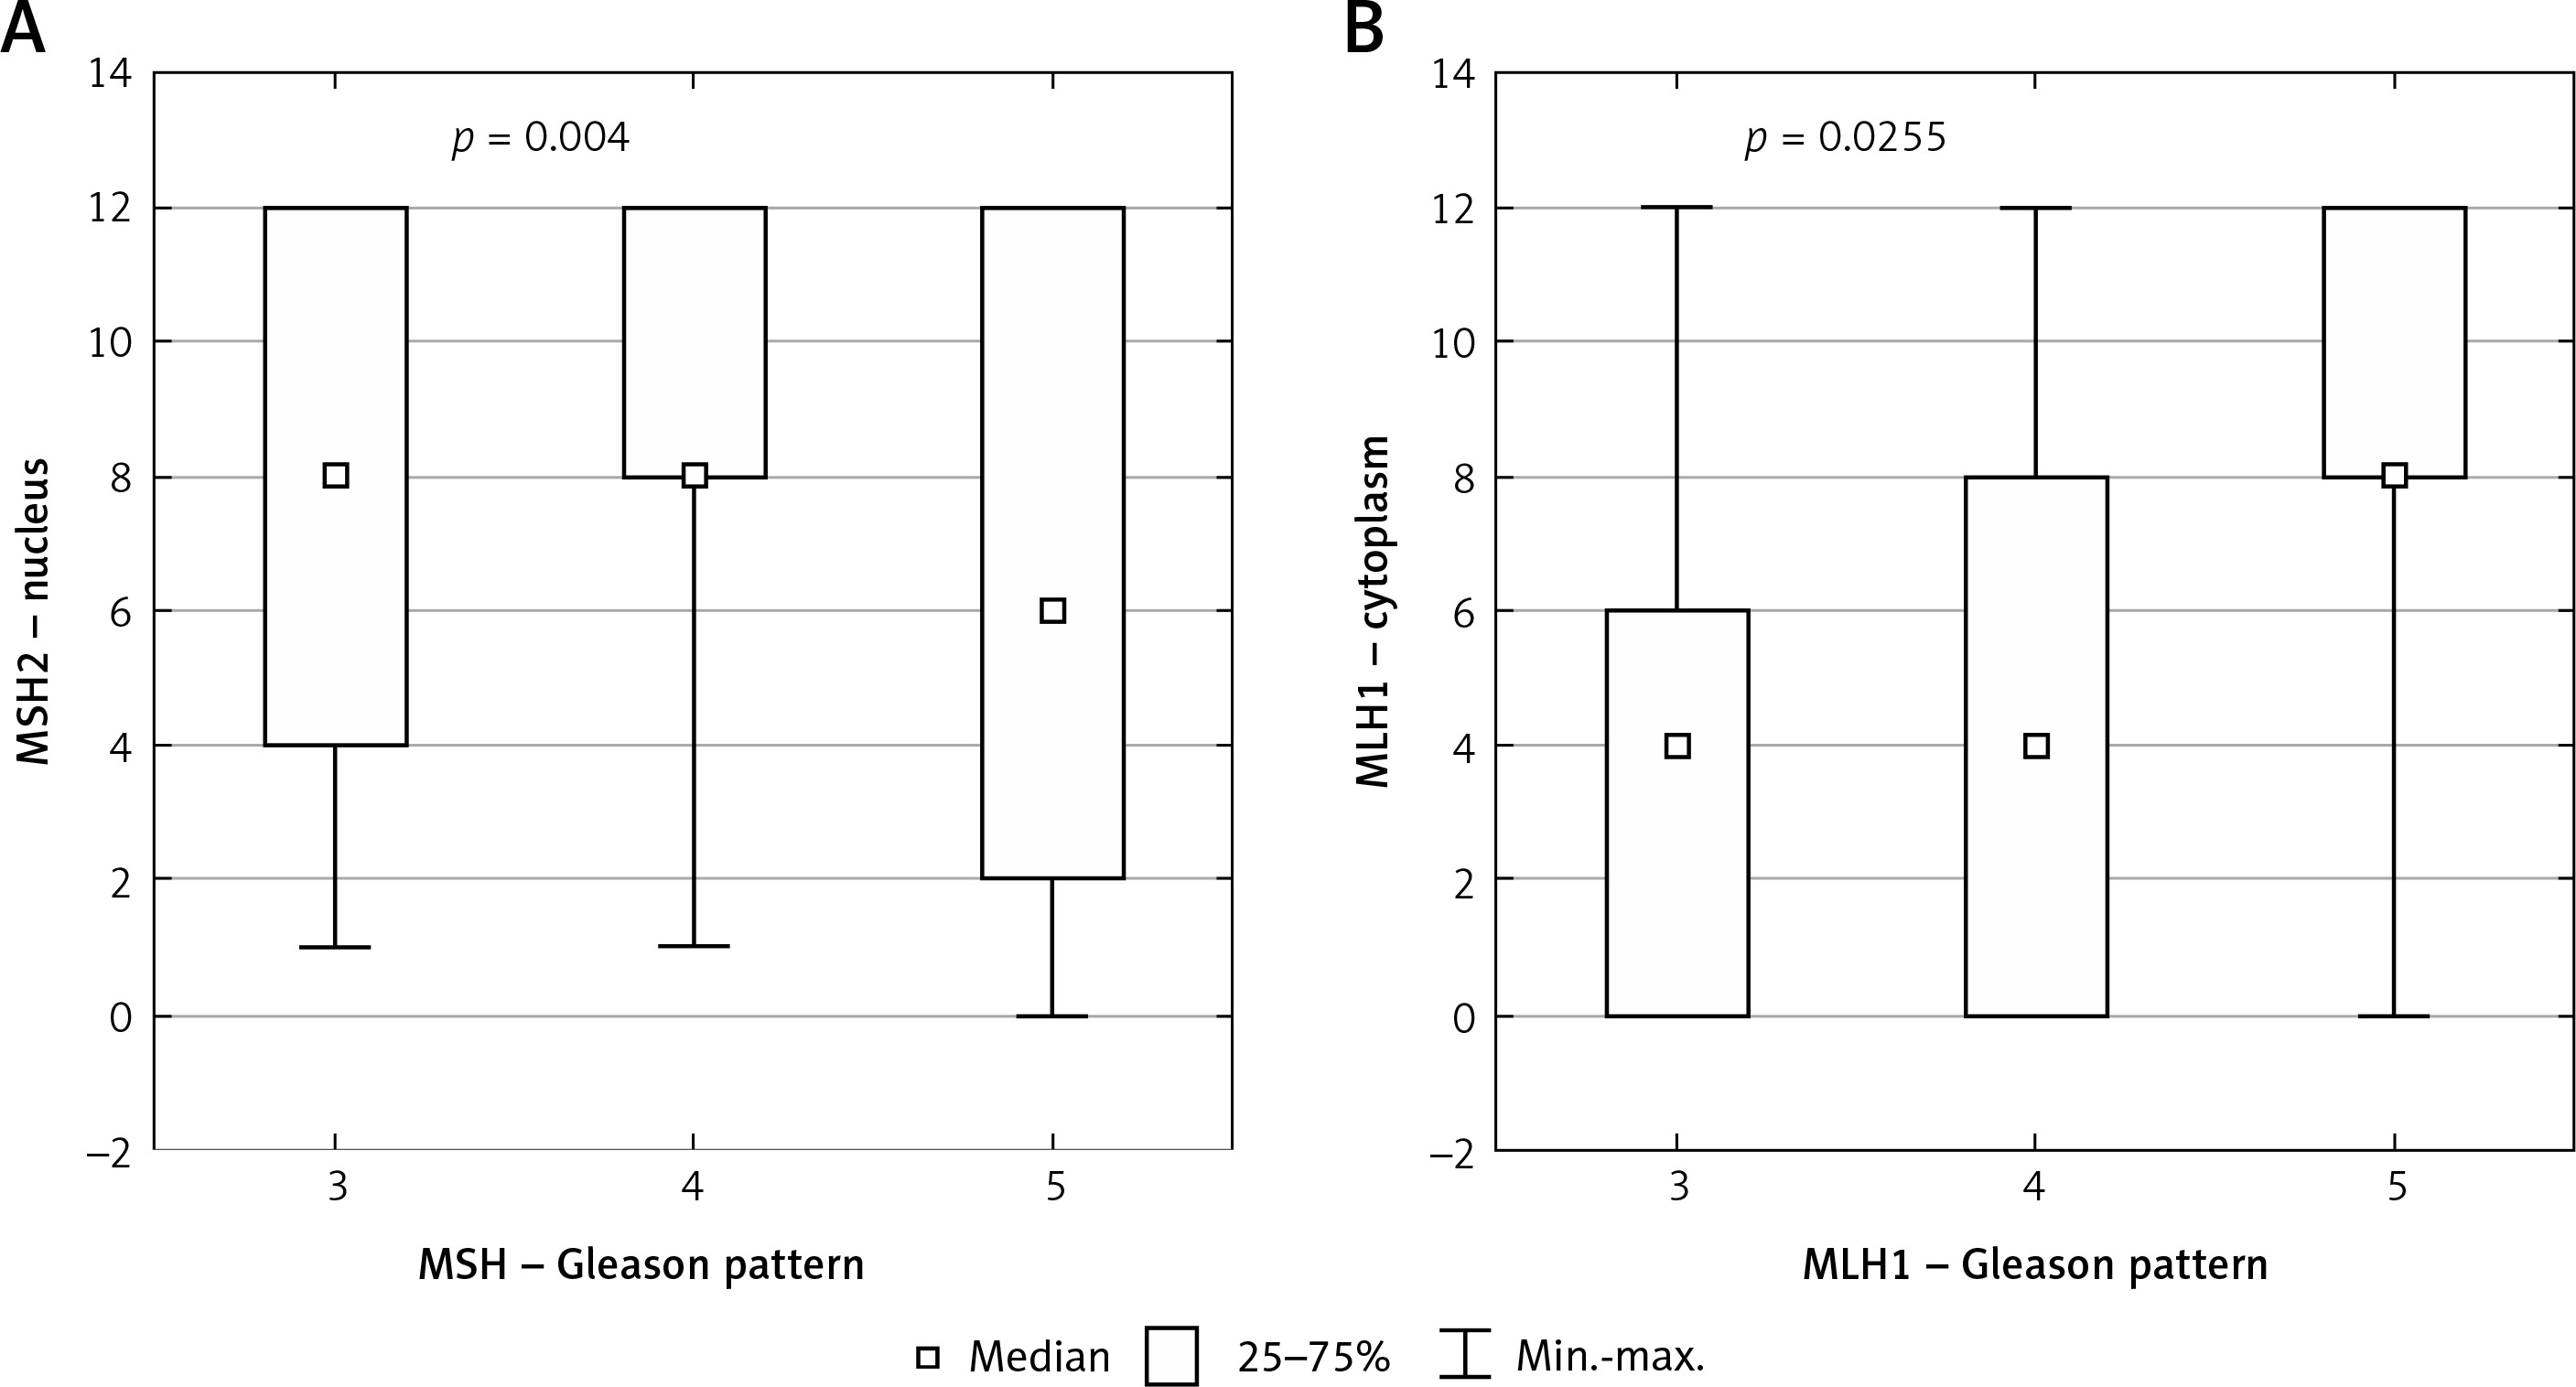
Statistical analysis did not show any significant correlation between cytoplasmic MSH2 level and GP (Table I).
Table I
Summarized medians and statistical significance of our results in reference to Gleason pattern
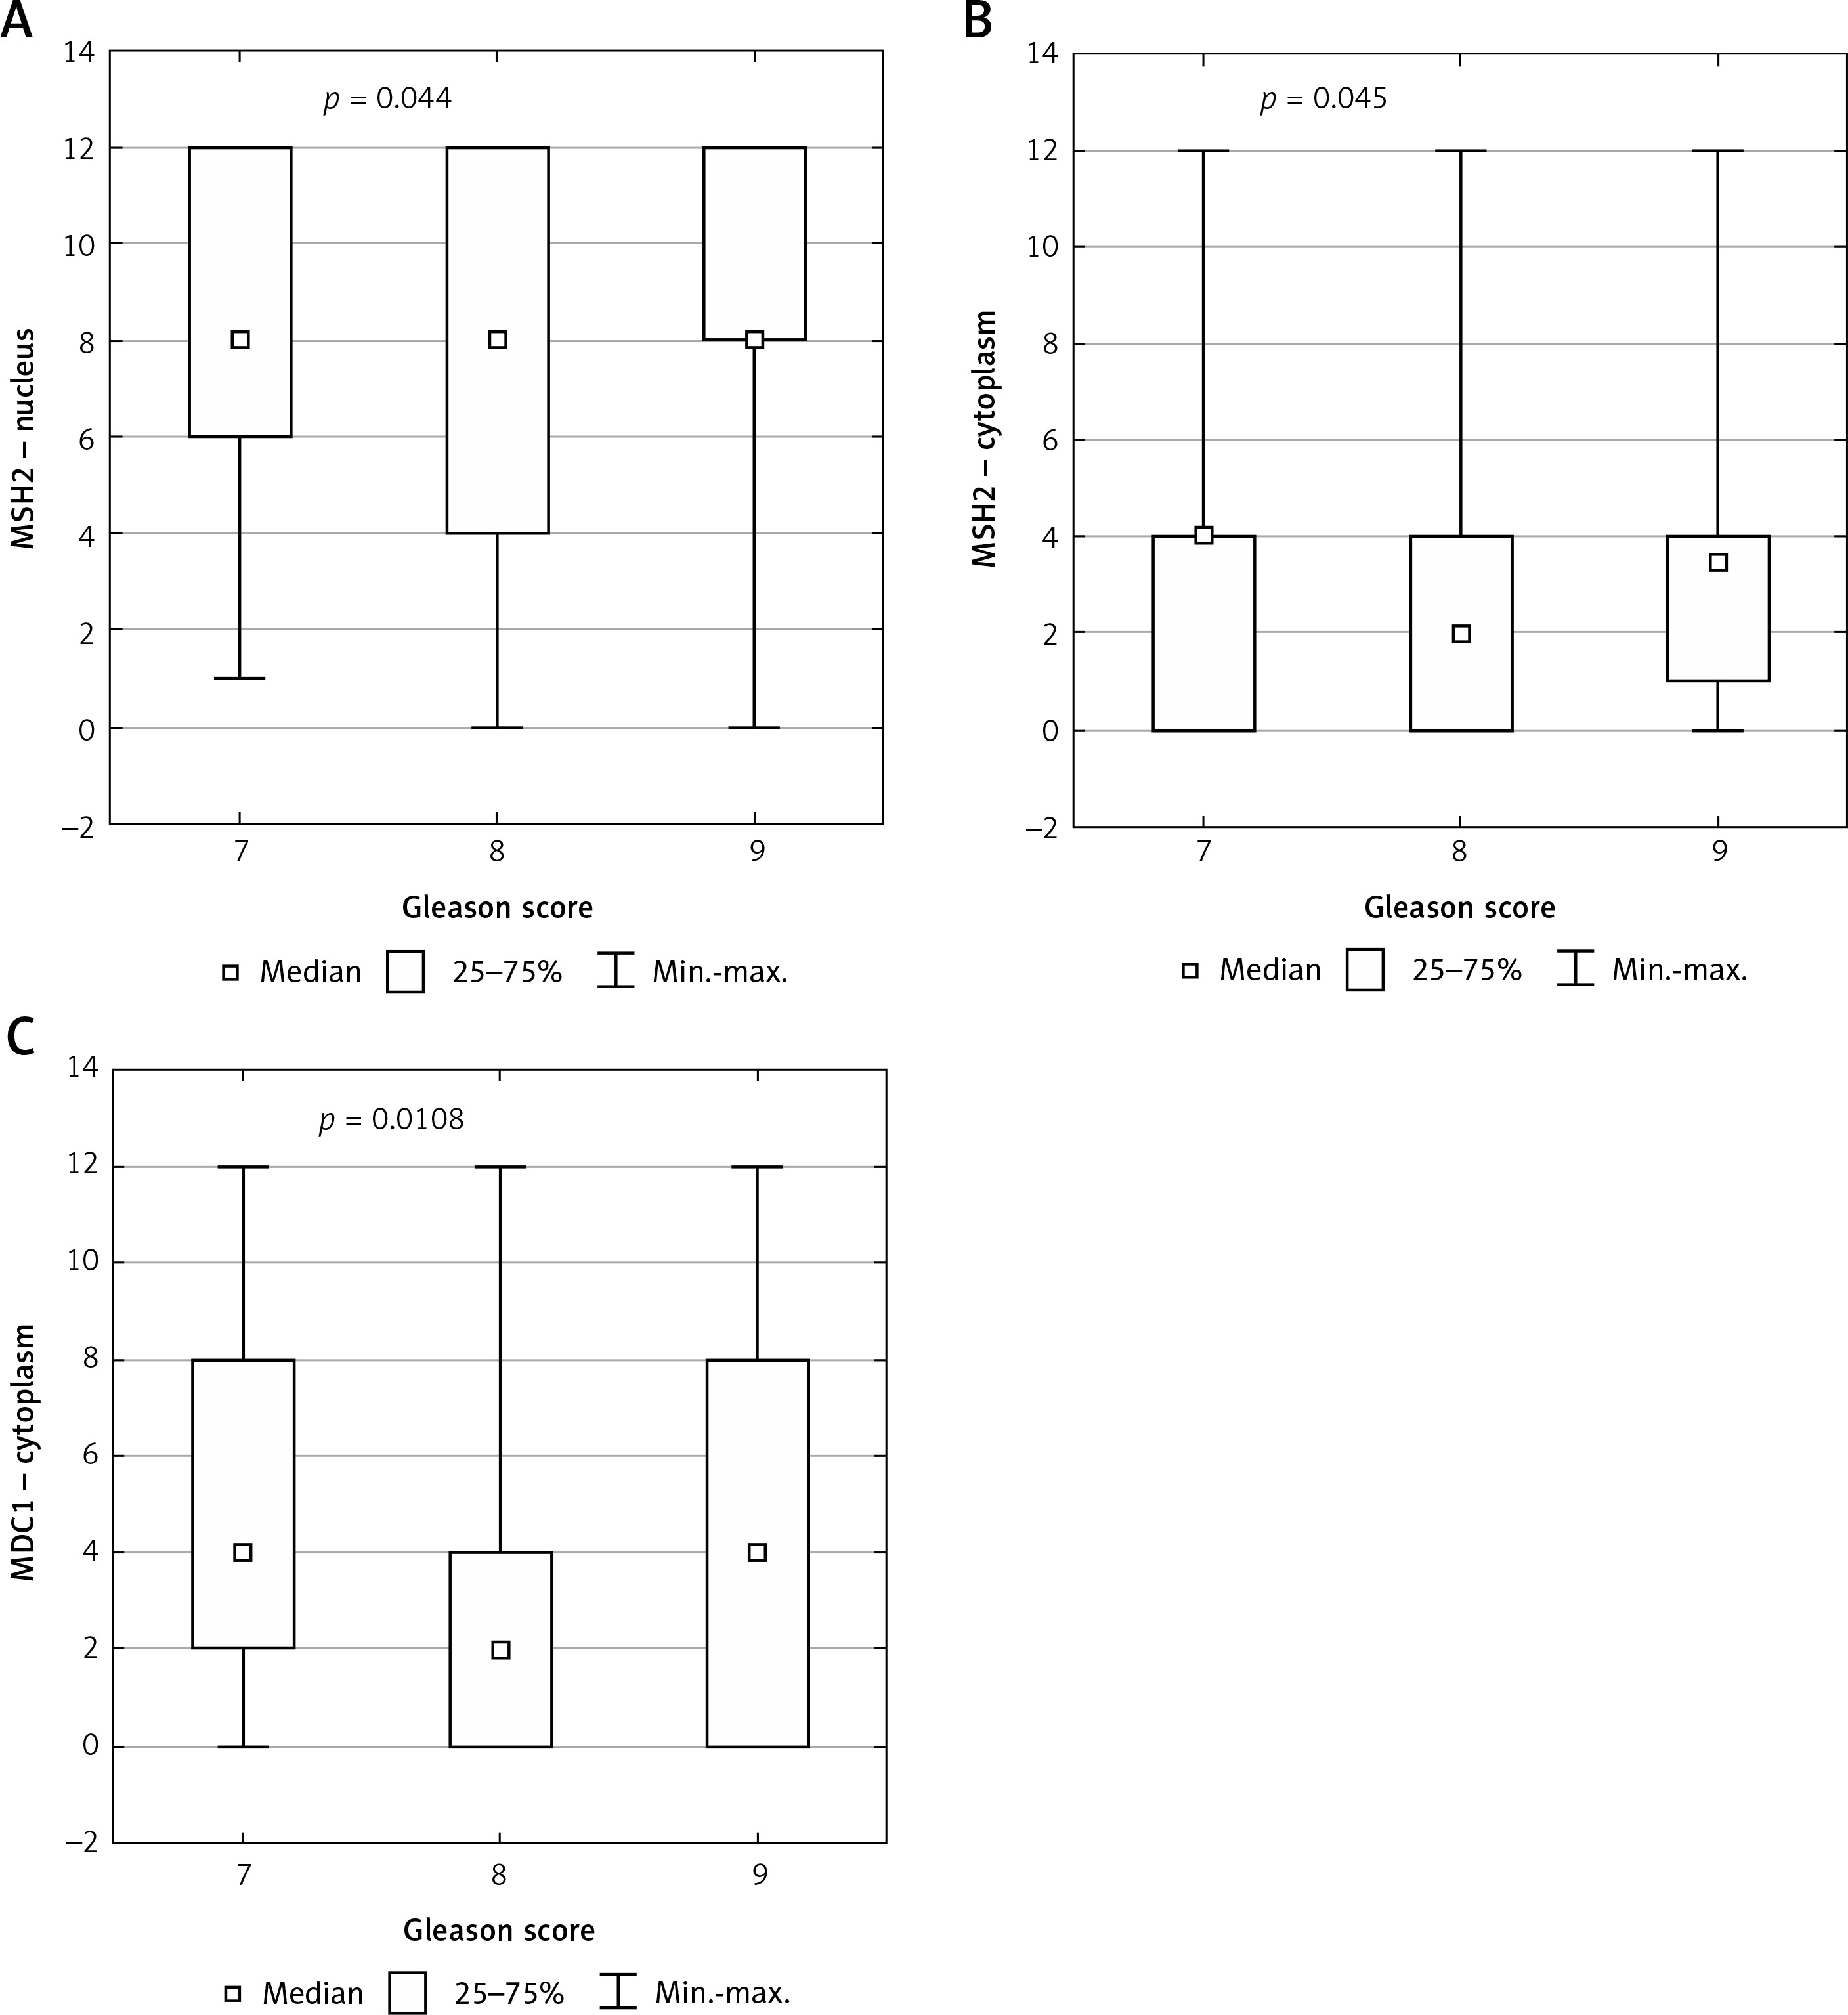
Statistical analysis showed a significant correlation between nuclear and cytoplasmic expression of MSH2 and GS (p = 0.044, p = 0.045 respectively) (Figures 2 A and 2 B respectively).
Figure 2
Box plot of data with the correlation between Gleason score and protein expression. A – Correlation between Gleason score and nuclear expression of MSH2 protein. B – Correlation between Gleason score and cytoplasmic expression of MSH2 protein. C – Correlation between Gleason score and cytoplasmic expression of MDC1 protein
Association of MLH1 expression with Gleason score and Gleason pattern
In 93% of cases nuclear expression and in 74% of cases cytoplasmic expression of MLH1 was revealed. Statistical analysis demonstrated no significant correlation between the level of MLH1 in nuclei with reference to GP.
Statistical analysis demonstrated a significant correlation between cytoplasmic expression of MLH1 and GP (p = 0.0255) (Figure 1 B).
Statistical analysis demonstrated no significant correlation between the level of MLH1 in nuclei and cytoplasm with reference to GS (Table II).
Table II
Summarized medians and statistical significance of our results in reference to Gleason score
Association of TP53BP1 expression with Gleason score and Gleason pattern
In 95% of cases nuclear expression and in 96% of cases cytoplasmic expression of TP53BP1 was revealed. Statistical analysis demonstrated no correlation between cytoplasmic or nuclear expression of the TP53BP1 and GS and GP (Tables II and I respectively).
Association of MDC1 expression with Gleason score and Gleason pattern
In 71% of cases nuclear expression and in 69% of cases cytoplasmic expression of MDC1 was revealed. Statistical analysis demonstrated no significant correlation between the level of MDC1 in nuclei and cytoplasm with reference to GP (Table I).
Statistical analysis showed a significant correlation between cytoplasmic expression of MDC1 and GS (p = 0.0108) (Figure 2 C).
Statistical analysis showed no significant correlation between the level of MDC1 in nuclei and with reference to GS (Table II).
Discussion
In the normal cell, the MMR system promotes repair during and after DNA replication mainly through the excision-repair reaction. This MMR mechanism engages numerous proteins, including MSH2 and MLH1, which were a part of this study [19–21]. MSH2 gene inactivation and the loss of MSH2 protein cause insufficient DNA repair and the development of tumors with high levels of microsatellite instability [22–27]. Furthermore, a recent study showed that loss-of-function mutations of MSH2 were most common in PCa compared to another MMR protein, i.e. MLH1 [28–30].
Dominguez-Valentin et al. followed a similar approach in their study which was focused on patients with Lynch syndrome and PC. Their results showed that defect of MSH2 was associated with high GS (GS of ≥ 8) and more aggressive biological behavior of the prostatic carcinomas [31]. Another study that addressed a similar subject was that of Guedes et al., which revealed that the highest rates of MSH2 gene inactivation and loss MSH2 protein occurred among the most aggressive high-grade prostatic adenocarcinomas, especially among tumors with GP5 [32]. However, in our study the nuclear and cytoplasmic level of MSH2 according to GS did not support this concept. This fact may suggest other significant alterations in MSH2 expression among PCs in patients with and without Lynch syndrome.
Based on our results, we can suspect that in cases with GS of ≥ 7 there were significantly more incorrectly paired nucleotides, which caused increased nuclear expression of MSH2 to conduct sufficient DNA repair [33, 34]. The corresponding cytoplasmic and protein expression of the MSH2 in specimens with GS ≥ 7 could be a result of increased expression of the MSH2 gene caused by intensified DNA repair because of an increased level of mutations. Moreover, our study showed a decreased overall level of nuclear MSH2 according to GP. It revealed that MSH2 loss was more common among high grade prostatic cancer. In the group with GP4 the level of nuclear MSH2 was increased compared to samples with GP3. The greater number of incorrectly paired nucleotides might have been connected with higher demand of the MSH2. However, a decreased level of the nuclear MSH2 in GP5 might have resulted from a higher amount of mutations in the MSH2 gene, which prevented adequate DNA repair. The high GS in cancers with MSH2 deficiency suggested more aggressive behavior compared to prostatic tumors without MSH2 defects. It might have been connected with a subset of prostatic carcinoma called “hypermutated” [35]. The Pritchard et al. study revealed that all hypermutated prostatic cancers had mutations in MMR genes and MSI. Complex structural rearrangements in the MSH2 gene (for example MSH2-KCNK12 inversion) were an important mechanism determining hypermutation in advanced PC. Thus, hypermutated prostatic cancers showed complete loss of MSH2 protein, as we observed in our study. According to Pritchard et al. prostatic cancers without hypermutation were microsatellite stable and had valid MSH2 protein [28]. In our study we observed the increase of MSH2 in cancers with higher GS and its decrease in cases with higher GP. This observation may result from intratumor heterogeneity in PC.
Another investigated protein of the MMR mechanism was MLH1. Studies suggested that MLH1 abnormalities could increase prostate tumor aggressiveness and indicated that expression of MLH1 among PC cells was significantly downregulated in comparison to normal prostate or benign hyperplasia [19, 36–39]. Numerous studies revealed the impact of alteration within the MLH1 gene on PC stage, but the results of those studies were diverse. Studies showed that simultaneously with growth of the GS, MLH1 gene expression declined [39, 40]. However, other studies showed the rising trend of the MLH1 gene expression among PC with the higher GS [41, 42]. The findings in our study could help to clarify the reason for these inconsistencies among studies. Our study showed a relevant dependency for the cytoplasmic MLH1 expression among PCs with a higher GP, but no significant correlation among PCs regarding the GS.
We assumed that it could have resulted from the PC heterogeneity and the intratumoral heterogeneity of MLH1 gene expression, which could be the reason for these discrepancies between the results for the GS and GP.
The other investigated proteins engaged in DNA repair were TP53BP1 and MDC1. These proteins are involved in specific molecular pathways to detect DSB, which protects cells against DNA alterations and the initiation of carcinogenesis [43, 44]. Jäämaa et al. observed the accumulation of TP53BP1 and MDC1 at places of DNA damage induced by cytotoxic drugs and ionizing radiation in nonmalignant human prostate tissue, which implied a protective function of the DSB repair pathway against malignant transformation [45].
The current research is the first to center on TP53BP1 level according to histopathological grade. However, our results demonstrated no significant correlation between this protein level in all evaluated localizations and GP and GS.
As a consequence, we supposed that the TP53BP1 function does not undergo disorders during a process of PC dedifferentiation.
Different studies revealed only that TP53BP1 decreased during cancer clinical progression [46–48]. These observations suggested the independence of disease risk factors related to clinical progression and the factors leading to cancer progression.
An interesting fact is that other studies showed that alterations in TP53BP1 function resulted in insensitivity to radiotherapy [49–52].
However, an earlier clinical study has demonstrated that the radiotherapy relapse rate increases in the case of prostatic cancer with an increasing GS value [53]. Our results suggest nevertheless that the mechanism of this radiation resistance might not arise from alterations of TP53BP1. Moreover, there is a lack of studies about another clinical context and further research is needed in this field.
MDC1 was another investigated component of the DNA damage response that participates in the DNA damage checkpoint and protects the integrity of the genome [54]. The latest study showed that there was overexpression of MDC1 in cells of several cancer types in comparison to normal cells [55, 56]. Zou et al. found that MDC1 was a positive co-activator of the estrogen receptor α (ERα) in breast cancer [55]. They detected that down-regulation of MDC1 decreased the expression of the endogenous estrogen responsive genes and, therefore, the growth of the tumor [55]. Similar correlations have been described by Wang et al. for PC. They proved that MDC1 was an androgen receptor co-activator involved in PC suppression. Moreover, they showed that MDC1 participated in suppression of PCa cell growth and migration [56]. However, our results showed no significant correlation between the level of MDC1 in nuclei and cytoplasm with reference to GP. On the other hand, we demonstrated a significant decrease of the cytoplasmic expression of MDC1 in cases with GS 8. This process may be caused by PC heterogeneity and the results may differ according to the PC group, which is examined [57].
In conclusion, our study suggested that the aberration in the MMR repair mechanism may be significantly more crucial regarding grading among PC cells in comparison to the impact of alterations in the DSB repair mechanism. Moreover, the present study indicated divergences among expression of the respective proteins in GP and GS. There was a significant positive correlation between GS and nuclear expression of MSH2, but a negative correlation between GP and MSH2 nuclear expression. According to this, there was no relevant correlation between MLH1 cytoplasmic expression and GS, whereas there was a significant positive correlation between cytoplasmic expression of MLH1 and GP. This may indicate significant heterogeneity among PC. Furthermore, we concluded due to the lack of a correlation between expression of the TP53BP1 protein and GP and GS that the radiation resistance of prostate cancer seems to be independent of alterations connected with TP53BP1 (Figure 3).