Introduction
Neck pain is a condition commonly found in modern society, with 30–50% of the average people suffering from neck pain in a specific year. One study reported that the annual incidence of neck pain in the average people was 29–40% [1]. In some occupational groups, the annual prevalence was found to be as high as 54–76% [2]. Besides, neck pain was the fourth-leading reason for disability [3]. As a public health issue, the incidence of neck pain differs across geographic regions and countries, and an in-depth understanding of its incidence would help to formulate targeted lifestyle interventions for different populations and to promote the adoption of effective national health policies.
Neck pain adversely impacts the living standard of patients and directly reduces their ability to participate in social activities and work, further increasing the burden associated with this condition [4–12]. For economic reasons, access to health care and the causes connected with the occurrence and prognosis of neck pain differ among populations. Therefore, comprehensive examination of the changing burden of neck pain may provide data to improve relevant policies.
In this study, on the basis of the Global Burden of Disease (GBD) visualization database, the global burden of neck pain and its change trends from 1990 to 2019 were analyzed by calculating the age-standardized incidence rate and age-standardized disability-adjusted life year (DALY) rate of neck pain and their estimated annual percent changes (EAPCs). The findings will help disease management and health decision-making.
Material and methods
Study data
The data were extracted from the 2019 GBD study to obtain the absolute incidences and DALYs and their age-standardized rates from 1990 to 2019 in 27 regions and 204 countries [13]. Data were also collected on sex and age. The regions and countries were categorized according to the sociodemographic index (SDI) into five levels: low, low-middle, middle, high-middle and high SDI. Trends in the incidence and burden of neck pain were examined by region and stratified by sex and age (15–19 years old, 20–24 years old, 25–29 years old, 30–34 years old, 35–39 years old, 40–44 years old, 45–49 years old, 50–54 years old, 55–59 years old, 60–64 years old, 65–69 years old, 70–74 years old, 75–79 years old, 80–84 years old, 85–89 years old, 90–94 years old, 95+years old and above) to identify high-risk groups.
Estimation framework
Neck pain refers into the upper limb(s) that lasts for at least 1 day according to the 2019 GBD study. Neck pain incidence was estimated using Dis Mod-MR [14]. DALYs caused by neck pain were calculated in total of years lived with disability and the years of life lost [15].
Statistical analysis
The age-standardized rates were computed on the basis of the standard population age structure, and the accepted EAPCs were used to describe the trend of the rates using a regression model. The trend was considered to be upward if both the EAPC and its lower 95% CI were greater than 0. Conversely, a trend was considered to be downward if both the EAPC and its lower 95% CI were less than 0. If both the EAPC and its 95% CI upper bound were less than zero, the rate was also thought to be trending downward. Otherwise, the rate was considered to be stable (i.e. no significant change). The tendency in neck pain incidence and disease burden were assessed by calculating the age-standardized incidence rate and the age-standardized DALY rate, respectively, (per 100,000 population) and their respective EAPCs.
Results
Neck pain incidence
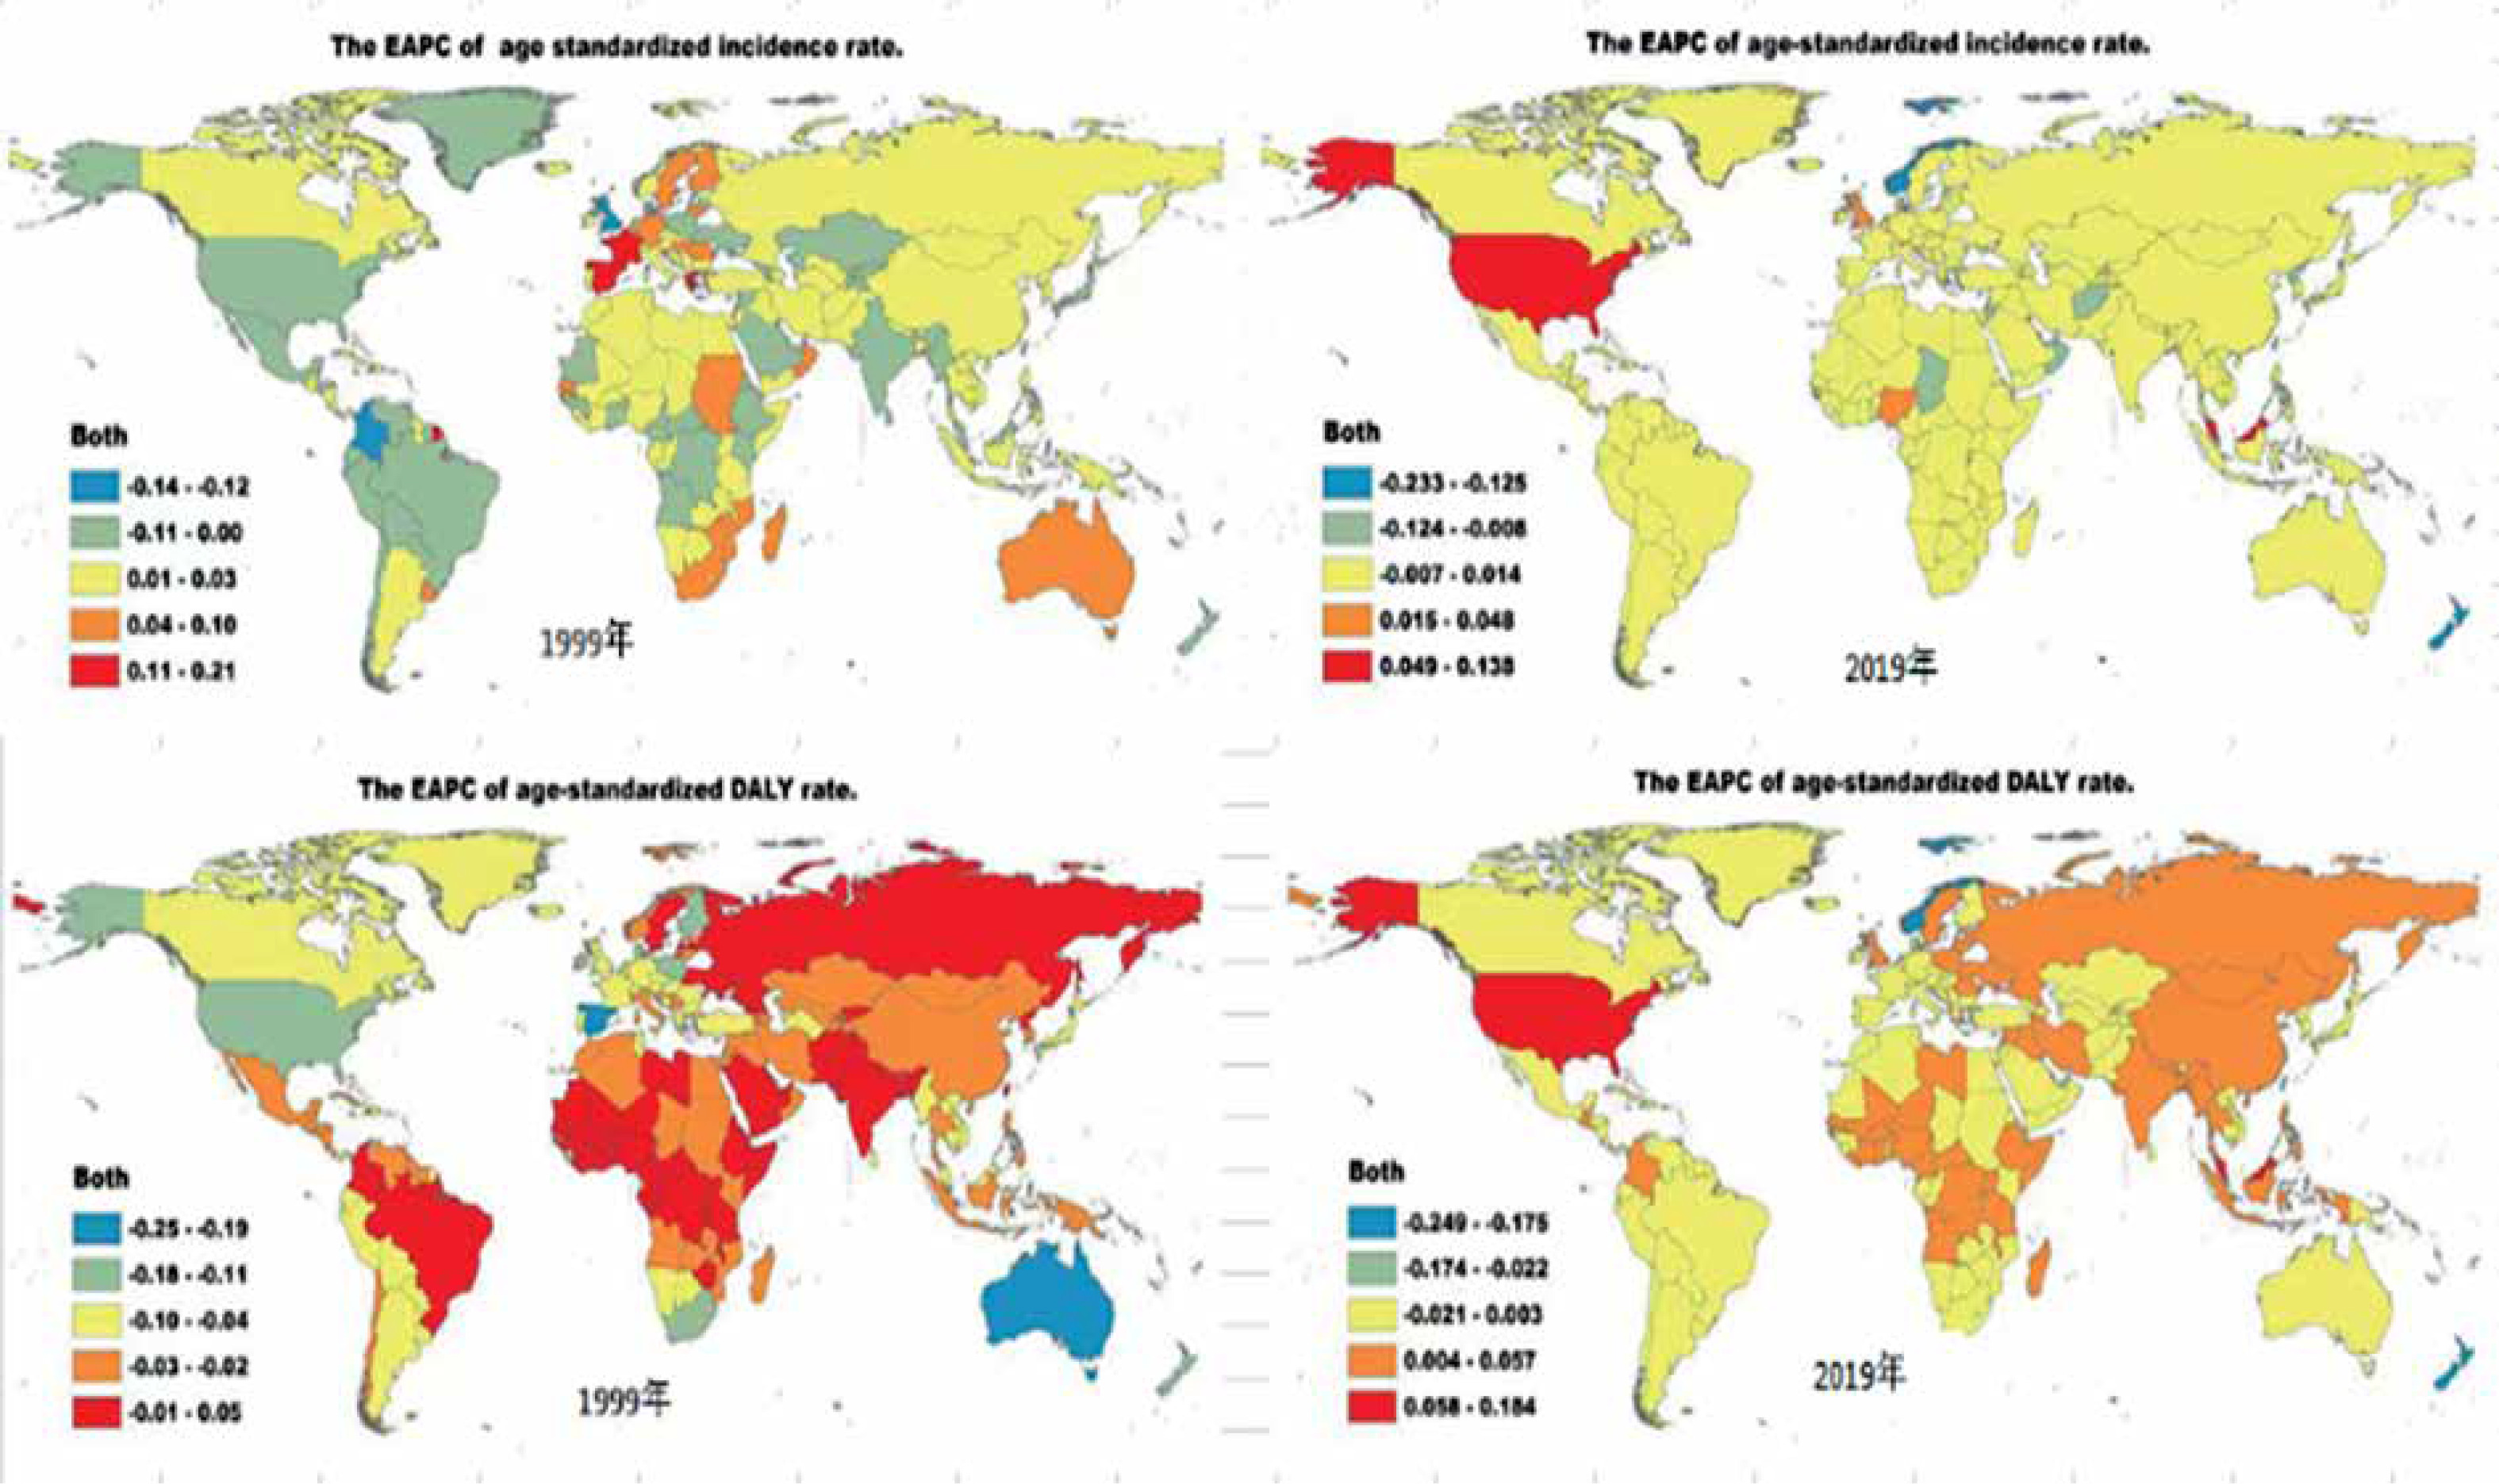
From 1990 to 2019, the global age-standardized incidence rate of neck pain displayed a consistent decreasing trend, with an EAPC of –0.06 (95% CI: –0.08 to –0.03) (Table I, Figure 1 A, Supplementary Figure S1 A). The age-standardized incidence rate of neck pain in both sexes decreased from 1990 to 2019 (male EAPC, –0.07; female EAPC, –0.06) (Table I, Figure 1 A). The age-standardized incidence rate was lower in males than in females (Table I). The male-to-female ratio of neck pain incidence peaked in the 45–49 years age group globally; it also peaked in this age group in high-middle- and middle-SDI regions. The ratio peaked in the 40–44 years age group in high- and low-SDI regions but peaked in the 55–59 years age group in low-middle-SDI regions (Supplementary Figure S2). In 2019, the age-standardized incidence of neck pain was substantially higher in high-SDI areas than in other areas (Table I and Supplementary Figure S1 A). In 2019, high-SDI regions recorded the highest age-standardized incidence rates of neck pain (676.79 per 100,000 population; 95% uncertainty interval (UI), 541.87 to 837.14), followed by the middle-SDI regions (672.67 per 100,000 population; 95% UI, 531.03 to 851.32). The age-standardized incidence rate increased the most in the high-middle-SDI regions, where the EAPC reached the top of 0.23 (Table I, Figure 1 A).
Table I
The age-standardized incidence rate (ASIR) of neck pain in 1990 and 2019 and its temporal trends
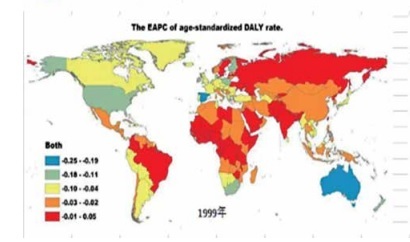
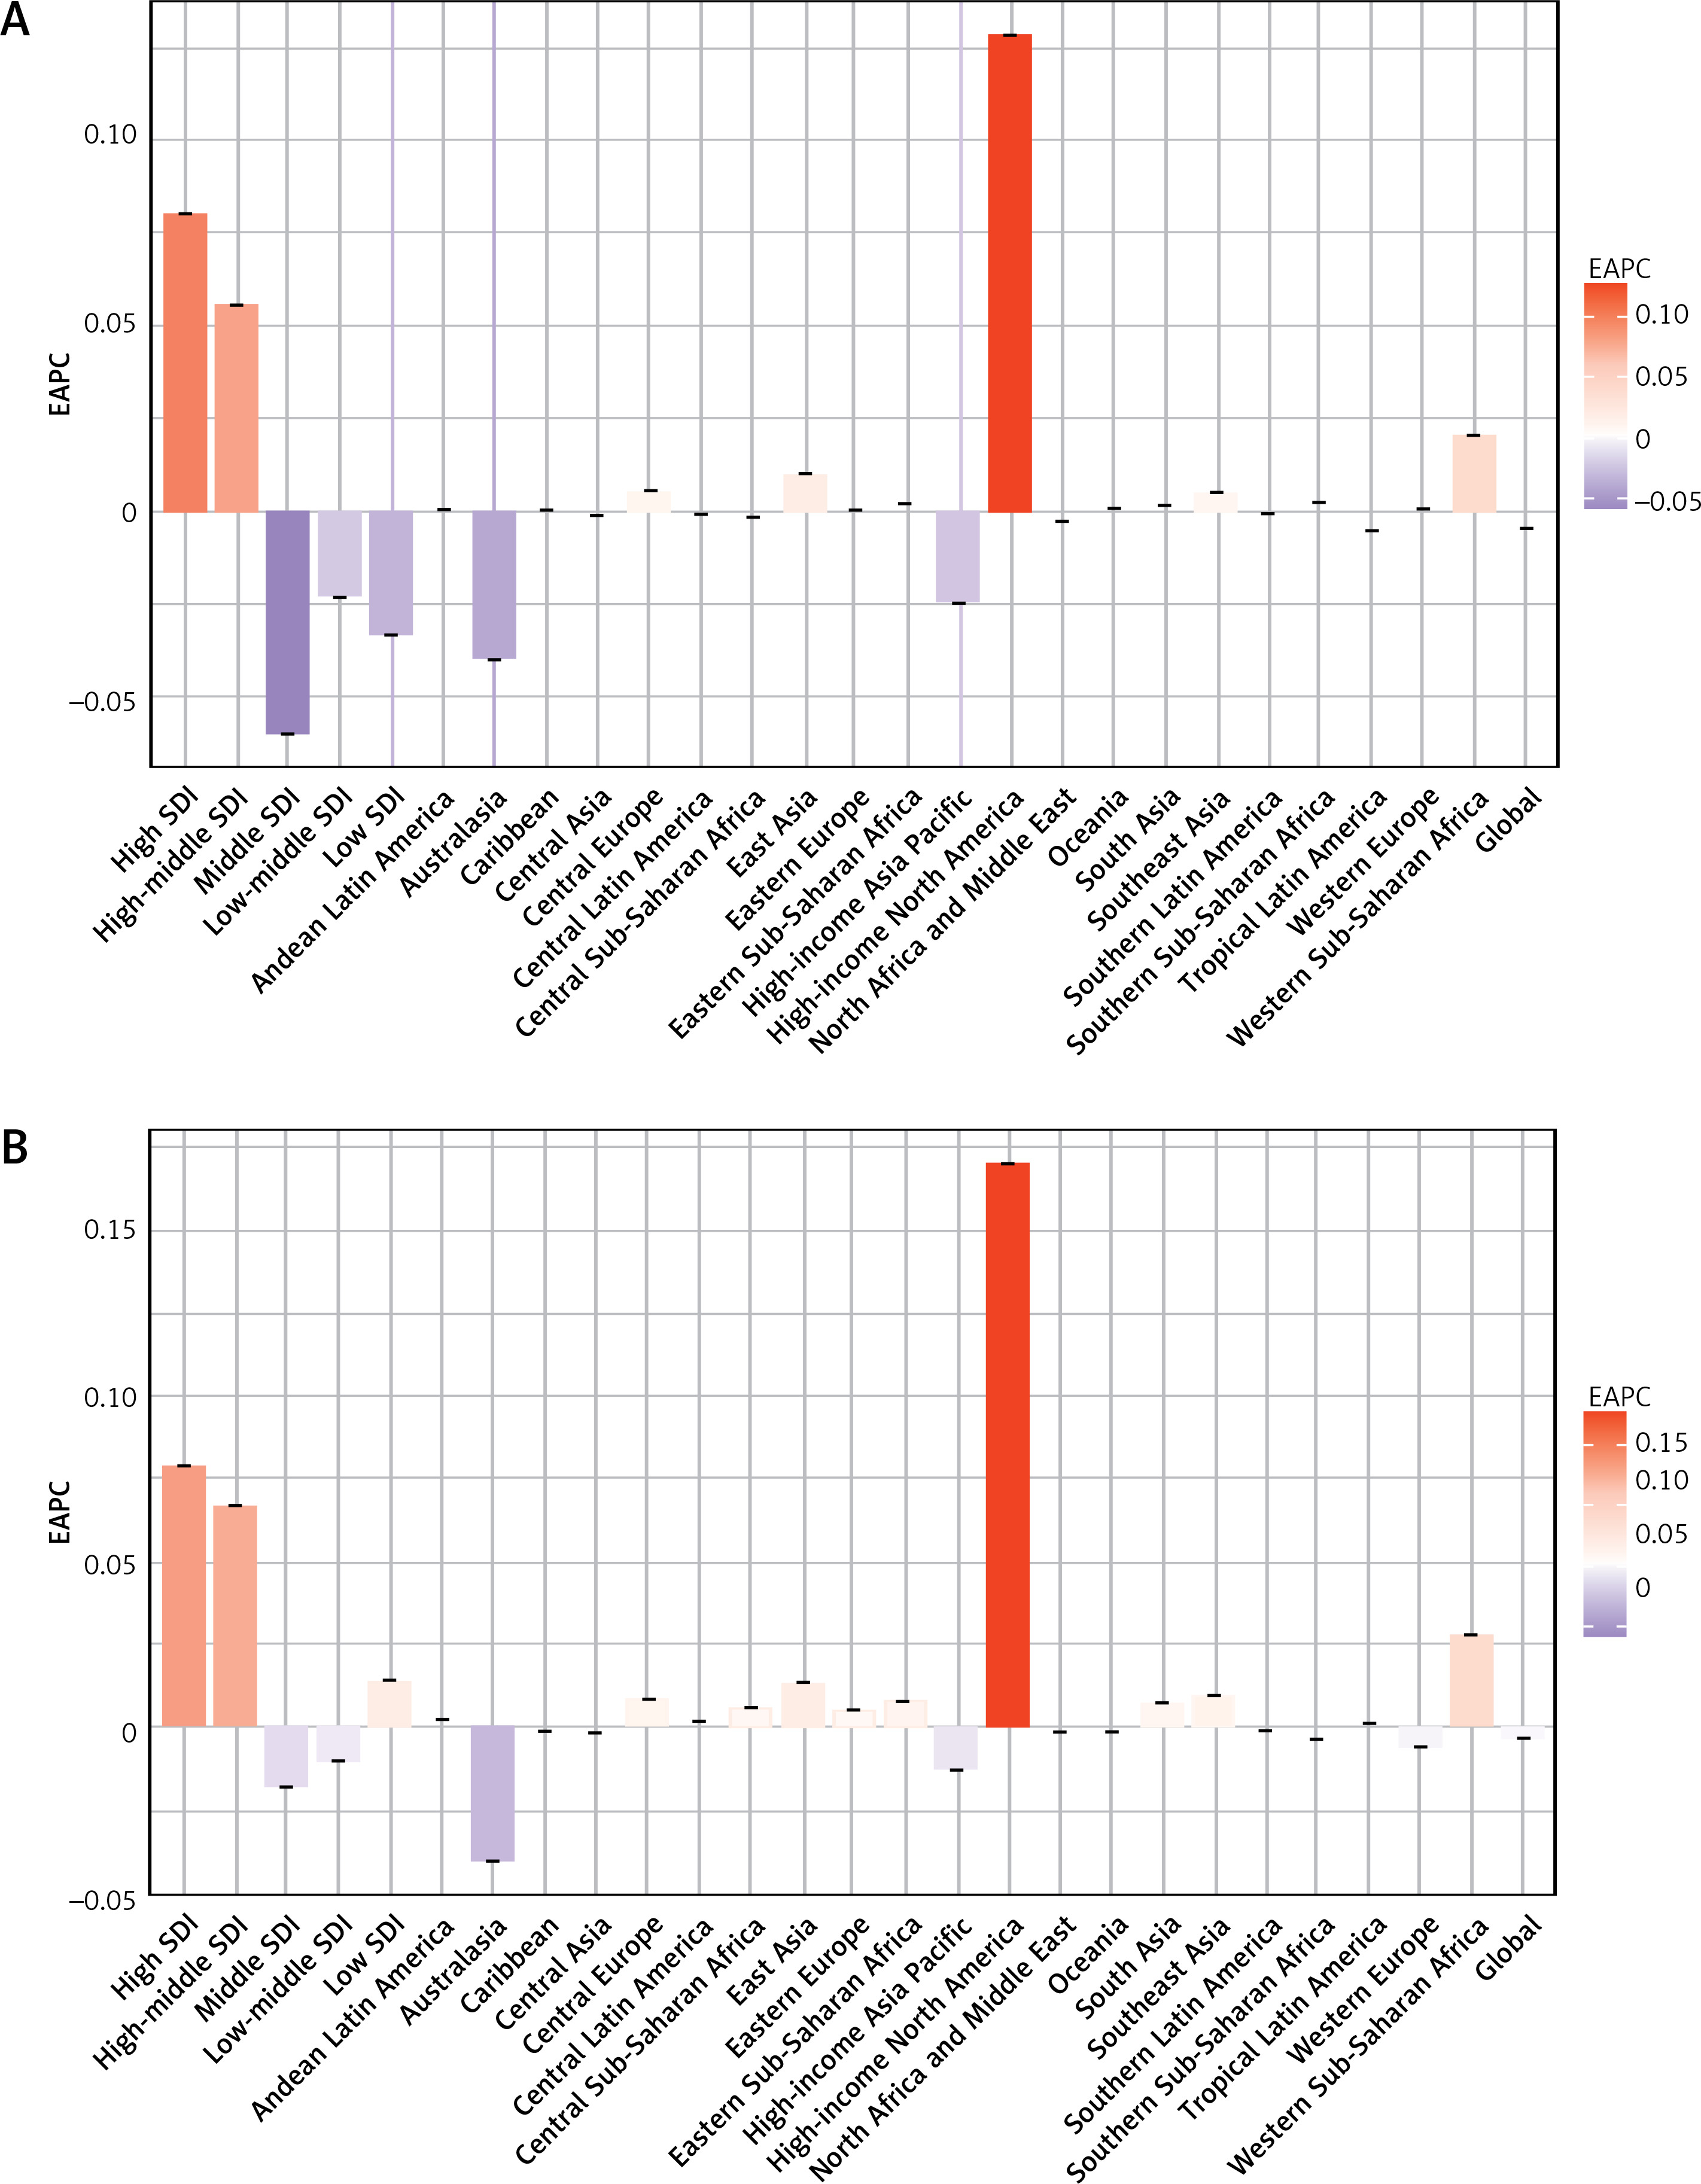
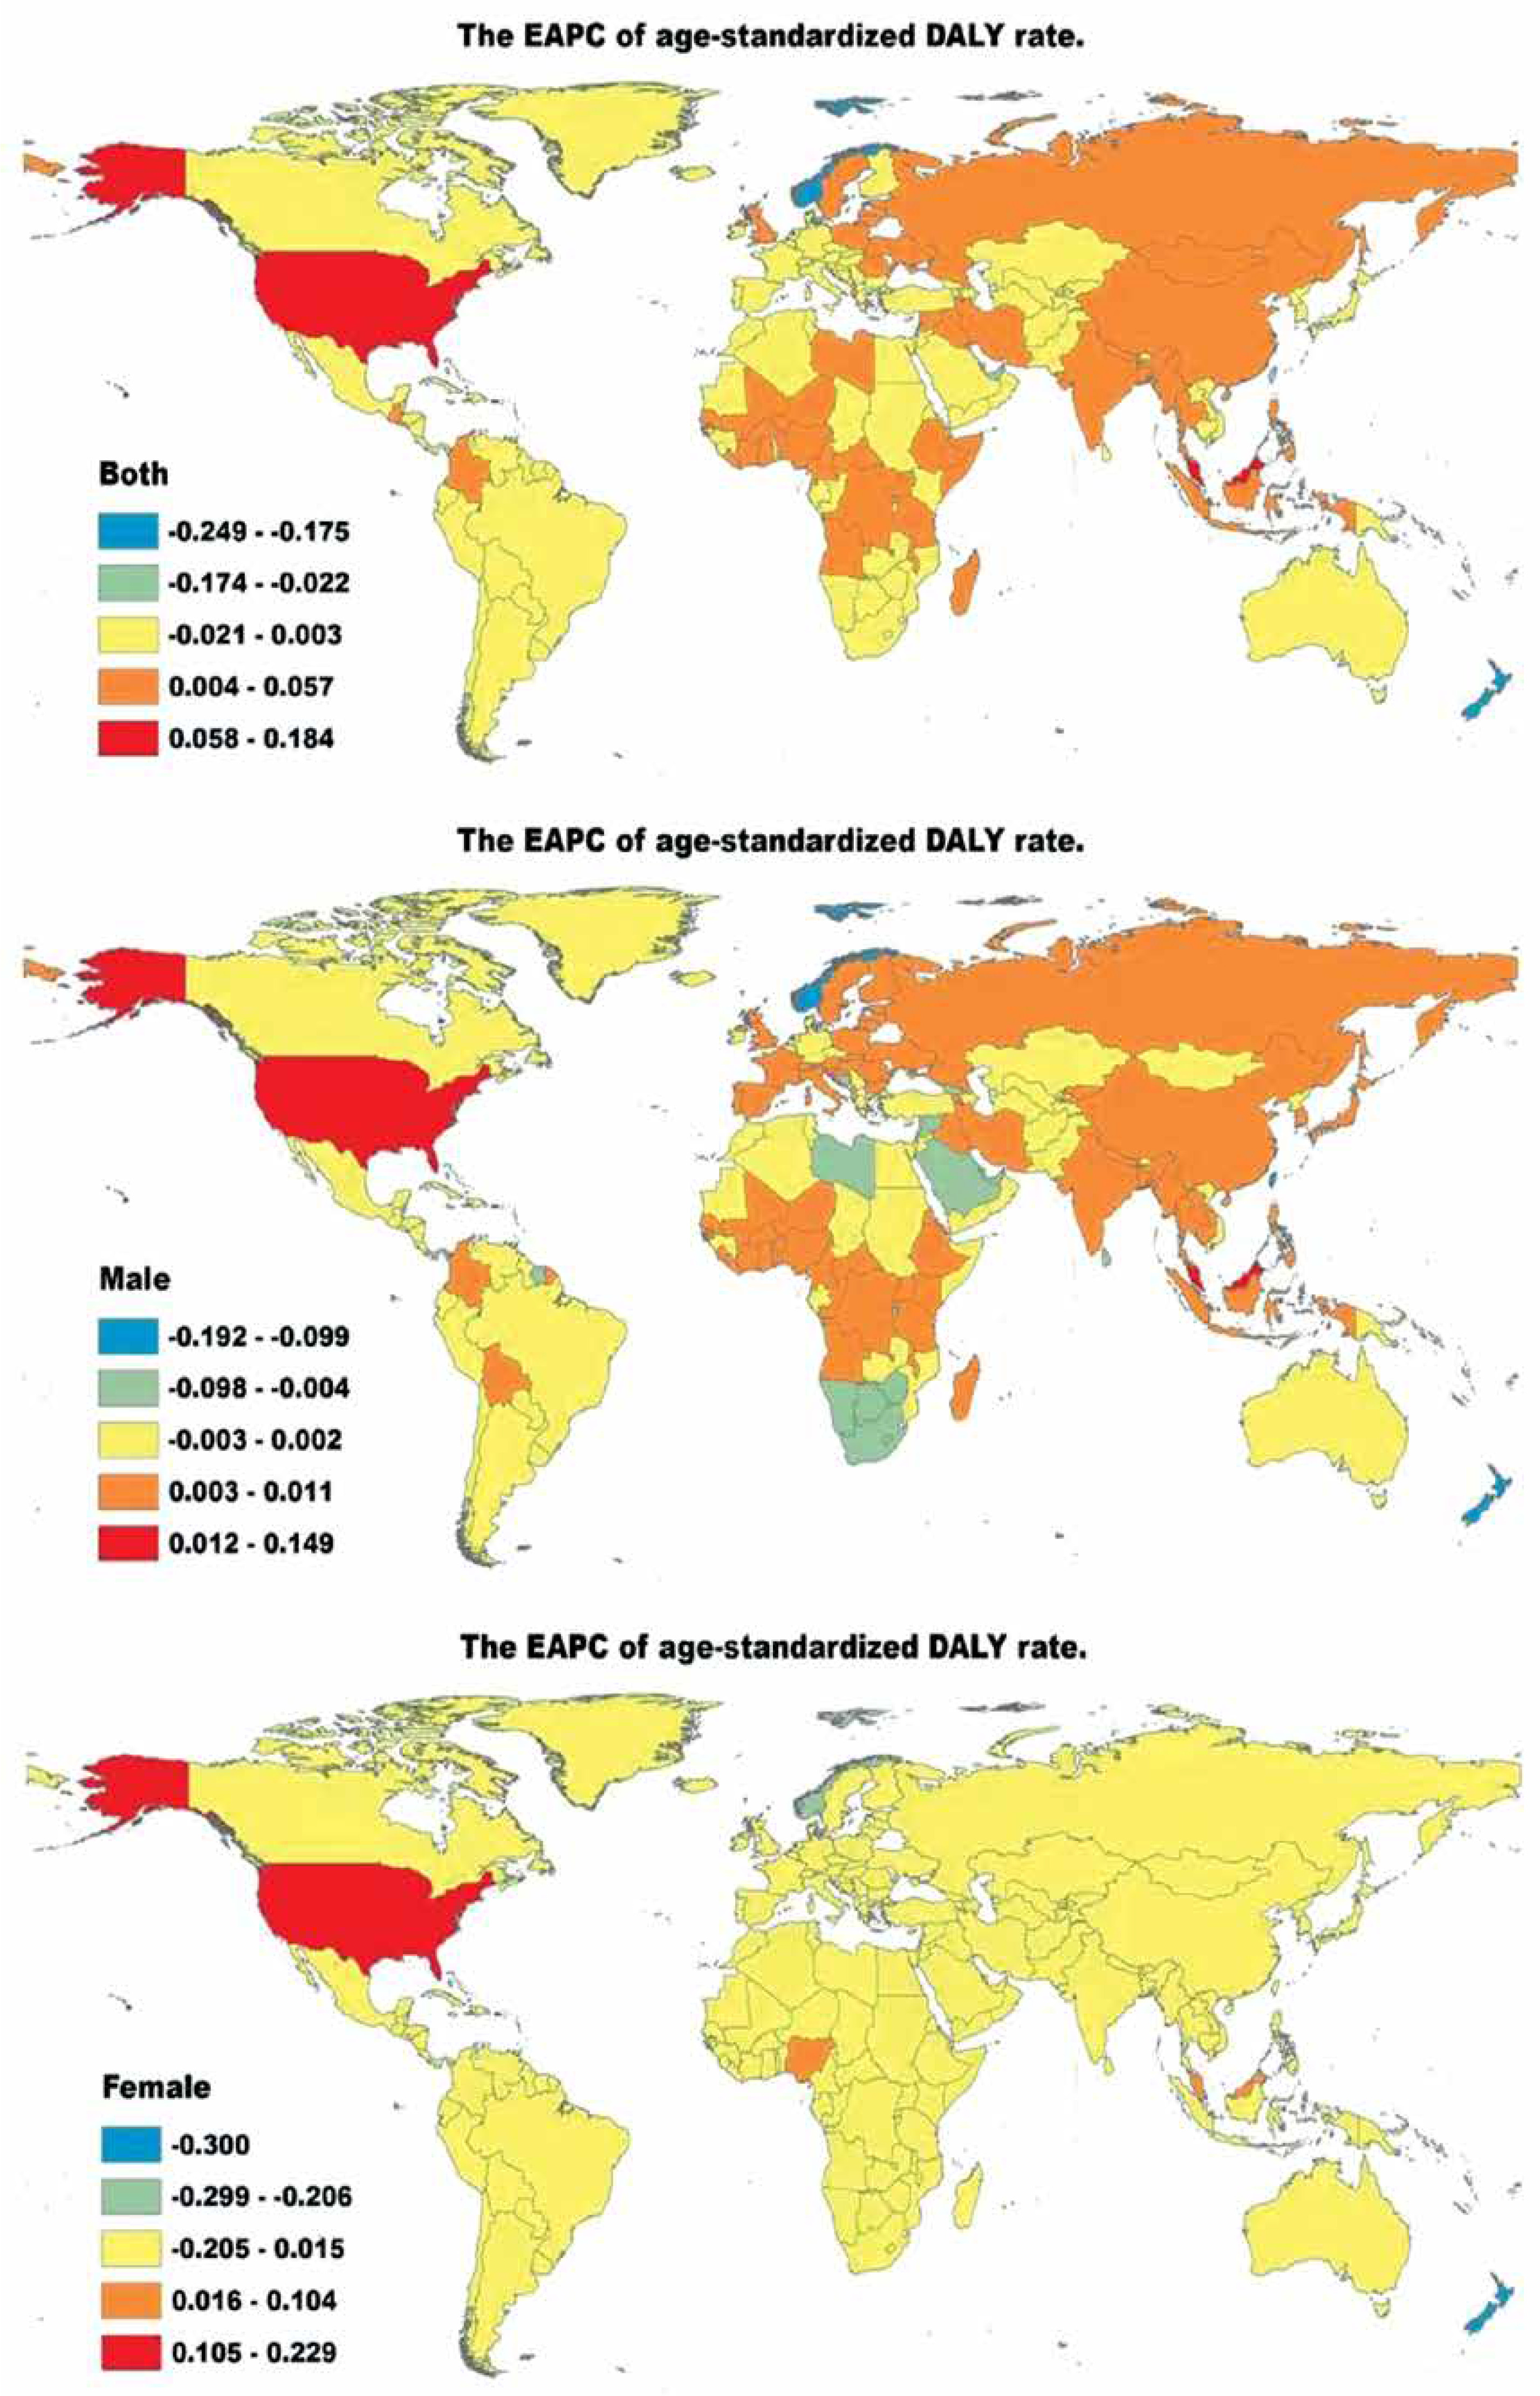
Figure 1
The EAPC of neck pain age-standardized rates from 1990 to 2019, by regions. A – The EAPC of ASIR. B – The EAPC of age-standardized DALY rate
EAPC – estimated annual percentage change, ASIR – age-standardized incidence rate, DALY – disability adjusted life-year.
The EAPC of the age-standardized incidence rate of neck pain was negatively associated with both the age-standardized incidence rate (ρ = –0.056, p = 0.429) (Supplementary Figure S 3A) and the SDI (ρ = –0.164, p = 0.019) (Supplementary Figure S3 B). Regions in which the SDI increased between 1990 and 2019 also had high incidences of neck pain among adults aged 50–69 years (Supplementary Figures S4 A and S4 B). The annual incidence of neck pain increased among young people but decreased among older adults (Supplementary Figure S5 A).
In 2019, the highest regional age-standardized incidence rate of neck pain was discovered in high-income North America (915.20 per 100,000 population; 95% UI, 736.57 to 1122.21), followed by Southeast Asia (897.30 per 100,000 population; 95% UI, 709.29 to 1133.99) and East Asia (804.10 per 100,000 population; 95% UI, 638.38 to 1020.47). The lowest regional age-standardized incidence rate was discovered in Australasia (241.27 per 100,000 population; 95% UI, 192.37 to 300.91), followed by central sub-Saharan Africa (268.28 per 100,000 population; 95% UI, 209.08 to 340.47) and eastern sub-Saharan Africa (289.19 per 100,000 population; 95% UI, 226.79 to 367.14) (Table I, Supplementary Table SI). From 1990 to 2019, the age-standardized incidence rate of neck pain increased the most in tropical Latin America (EAPC = 0.53; 95% CI: 0.35 to 0.72), western sub-Saharan Africa (EAPC = 0.09; 95% CI: 0.08 to 0.11), and East Asia (EAPC = 0.05; 95% CI: 0.04 to 0.06), and it decreased the most in high-income North America (EAPC = –0.58; 95% CI: –1.12 to –0.03), Australasia (EAPC = –0.20; 95% CI: –0.24 to –0.16), and Western Europe (EAPC = –0.16; 95% CI: –0.25 to –0.80) (Table I, Figure 1 A, Supplementary Table SI).
At the country level, the highest age-standardized incidence rate of neck pain in 2019 was discovered in the Philippines (1156.25 per 100,000 population; 95% UI: 917.09 to 1461.47), followed by Indonesia (965.00 per 100,000 population; 95% UI: 763.65 to 1218.88) and the United States (957.71 per 100,000 population; 95% UI: 771.71 to 1170.78). The lowest age-standardized incidence rate of neck pain was discovered in New Zealand (212.70 per 100,000 population; 95% UI: 170.55 to 262.98), followed by Australia (246.19 per 100,000 population; 95% UI: 194.93 to 307.68) and Djibouti (266.41 per 100,000 population; 95% UI: 207.64 to 338.33) (Supplementary Tables SII and SIII). From 1990 to 2019, the age-standardized incidence rate of neck pain diminished the most in New Zealand (total EAPC = –1.26; male EAPC = –0.96; female EAPC = –1.54) and expended the most in Brazil (total EAPC = 0.55; male EAPC = 0.48; female EAPC = 0.59) (Figure 2, Supplementary Tables SII and SIII).
Neck pain-associated DALYs worldwide
From 1990 to 2019, the global number of neck pain-related DALYs decreased by –0.34%, from 268.26 to 267.35 (Table I). The age-standardized DALY indicated a decreasing trend, with an EAPC of –0.09 (95% CI: –0.13 to –0.06) (Table I, Figure 1 B, Supplementary Figure S1 B). The age-standardized DALY decreased in both sexes from 1990 to 2019 (male EAPC = –0.10; female EAPC = –0.09; Table I).
From 1990 to 2019, the age-standardized DALY for neck pain was lower in males than in females, as reflected by the male-to-female ratios of 0.79 in 1990 and 0.79 in 2019 (Table II). The male-to-female DALY ratio reached the top in the 65–69 years age group globally; it also reached the top in this age group in the high-middle-, middle-, and low-middle-SDI areas. The ratio peaked in the 55–59 years age group in the high-SDI areas and in the 45–49 years age group in the low-SDI regions (Supplementary Figure S6).
Table II
The age-standardized DALY rate of neck pain in 1990 and 2019 and its temporal trends
As shown in Table II and Supplementary Figure S1 B, the age-standardized DALYs for neck pain were substantially higher in high-SDI areas than in other areas. In 2019, the highest regional age-standardized DALYs were discovered in the high-SDI regions (347.71 per 100,000 population; 95% UI: 234.89 to 495.02), followed by the middle-SDI areas (300.58 per 100,000 population; 95% UI: 197.29 to 430.77). The age-standardized DALYs decreased most in the high-SDI regions, in which the EAPCs peaked (–0.35; 95% CI: –0.62 to −0.07) (Table II, Figure 1 B).
The EAPC of the age-standardized DALY for neck pain was negatively related to the age-standardized DALY (ρ = –0.103, p = 0.144) (Supplementary Figure S3 C) and the SDI (ρ = –0.210, p = 0.003) (Supplementary Figure S3 D). Regions in which the SDI had increased from 1990 to 2019 had the highest DALY rates among older adults aged 50–69 years (Supplementary Figures S4 C and S4 D). Overall, the annual DALY rates increased among young people but decreased among older adults (Supplementary Figure S5 B).
The highest age-standardized DALYs for neck pain in 2019 were discovered in high-income North America (479.11 per 100,000 population; 95% UI: 322.96 to 677.58), followed by Southeast Asia (416.13 per 100,000 population; 95% UI: 273.74 to 596.53) and East Asia (356.35 per 100,000 population; 95% UI: 233.22 to 513.21), while the lowest rates were observed in Australasia (104.56 per 100,000 population; 95% UI: 68.63 to 149.93), followed by central sub-Saharan Africa (113.43 per 100,000 population; 95% UI: 74.84 to 163.66) and eastern sub-Saharan Africa (121.86 per 100,000 population; 95% UI: 79.72 to 174.64) (Table II, Supplementary Table SI). From 1990 to 2019, the age-standardized DALY rates increased the most in tropical Latin America (EAPC = 0.60; 95% CI: 0.40 to 0.80) and decreased the most in high-income North America (EAPC = –0.70; 95% CI: –1.32 to –0.08), Western Europe (EAPC = –0.23; 95% CI: –0.33 to –0.13), and Australasia (EAPC = –0.20; 95% CI: –0.25 to –0.16) (Table II, Figure 1 B, Supplementary Table SI).
The highest age-standardized DALYs for neck pain in 2019 were discovered in the Philippines (530.07 per 100,000 population; 95% UI: 350.59 to 764.80), followed by the United States (500.26 per 100,000 population; 95% UI: 338.92 to 704.86) and the United Kingdom (446.79 per 100,000 population; 95% UI: 301.97 to 636.94), while the lowest age-standardized DALY rates were discovered in New Zealand (86.06 per 100,000 population; 95% UI: 56.47 to 122.89), followed by Australia (107.86 per 100,000 population; 95% UI: 70.81 to 155.14) and South Sudan (112.12 per 100,000 population; 95% UI: 73.89 to 160.59) (Supplementary Tables SII and SIV). Between 1990 and 2019, the age-standardized DALY rates for neck pain diminished the most in New Zealand (total EAPC = –1.36; male EAPC = –1.00; female EAPC = –1.69) and expended the most in Brazil (total EAPC = 0.61; male EAPC = 0.54; female EAPC = 0.67) (Figure 3, Supplementary Tables SII and SIV).
Discussion
Neck pain is an average condition worldwide and causes a significant burden of disease and economic loss. This study, on the basis of the GBD 2019 results, found that the global age-standardized incidence rate and age-standardized DALY rate for neck pain indicated a decreasing tendency from 1990 to 2019. This suggests that, globally, the diagnosis and treatment of neck pain is improving; however, specific challenges remain. Research has found that neck pain is commonly present among young office and computer workers [16]. Some studies have reported a positive correlation between neck pain and work-related risk factors such as neck and trunk bending, arm posture, sedentary work posture and sitting posture duration, and workplace design [17]. In previous studies, psychological factors (stress, anxiety, sleep and cognitive factors) and biological factors (pre-existing immune diseases, neuroskeletal diseases, aging and heredity) are considered as risk factors for neck pain [18–20]. Neck pain has a high incidence rate and is prone to recurrence, which brings great disease burden and is a worldwide public health problem. A preliminary study has found that participating in physical exercise is an important way to treat neck pain. Good mental health and strong social support also predict good results. Therefore, it is recommended to consider the prevention and control of multiple types of risk factors, including physiological, psychological, and economic factors.
There were differences in incidence and disease burden by sex, age, and region. In line with most studies [21, 22], one postgraduate study discovered that men were much more likely than women to experience some relief or even complete resolution of neck pain. Another study found that women were 19% more likely than men to experience continual worsening of neck pain. Men have a lower prevalence of neck pain than women, and women have a higher burden of neck pain [23]. In addition to biological factors, female hormones, especially postmenopausal hormones, play an important role in the etiology and pathobiology of various musculoskeletal degenerative diseases [24], which is also an explanation for gender differences in menopausal women. In addition, psychological and sociocultural factors may also be the reasons for this [25].
In our study, areas in which the SDI increased between 1990 and 2019 also had high incidences and DALY rates of neck pain among adults aged 50–69 years. Similar results have been found in many studies, the middle-aged group had the highest risk, the worst prognosis, and the highest prevalence compared with the younger and older age groups [26]. Many (but not all) studies have made a link between age and the onset of neck pain [24]. Given these findings, special attention is needed to diagnose and treat neck problems in women aged 50–69 years [26]. Areas with high SDI have the highest ASIR and disease burden between the ages of 15 and 49, possibly due to a higher proportion of brainworkers with limited physical activity. Research has found that repetitive work and continuous arm movements with load increase the risk of neck pain compared to tense neck movements [27]. The ASIR and disease burden are highest in areas with low SDI aged 70 and above, which may be caused by engaging in single sustained physical labor, obesity, and increased levels of aging. Therefore, special attention is paid to neck issues for women aged 50–69 and young people.
There are significant differences in neck pain between countries and regions, and geographical region and national social development level are one of the important factors affecting neck pain. Recent studies have shown that low income is a risk factor for chronic neck and back pain, which is related to poor prognosis [21, 24] and is also significantly related to the education level [23]. With the increase of the SDI level, the incidence rate of neck pain and the burden of disease show a downward trend. Research differences are mainly caused by the difference in the definition of neck pain, the range of data sources and the methods used [28]. In addition, GBD research data did not address issues such as high-intensity work, smoking history, psychological disorders, and past history of neck pain [29].
High-SDI regions showed the highest age-standardized incidence rate and disease burden from neck pain in those 50–69 years of age, probably because this group contains a higher proportion of office workers with limited physical activity. Kuorinka and Forcier found that there was an increased hazard of neck pain in those who engaged in repetitive work and loaded continuous arm movements with strained neck activity. Geertje et al. reported an optimistic association between neck pain and work-related hazard factors such as neck and trunk flexion, arm posture, sedentary work posture, duration of sitting, and workplace design. Hoy also suggested a higher prevalence of neck pain in office and computer workers. Neck pain is prevalent in the younger population of office and computer workers, with a higher prevalence and recurrence in this age group compared with other age groups [16–18].
In our study, the age-standardized incidence rate and disease burden for neck pain were significantly higher in high-SDI areas than in low-SDI areas, with North America being the region with the highest incidence rate and disease burden. This may be due to the high number of office and computer workers, greater health awareness and better health care access [30]. The high morbidity and burden of disease in South Asia, East Asia, and the Philippines, as well as in the regions with the most rapid increases in neck pain incidence (Latin America and Brazil), may be due to the large populations, unhealthy behavioral patterns, poor living conditions, and inadequate health resources [30]. The limited health resources in low- and middle-income countries may be mitigated by international cooperation and health assistance efforts.
It has been shown that neck pain varies widely by country and region. This study extracted data from the GBD database and conducted standard analysis methods to estimate the change tendency over the past 30 years (from 1990 to 2019). The findings may help to assess different regional and national public health policies and interventions and could be used to help formulate guidance. This study has some limitations, different countries and areas have different diagnostic and filtering criteria and monitoring systems for neck pain. Therefore, there may be distinctions in the quality of the data obtained. Furthermore, due to the limited data available from some regions with low SDIs, the number of neck pain diagnoses may have been underestimated and may not be representative. Finally, this study makes only preliminary inferences based on a statistical analysis of the dataset, and no etiological and attribution analyses were conducted due to the shortage of data on risk factors.
In conclusion, this study found a decreasing trend in the age-standardized incidence rate and age-standardized DALY rate of neck pain from 1990 to 2019 globally, but there were significant differences in distributions by sex, age, and region. The regional distributions of neck pain should be used to develop targeted risk factor interventions, promote healthy behaviors, establish a comprehensive health care system for neck pain treatment, and rationalize global health care resources to cut down the burden of neck pain.