Introduction
Uterine fibroids are the most common benign tumors of the female reproductive system, occurring in 20–30% of females, most often in women aged 30–50 [1]. The main symptoms are a heavy menstrual flow, abnormal uterine bleeding, pelvic pain, frequent urination and constipation [2]. Several studies have shown that uterine fibroids can lead to infertility and are an independent risk factor for adverse perinatal outcomes, including preterm birth, obstructed labor, intrauterine growth restriction, low birth weight (< 2500 g), placenta previa, placental abruption, cesarean section, postpartum hemorrhage and postpartum maternal anemia [3, 4].
In females aged 15–54 years, uterine fibroids account for an average of 29% of hospitalizations for gynecological disease [5]. Moreover, hysterectomies due to uterine fibroids account for 40–60% of all hysterectomies, and 18–44% of hysterectomies in young women [6]. The annual economic loss caused by uterine fibroids in the United States was higher than the total treatment cost of breast, colon or ovarian cancers [7].
Based on the Global Burden of Disease Study (GBD) 2019, this study used the reported incidence rates and disability-adjusted life years (DALYs) to analyze the global distribution of uterine fibroids from 1990 to 2019 at global, regional and national levels in terms of age and the Socio-demographic Index (SDI). DALY is a comprehensive measure of the quantity and quality of life in terms of time. Quantitative calculation of the loss of health lifespan caused by each disease in a certain region can scientifically identify the serious health hazards and major health issues in the region. Understanding the global incidence of uterine fibroids and its distribution is of great significance for the development of new health policies and informing the appropriate allocation of medical resources to reduce the global burden of this disease.
Material and methods
Data sources
Data from the Global Health Data Exchange (GHDx) of the Global Burden of Disease (GBD) database from 1990 to 2019 (https://ghdx.healthdata.org/gbd-results-tool) were used in this study. The age-standardized incidence rates and age-standardized DALY rates of uterine fibroids in 204 countries and territories in 2019 and their corresponding 95% uncertainty intervals (UIs) were calculated [8]. We followed the Guidelines for Accurate and Transparent Health Estimates Reporting recommendations [9]. Disability adjusted life year (DALY) refers to the total number of years of healthy life lost from onset to death, including years of life lost due to premature death (YLL) and years of healthy life lost due to disability caused by illness (YLD) [8]. This study was approved by Beilun District People’s Hospital.
Socio-demographic Index
The SDI is a comprehensive index that measures the overall economic development of a society, and considers education levels, per capita income levels and fertility rates [8]. SDI values range from zero to one, with larger values reflecting higher levels of social and economic development. Based on the SDI values reported by the GBD 2019 study, we divided the 204 countries or regions into five SDI groups: high, high-middle, middle, low-middle and low.
Statistical analysis
The GBD 2019 study calculated the standardized populations and age structures of all countries and regions examined with a population of more than 5 million. Age-standardized rates were calculated to prevent differences in age structures affecting comparisons of different regions [10]. Estimated annual percentage changes (EAPCs) were used to evaluate trends in age-standardized rates over time [11]. If both the EAPC and the lower 95% confidence interval (CI) bound were greater than zero, the age-standardized rate was considered to be increasing. Conversely, if both the EAPC and the upper 95% CI limit were less than zero, the age-standardized rate was considered to be trending downward. Otherwise, changes in rates were considered stable (not significantly changing over time).
All calculations were performed using R software (version 3.5.1).
Results
Analysis of uterine fibroids incidence
From 1990 to 2019, the global age-standardized incidence of uterine fibroids increased by 6.87% from 225.67 to 241.18 (Table I). The global age-standardized incidence showed a consistent increasing trend with an EAPC of 0.25 (95% CI: 0.24–0.27) (Table I, Figure 1 A, Supplementary Figure S1 A).
Table I
Incident cases and ASIR of uterine fibroids in 1990 and 2019 and its trends
Figure 1
EAPC of uterine fibroids ASRs from 1990 to 2019, by region. A – EAPC of ASIR. B – EAPC of age-standardized DALY rate
EAPC – estimated annual percentage change, ASRs – age-standardized rates, ASIR – age standardized incidence rate, DALY – disability adjusted life-year.
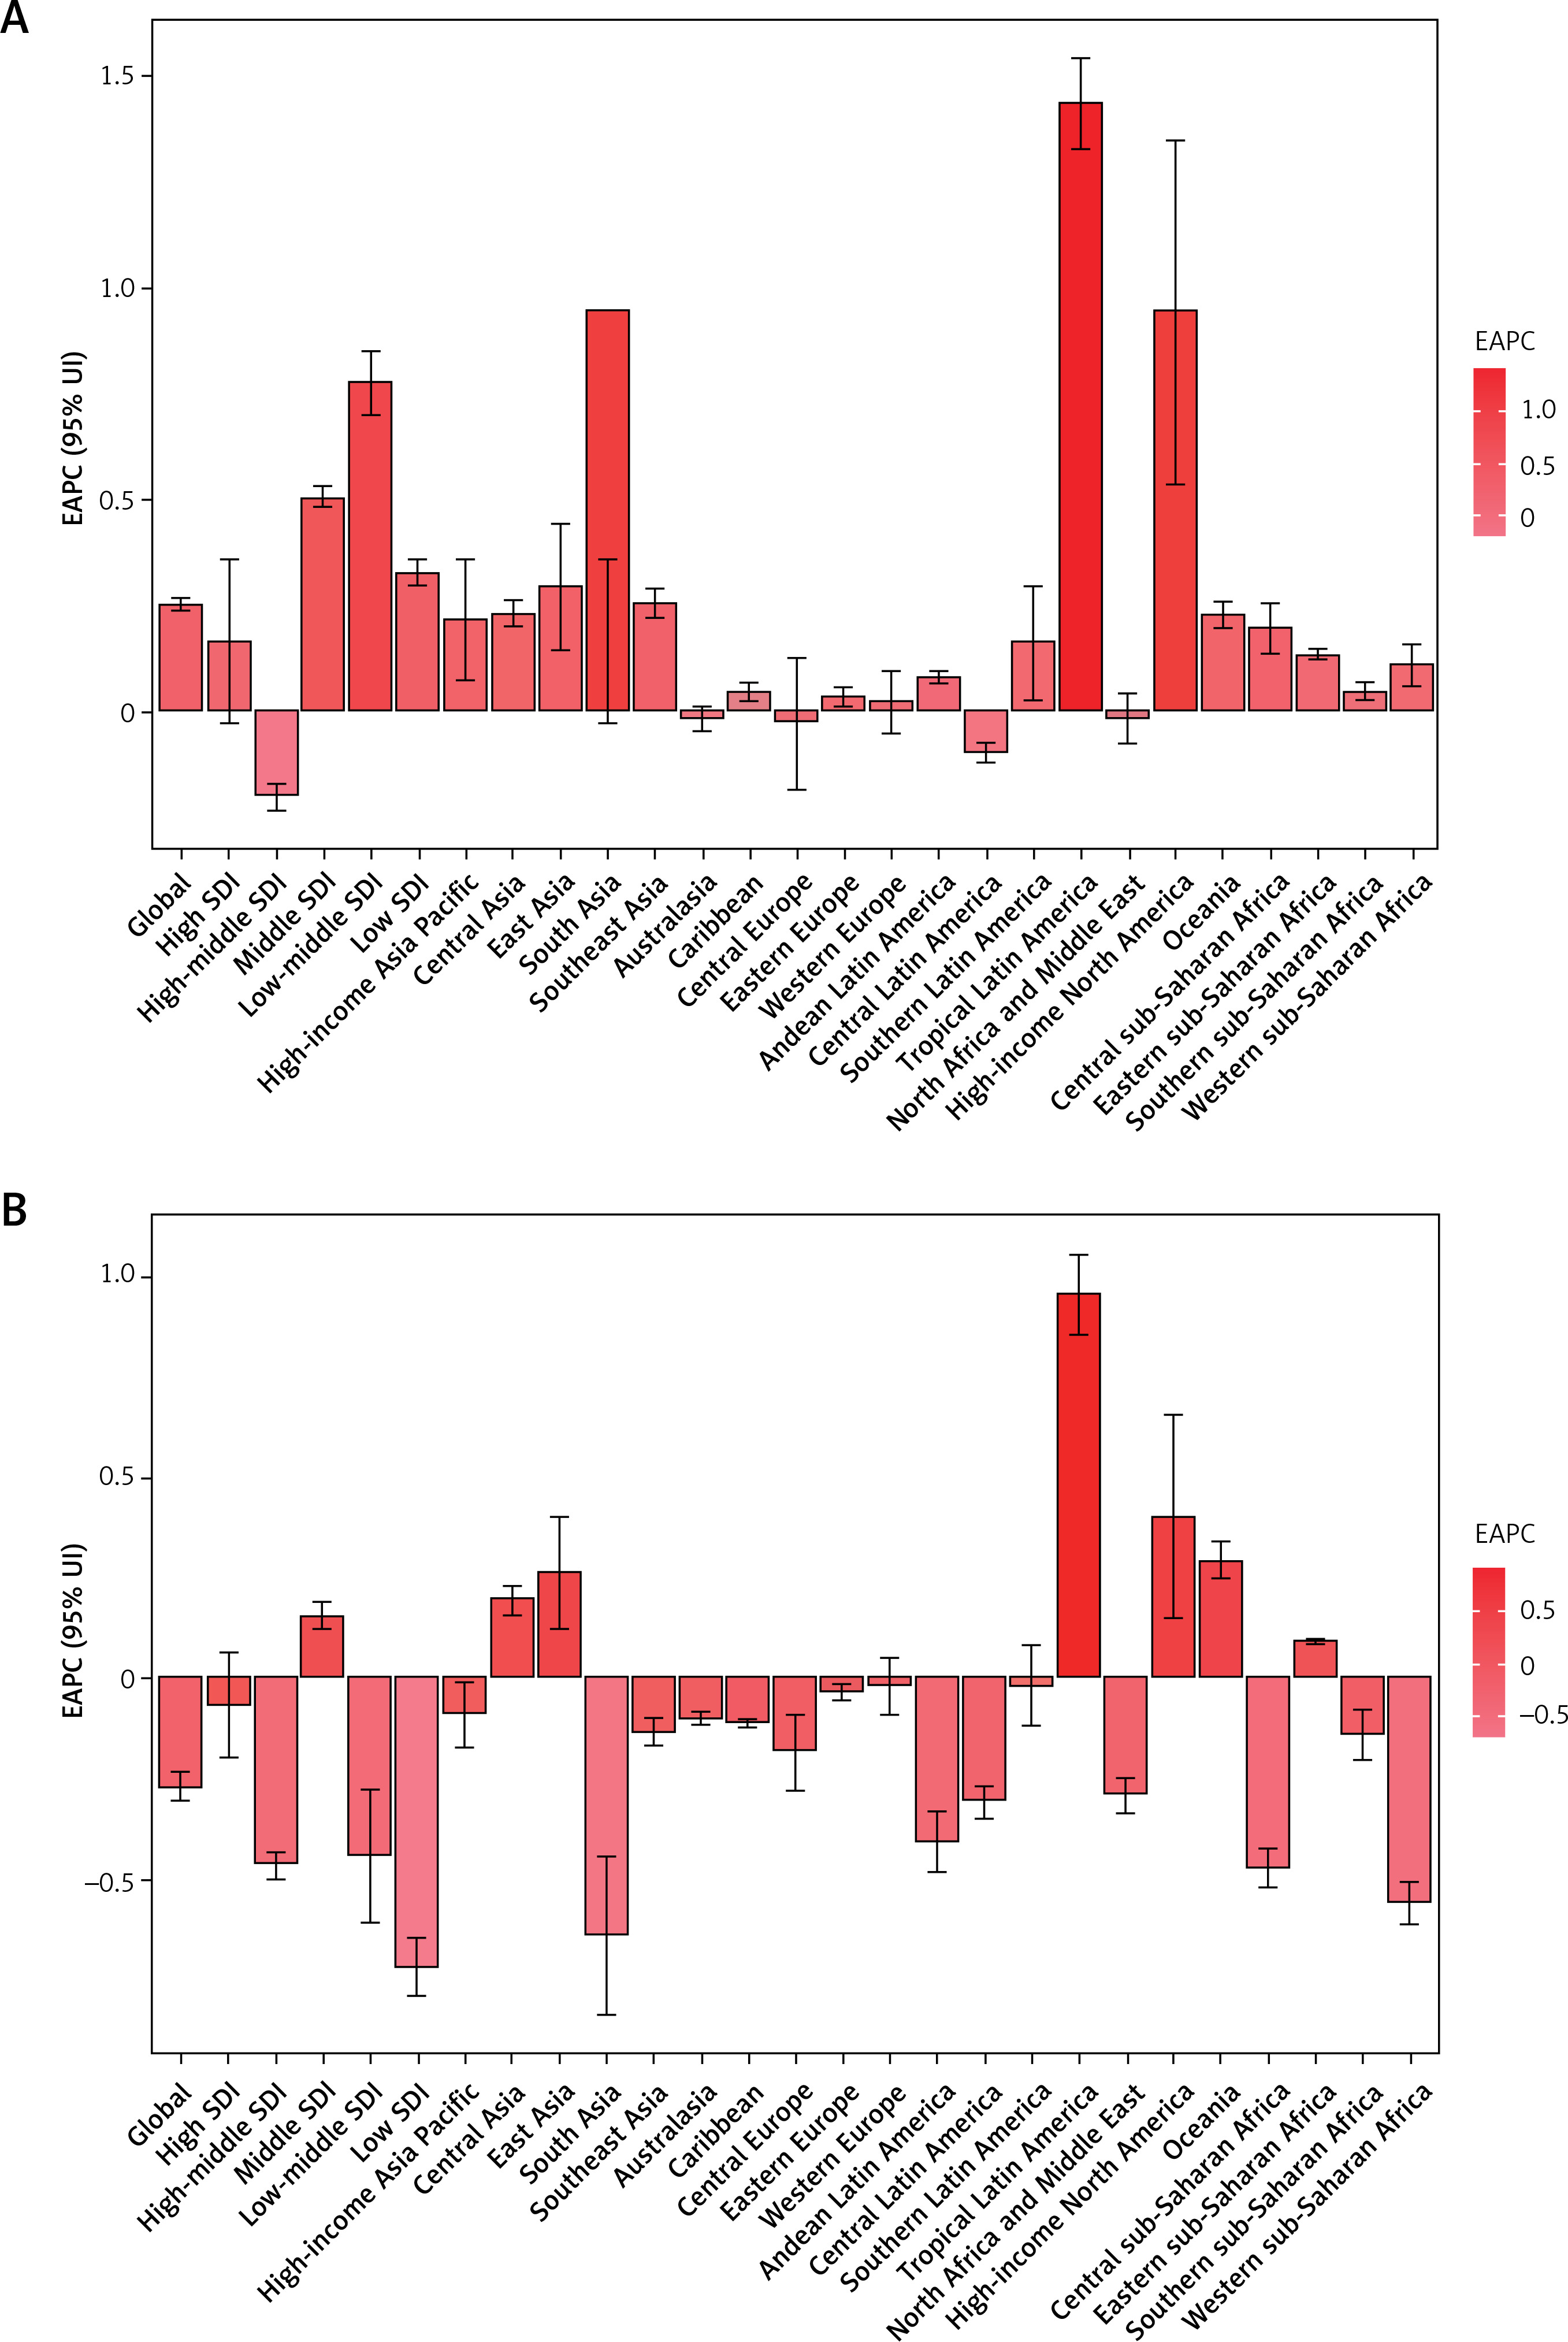
As shown in Table I and Supplementary Figure S1 A, the age-standardized incidence of uterine fibroids was much lower in middle SDI regions than in other SDI regions. In 2019, the high SDI group (262.37 per 100,000 population) showed the highest age-standardized incidence, followed by the low-middle SDI group (260.21 per 100,000 population). The age-standardized incidence increased most in the low-middle SDI group, where the EAPC was highest at 0.78 (Table I, Figure 1 A).
The EAPC in the age-standardized incidence of uterine fibroids was negatively (ρ = –0.095, p = 0.176) associated with the age-standardized incidence (Supplementary Figure S2 A), and also negatively (ρ = –0.136, p = 0.052) associated with the SDI (Supplementary Figure S2 B). In 2019, low SDI regions had the lowest uterine fibroids incidence among young people (15–49 years), whereas regions where the SDI increased from 1990 to 2019 had lower uterine fibroids incidence in older adults (Supplementary Figure S3 A and S3 B). The annual incidence of uterine fibroids increased among young people but decreased among older adults (Supplementary Figure S4 A).
In 2019, the highest regional age-standardized incidence of uterine fibroids was observed in Eastern Europe (582.03 per 100,000 population), followed by Andean Latin America (507.74 per 100,000 population) and Southern sub-Saharan Africa (499.05 per 100,000 population), whereas the lowest age-standardized incidence was found in Australasia (85.58 per 100,000 population), followed by North Africa and the Middle East (124.03 per 100,000 population) and Oceania (131.54 per 100,000 population) (Table I and Supplementary Table SII). From 1990 to 2019, the age-standardized incidence of uterine fibroids increased most in Tropical Latin America (EAPC = 1.44), South Asia (EAPC = 0.94), and High-income North America (EAPC = 0.94) and decreased most in Central Latin America (EAPC = –0.10), Central Europe (EAPC = –0.03), and North Africa and the Middle East (EAPC = –0.02) (Table I, Supplementary Table SII, Figure 1 A).
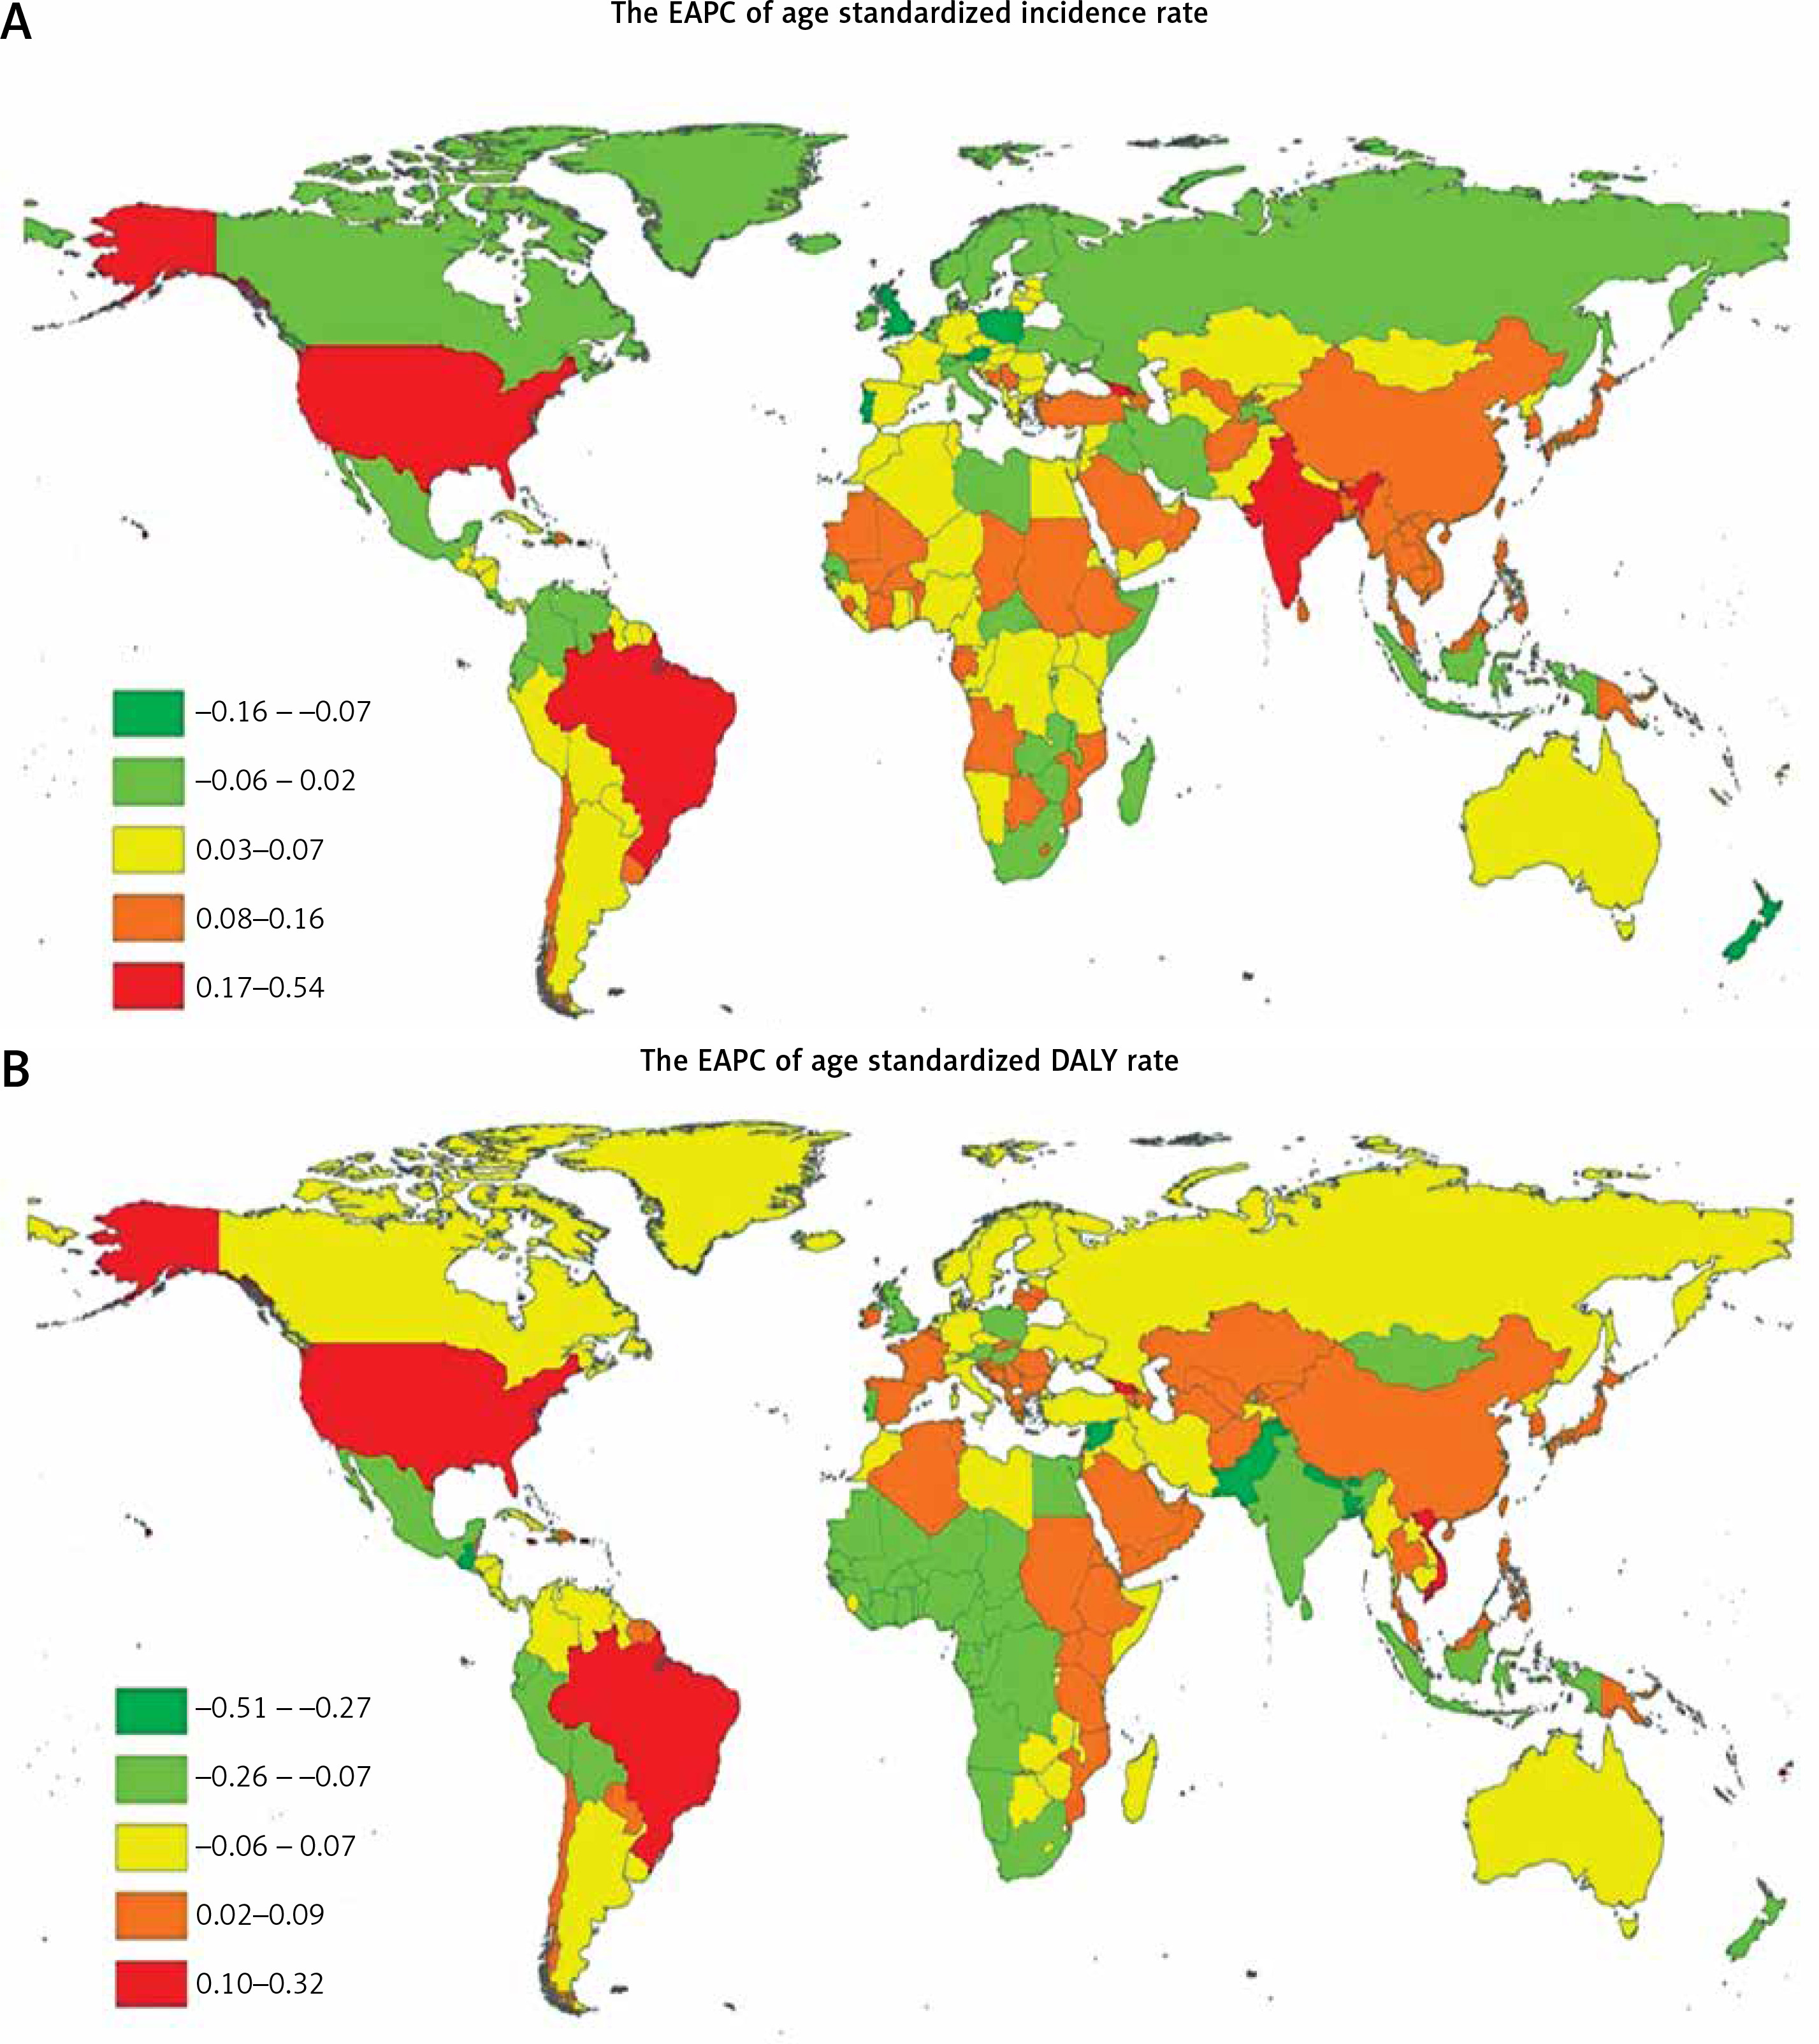
At the country level in 2019, the highest age-standardized incidence of uterine fibroids was observed in Latvia (667.14 per 100,000 population), followed by the Russian Federation (586.64 per 100,000 population) and Ukraine (578.21 per 100,000 population). The lowest age-standardized incidence of uterine fibroids was found in New Zealand (81.98 per 100,000 population), followed by Australia (86.13 per 100,000 population) and the Democratic People’s Republic of Korea (103.72 per 100,000 population) (Figure 2 A, Supplementary Table SI and SIII). From 1990 to 2019, the age-standardized incidence decreased most in Iran (Islamic Republic of) (total EAPC = –0.97) and increased most in Brazil (total EAPC 1.46) (Supplementary Table SI and SIII). Age distributions of incidence rate (per 100,000) for uterine fibroids in different countries in 2019 are shown in Supplementary Table SV and Supplementary Figure S5. Females aged 35–39 years or older had a higher incidence of uterine fibroids in global and all SDI regions (Supplementary Table SV).
Analysis of uterine fibroids-associated DALYs worldwide
From 1990 to 2019, uterine fibroids global age-standardized DALYs decreased by –9.97% from 36.64 to 33.32 (Table II). In contrast, age-standardized DALYs showed a decreasing trend, with an EAPC of –0.27 (95% CI: –0.31 to –0.23) (Table II, Figure 1 B, Supplementary Figure S1 B).
Table II
DALY cases and age-standardized DALY rate of uterine fibroids in 1990 and 2019 and its trends
As shown in Table II and Supplementary Figure S1 B, the age-standardized DALYs for uterine fibroids were much higher in regions with low-middle SDI values than in other SDI values regions. In 2019, the highest regional age-standardized DALYs were observed in low-middle SDI regions (40.42 per 100,000 population), followed by low SDI regions (35.70 per 100,000 population). Age-standardized DALYs increased only in middle SDI regions where the EAPC was highest (0.15, 95% CI: 0.12–0.19) (Table II, Figure 1 B).
The EAPC in the age-standardized DALYs for uterine fibroids was negatively (ρ = –0.031, p = 0.656) associated with the age-standardized DALYs but positively(ρ = 0.289, p < 0.001) with the SDI (Supplementary Figure S2 C and S2 D). In 2019, low SDI regions showed the lowest DALYs in young people (15–49 years), and regions where the SDI increased from 1990 to 2019 showed lower DALYs in older adults (Supplementary Figure S3 C and S3 D). Annual DALYs increased in young people but decreased in older adults (Supplementary Figure S4 B).
Regionally in 2019, the highest age-standardized DALYs for uterine fibroids were observed in Eastern Europe (75.11 per 100,000 population), followed by Southern sub-Saharan Africa (69.72 per 100,000 population) and Andean Latin America (68.25 per 100,000 population), while the lowest age-standardized DALYs were found in Australasia (10.48 per 100,000 population), followed by North Africa and the Middle East (15.75 per 100,000 population) and East Asia (17.39 per 100,000 population) (Table II and Supplementary Table SII). From 1990 to 2019, age-standardized DALYs increased most in Tropical Latin America (EAPC = 0.96), High-income North America (EAPC 0.40), and Oceania (EAPC 0.29) and decreased most in South Asia (EAPC = –0.64), Western sub-Saharan Africa (EAPC = –0.56), and Central sub-Saharan Africa (EAPC = –0.48) (Table II, Supplementary Table SII, Figure 1 B).
At the country level, in 2019, the highest age-standardized DALYs for uterine fibroids were observed in Latvia (87.61 per 100,000 population), followed by the Russian Federation (75.91 per 100,000 population) and Estonia (75.28 per 100,000 population), while the lowest age-standardized DALYs were found in New Zealand (10.07 per 100,000 population), followed by Australia (10.55 per 100,000 population) and Afghanistan (13.79 per 100,000 population) (Figure 2 B, Supplementary Table SI and SIV). From 1990 to 2019, age-standardized DALYs for uterine fibroids decreased most in Nepal (EAPC = –2.47) and increased most in Brazil (EAPC, 0.97). (Supplementary Table SI and SIV). Age distributions of death rate (per 100,000) for uterine fibroids in different countries in 2019 are shown in Supplementary Table SVI and Supplementary Figure S6. Females aged 45–99 years or older had a higher DALY of uterine fibroids in low and low-middle SDI regions (Supplementary Table SVI).
Discussion
This study systematically analyzed the global incidence and DALY rates of uterine fibroids and the changing trends in these characteristics from 1990 to 2019. We found that the global age-standardized incidence was consistently increasing over this time period. However, age-standardized DALYs were decreasing. Globally, women aged 35–39 years or older had a higher incidence of uterine fibroids than younger women.
The increased incidence of uterine fibroids and the associated mortality can largely be attributed to population aging, increased incidence of metabolic diseases and increased infertility rates [6]. With the advancement of medical technology, the scope of gynecological examinations has expanded, with increasing numbers of women receiving early diagnosis and treatment – potentially inflating incidence rates [12]. Global age-standardized DALYs decreased from 1990 to 2019, possibly due to these same effective diagnostic and therapeutic strategies [13].
The burden of uterine fibroids varies widely around the world, mainly due to differences in population structure and socioeconomic status. In 2019, high SDI countries had the highest age-standardized incidence rates, probably because these regions have adequate medical resources and well-established health care systems, leading to increased diagnostic rates. However, in contrast, the highest regional age-standardized DALYs were observed in low-middle SDI regions, and middle SDI regions experienced increased DALYs from 1990 to 2019. Lou et al. utilized an age-period-cohort (APC) model to estimate overall annual percentage changes in the rate of incidence of uterine fibroids; they also evidenced the serious burden of uterine fibroids in middle SDI, low-middle SDI and low SDI quintiles [14], but they found that the higher SDI group had lower fibroid incidence (using net drift), which is different from our study (using EAPC). These findings suggest that these low-middle and middle SDI regions have both a high disease burden and worse disease outcomes, suggesting that female gynecological disease screening and treatment should be improved in these regions, early diagnosis and treatment regimens should be widely implemented, and advanced diagnostic and treatment techniques should be developed and expanded in these regions.
From 1990 to 2019, the age-standardized incidence of uterine fibroids increased most significantly in Tropical Latin America and South Asia. With rapid economic development, the lifestyles and dietary intake of those living in these regions have changed significantly in recent years, with uterine fibroids showing a corresponding trend of increased incidence and younger age of onset. Internal factors such as race and genetics, in addition to co-occurring gynecological diseases, poor diet and lifestyle, obesity and pelvic inflammatory disease, may serve as risk factors for the occurrence and development of uterine fibroids [15]. Additionally, the synergistic effect of estrogen and progesterone signaling promotes the occurrence and development of uterine fibroids [15].
Almost all published studies have shown that African-American women have a higher prevalence of fibroids than other women. According to ultrasound screening studies, prospective studies of the clinical diagnostic rates of uterine fibroids and pathological studies of hysterectomy specimens, African-American women have a two- to three-fold higher risk of developing uterine fibroids than other women [16–18]. Uterine fibroids are the most common benign tumors of the female reproductive tract. However, their true prevalence may be underestimated, as their histological incidence is more than twice that of their clinical incidence [19]. A recent longitudinal study estimated that the lifetime risk of developing fibroids in women over the age of 45 was greater than 60%, with a higher incidence seen in those of African ancestry than other populations [19].
This study explored the global, regional and national disease burden and age distribution of uterine fibroids from 1990 to 2019, and analyzed the impact of SDI on these characteristics. The advantage of this study lies in the identification of high-risk groups, which can then be targeted to explore the etiology of uterine fibroids in specific areas, provide novel early prevention strategies and reduce the incidence and DALY rates of uterine fibroids. The results of our analysis will provide critical information for understanding global trends in the uterine disease burden worldwide and provide strong data support for public health decision-making.
This study also has some shortcomings: (1) the statistical methods of the GBD 2019 study may impact our findings, such as the inclusion of biased data, incomplete data for some countries, and relatively low-quality data; and (2) unbalanced internal economic development of specific countries or regions that cannot be fully reflected in the SDI.
In conclusion, the global age-standardized DALY rates of uterine fibroids decreased from 1990 to 2019. However, the global age-standardized incidence was consistently increasing over the same time period. Worldwide, Tropical Latin America experiences the greatest burden of disease. Globally, women aged 35–39 years or older have a higher incidence of uterine fibroids than younger women. Together, our findings suggest that uterine fibroids remain an important health challenge, both globally and locally.