Introduction
Indoleamine 2, 3-dioxygenase 1 (IDO1) is an enzyme encoded by the IDO1 gene. Basically, it functions as a rate-limiting enzyme that catalyzes the catabolism of tryptophan to N-formyl-kynurenine (Kyn). It is well evidenced that IDO1 upregulation induces an immune suppressive effect in the tumor microenvironment [1], which was related to several possible mechanisms. For example, tryptophan depletion results in the activation of the amino-acid-sensitive GCN2 and/or mTOR signaling pathways of T cells, leading to subsequent T cell cycle arrest and autophagy [1]. Secondly, the metabolic products of tryptophan, such as L-Kyn and 3-hydroxy-L-Kyn, can activate the aryl hydrocarbon receptor (AhR), which leads to induced IDO1 expression in some dendritic cells (DCs) and also the conversion of naive CD4+ T cells into regulatory T cells (Treg) [2, 3].
In the past decades, immune checkpoint blockade therapy has shown promising therapeutic effects in some solid tumors, including esophageal cancer (ESCA) [4]. Cytotoxic T-lymphocyte-associated protein 4 (CTLA-4), programmed cell death-1 (PD-1) and programmed cell death-ligand 1 (PD-L1) are the three targets with drugs approved for clinical application. Although the antibody targeting PD-1 significantly prolonged overall survival (OS) and recurrence-free survival (RFS) compared with traditional chemotherapy in patients with advanced ESCA, the overall response rate (ORR) is only around 30% [5]. Some recent studies found that IDO1 activity is also involved in the resistance to anti-PD-1 in non-small cell lung cancer [6] and glioblastoma [7].
Esophageal cancer has well demonstrated IDO1 upregulation [8–10]. The involvement of IDO1 in immune tolerance and poor prognosis in patients with ESCA is also confirmed [8–11]. These findings suggest that IDO1 might act as an important immune modulator and a prognostic marker in ESCA. Several studies have indicated that promoter hypomethylation plays a critical role in enhanced IDO1 transcription in breast cancer [12, 13] and ESCA [10]. Esophageal squamous cell carcinoma (ESCC) and esophageal adenocarcinoma (ESAD) are the two dominant histological subgroups of ESCA, which have distinct differences in terms of origins, molecular background (such as copy number abnormalities, mutational patterns and driver genes) and prognosis [14–16]. Therefore, it is valuable to determine the differences of IDO1 in expression profiles, genetic/epigenetic alterations, and prognostic value in ESCC and ESAD. In this study, we tried to explore these differences using data from The Cancer Genome Atlas (TCGA)-ESCA and the Genotype-Tissue Expression (GTEx) project.
Material and methods
Data retrieval from TCGA-ESCA
The level-3 data in TCGA-ESCA were acquired as described in our previous publication [17], using the UCSC Xena browser (https://xenabrowser.net/). Briefly, 96 ESCC cases, 89 ESAD cases and 18 normal esophageal tissues were included. No patient received neoadjuvant treatment. All tumor cases and 16 normal tissues cases had gene methylation data measured by Infinium Human Methylation 450k BeadChip. All ESAD cases, 95 ESCC, and 11 normal tissues cases had RNA-seq data of gene expression (calculated as log2(RSEM + 1)). 88 ESAD and 95 ESCC cases had gene-level copy number alteration (CNA) data. CNA was defined as homozygous deletion (–2), heterozygous loss (–1), copy-neutral (0), low-level copy gain (+1), and high-level amplification (+2), by the GISTIC2 method [18]. The clinicopathological and OS data of the patients were also extracted for re-analysis.
IDO1 transcript analysis in TCGA-ESCA and the GTEx project
The transcript profile of IDO1 in ESCA tissues and in normal esophageal tissues was analyzed using the UCSC Xena browser (https://xenabrowser.net/) [19]. IDO1 transcript information in normal esophageal tissues was provided by the GTEx project, which is a large database of tissue-specific gene expression [20, 21]. Over 600 cases of normal esophageal tissues were included in this database for gene transcript analysis. Log2 transcript per million (TPM) was calculated and compared.
The genomic structure of the IDO1 gene was examined using the human chromosomal map provided by Ensembl [22].
Immunohistochemical staining of IDO1
Human paraffin-embedded ESAD and ESCC tissue array was purchased from Alenabio (Xian, China), which includes 11 ESAD cases and 17 ESCC cases. Immunohistochemical (IHC) staining was conducted as described in a previous study [23]. In brief, the tissue array was treated with 3% H2O2 for inactivating tissue peroxidases. The primary antibody used was anti-IDO1 (1 : 500, Cat#HPA027772, Sigma-Aldrich, St. Louis, MO, USA). Labeling was performed by biotinylated secondary antibodies (SP-9001, ZSGB-BIO, Beijing, China) and a DAB kit (ZSGB-BIO), with hematoxylin used for counterstaining. Staining scoring was performed by two experienced pathologists without authorship in this study. The expression score is a combination of staining intensity and cell fractions, according to the standards proposed by the Human Protein Atlas [24]. The final staining scores were defined as not detected, low, medium and high.
Statistical analysis
Statistical analysis was performed using GraphPad Prism 8.04 (GraphPad Inc., La Jolla, CA, USA) or SPSS 25.0 software package (SPSS Inc., Chicago, IL, USA). One-way ANOVA followed by Tukey’s multiple comparison test was performed. Pearson’s correlation coefficient was calculated for correlation analysis. Kaplan-Meier curves were generated for OS comparison between patients with the highest and the lowest tertile IDO1 expression, with the log-rank test to check the statistical differences. Univariate and multivariate Cox regression models were used to evaluate the prognostic significance of IDO1 expression in terms of OS in ESCC and ESAD patients respectively, by setting its expression as a continuous variable. Value of p < 0.05 was considered statistically significant.
Results
Analysis of IDO1 expression in ESCC, ESAD and normal esophageal tissues
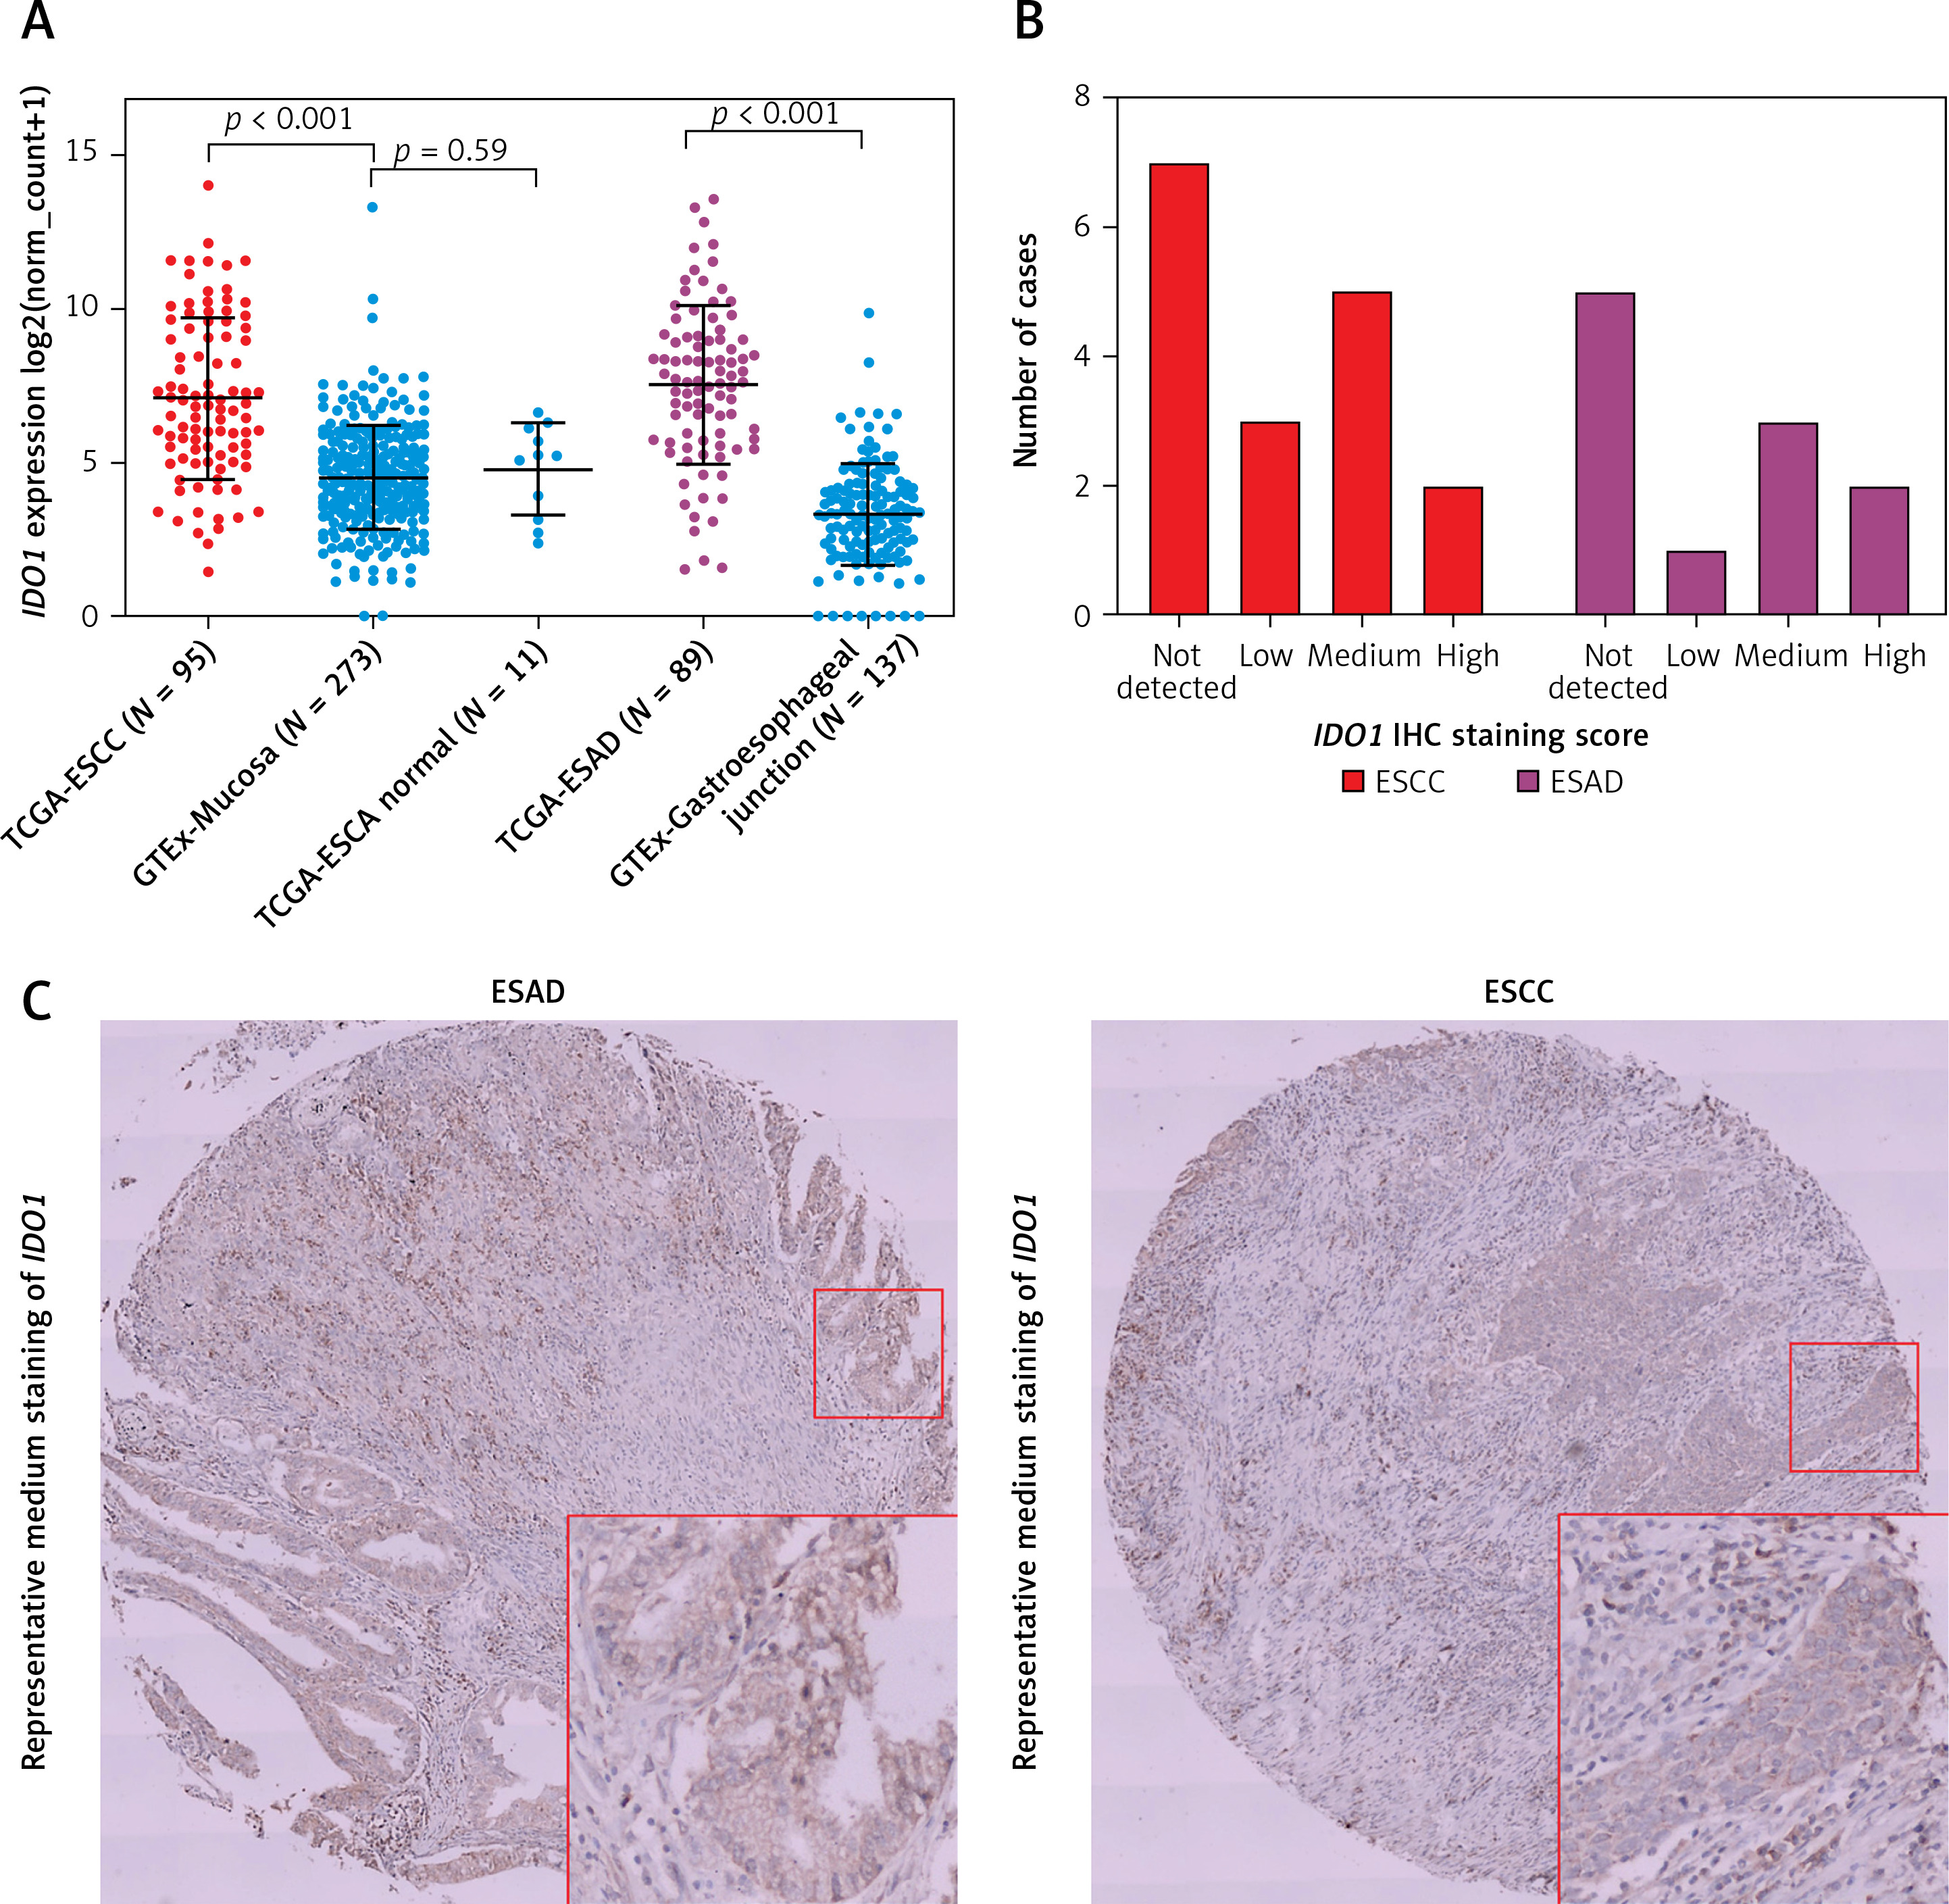
Using RNA-seq data of tumor tissues in TCGA-ESCA and normal tissues in GTEx-Esophagus, we found that IDO1 expression was significantly upregulated in ESCC (N = 95) and ESAD (N = 89) tissues compared to the respective normal esophageal tissues (mucosa and gastroesophageal junction, N = 273 and 137 respectively, p < 0.001, Figure 1 A). Then, we performed IHC staining to check IDO1 expression at the protein level; 10/17 ESCC cases (3 low, 5 medium and 2 high) and 6/11 ESAD cases (1 low, 3 medium and 2 high) had IDO1 protein expression (Figure 1 B). Representative images of medium IDO1 staining in ESAD and ESCC are shown in Figure 1 C.
Figure 1
IDO1 expression was significantly upregulated in both ESAD and ESCC compared with normal esophageal tissue. A – Plot chart comparing the expression of IDO1 in ESAD/ESCC tissues in TCGA and normal esophageal tissues in GTEx. B – Summary of IHC staining score of IDO1 expression in 11 ESAD and 17 ESCC cases. C – Representative images of medium IDO1 staining in ESAD (up) and ESCC (down) tissues
IDO1 expression was irrelevant to the gene-level copy numbers
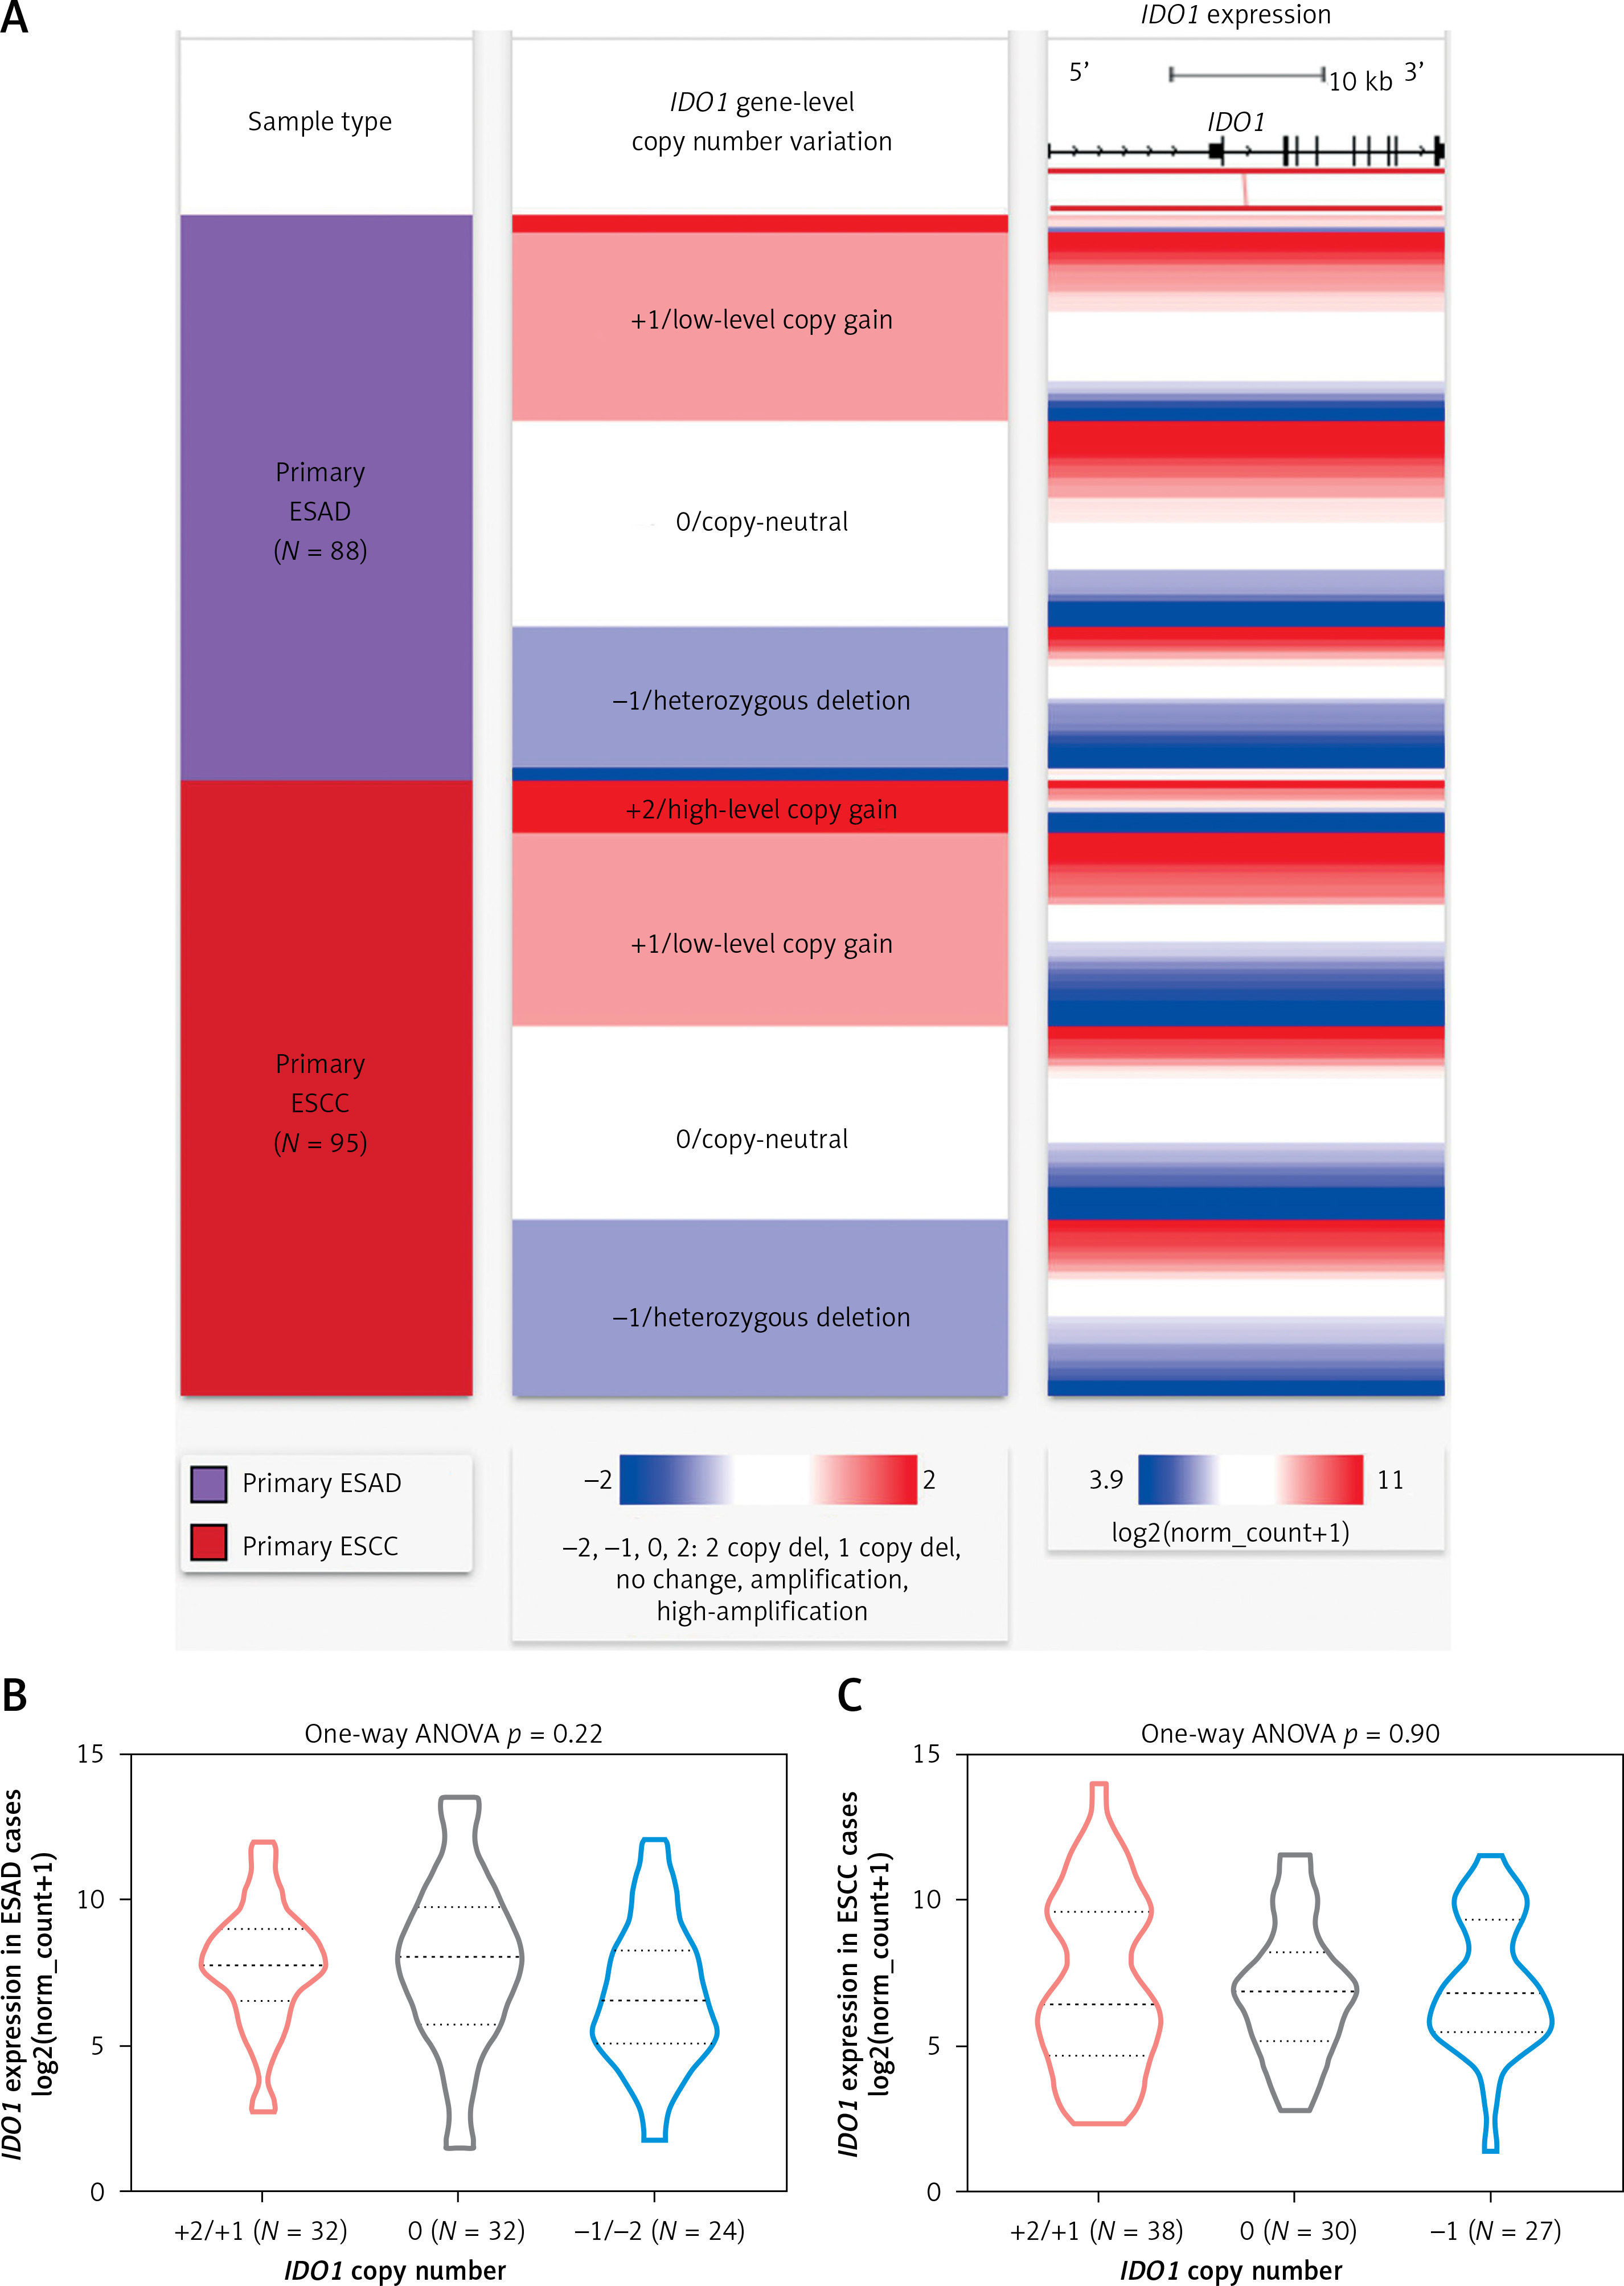
By checking gene-level CNA of IDO1 in ESAD and ESCC respectively, we found that among 88 ESAD cases with CNA data, there were 3 high-level amplifications (+2), 29 low-level amplifications (+1), 32 copy-neutral (0), 22 heterozygous deletions (–1), and 2 homozygous deletions (–2) (Figure 2 A). Among 95 ESCC cases, there were 8 high-level amplifications, 30 low-level amplifications, 30 copy-neutral and 27 heterozygous deletions (Figure 2 A). However, neither the amplification group nor the deletion group was associated with dysregulated IDO1 expression, compared to the copy-neutral group in ESAD (Figure 2 B) and in ESCC (Figure 2 C) cases.
Figure 2
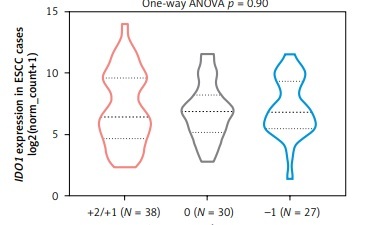
IDO1 expression was irrelevant to the gene-level copy numbers. A – Heat map showing the correlation between IDO1 expression and its gene-level CNAs in ESAD and ESCC cases. B, C – Violin plot chart showing the expression of IDO1 in different CNA groups in ESAD (B) and ESCC (C) cases. CNAs were defined as homozygous deletion (–2), heterozygous loss (–1), copy-neutral (0), low-level copy gain (+1), and high-level amplification (+2)
Analysis of the methylation profile of CpG sites in IDO1 locus in ESAD and ESCC patients
Some recent studies reported that the expression of IDO1 in ESCC was regulated by promoter methylation in multiple cancers, including ESCC [10, 12]. Using methylation 450k BeadChip data, we checked the methylation profile of 3 CpG sites in the IDO1 gene locus (Figure 3 A). In ESAD cases, only cg10262052 was hypomethylated in cancerous tissues compared to normal tissues (Figure 3 B); no significant difference was observed in the other two CpG sites, between cancerous and normal tissues (Figures 3 C, D). In ESCC cases, cg10262052 and cg08465774 were hypomethylated, while cg24188163 was hypermethylated in cancerous tissues compared to normal tissues (Figures 3 B–D).
Figure 3
Analysis of methylation profile of CpG sites in IDO1 locus in ESAD and ESCC patients. A – Heat map showing IDO1 expression and methylation profile of 3 CpG sites in IDO1 gene locus in ESAD and ESCC cases B–D – Plot charts showing the methylation level of cg10262052 (B) cg08465774 (C) and cg24188163 (D) in normal esophageal, ESAD and ESCC tissues. E, F – Plot charts showing the correlation between IDO1 expression and the methylation level of cg10262052 in ESAD (E) and ESCC (F) tissues. G, H – Plot charts showing the correlation between IDO1 expression and the methylation level of cg08465774 (G) and cg24188163 (H) in ESCC tissues
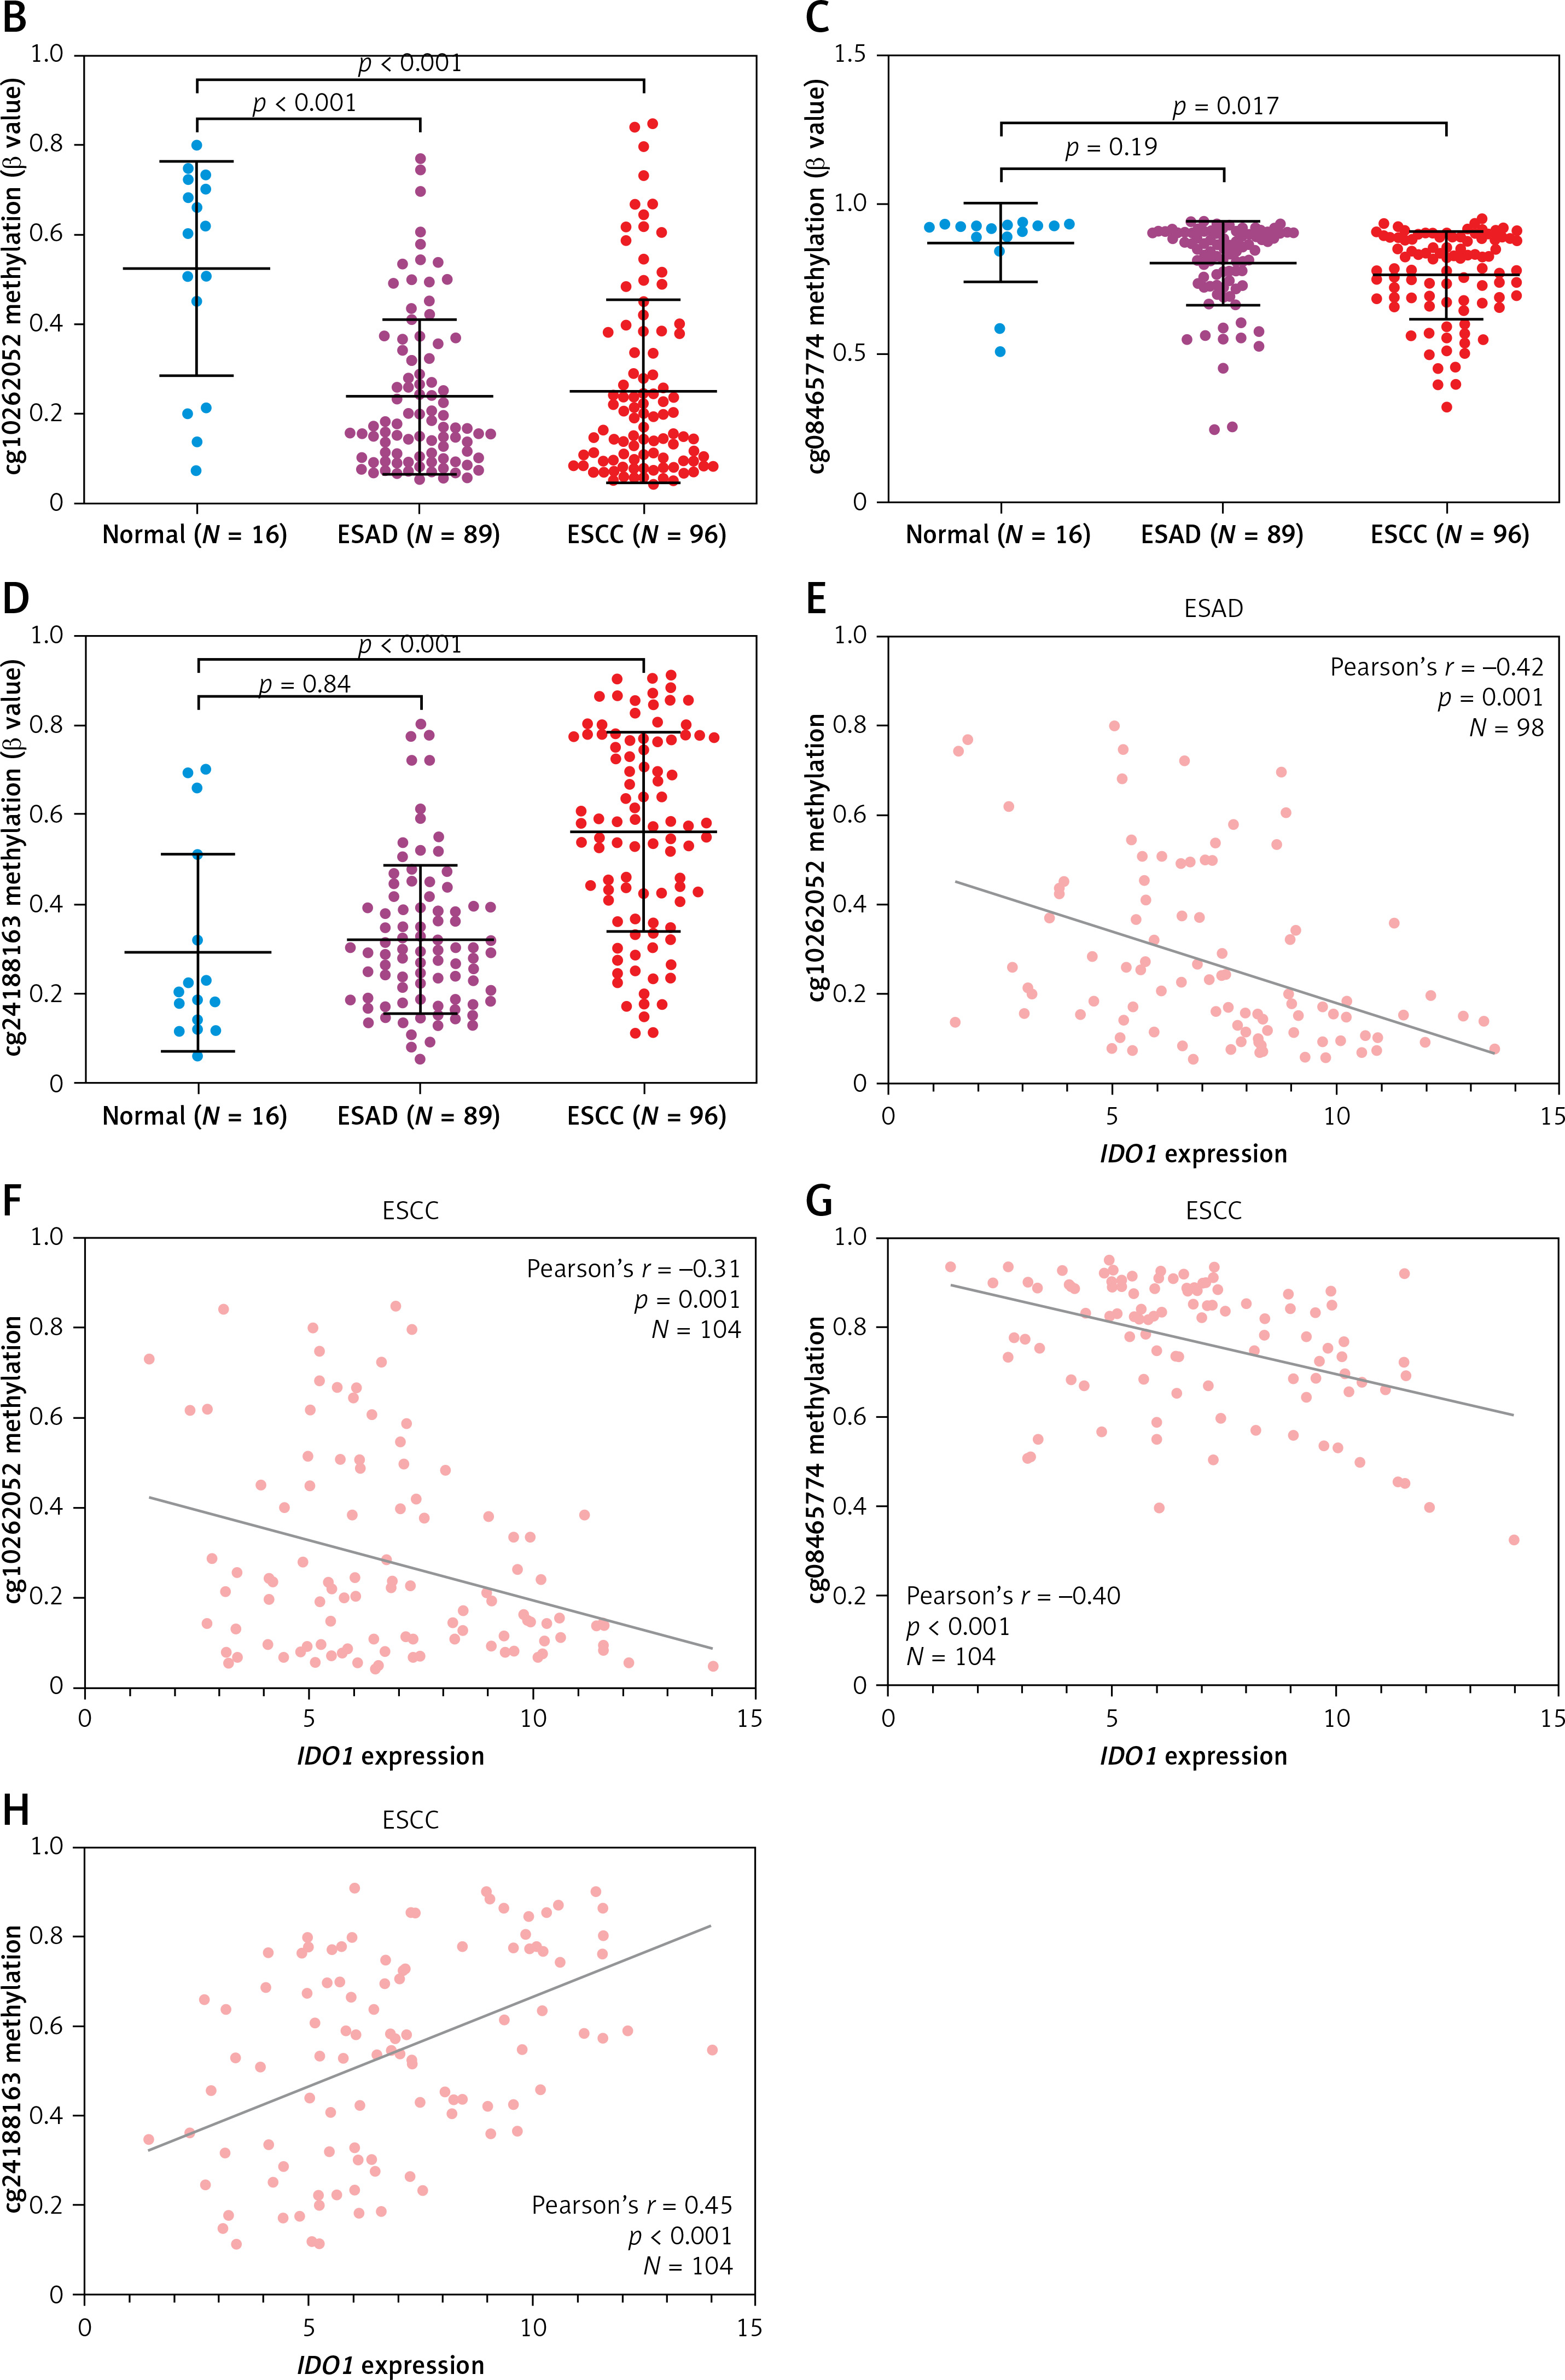
When we performed Pearson’s correlation analysis, we found a moderately negative correlation (Pearson’s r = –0.42) between cg10262052 methylation and IDO1 expression in ESAD patients (Figure 3 E). Correlation analysis also confirmed negative correlations between cg10262052/cg08465774 methylation and IDO1 expression in ESCC patients (Figures 3 F, G). Interestingly, cg24188163 methylation was positively correlated with IDO1 expression (Pearson’s r = 0.45) in these patients (Figure 3 H).
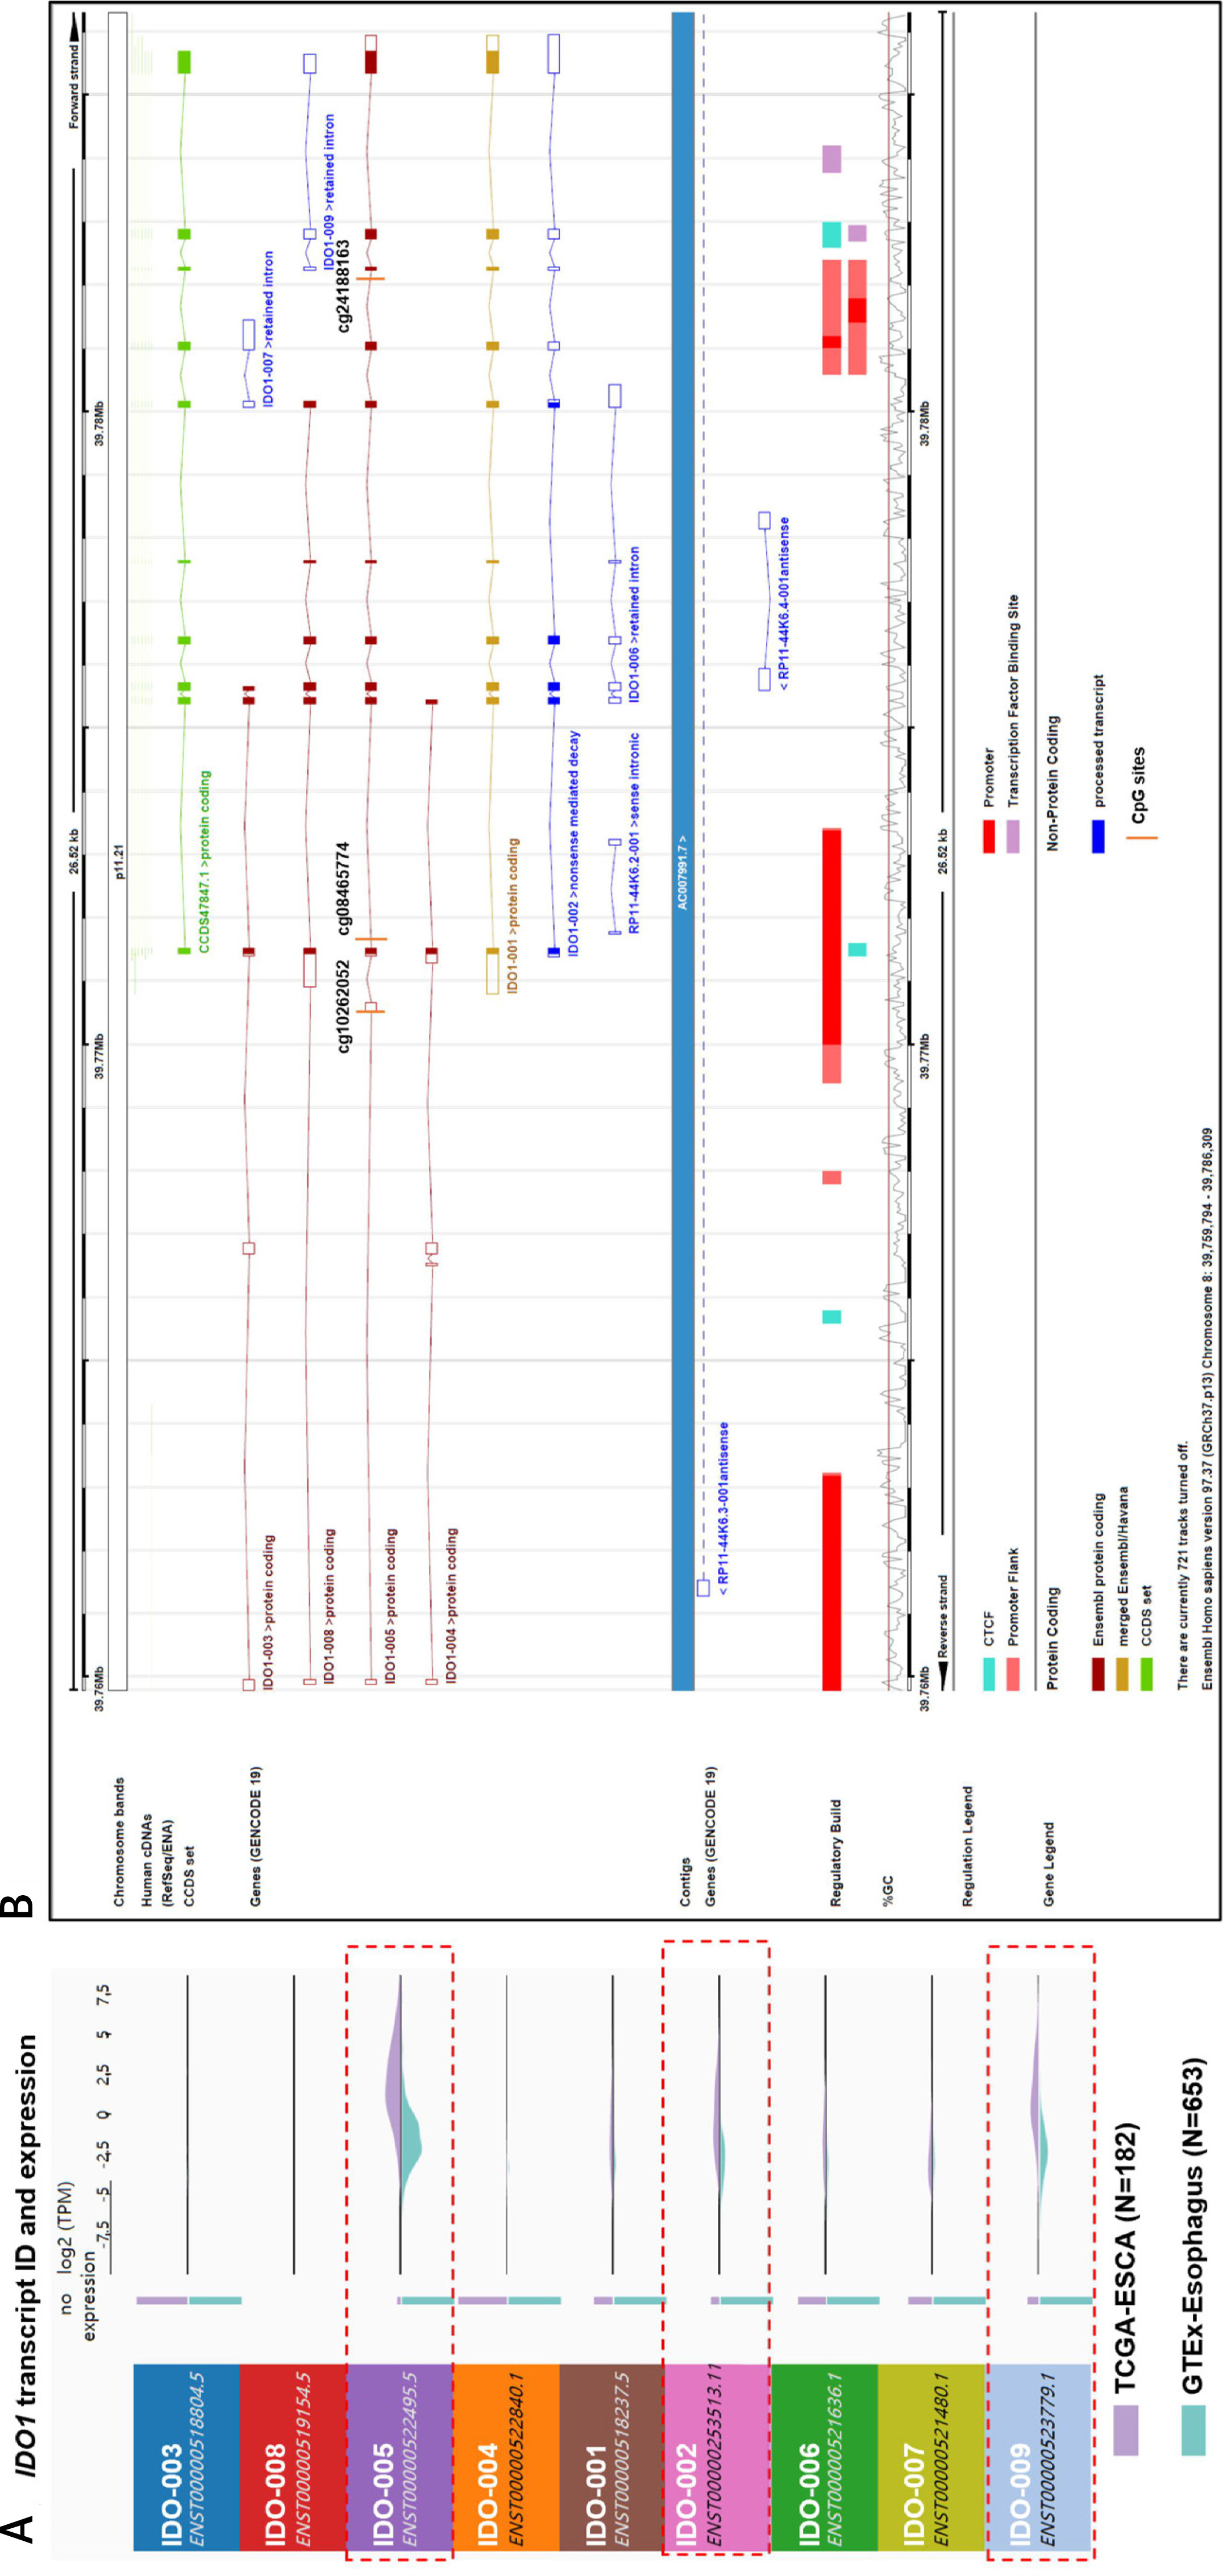
Transcript analysis of IDO1 in ESCA and normal esophageal tissues
The transcriptional profile of IDO1 between cancerous and normal tissues was compared using data from both TCGA and GTEx. The results indicated that the IDO1 gene has 9 splice variants. Three transcripts were significantly upregulated: ENST00000522495, which is the dominant and the canonical protein-coding transcript of IDO1, and two non-protein coding transcripts, ENST00000253513 and ENST00000523779 (Figure 4 A). By checking the genomic structure of the IDO1 gene using Ensembl (https://grch37.ensembl.org/Homo_sapiens/Location/View?r=8:39759794-39786309), we checked the transcript profiles of IDO1 and genomic locations of the 3 CpG sites. Interestingly, we observed that IDO1 has multiple promoter regions in its gene locus (Figure 4 B). Among the 3 CpG sites, cg10262052 and cg08465774 are promoter-associated, while cg24188163 is located within the gene body of IDO1, in the intron between the protein-coding exons 7 and 8, which is also a flanking region of an intragenic alternative promoter (Figure 4 B).
Figure 4
IDO1 transcript profile in ESCA and genomic structure. A – Comparison of expression profile of IDO1 transcripts in cancerous tissues in TCGA-ESCA and in normal esophageal tissues in GTEx-Esophagus. TPM: transcripts per kilobase million. B – Genomic structure of IDO1 gene, which was accessed via: https://grch37.ensembl.org/Homo_sapiens/Location/View?r=8:39759794-39786309. The annotations were as marked at the bottom of the image
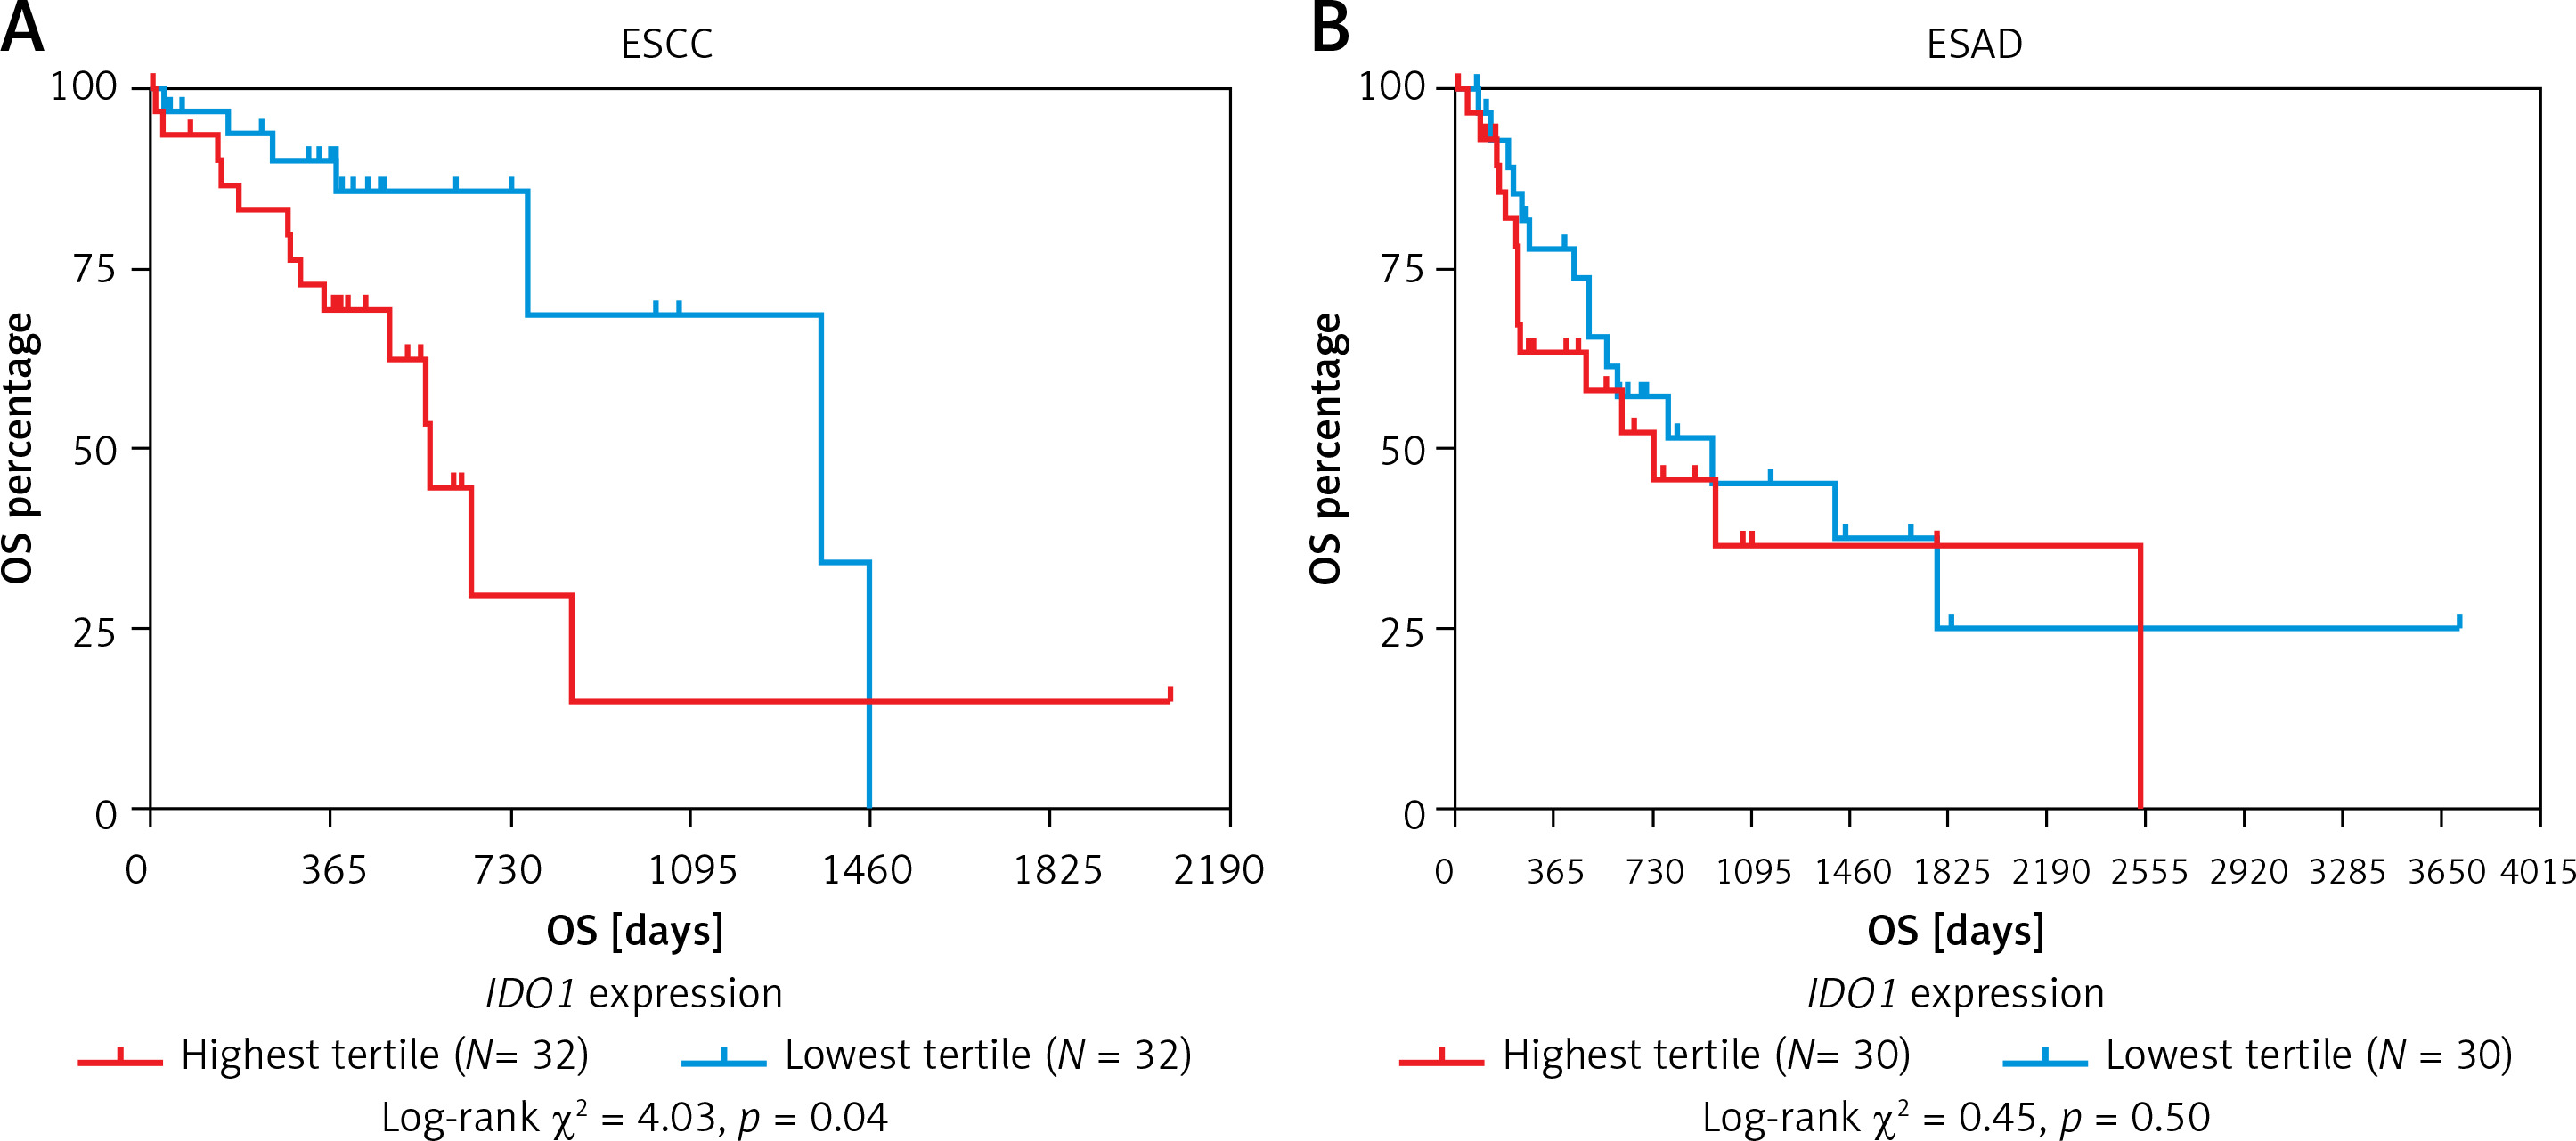
IDO1 expression independently predicts shorter OS in ESCC, but not in ESAD patients
Kaplan-Meier survival curves were developed to compare the OS of patients with the highest tertile and lowest tertile IDO1 expression. The log-rank test indicated that high IDO1 expression was associated with significantly shorter OS in ESCC patients (Figure 5 A), but not in ESAD patients (Figure 5 B).
Figure 5
Kaplan-Meier survival curves of OS in ESCC (A) and ESAD (B) patients. Comparisons were performed between patients with the highest tertile and lowest tertile IDO1 expression
Univariate and multivariate analysis revealed the independent prognostic value of IDO1 expression in terms of OS in ESCC patients (HR = 1.183, 95% CI: 1.025–1.367, p = 0.022), after adjustment for gender and pathological stages. In comparison, IDO1 expression was not a risk factor of unfavorable OS in ESAD patients (Table I).
Table I
Univariate and multivariate analysis of OS in ESCC/ESAD patients
Discussion
IDO1 positive ESCA tissues have a significantly higher proportion of FOXP3-positive cells, suggesting that its expression is closely associated with an immune-suppressive tumor microenvironment [11]. Therefore, a clear understanding of the mechanisms leading to its dysregulation would provide a new rationale to make better immunotherapeutic strategies.
Type I (IFN-α and IFN-β) and type II (IFN-γ) interferons are potent IDO1 inducers in human cancer tissues [25]. Activation of AhR in DCs induced by the metabolic products of tryptophan also stimulates the generation of IDO1 by DCs [26, 27], thereby forming a positive feedback regulatory network. Recent studies showed that IDO1 expression is modulated by promoter methylation in some cancers [10, 12, 13]. Specifically, in ER-positive breast cancer cells, cg10262052 methylation is inversely correlated with IDO1 expression [12]. In ESCA, IDO1 expression is also regulated by promoter methylation [10]. However, it is not clear whether there are differences in methylation patterns between ESAD and ESCC.
By analyzing the correlation between CpG sites’ methylation and IDO1 expression in ESAD and ESCC patients respectively, we observed different trends of the correlations. In ESAD cases, only cg10262052 was significantly hypomethylated in cancer tissues and its methylation level was negatively correlated with IDO1 expression. In comparison, all 3 CpG sites in ESCC were related to IDO1 dysregulation. cg10262052 and cg08465774 were hypomethylated, while cg24188163 was hypermethylated in cancerous tissues. Correlation analysis showed negative correlations between cg10262052/cg08465774 methylation and IDO1 expression and a positive correlation between cg24188163 methylation and IDO1 expression. Therefore, we infer that the methylation-mediated IDO1 dysregulation might be tissue-specific.
Although promoter hypermethylation is a well-characterized mechanism leading to gene suppression, some recent studies reported that gene body methylation has distinct regulatory effects on gene expression, which may lead to enhanced gene transcription [28]. However, the mechanisms underlying this phenomenon are quite complex and far from been fully understood. Some mechanisms have been proposed to illustrate the association. Gene body methylation might suppress the initiation of intragenic promoters [29], contributing to the formation of an ordered structure within the transcribed unit that facilitates transcription by supporting elongation or splicing [30]. One recent study demonstrated that intragenic DNA methylation is directly associated with pre-mRNA slicing [31, 32]. Binding of the methyl-sensitive zinc-finger protein CCCTC-binding factor (CTCF) to intragenic DNA leads to local pol II accumulation and favors the inclusion of weak upstream exons in spliced mRNA through kinetic regulation [31]. In comparison, 5-methylcytosine (5mC) evicts CTCF and results in exon exclusion and splicing [31]. In addition, it might contribute to the formation of borders at enhancers or promoters, thereby enhancing transcription of specific transcripts [33, 34]. In the IDO1 gene locus, cg10262052 and cg08465774 are promoter-associated, while cg24188163 is located within the gene body of IDO1 between exons 7 and 8, where there is also a flanking region of an alternative intragenic promoter. Among the three transcripts upregulated in ESCA, ENST00000523779 only contains exons 8, 9 and 10, suggesting that there is a splicing event before exon 8 after transcription. Based on the mechanisms discussed above, we hypothesized that cg24188163 methylation might contribute to the suppressed initiation of the intragenic promoter and contribute to the splicing events associated with ENST00000523779 in ESCC cases. However, future molecular studies should be conducted to confirm the hypothesis and to explore the different regulatory effects of the CpG sites on IDO1 expression in ESAD and ESCC.
IDO1 expression has been identified as a potential prognostic biomarker in ESCA [8–11]. Kiyozumi et al. reported that in patients with ESAD, IDO1 expression and its promoter hypomethylation were associated with unfavorable OS [10, 11]. However, no subgroup analysis was performed to separate ESAD and ESCC in these studies. Rosenberg et al. reported a link between high IDO1 expression and worse OS in both ESAD and ESCC subgroups [8]. However, the prognostic value was not adjusted for other well-established risk factors, such as gender and pathologic stages. One very recent study showed that in ESCC cases after neoadjuvant chemoradiotherapy, IDO1 expression was an independent prognostic factor for RFS [9]. But OS was not assessed in this study. In the current study, we generated Kaplan-Meier survival curves and performed univariate and multivariate analyses to assess the prognostic value of IDO1 mRNA expression in terms of OS in ESAD and ESCC patients. Our data showed that IDO1 expression might only have independent prognostic value in ESCC patients, but not in ESAD patients.
The current study contributes to understanding the methylation profiles and prognostic significance of IDO1 in ESCC and ESAD separately. In combination with previous studies, we can infer that IDO1 expression might serve as an independent prognostic biomarker in OS and RFS in ESCC. However, its prognostic value in ESAD is not certain. This study also has some limitations. Firstly, no validation cohort was used to verify the prognostic significance of IDO1 mRNA expression. Secondly, the prognostic significance was only assessed at the mRNA level. Therefore, validation at both mRNA and protein expression levels in another large cohort is required in future studies.
In conclusions, IDO1 mRNA upregulation was associated with both promoter hypomethylation and gene body hypermethylation in ESCC. Its expression has specific prognostic value in terms of OS in ESCC, but not in ESAD patients.