

Introduction
The prevalence of non-valvular atrial fibrillation (AF) is increasing worldwide [1], especially among older people. The increase in the last decades may be due to the ageing of the population, the improved ability to diagnose AF, and the availability of more efficient treatment options [2]. The prevalence of AF varies by age and sex and it is higher among older adults [3]. In several long-term, population-based studies, atrial fibrillation was associated with a higher risk of mortality [4, 5]. In a 20-year follow-up study, the excess risk of mortality was 2.2 for women and 1.5 for men [6], while in the FRAMINGHAM study these figures were 1.5 for men and 1.9 for women [7]. Higher cardiovascular mortality risk in women was confirmed by the Copenhagen City Heart Study, in which the independent effect of AF on the cardiovascular mortality rate was shown to be 2.5-fold greater in women than in men (HR 4.4 vs. 2.2) [8]. According to a long-term survival analysis by Miyasaka, the increased risk appeared immediately after the diagnosis of AF (HR = 9.62 within the first 4 months), and consistently remained higher (HR = 1.66) compared to the age- and gender-matched general Minnesota population [9]. The above referenced studies focused only on expressing the mortality risk of newly diagnosed AF patients.
On the other hand, recent age- and gender-specific large-scale population-based data on mortality have not been available since the introduction of novel oral anticoagulants for stroke prevention; besides, studies, expressing the mortality risk of the entire AF population (including newly and earlier diagnosed AF patients) are rare.
Therefore, the goal of our nationwide retrospective database study was to evaluate the age- and gender-specific mortality rates and excess mortality in non-valvular atrial fibrillation among patients diagnosed in Hungary between 2011 and 2016 in comparison to the non-AF population, and to measure the changes in standardised mortality rates as well as in excess mortality (rate ratios).
Material and methods
Data for our nationwide, longitudinal study were obtained from the Hungarian National Health Insurance Fund (NHIF) database, which included (almost 100%) data from hospitals, and outpatient and prescription activity of the Hungarian population in the past two decades. All patients diagnosed with non-valvular AF between 1st January 2009 and 31st December 2016 were included in the study if they were given at least two ICD-10 I48 codes during a period more than 30 days but less than or equal to 365 days. The repetitions of AF-related ICD-10 codes were applied in order to minimise the impact of rule-out diagnoses and to improve the specificity of our definition of AF in accordance with previous studies, such as that of Piccini et al. [10]. Patients with a history of valvular aortic or mitral heart disease in the study period were excluded (ICD-10 codes: I05, I3420). The date of diagnosis was defined as the date of the first ICD I48 record. Patients with only one occurrence of the I48 ICD code were also included in our analysis if they died within 60 days of the onset of the disease. The 6-year study period lasted from 1st January 2011 to 31st December 2016, with a two-year prior screening period.
The Codes of the International Classification of Diseases (ICD) 10th Revision were used to describe previous and ongoing medical conditions; detailed definitions of each comorbidity are shown in Supplementary Table SI. We used the CHA2DS2-VASc score for risk stratification, by evaluating the incidence of the given comorbidities described also in Supplementary Table SI.
The number of non-valvular AF patients was determined using the annual number of AF patients who were alive on 1st January of the given year. Patients newly diagnosed in the given year were also included in the annual prevalence. Annual prevalence was expressed as crude numbers (n); in addition, we calculated the prevalence rate as percentage (%) in the total population (based on annual mid-year population estimates from the Central Statistics Office (CSO)). (Age-standardised prevalence per 1000 person-years was also calculated by gender using the cohort weights from European Standard Population, 2013 [11] presented in Supplementary Table SII).
We evaluated mortality data in the identified AF population and those in subjects with non-AF. The number of patients with AF who died from 1st January to 31st December was counted as the number of deaths in the AF group for each year. The number of non-AF population was established by subtraction of number of AF patients from total population. The annual number of deceased patients with non-AF was determined using the same method (subtraction of death among people with AF from national data). Verifications of death were obtained from the Hungarian Central Statistical Office. Annual age- and gender-specific data (numbers) of patients with AF from 2011 to 2016 are detailed in Supplementary Table SIII.
Annual all-cause mortality rates were calculated in AF and non-AF populations. We presented annual all-cause mortality rates as rate per 1000 AF or rate per 1000 non-AF subjects. First, we evaluated pooled mortality rates (males, females), then we divided subjects into age-groups, and mortality rates of males and females were analysed separately. While in the separate age groups we used unadjusted mortality data; in pooled analyses we employed age-adjusted values using the 2013 European Standard Population [11]. In this way, we report standardised mortality rates for pooled level.
For expression of excess risk, we calculated the mortality rate ratio of AF patients compared to the non-AF population in Hungary by sex and age group between 2011 and 2016. The confidence intervals were calculated according to Altman, 1991 [12]. Again, in the separate age groups we presented unadjusted data whereas we used age-adjusted values in pooled analyses, enabling us to report standardised mortality ratios (excess risk) at pooled level.
As a last step, we analysed changes in mortality rates and separately in rate ratios over time from 2011 to 2016 in two parts:
We calculated the change of mortality rates within the AF population by age cohorts and by sex. Total changes between 2011 and 2016 were estimated and expressed as percentage (%) changes. Calculations for changes in mortality rates within the AF population were calculated as follows: % change = (2016 rate of AF population – 2011 rate of AF population)/2011 rate of AF population; a negative percentage change indicates a decline in mortality rate between 2011 and 2016.
In the second step, we also calculated changes of mortality ratios (excess mortality) within the six-year study period, as follows: % change = (2016 ratio – 2011 ratio)/2011 ratio; a negative percentage change indicates a decrease, while a positive change shows an increase in mortality ratios between 2011 and 2016.
For analysis of the changes in rates and ratios over time we used the Poisson regression model for calculation. The target variable was the mortality rate per 1000 persons rounded to a whole number, the explanatory variable was the year as a continuous variable. Comparing the mortality rate of AF patients and non-AF subjects, the group and the interaction of group and time were also included. Men and women were included into different models. Generalised linear models like Poisson regression require independent data. Otherwise the estimation of the standard errors, and in conclusion, the p-values may be biased. This problem can be fixed with random resampling. We were using a bootstrap method with a fixed block size of 2 and 50,000 bootstrap replicates. A p value < 0.05 was considered statistically significant.
We calculated trends using linear regression analyses for means (using age and CH2ADS2-VASc score as dependent variables) and binomial logistic regression for proportions. The year was the continuous explanatory variable. For Supplementary Tables SII and SIII, individual regression models were created for every row. The only explanatory variable was the year. Because the same people were present in different years, our data were not independent, which caused a bias of the standard errors and p-values. To avoid this bias, we used the bootstrap method with a fixed block size of 2 and 50,000 bootstrap replicates.
All calculations were performed with R version 3.5.2 (2018.12.20) with package boot version 1.3-20.
This study protocol was reviewed and approved by the National Health Insurance Fund (NHIF) (identification number: S04/161/2016).
Results
The number of patients with AF increased from 169,373 to 239,703 during our study period, representing 1.70% and 2.44% of the total Hungarian population, respectively (Table I and Supplementary Table SII). The size of the population with AF increased significantly in both women and men, with an annual change of 7.2% and 7.91% (p < 0.001) from 2011 until 2016. The mean age of AF patients was on average 5 years higher in women, and it increased significantly in both genders from 74.78 ±10.00 to 75.31 ±10.33 in women and from 69.88 ±11.26 to 70.32 ±11.36 in men (p < 0.001 in both groups). The mean of the CHA2DS2-VASc score was also higher in females, and it increased significantly from 4.42 to 4.72 in women and from 3.06 to 3.36 in males (p < 0.001 in both groups).
Table I
Characteristics of patients with AF based on gender between 2011 and 2016
In the study year of 2011, 13,257 female and 10,865 male AF patients died, representing 14.92% and 13.49% of the total female and male AF population, respectively. In 2016, 15,567 female and 13,624 male AF individuals died, so the crude mortality rate decreased significantly to 12.63% and 11.70% by 2016 with a –2.84% and a –2.66% mean annual change in mortality (p-value was 0.008 and < 0.001 in females and in males, respectively).
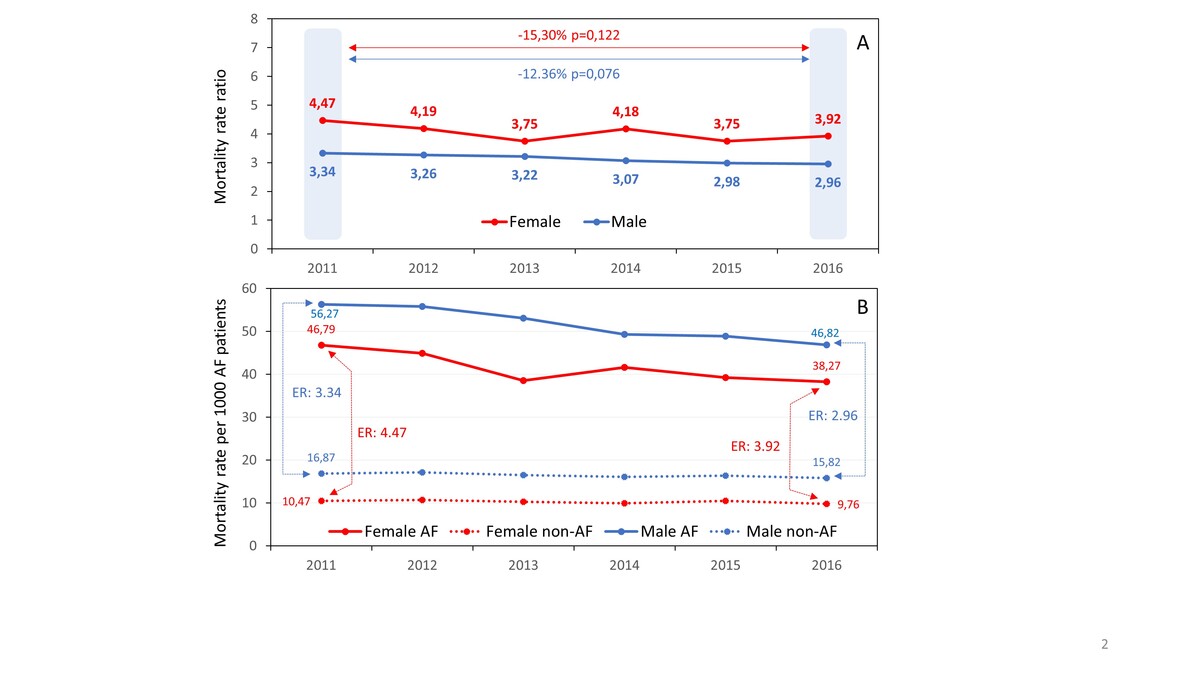
The age-standardised mortality rates of the AF and the non-AF populations by sex are presented in Figure 1 A and Supplementary Table SIII. The age-standardised mortality rates of males were higher than those of females and decreased from 56.27 (95% CI: 55.21–-57.33) to 46.82 (95% CI: 46.04–47.61) per 1000 person-years, showing a –3.82% mean annual decrease (95% CI: –6.23– –2.21%; p = 0.009), while the mortality rate of 46.79 for female AF patients decreased (95% CI: 45.99–47.59) to 38.27 (95% CI: 37.67–38.87) per 1000 person-years with a –3.89% mean annual change (95% CI: –8.78% – –0.19%; p = 0.038). During the 6-year study period, the age-standardised mortality rate of the female non-AF population decreased from 10.47 (95% CI: 10.38–10.56) to 9.76 (95% CI: 9.68–9.85) per 1000 person-years and from 16.87 (95% CI: 16.73–17.01) to 15.82 (95% CI: 15.68–15.96) per 1000 person-years in the male non-AF population, resulting in a –0.87% (95% CI: –6.23% – 0.00%, p = 0.341) and –1.39% (95% CI: –3.46% – 0.00%; p = 0.179) mean annual change, respectively.
Figure 1
Changes in annual standardised mortality rates and ratios over time in the total cohort (males, females separately, age-adjusted mean values). Lower panel (B): changes in standardised annual all-cause mortality rates in AF patients and non-AF subjects. Annual mortality ratio (excess risk [ER]): mortality rate in AF patients/mortality rate in non-AF subjects. Upper panel (A): changes in standardised all-cause mortality ratios (mean values). Calculations for changes in all-cause mortality ratios over time: % change = (2016 ratio – 2011 ratio)/2011 ratio; a negative percentage change indicates a decrease in mortality ratios between 2011 and 2016
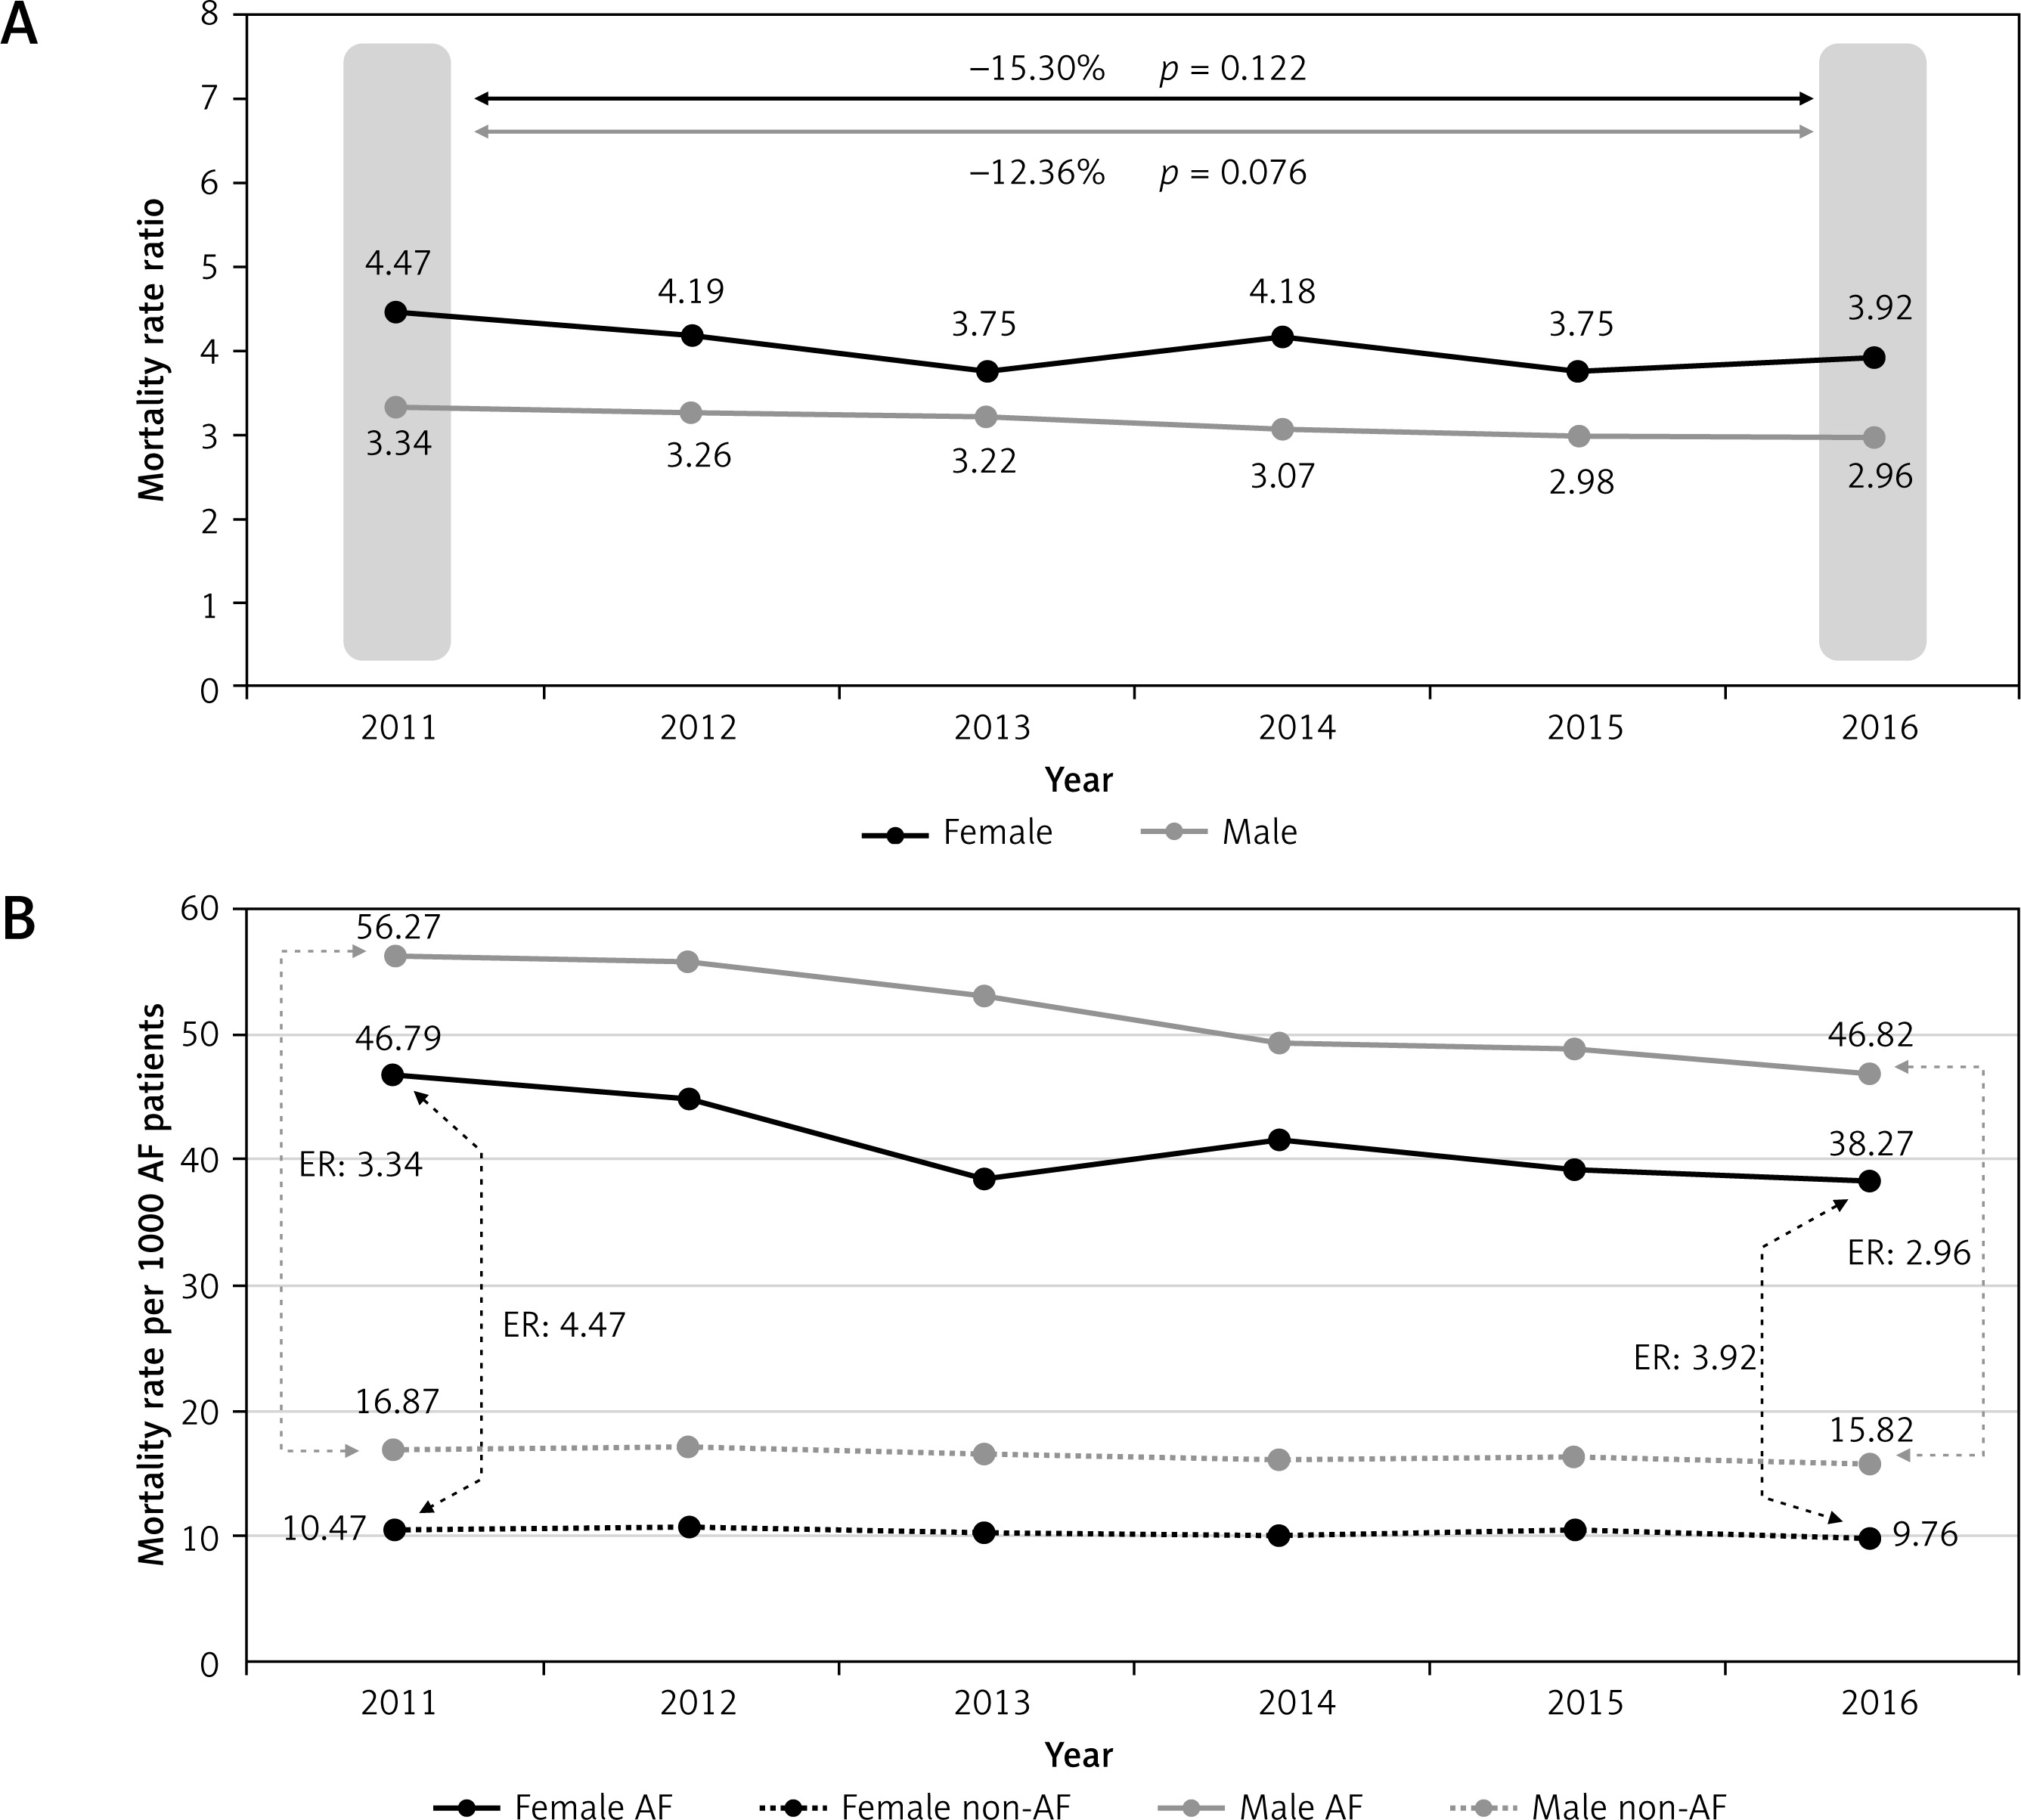
The excess mortality risk shown by the mortality rate ratio decreased from 4.47 (95% CI: 4.35–4.58; p < 0.001) to 3.92 (95% CI: 3.83–4.01; p < 0.001) in female AF patients and from 3.34 (95% CI: 3.27–3.40; p < 0.001) to 2.96 (95% CI: 2.90–3.02; p < 0.001) in male AF patients compared to the non-AF population during the 6-year study period, as seen in Figures 1 A and B.
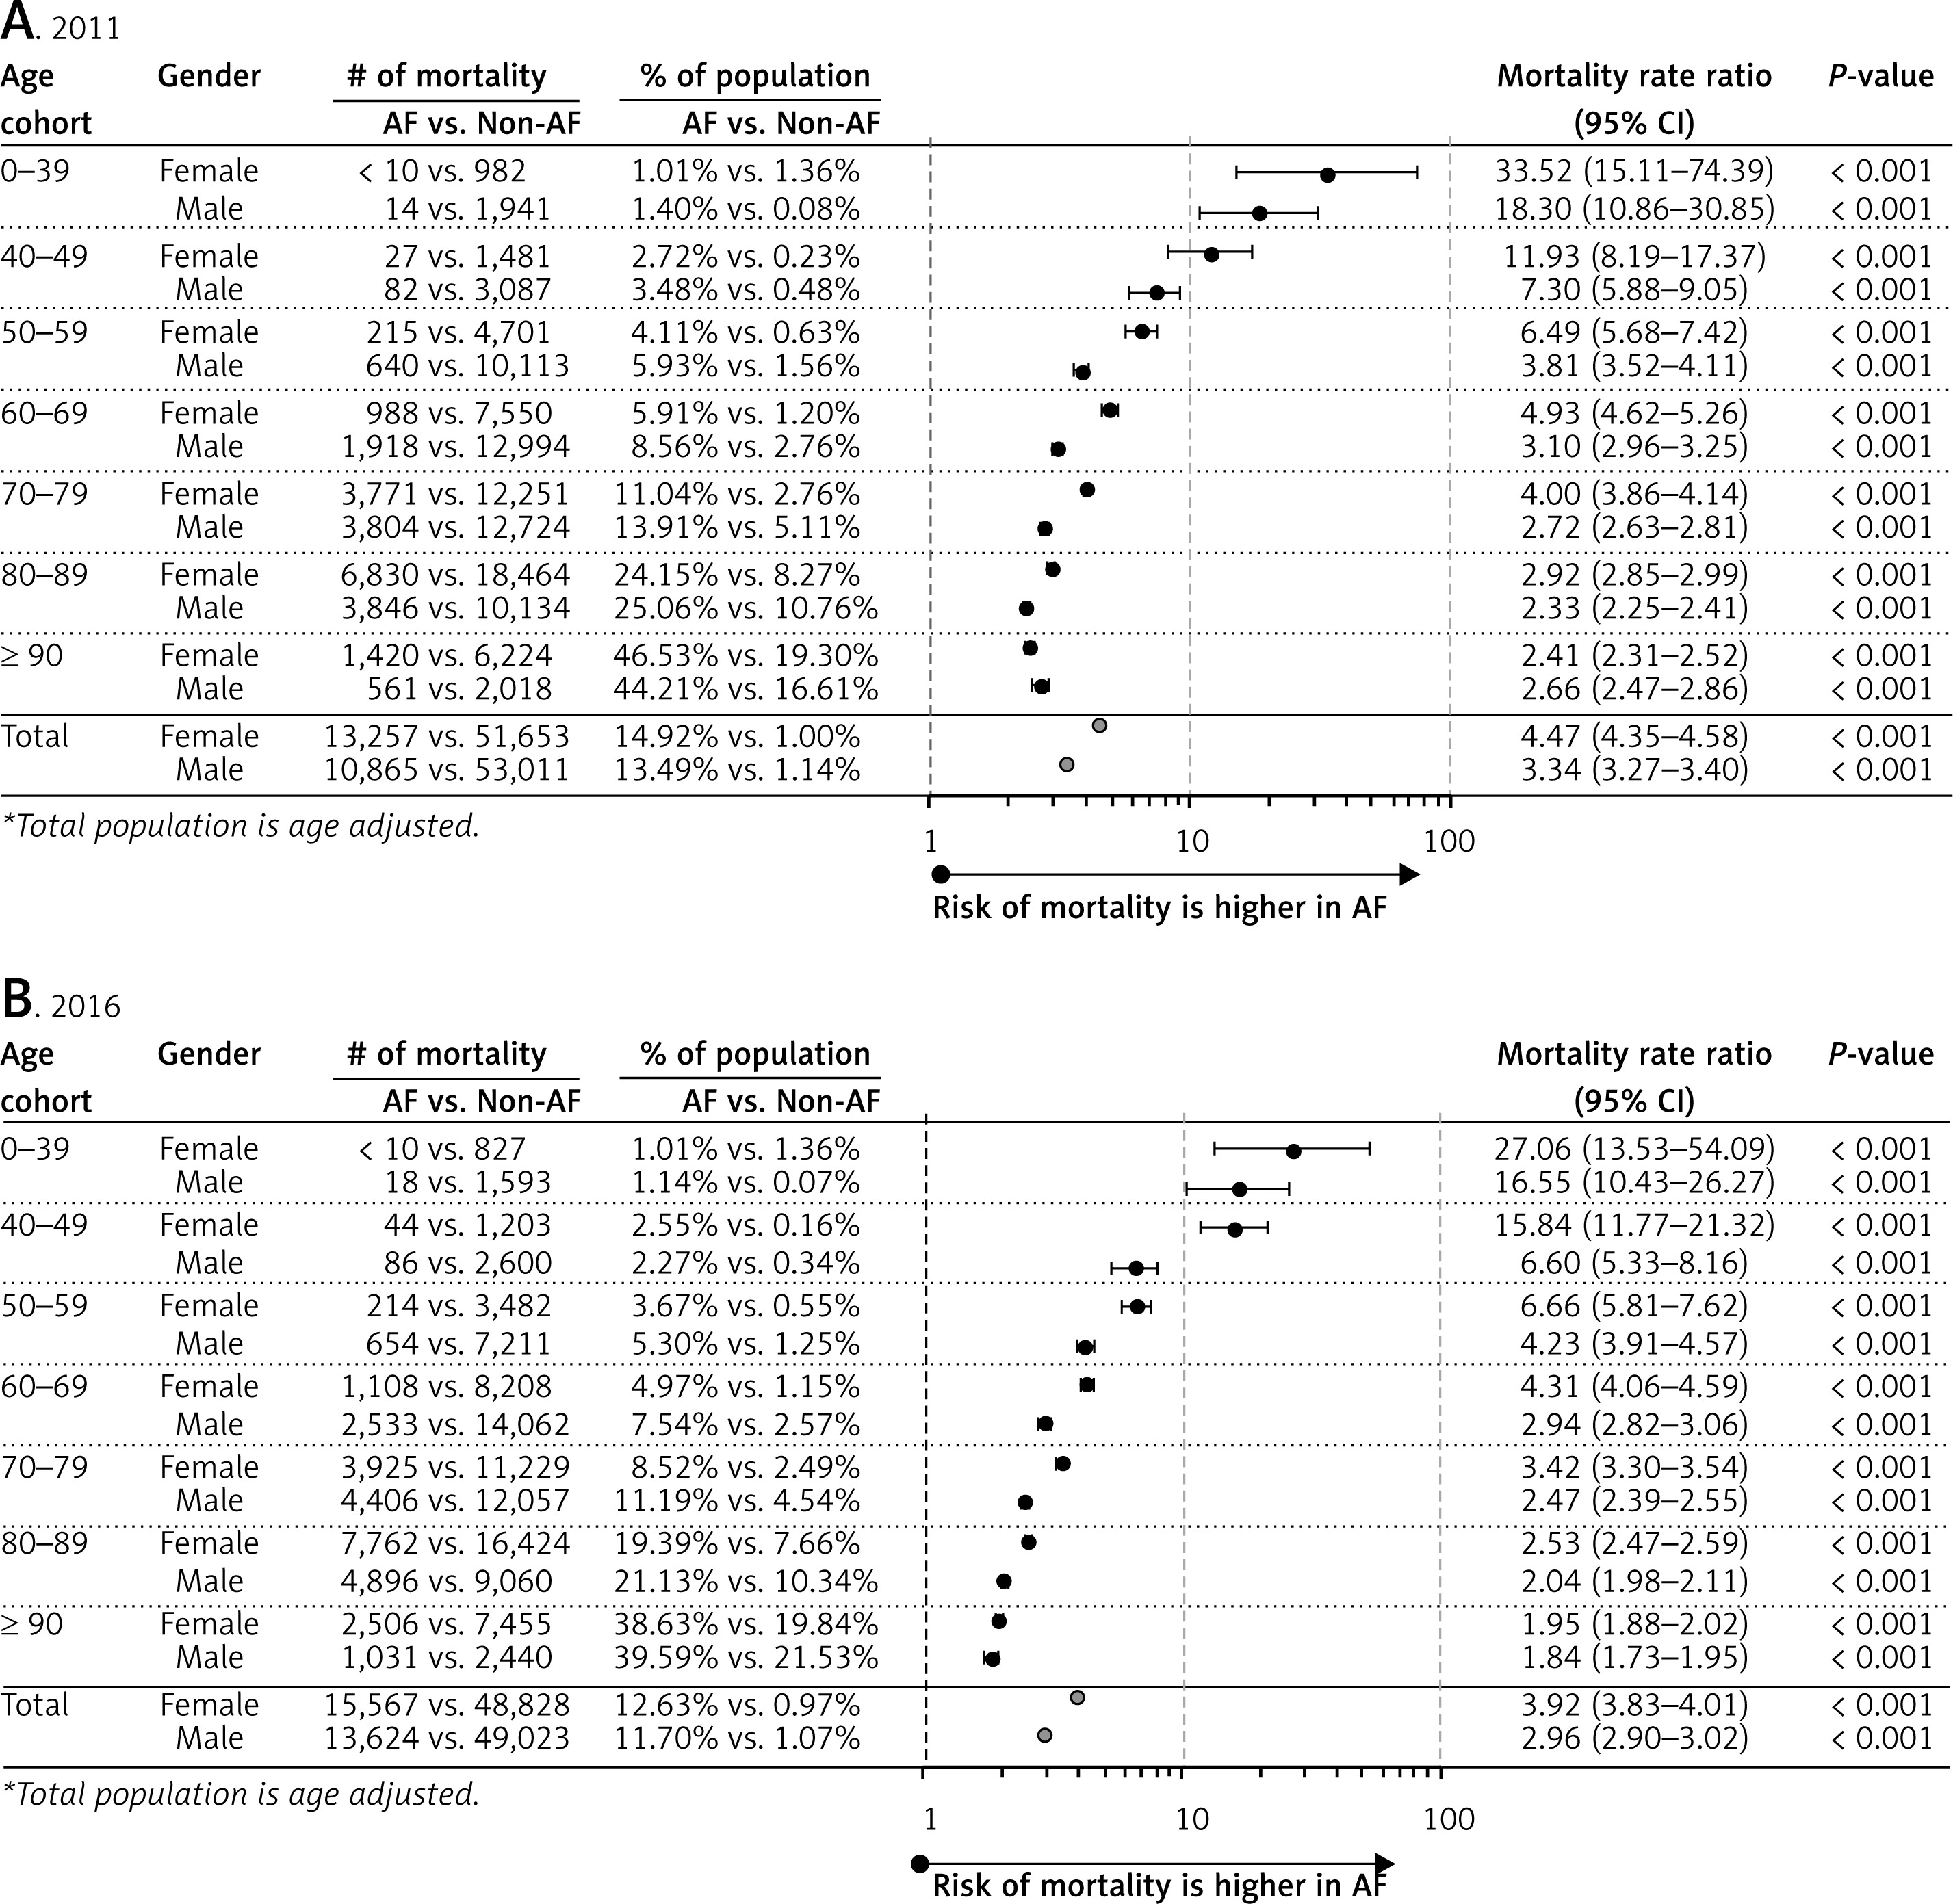
Although the absolute mortality increased by age, the excess mortality (rate ratio; RR) largely increased in the lower age groups in 2011, as seen in Figure 2 A. We calculated RR-s of 2.41 and 2.66 in the age-group of 90 years or older in female and male AF patients, while the risk was 11.93 and 7.30 in the 40-49 years age cohort. Similarly, higher excess mortality (rate ratio) were found in female AF patients in 2016, although the risk estimates were slightly lower across all age cohorts. These risks increased with younger age and were largest in patients under 40 years of age, reaching 27.06 and 16.55 in females and males, respectively, as seen in Figure 2 B.
Figure 2
Mortality rate ratios (excess risk) of AF population by age and sex in 2011 (A) and in 2016 (B). Annual mortality ratio (excess risk): mortality rate in AF patients/mortality rate in non-AF subjects
*Higher 95% CI is not presented.
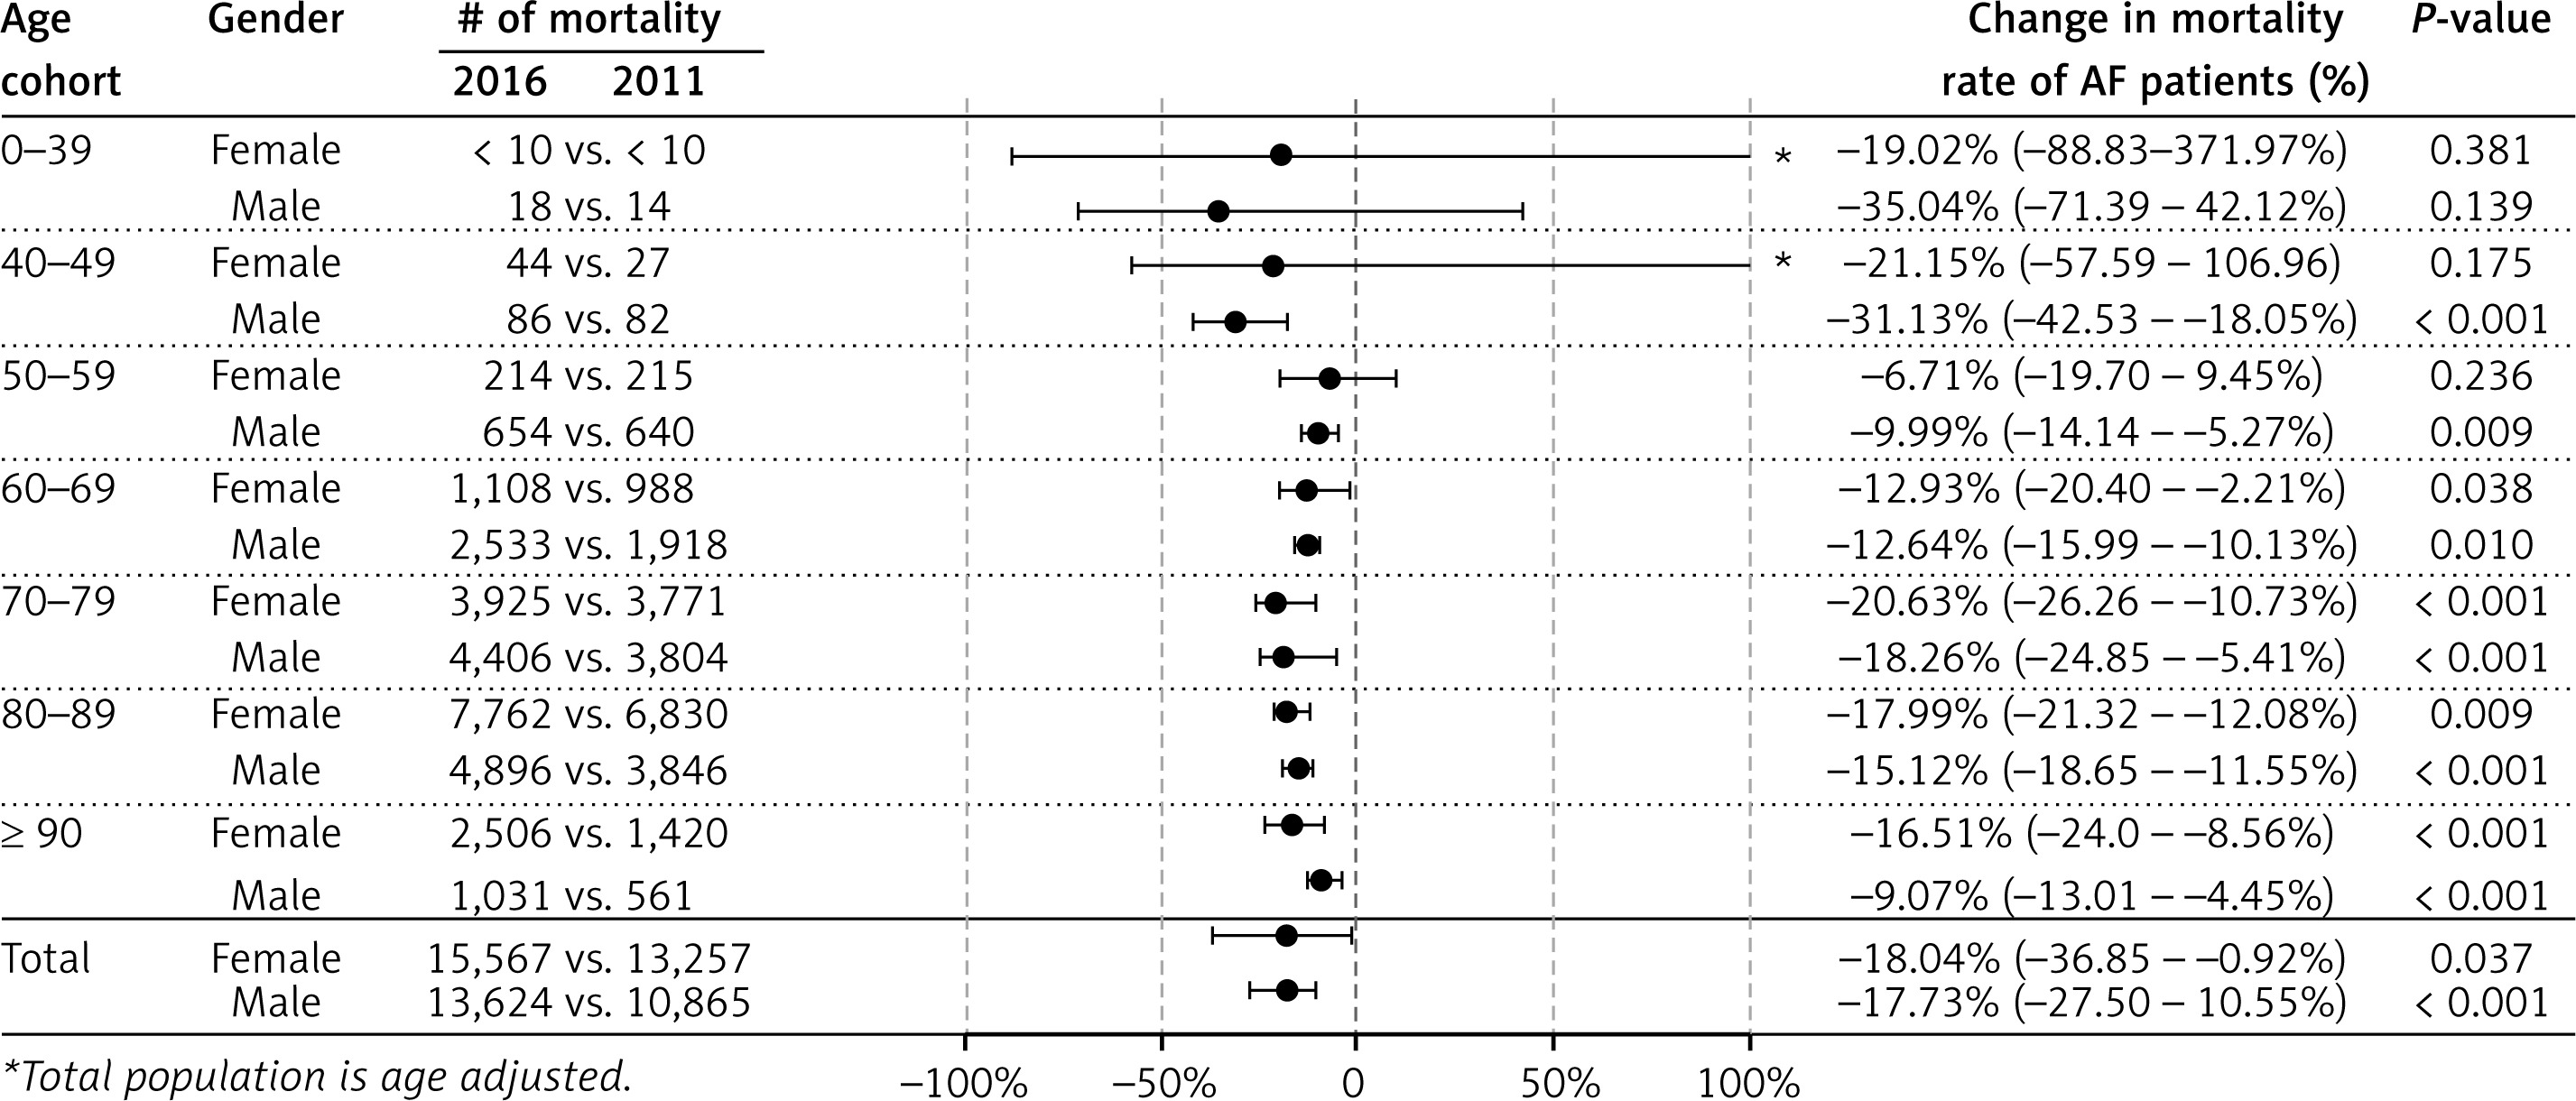
The change in the mortality rate ratio within the AF population between 2011 and 2016 is shown in detail in Figure 3. We found an 18.04% reduction in mortality rates in females (absolute 8.52) and a 17.73% reduction in the male patients (absolute 9.42) (both changes were significant; p = 0.037 and p < 0.001, respectively). The highest significant mortality rate reduction was found in the 70–79-year-old cohort, where the change was –20.63% (95% CI: –26.26% – –10.73%; p < 0.001) in female and –18.26% (95% CI: –24.85% – –5.41%; p < 0.001) in male AF patients when we compared 2016 with 2011.
Figure 3
The change in mortality ratios of AF population comparing data from 2016 and 2011 (total population is adjusted for age)
*Higher 95% CI is not presented.
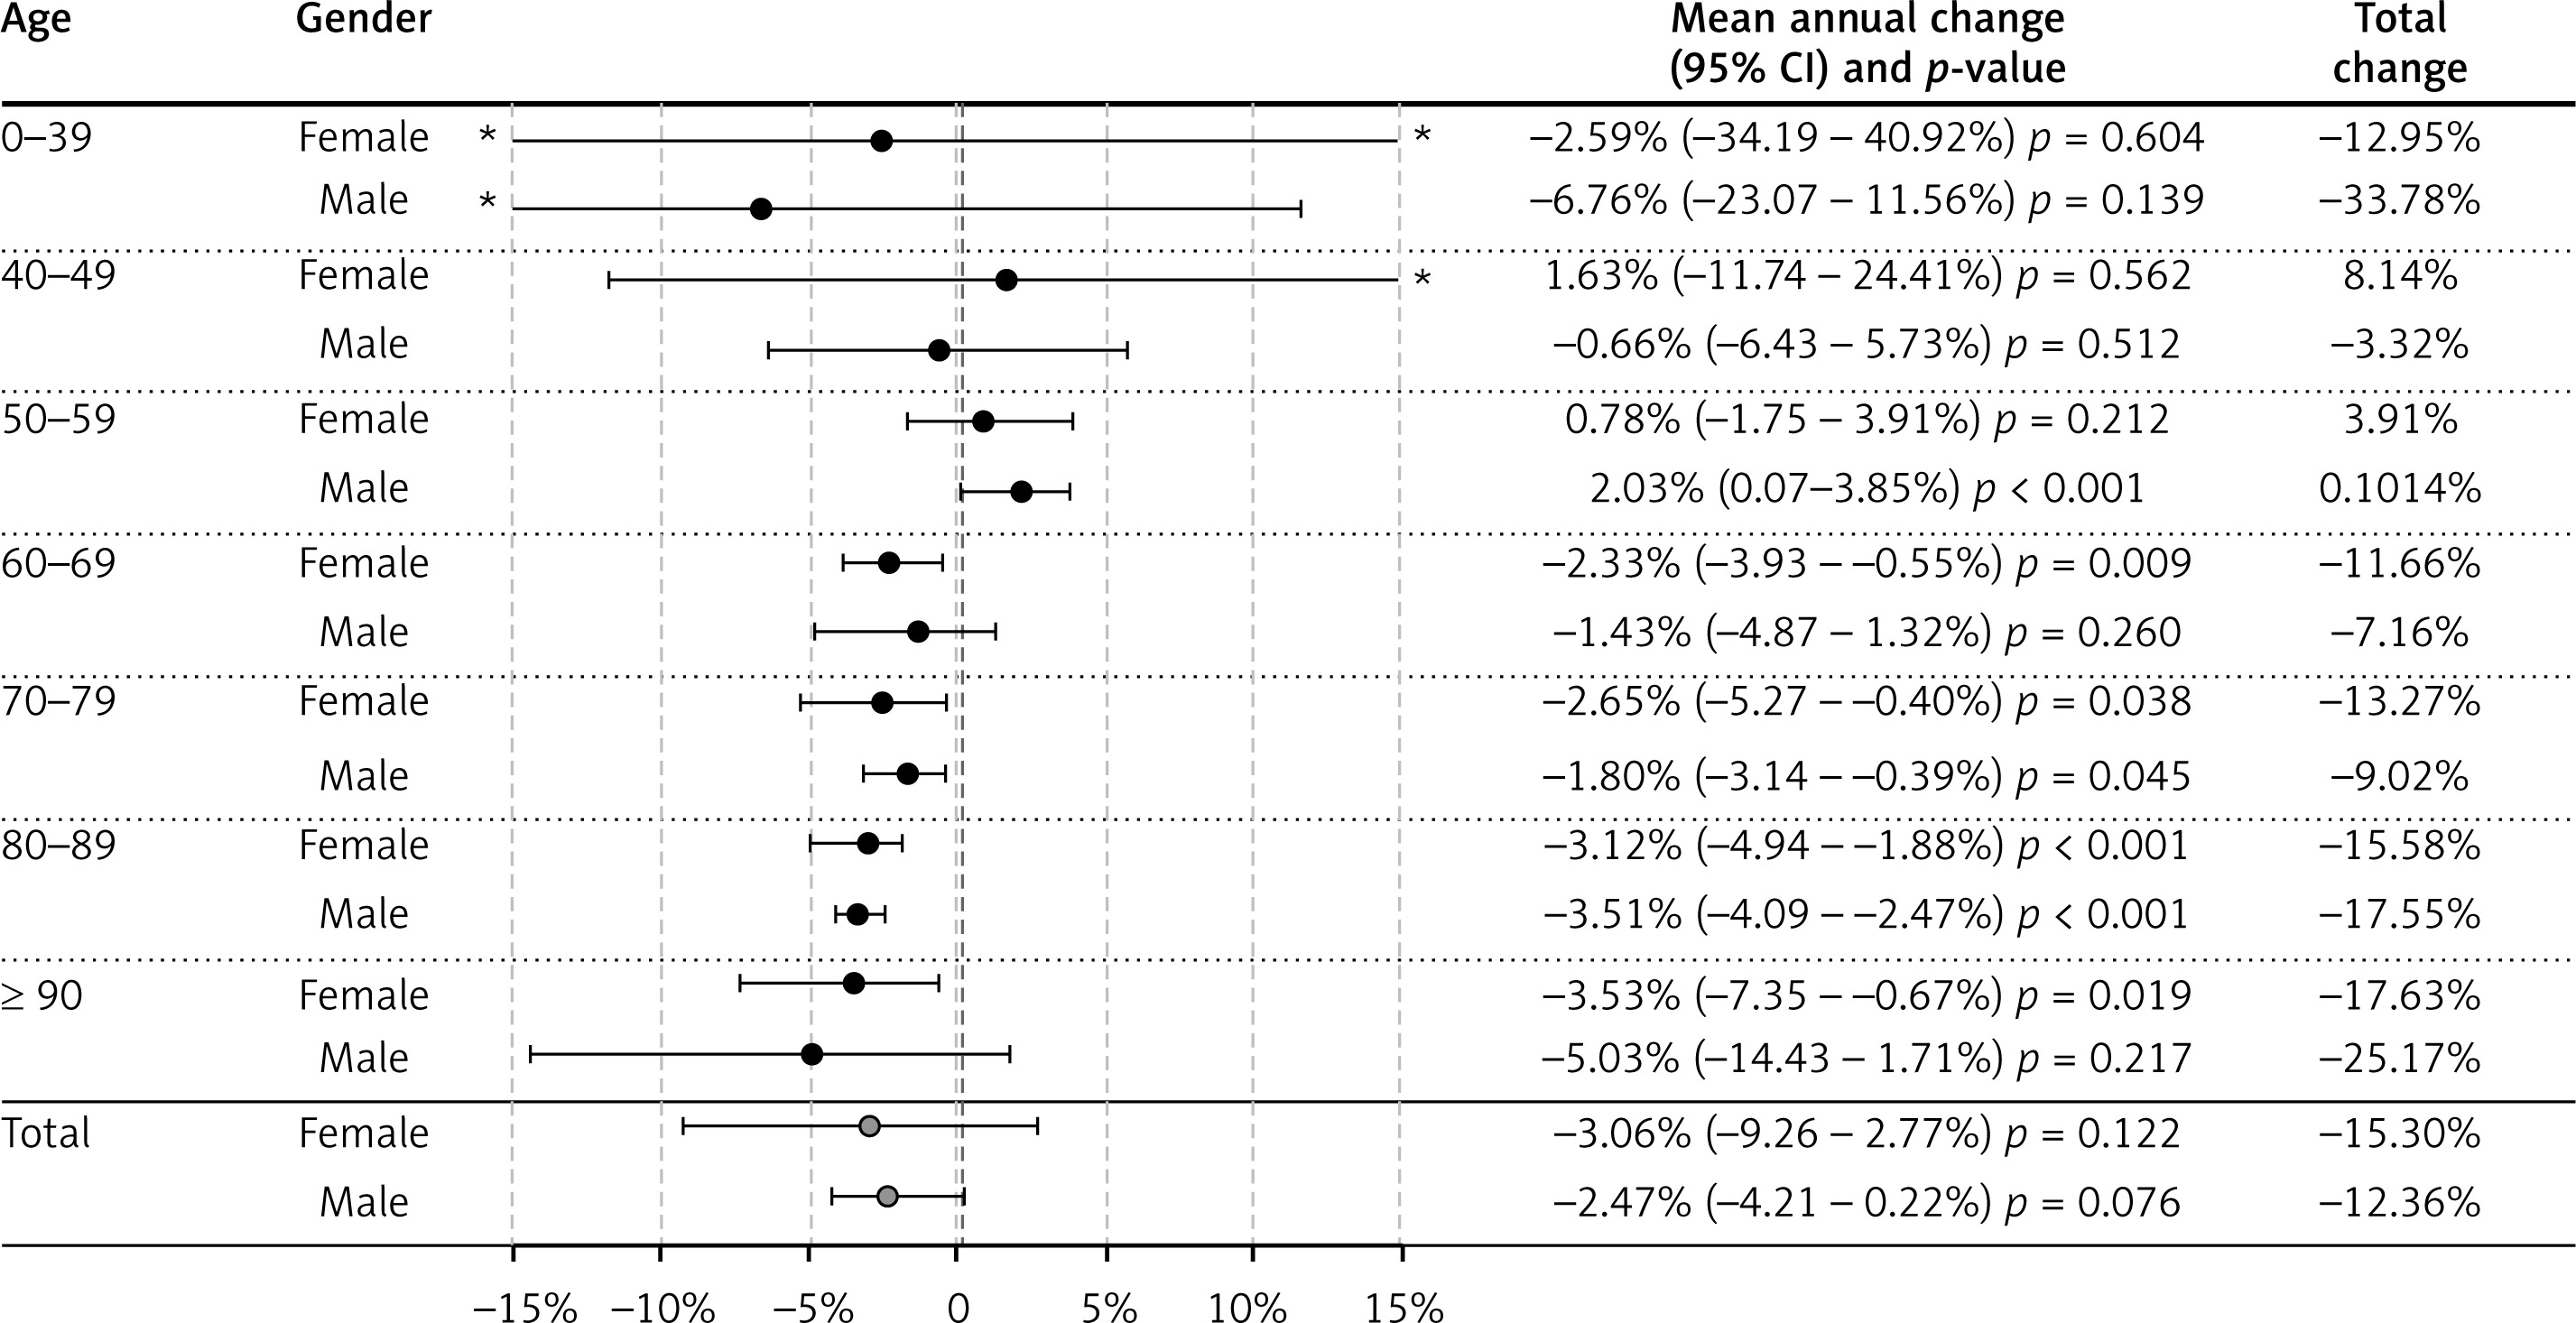
The age-dependent changes in excess mortality risk (mortality rate ratio) are shown in detail in Figure 4. There were no significant changes in excess risk in females or in males during the 6-year study period (p = 0.122 and 0.076); however, we found a significant reduction in excess risk in the different age groups. The highest significant excess risk reduction was recorded in the ≥ 90-year-old cohort of female AF patients at –17.63% with a mean annual change of –3.53%; 95% CI: –7.35 – –0.67%; p = 0.019), while in male AF patients it was in the 80–89-year-old cohort at –17.55% with mean annual change –3.51% (95% CI: –4.09% – –2.47%; p < 0.001).
Figure 4
Age- and gender-related mean annual and total change of excess mortality risk (mortality rate ratios) comparing 2016 to 2011 study year
*Higher 95% CI is not presented.
The number of deaths, the crude mortality rate, and the age-specific mortality rate of the AF population are shown in detail in Supplementary Table SIII. The age-specific mortality rate of the female AF population changed between 110.43 and 85.15 per 1000 person-years in the 70–79-year-old cohort, between 465.27 and 386.31 per 1000 person-years in the ≥ 90-year-old cohort, and between 139.08 – 111.94 and 442.08 – 395.93 in the male AF population, respectively.
The prevalence of the main comorbidities in patients with AF are shown in detail by age and gender in Supplementary Table SIV. Briefly, the prevalence of all comorbidities increased by 2016 except the prevalence of CHF, which remained at the same level as in 2011.
The percentage of patients receiving VKA therapy changed from 80.56% to 68.37% in males and 77.62% to 65.83% in females, whereas novel anticoagulant therapy (NOAC) increased from 0.04% to 15.87% and from 0.02% to 16.64%. Consequently, VKA or NOAC treatment increased from 80.59% to 84.23% in males and from 77.64% to 82.47% in females during the 6-year study period (Supplementary Table SV).
Discussion
This is the first study to analyse and present age- and gender-specific data about the mortality risk assessment of the Hungarian AF population as well as presenting a novelty by analysing all diagnosed AF patients in the aspect of a non-AF population, instead of evaluating the excess risk of newly diagnosed patients in a certain timeframe.
The main findings of our nationwide, retrospective study were the following:
The standardised mortality rate decreased by approximately 18% within the AF population during the 6-year study period.
The extent of the reduction of the excess mortality risk (mortality rate ratio) compared to the non-AF population was significant in the older (age 60 years or above) AF groups.
Excess mortality of newly diagnosed AF versus existing AF population
The mortality risks of the entire Hungarian AF population were found to be between 4.47 and 3.75 in females and between 3.34 and 2.96 in males, which was higher than data from most of the earlier studies [3–5]. The Framingham study reported a 1.5- and 1.9-fold mortality risk increase in males and females, respectively [7], while in a Scandinavian study from 2002, the excess mortality risk of AF patients was reported to be 1.6-fold higher [13]. Similarly, a French population-based study published in 2007 demonstrated 1.5- and 1.8-fold increased risks [14], and an overall 2.3-fold higher risk was described in a Serbian publication from the study period 1992–2007 [15]. All of these studies focused only on newly diagnosed AF patients, and these data were recorded before the birth of the modern novel anticoagulant era.
On the other hand, a recently published database study from South-Korea found a 3.81 mortality rate ratio in female and 3.35 in male AF patients between 2002 and 2013 [16], similar in size to Hungarian results. The main difference between our results and those of the South-Korean study, and the previously mentioned studies can be explained by the use of different methodologies. The bulk of earlier studies presented mortality data only of newly diagnosed AF patients having a certain follow-up period since their initial diagnosis of AF compared with age- and sex-matched control populations. Hence, the Framingham study had a 40-year follow-up period after AF diagnosis [7], while the French survey followed AF patients for a 15-year period [14]. Therefore, from this aspect, the excess mortality risk was determined for newly diagnosed AF patients within a certain follow-up period. In contrast, our analysis as well as the South-Korean study [16] expressed the mortality risk of all diagnosed AF patients found in the national registry in a calendar year compared with the age- and sex-matched non-AF population in the same calendar year. Resulting from the similar methodologies, there were no relevant differences between our and the South-Korean study results, but they were higher than the earlier follow-up studies because we evaluated the mortality of both newly and previously diagnosed – hence the total AF population. The benefit of this methodology is that we were able to express the excess risk of all diagnosed AF patients in a calendar year and evaluate the changes of the total AF population between different calendar years but not throughout a follow-up period, because we did not follow patients for years, as seen in Supplementary Figure S1.
Changes in standardised all-cause mortality rates in AF patients and its consequences on excess mortality (mortality rate ratio)
During the 6-year study period, we measured an 18% decrease in the mortality rates of the AF population in both genders. The changes in mortality risks were higher in the 70–79-year-old age group, without clinically relevant differences between females and males. We found these reductions in risk despite the aging of the AF population, increase of comorbidities, and increase of CHA2DS2-VASC scores. Meanwhile, the change of mortality rate in the non-AF population was not significant in the same period. Consequently, the size of AF-related excess risk of mortality (mortality rate ratio) declined as well, although the decrease was found to be significant only in the older age cohorts, in the age group at and above 60 years. Nevertheless, the majority of AF was diagnosed within this age group. The change of excess risk in the AF population was rarely evaluated; nevertheless, a recent analysis of the Framingham population showed a 3.27 HR in the 1972–1985 time period, and 2.01 HR in the 2001–2015 period with a 0.003 p for trend in a model adjusted for baseline covariates. However, the p for trend value became 0.7 if the model was adjusted for time varying covariates [17].
The higher excess mortality risk of the female AF population has been confirmed by previously cited studies [6–9]. A meta-analysis based on 33 studies also showed a 12% greater relative risk of all-cause mortality in women versus men [18], and this excess risk was reflected in the CHA2DS2-VASC score calculation, as well. Indeed, our findings correlated with these results; we recorded higher excess mortality risk (rate ratios) in females in all age cohorts as well as higher and increasing CHA2DS2-VASC scores (4.72 vs. 3.36 in 2016 in case of female vs. male, respectively). Female AF patients did not have clinically relevant excess in risk factors. We found a 1.2% higher occurrence of previous stroke, and a 1–2% lower incidence rate of prior myocardial infarction and type 2 diabetes than in male patients, similarly to the recently published BiomarCaRE Consortium epidemiology study [19]. In a 20-year follow-up study, women with AF had a higher risk for developing cardiovascular events and fatal or nonfatal strokes than males (HR 3.0 vs. 1.8 and 3.2 vs. 2.5, respectively) [20]. The higher stroke risk of female AF patients was also confirmed by Framingham (HR = 1.92) [7]. The higher mortality risk of AF in females may also be associated with the lower probability of prescribing oral anticoagulants [21], as was also found in our study.
The age-specific mortality rate was higher in the older population in both genders. Older age was associated with a higher incidence of comorbidities, hence higher CHA2DS2-VASC scores, which resulted in increased mortality. In contrast, the effect of AF on mortality was the opposite: lower age was correlated with a higher risk of mortality in comparison with the non-AF population, hence the impact of AF weakened with increasing age. The prevalence and the competitive mortality impact of other comorbidities increased with age; therefore, the effect of AF as the cause of mortality was lower. The extent of excess mortality in older AF patients was similar to that in the South-Korean AF study [16].
The relevant reduction of mortality may come from the introduction of novel anticoagulant agents (since 2013) in Hungary as well as from the more appropriate and timely diagnosis of AF and more adequate stroke prophylaxis strategy. The percentage of patients receiving VKA or novel anticoagulant therapy (NOAC) increased from 80.59% to 84.23% in females and from 77.64% to 82.47% in males during the 6-year study period. The extent of NOAC therapy grew from 9.48% in 2011 to 23.71% by 2016 in the older population. These changes may have an impact on the occurrence of stroke and consequently on mortality. Based on the Cowan study in hospitalised AF patients in the UK, a 1% increase in anticoagulant use was associated with a 0.8% decrease in the weekly rate of AF-related strokes within the 2006-2016 study period [22]. A meta-analysis of new oral anticoagulant agents showed a 10% significant reduction in all-cause mortality (HR = 0.90) and 52% reduction in the risk of intracranial haemorrhage (HR = 0.48) [23], although this finding was not unambiguously confirmed by other retrospective, real-life data analyses, like recent studies from the Danish AF database [24–26]. Also, management of different co-morbidities of AF patients could contribute to the improvement of mortality rates in the AF population; the increased usage of statin therapy could lead to a significant decrease of stroke in primary and secondary prevention, as well [27]. Regarding the general therapy of AF, we focused mostly on the use of OACs as a factor improving the mortality, but pulmonary vein isolation (PVI) could also affect that because it is more often used as first-line rhythm control therapy [28].
The increased attention paid to novel anticoagulant therapy may also increase the awareness of atrial fibrillation, which could lead to earlier and higher diagnosis rates, thus impacting the overall morbidity and mortality. The rapidly increasing number of Hungarian AF patients supports this explanation. Also, improvement of catheter ablation technics in AF [29–32] as well as management of different co-morbidities of AF patients could contribute to the improvement of mortality rates in the AF population [27, 33].
There is a well-known higher mortality risk of AF patients early after the diagnosis [34]. The event rate among the GARFILED was 6.8 (6.1–7.6) in the newly diagnosed AF population in the first month after diagnosis, while this rate decreased to 3.8 (3.5–4.1) in the 9–12-month period. Because the rate of newly diagnosed AF patients decreased during the study period, the impact of the higher mortality rate in the early phase after AF diagnosis is decreased; hence, it could impact the overall decrease in the mortality rate of the AF population, as well as the excess mortality.
Strengths and limitations
The novelty of our study was the detailed age- and sex-specific evaluation of mortality rates and excess mortality (mortality rate ratios) in the total AF population; we are not aware of the presence of similarly detailed analyses from Europe. Furthermore, we presented the excess mortality risk of the total AF population instead of only the newly diagnosed AF patients, which may better reflect the scope of the implemented stroke prophylaxis strategies in a country. While most of the earliest publications were available from the 1990s and 2000s, we measured the mortality excess in the recent, modern stroke prophylaxis era together with the reflection of mortality risk changes within a 6-year period.
The limitations of the study are that it includes patients having had at least two recorded visits, while data from silent AF and non-adherent patients were not recorded. A further weakness of our analysis was that we were not able to obtain exact data on person-years of the NHIF population, so as an alternative we used the yearly average number of the base population reported by the Central Statistical Office from the census database (which was calculated from the number of the total Hungarian population on 1st January and 31st December) and assumed that these people lived for a whole year. In addition, we were not able to gather data regarding the results of the laboratory tests or to gain information about the cause of mortality from the NHIF database. Basing our study on two separate NHIF (AF population) and CSO databases (non-AF population), we were unable to run a propensity score matched analysis, which could have excluded some relevant bias. The mean age of the AF population increased during the study period, which could be explained by the increase of age within the base population as well as by the impact of decreasing mortality of the AF population; hence, the alive portion of the studied group is ageing.
In conclusion, by implementing a novel methodology, we could express the mortality risk of the total AF population, instead focusing only on newly diagnosed patients. We found relevant reduction in the age-standardised mortality rates in both sexes in the total AF population during this 6-year period, which exceeded the reduction of mortality rates in the non-AF population. This was apparent especially in the younger age group, where the excess risk of mortality was originally higher. Additionally, we were able to demonstrate the higher risk of mortality in females and younger patients among Hungarian AF patients.

