Introduction
Colorectal cancer (CRC) is currently the third and second most common cancer in men and women, respectively [1, 2], and one of the leading causes of cancer-related deaths [3, 4]. Colorectal cancer (CRC) is the third most common cancer (9%) and the second most common cause of cancer-related mortality worldwide, according to the 2020 Global Cancer Statistics [5]. According to statistics, in 2008, there were nearly 150,000 newly diagnosed cases and 50,000 deaths [6]. By 2012, the Global Cancer Observatory estimated that 1.3 million new cases were diagnosed with CRC and nearly 700,000 patients died from it [7]. CRC is more common in Western countries, accounting for more than 65% of cases [8]. Within 4 years, both morbidity and mortality had risen at an alarming rate. According to research, CRC usually occurs in the lining of the colon (large intestine) or rectum [9], and it usually grows on the lining of the colon and rectum as polyps, which are lumps that protrude into the lumen. Not all polyps are neoplastic and develop into cancer, but it is well known that most CRCs develop from adenomatous polyps, the so-called adenoma-to-cancer sequence [10]. Most CRCs occur in patients over the age of 50, with more than 75% of those over the age of 60. Risk factors associated with CRC include older age, male gender, lifestyle, inflammatory bowel disease, and previous history of CRC [4]. The risk of CRC increases with age, is 1.5–2 times higher in men than in women, and the mortality rate in the male population has been steadily increasing over the past three decades [11]. Despite the high mortality rate and high prevalence of CRC in cancer, it is an indolent disease in its early stages and usually develops symptoms when it progresses to a more advanced stage [12]. Therefore, mortality can be reduced through early prevention and detection.
Therefore, the ultimate goal should be to implement and improve screening strategies [13, 14]. Numerous efforts have been made to establish appropriate screening methods. Screening techniques can be divided into non-invasive and invasive with varying sensitivity and specificity, including the fecal occult blood test (FOBT), fecal DNA test, double contrast barium enema (DCBE) and colonoscopy [11]. Among them, colonoscopy is an invasive procedure with a risk of bowel perforation. These methods are either invasive, resulting in low participation rates in healthy populations [13], or have large limitations, limited by insufficient sensitivity or a high percentage of false positive results [15]. Currently, new biologics for CRC screening tests are sought. The development of markers is the subject of intensive research. In recent years, many biomarkers that aid in the treatment and prognosis of colorectal cancer have received more attention. In order to discover these potential biomarkers that can be detected in blood and stool by non-invasive methods, it is important to study the genetics and pathogenesis of CRC [16, 17].
A biomarker, or biomarker, is “a defined characteristic measured as an indicator of normal biological processes, pathogenic processes, or responses to exposures or interventions” [18]. There are several subtypes of biomarkers that can be identified and quantified to aid in the diagnosis, monitoring, assessment and prediction of disease and patient response to therapy, including diagnostic biomarkers, pharmacodynamic biomarkers, predictive biomarkers, prognostic biomarkers, and susceptibility biomarkers [19]. Among them, diagnostic biomarkers refer to detecting the presence of a certain disease or condition, for example, the hemoglobin A1c (HbA1c) level for the diagnosis of type 2 diabetes. Prognostic biomarkers are used to identify the likelihood of disease recurrence or progression in people who already have the disease, e.g., prostate-specific antigen (PSA) levels, to assess the likelihood of cancer progression. This study aimed to identify potential novel prognostic tests and biomarkers for CRC. Two microarray datasets obtained from the Gene Expression Omnibus (GEO) database were analyzed to further identify differentially expressed genes (DEGs) in CRC by comparing expression levels between CRC and normal samples, and subsequently, differences shared across the datasets were identified using Venn analysis to compare DEGs. Next, enrichment analysis was performed to further analyze the biological processes of CRC-related DEGs and construct a protein-protein interaction (PPI) network.
Survival analysis refers to the method of analyzing and inferring the survival time of organisms or people based on the data obtained from experiments or surveys, and studying the relationship between survival time and outcomes and many influencing factors and their degree, also known as survival rate analysis. Survival rate analysis is often used in the evaluation of common clinical efficacy in tumors, such as exploring how long the remission period lasts for leukemia patients or the observation time of death [20–22]. In survival analysis, what we get is not a single specific value, but a curve, called a survival curve [23], and the function corresponding to the curve is called a survival function. To validate the prognostic role of DEG in CRC, CRC samples from The Cancer Genome Atlas (TCGA) and GEO databases were collected. Survival analysis was performed based on the sample segmentation method and Cox regression model to obtain prognostic genes and their survival curves. Next, using the dataset from TCGA as the training set and the GEO dataset as the validation set, the identified key genes and risk score values were used to predict the survival rate of CRC patients. Finally, the diagnostic value of genetic biomarkers for CRC was assessed using ROC curve analysis [24, 25], with complete identification of prognostic biomarkers for CRC.
Material and methods
Data selection
The Gene Expression Omnibus (GEO) database (https://www.ncbi.nlm.nih.gov/geo/) is a publicly available repository of gene expression datasets. Its data sources include microarray and next-generation sequencing [26]. The CRC dataset for this study was derived from GEO’s microarray dataset. In the GEO database, according to the keyword “colorectal cancer (CRC)”, the sample size is sorted from large to small, and the sample size is uniformly distributed, and two GSE series, GSE20916 and GSE33133, are selected from the GPL570 microarray data platform as a research sample for CRC. The microarray data were also obtained from The Cancer Genome Atlas TCGA (http://cancergenome.nih.gov/) [27] and the GSE72968 dataset in GEO for survival analysis.
Identification of differentially expressed genes (DEGs)
The number of GSE20916 samples was 145, including 111 cancer tissues and 34 normal controls. The number of GSE33133 samples was 96, including 90 cancer tissues and 6 normal controls. Differential genes were defined with adj. p-value < 0.05 for differential analysis. In the TCGA colorectal cancer data, the number of samples was 624, and 35 samples with expression but no clinical survival information or with clinical survival information but no expression were excluded, and 589 samples were finally included.
Venn analysis
In order to obtain the intersection of up-regulated genes of the two datasets, the Venn diagram network tool (http://bioinformatics.psb.ugent.be/webtools/Venn) [28] was used to analyze the gene expression profiles in the two groups, and the identification of genes with CRC prognosis related genes.
Functional and pathway enrichment analysis
GO is a database established by the Gene Ontology Consortium, which aims to keep the functional description of gene products in each database consistent, so that the properties of gene products can be queried at different levels [29], and GO analysis has become a popular tool for large-scale transcriptome data, being a common method for functional studies and genomic data analysis [30]. The Kyoto Encyclopedia of Genes and Genomes (KEGG; http://www.genome.jp/kegg/pathway) is a reference database for systematic analysis of gene function, linking genomic information with metabolism, membrane transport, and signal transduction linked to higher-order functional information such as the cell cycle [31]. In this study, GO functional and KEGG pathway enrichment analysis was performed on the identified DEGs using R4.0.3, with p < 0.005.
Protein-protein interaction network analysis
The protein-protein interaction network (PPI network) is composed of individual protein interactions and participates in all aspects of life processes such as biological signal transmission, gene expression regulation, energy and material metabolism, and cell cycle regulation [32]. The Search Tool for Retrieving Interacting Genes (STRING; http://string-db.org) database is an online software tool, and this study used the STRING database to build a PPI network of differential genes related to survival to present interactions [33].
Survival analysis of hub genes
CRC datasets from TCGA and GEO were used for survival analysis based on the sample segmentation method and a Cox regression model. The identified key genes can be used to characterize CRC survival and serve as potential therapeutic targets and prognostic biomarkers. The above studies have screened 1058 up-regulated genes, and due to sequencing factors, 922 genes were sequenced in the clinical data of 589 CRC samples in the TCGA database. In order to study the prognostic impact of the identified hub genes on CRC patients, univariate Cox analysis is usually performed to screen out the associated variables, and then a multivariate model is constructed to further confirm whether the association between variables and survival is independent [34]. However, this approach does not take into account the effect of multicollinearity among variables, leading to the possibility of contradictory results of hazard ratios obtained by univariate and multivariate Cox regression. Traditional variable selection methods such as stepwise regression, forward regression, and backward regression in Cox regression are no longer applicable [35].
Compared with Cox analysis method, LASSO (Least absolute shrinkage and selection operator) carries out variable selection while estimating model parameters, and performs better in solving the multicollinearity problem in regression analysis, and can explain the results well [36]. Therefore, when there is multicollinearity between variables or the number of variables is larger than the sample size, the method of Cox regression combined with LASSO is recommended to initially screen variables, and then further establish a LASSO regression model to analyze its impact on prognosis. In a word, the LASSO-Cox survival analysis mode was used, and the differential genes related to prognosis were analyzed using R4.03, the glmnet package and the survival package in this study.
Results
Screening for DEGs
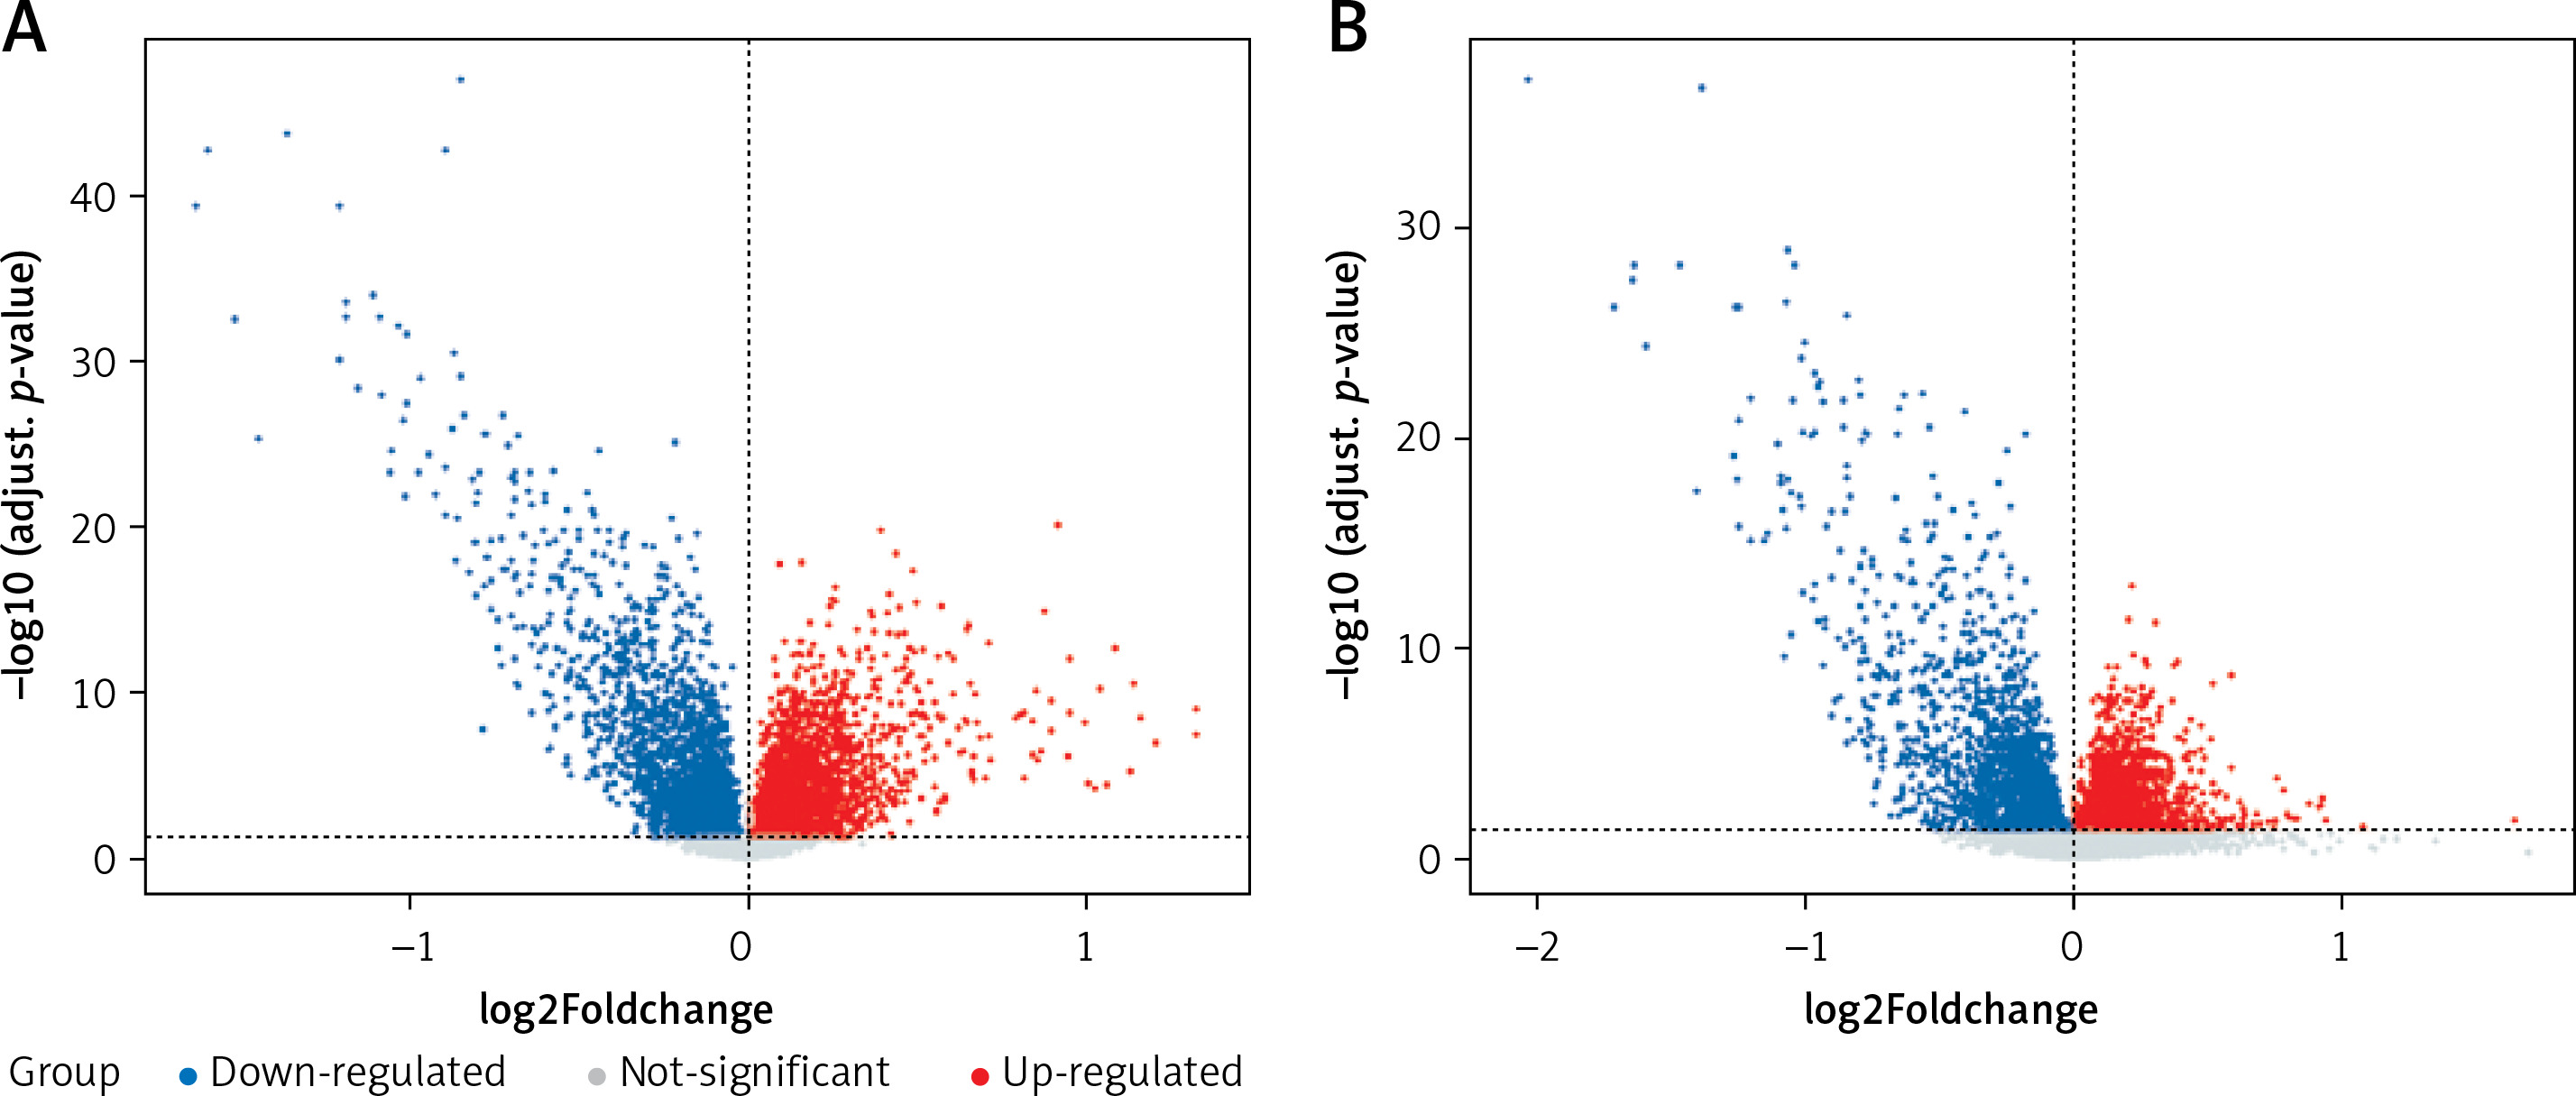
In this study, CRC-related microarray datasets were collected from the GEO database, and a total of 5267 and 4233 DEGs were identified from the GSE20916 and GSE33133 datasets, respectively (p < 0.05). Among them, GSE20916 has 2847 up-regulated genes and 2420 down-regulated genes; GSE33133 has 2104 up-regulated genes and 2129 down-regulated genes. We created volcano plots of DEG distributions for these two datasets (Figure 1 A). Volcano plots (Figure 1 B) show significant and non-significant DEGs for the dataset, where blue dots represent down-regulated genes, red dots represent up-regulated genes, and gray dots represent genes that were not significantly different.
Figure 1
Distribution of differences in gene expression levels. A – Volcano plot showing expression data of CRC and normal tissue in GSE20916 microarray profiles. B – Volcano plot showing expression data in CRC and normal tissue in GSE33133. The x-axis is the average difference between CRC and normal samples (log2 fold change differential expression fold, according to the positive and negative log2 fold change value to determine whether the expression of these genes increases or decreases); the larger gene difference is distributed on the x-axis at both ends, top; the y-axis represents log-transformed p-values converted to –log10
Venn analysis
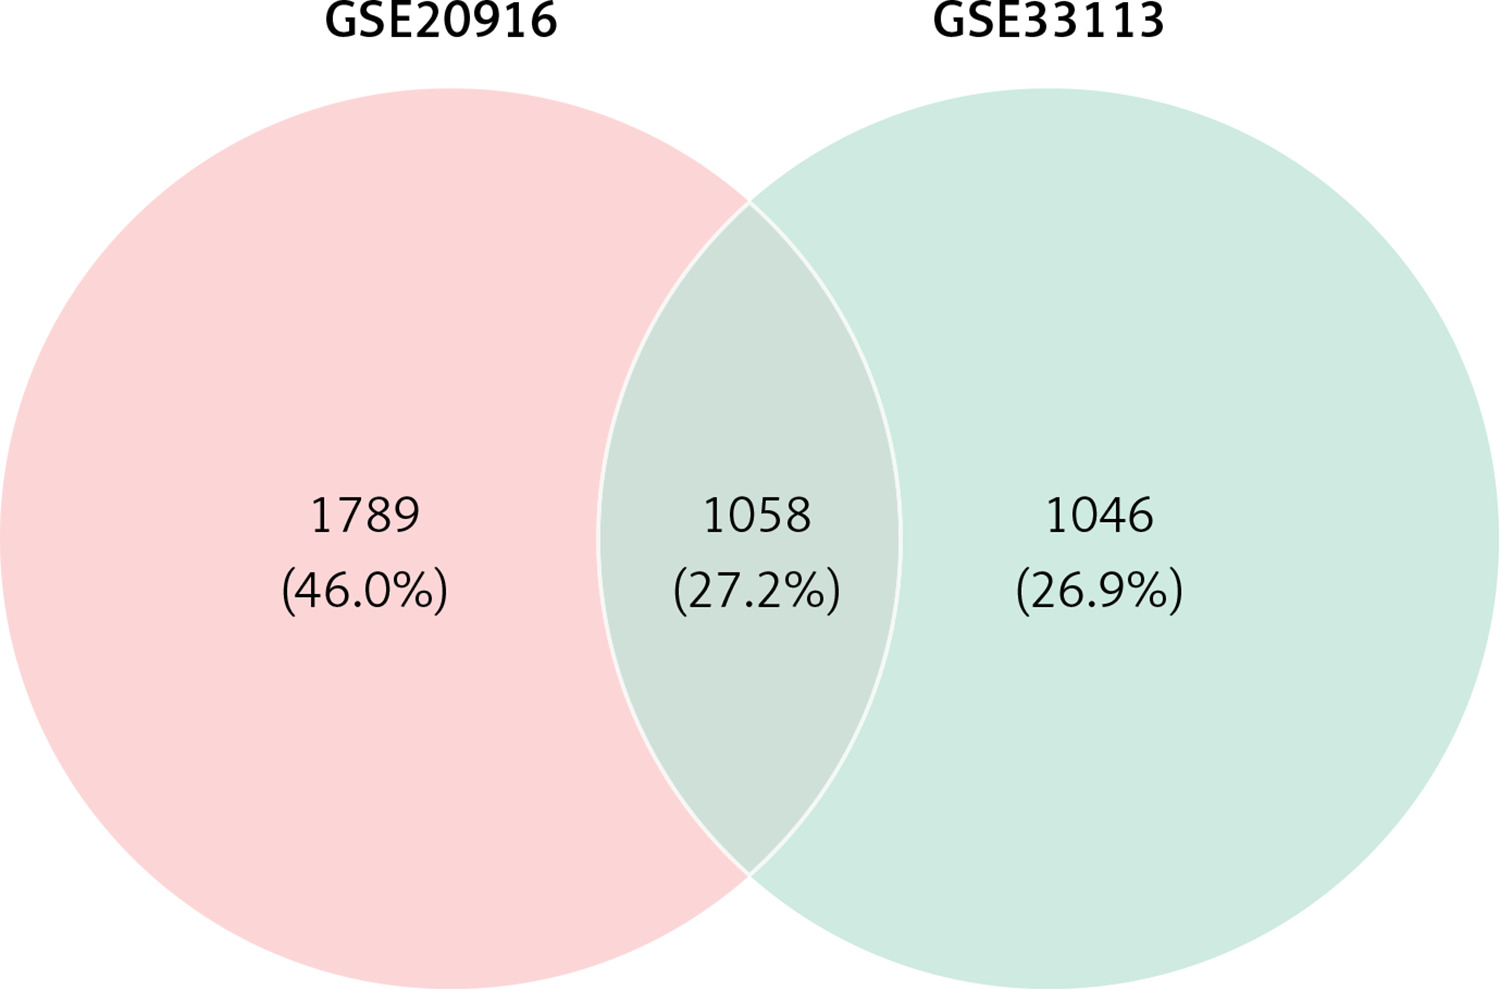
Venn analysis of gene expression in tumor and normal tissues, taking the intersection of all up-regulated genes in GSE20916 and GSE33133 expression data, identified 1058 up-regulated genes (Figure 2).
Functional enrichment analysis of DEGs
To fully understand the biological roles of these DEGs in CRC, we continue to analyze the GO functions and pathways in which they are involved. The results of GO enrichment analysis included biological process (BP), cellular component (CC), and molecular function (MF).
GO analysis
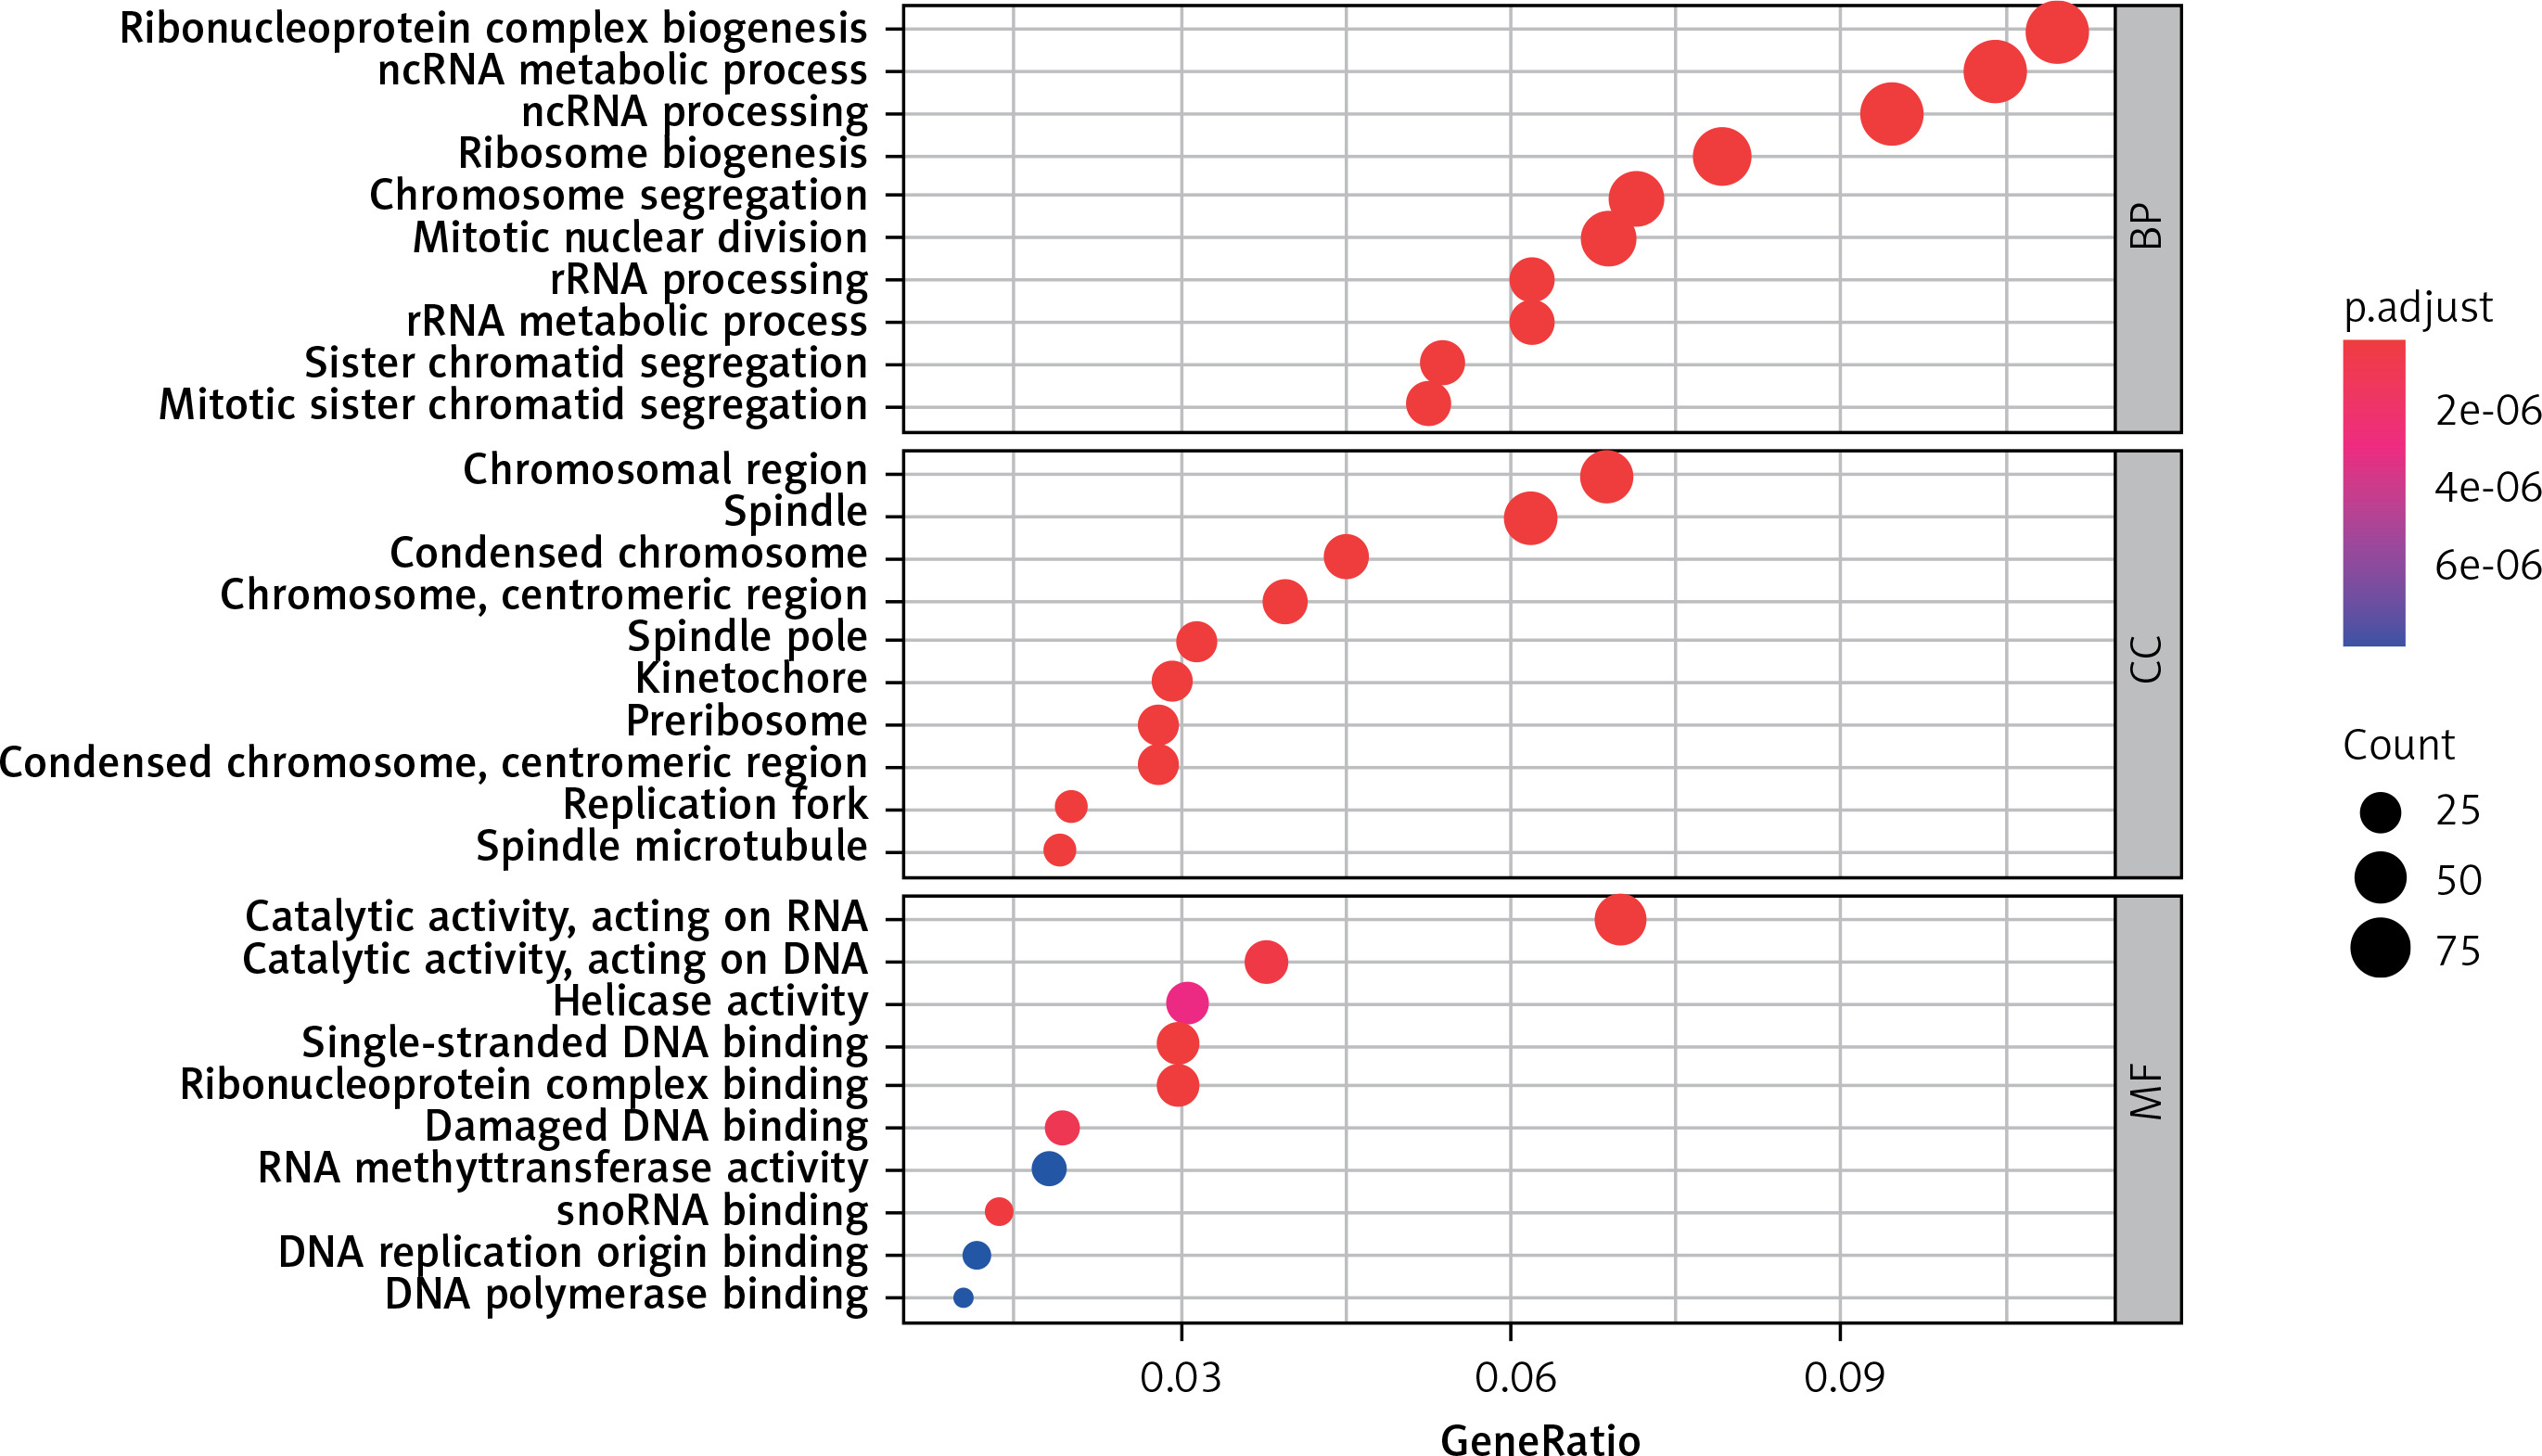
Figure 3 (sorted by p from small to large) shows the results of the GO enrichment analysis. Up-regulation of DEGs mainly involves chromosomal region, spindle, condensed chromosome, chromosome, centromeric region, spindle pole, kinetochore, preribosome, condensed chromosome, centromeric region, replication fork spindle microtubule cell components, ribonucleoprotein complex biogenesis, ncRNA metabolic process, ncRNA processing, ribosome biogenesis, chromosome segregation, mitotic nuclear division, rRNA processing, rRNA metabolic process, sister chromatid segregation, mitotic sister chromatid segregation and biological process significantly enriched. Molecular functions such as catalytic activity acting on RNA, catalytic activity acting on DNA, helicase activity, single-stranded DNA binding, ribonucleoprotein complex binding, damaged DNA binding, RNA methyltransferase activity, snoRNA binding, DNA replication origin binding, and DNA polymerase binding are active.
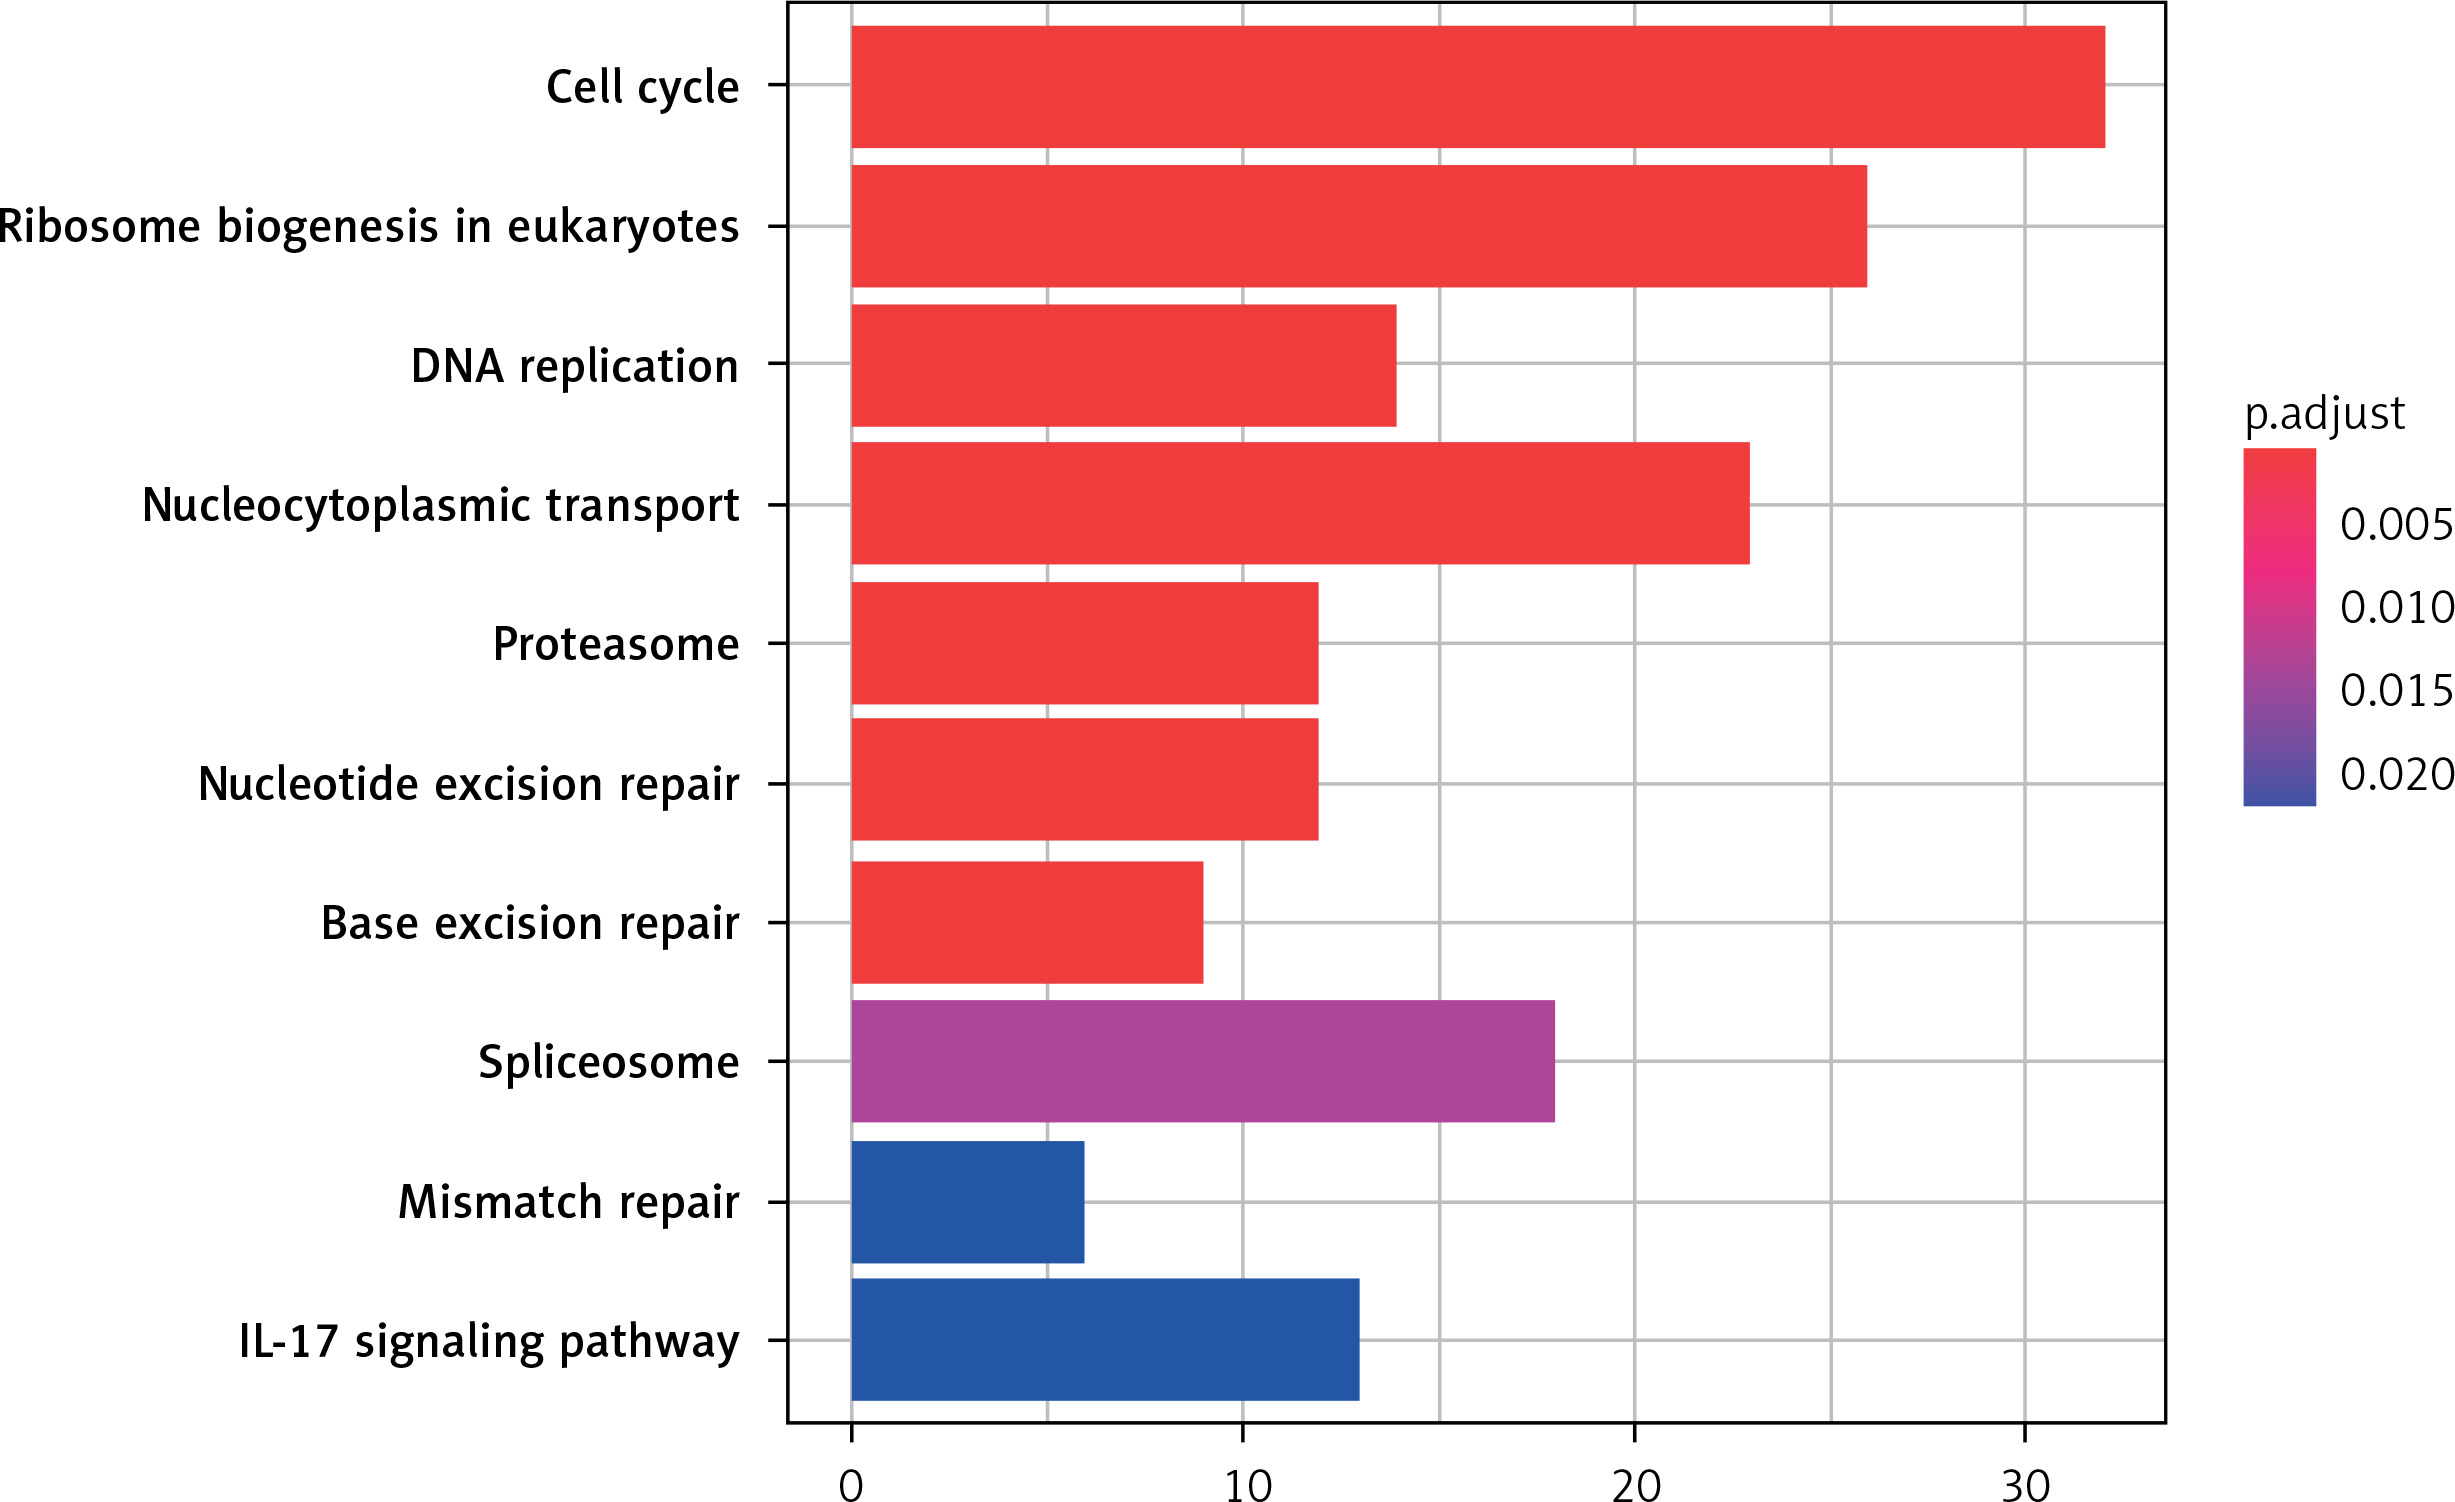
KEGG pathway analysis
The 10 key pathways involved in DEG are sorted by the value of p adjust from small to large, as shown in Figure 4. As the results show, the most significantly enriched signaling pathways for up-regulated DEGs are: Cell cycle, Ribosome biogenesis in eukaryotes, DNA replication, Nucleocytoplasmic transport, Proteasome, Nucleotide excision repair, Base excision repair, Spliceosome, Mismatch repair and IL-17 signaling pathway.
Survival analysis of DEGs
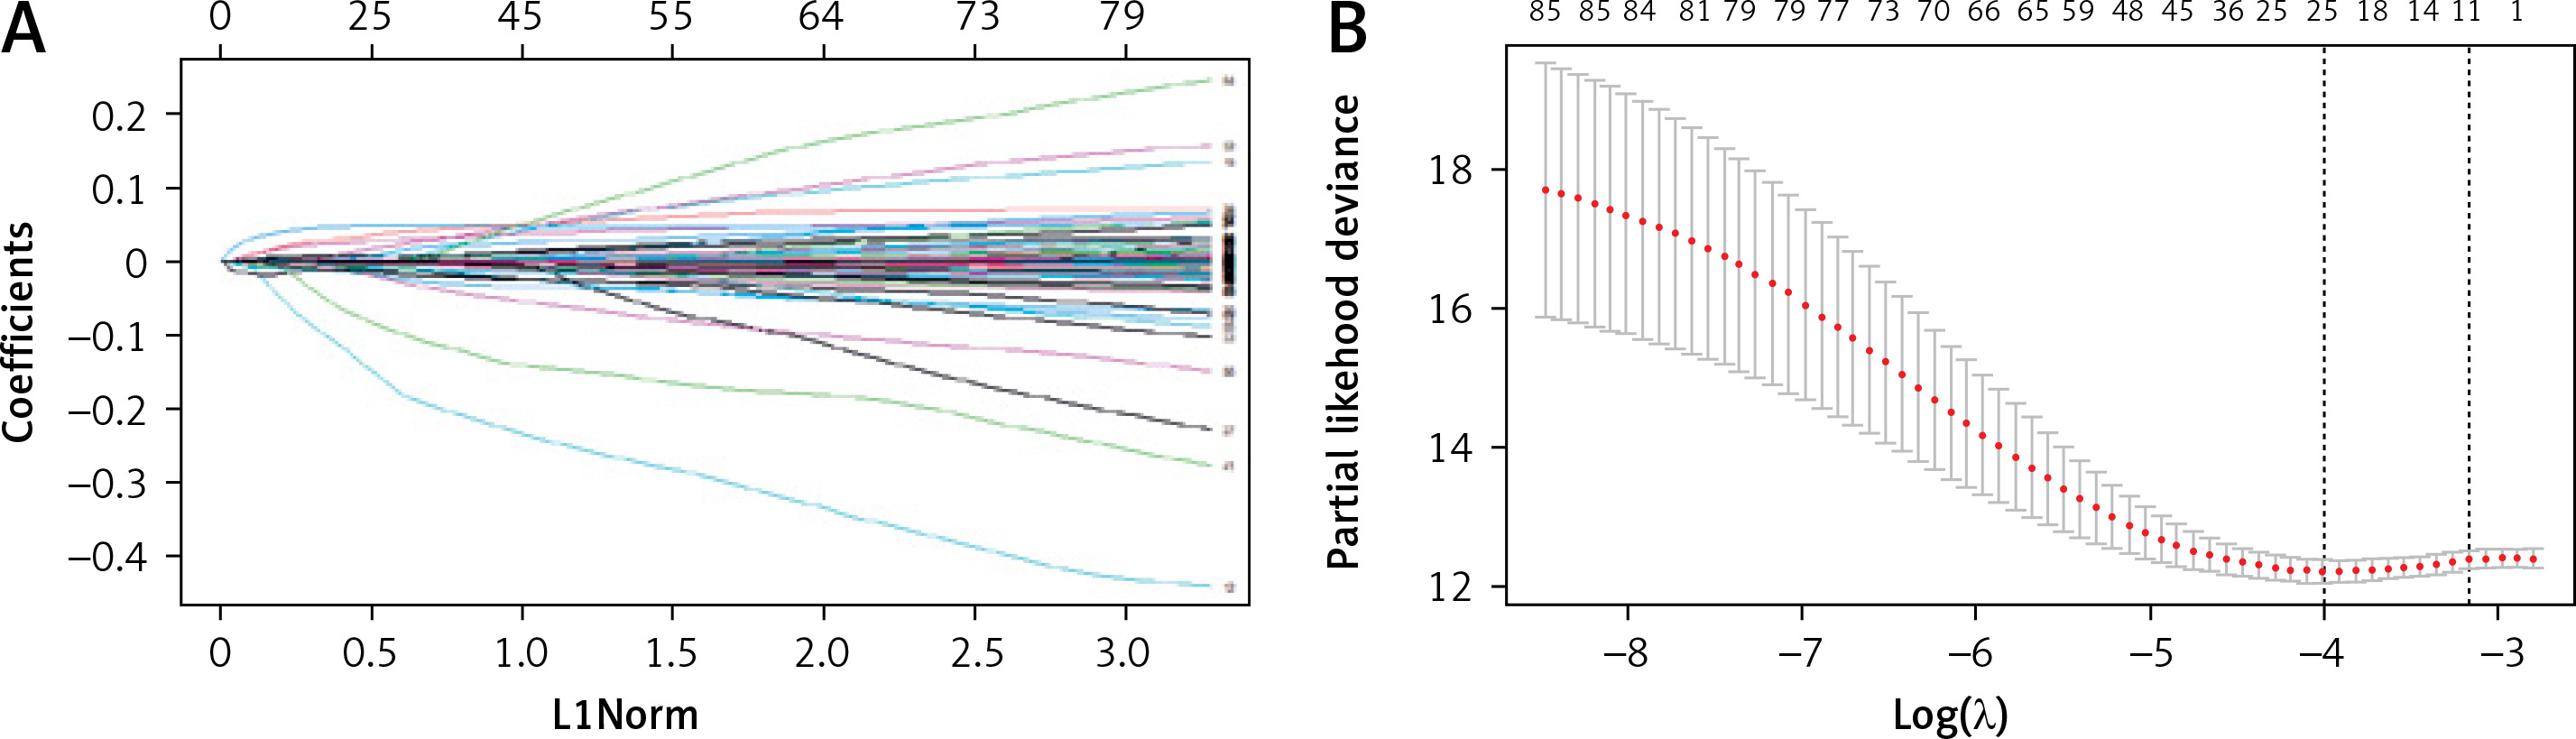
Variables were first screened by univariate Cox, followed by Lasso regression analysis to determine final variables and build models to analyze the prognostic impact. Univariate Cox regression analysis was performed on 922 DEGs obtained in this study, and 88 prognostic variables were identified. Differential genes, followed by LASSO regression analysis, yielded 11 DEGs (Figure 5), which can be used as potential prognostic indicators for CRC.
Figure 5
LASSO-Cox regression variable filtration. A – Cross-validation. Screening genes with prognostic efficacy from 88 genes, sample size N = 88; these genes are highly co-expressed in the sample; that is, there is collinearity between variables, and 11 genes are obtained, see Table I. B – Multivariate Cox regression analysis to construct a prognostic model and risk scoring. The abscissa is the log λ value, and the ordinate is the evaluation index corresponding to each λ value. The error bar is used to show the evaluation index of multiple models. Mean + standard error; two vertical dotted lines can be seen in the figure; the dotted line on the left corresponds to the best λ value of the evaluation index, that is, λ.min; the larger the c-index value, the better, and the smaller the deviance value, the better. The dotted line on the right represents the λ value of the model whose evaluation index is within 1 standard error of the optimal value, namely lambda.1se
Survival analysis and modeling
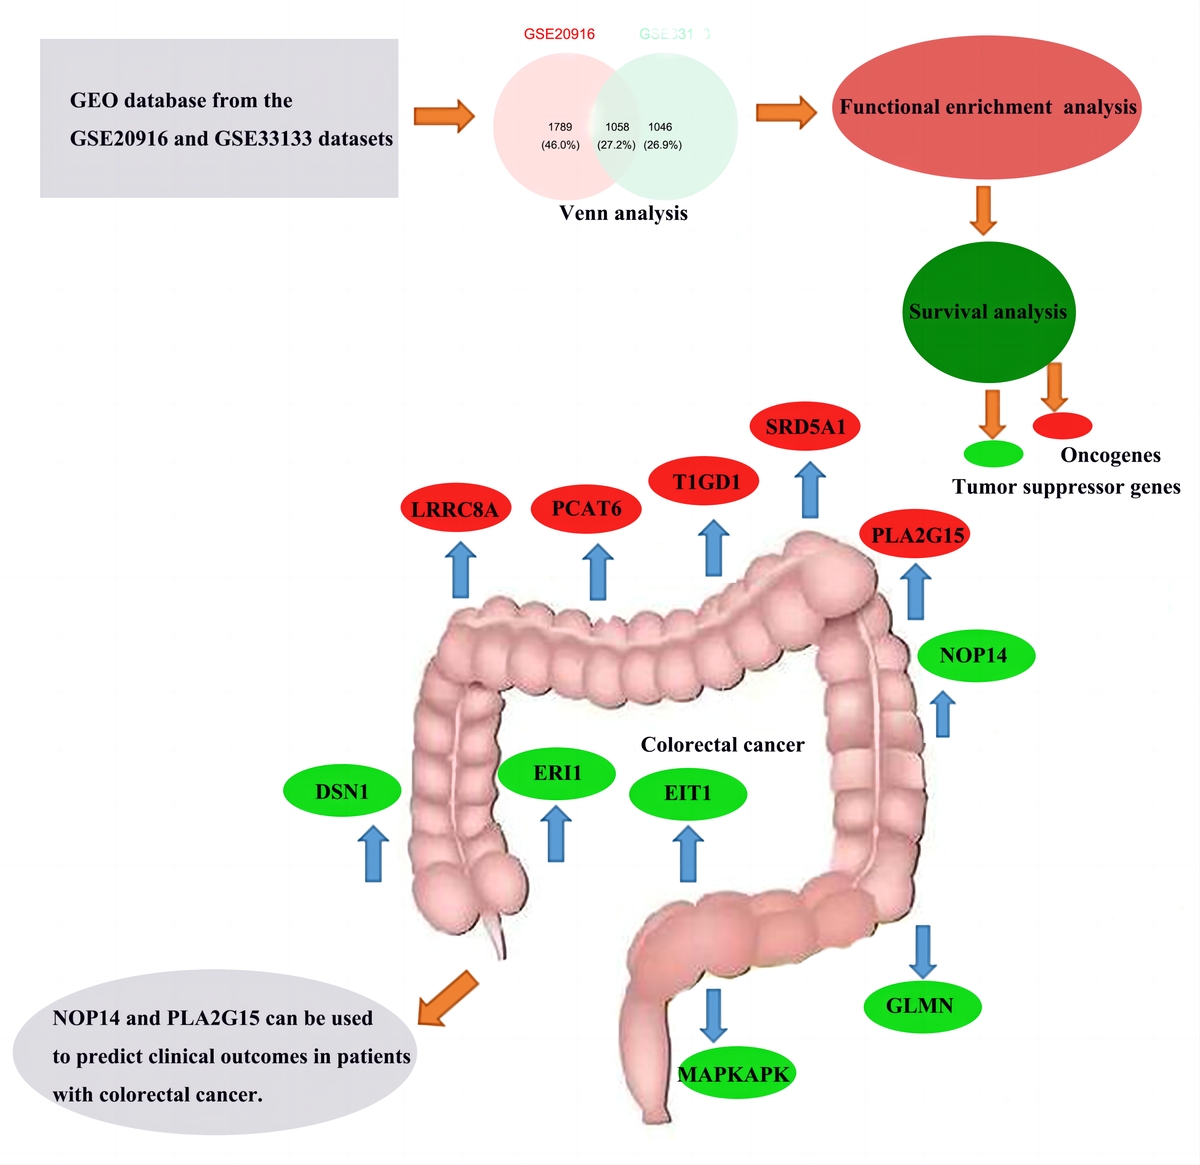
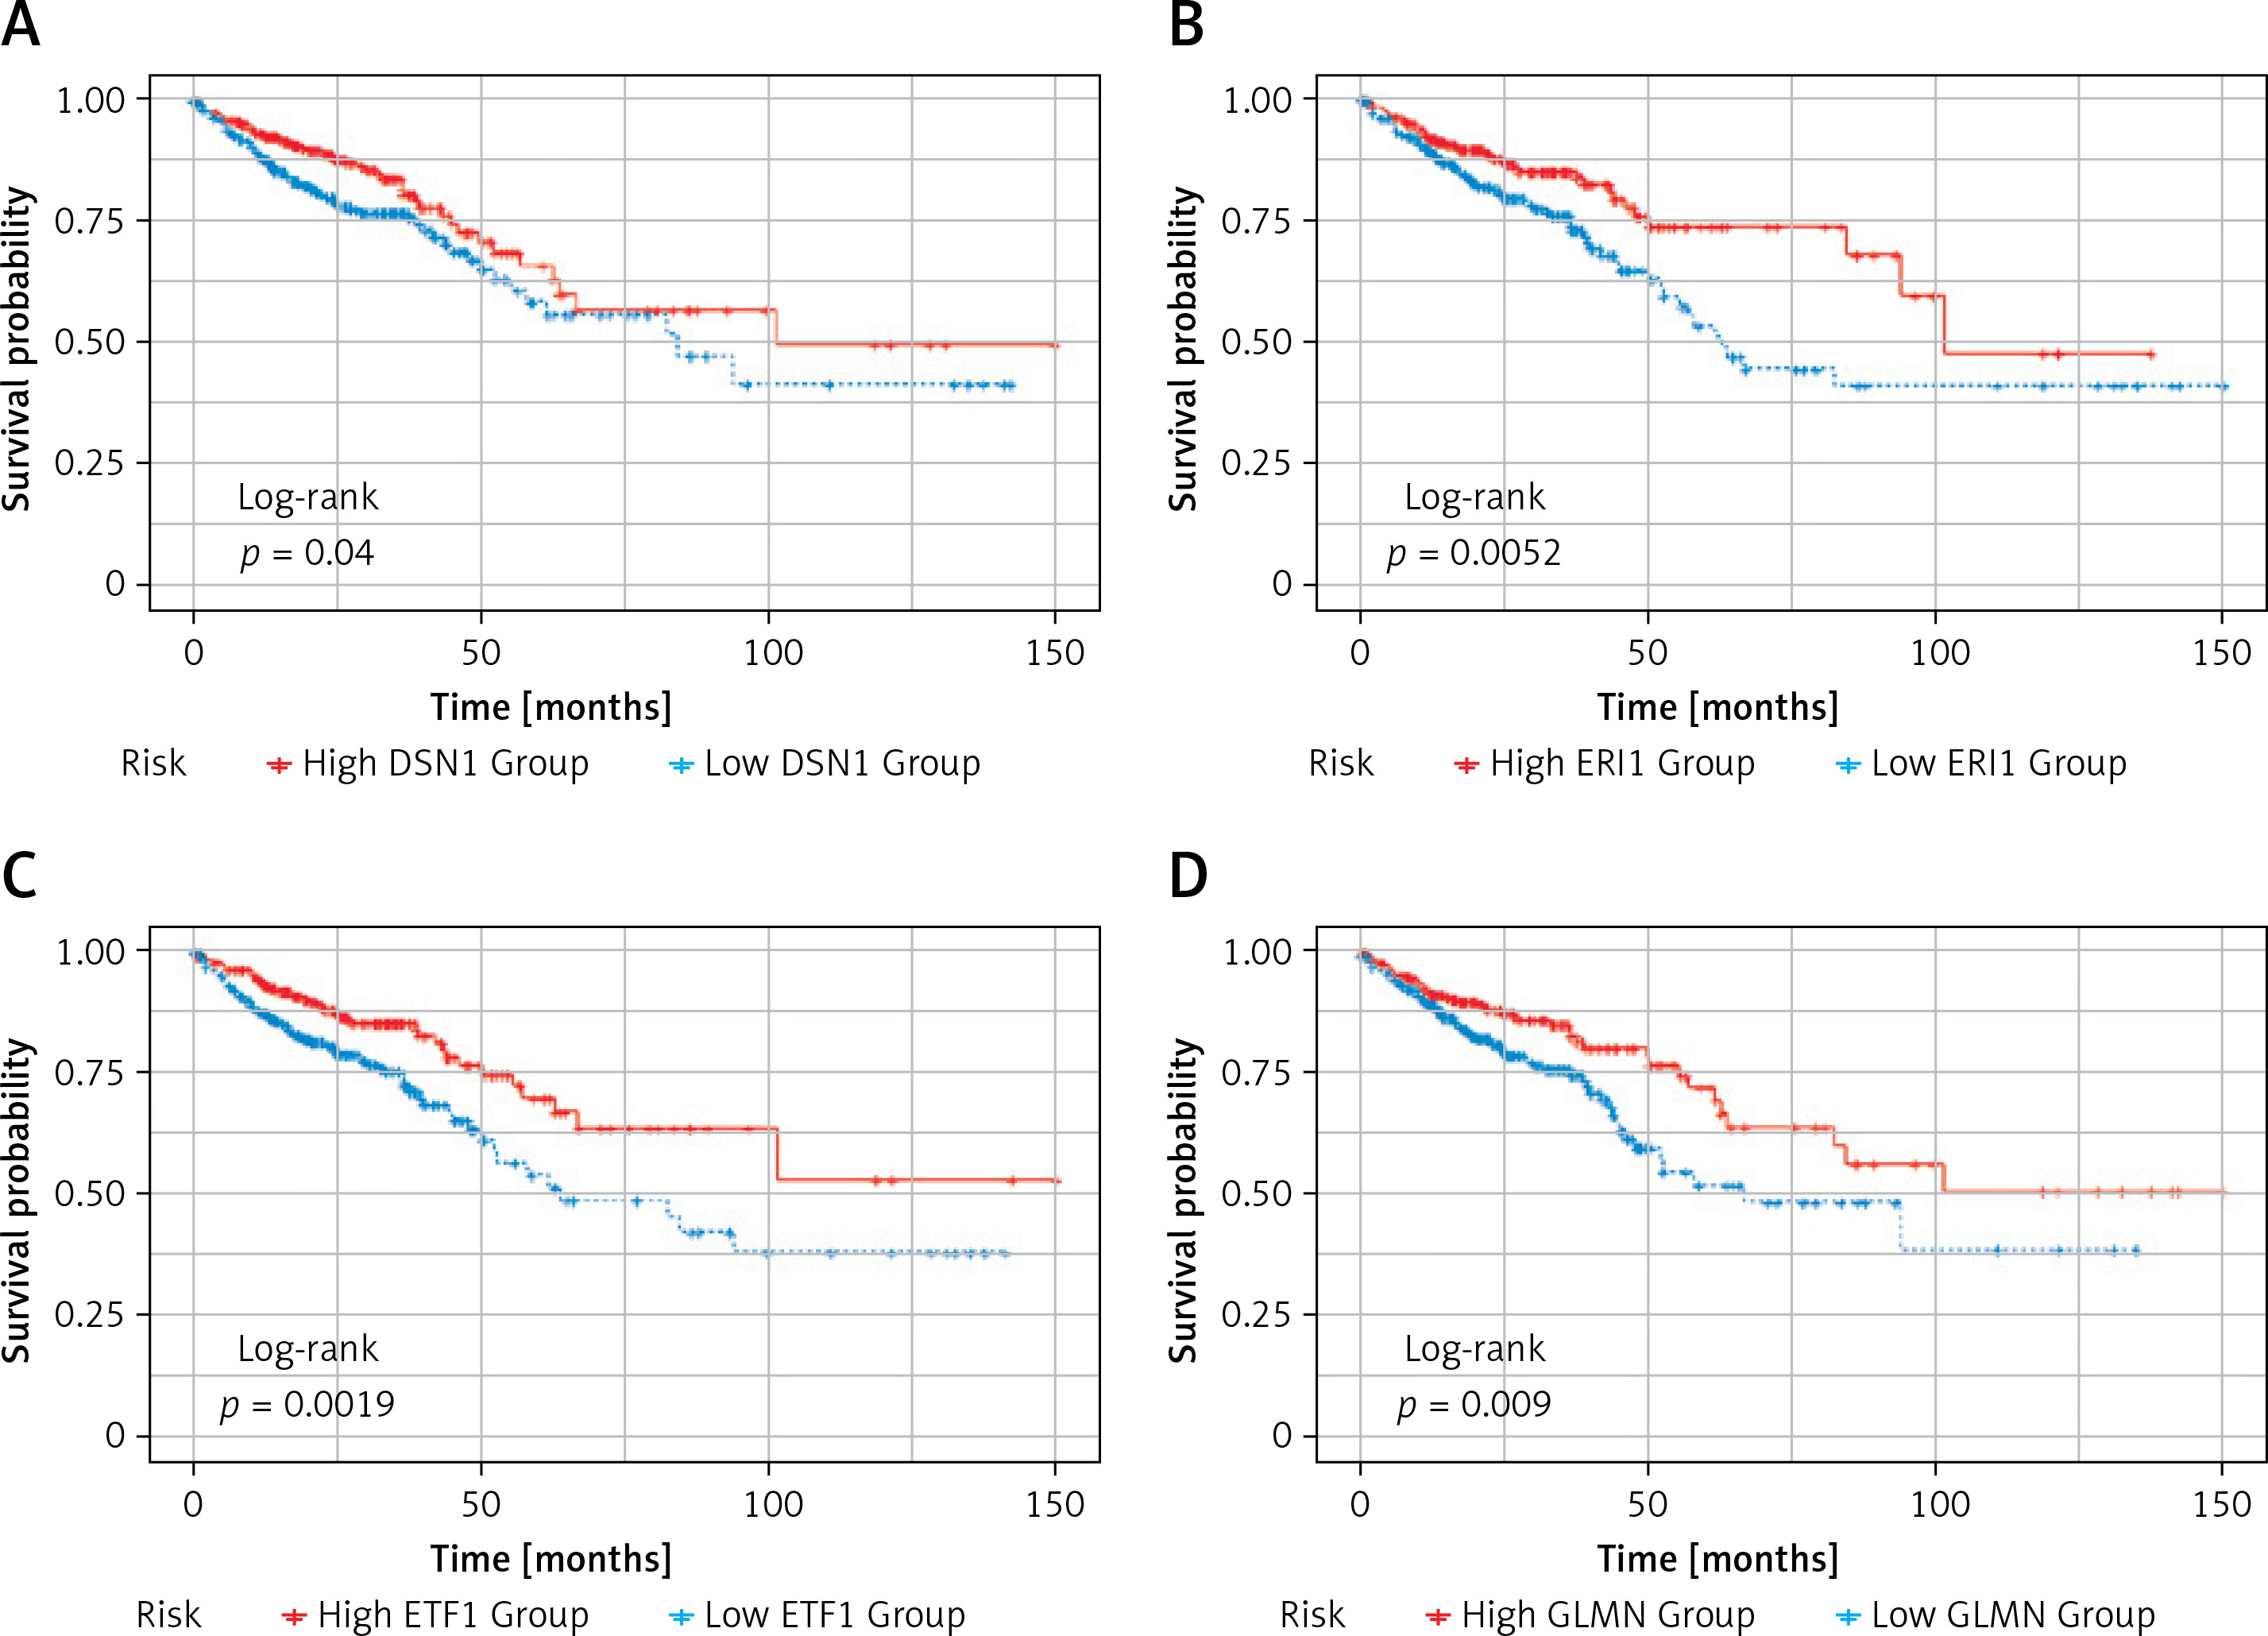
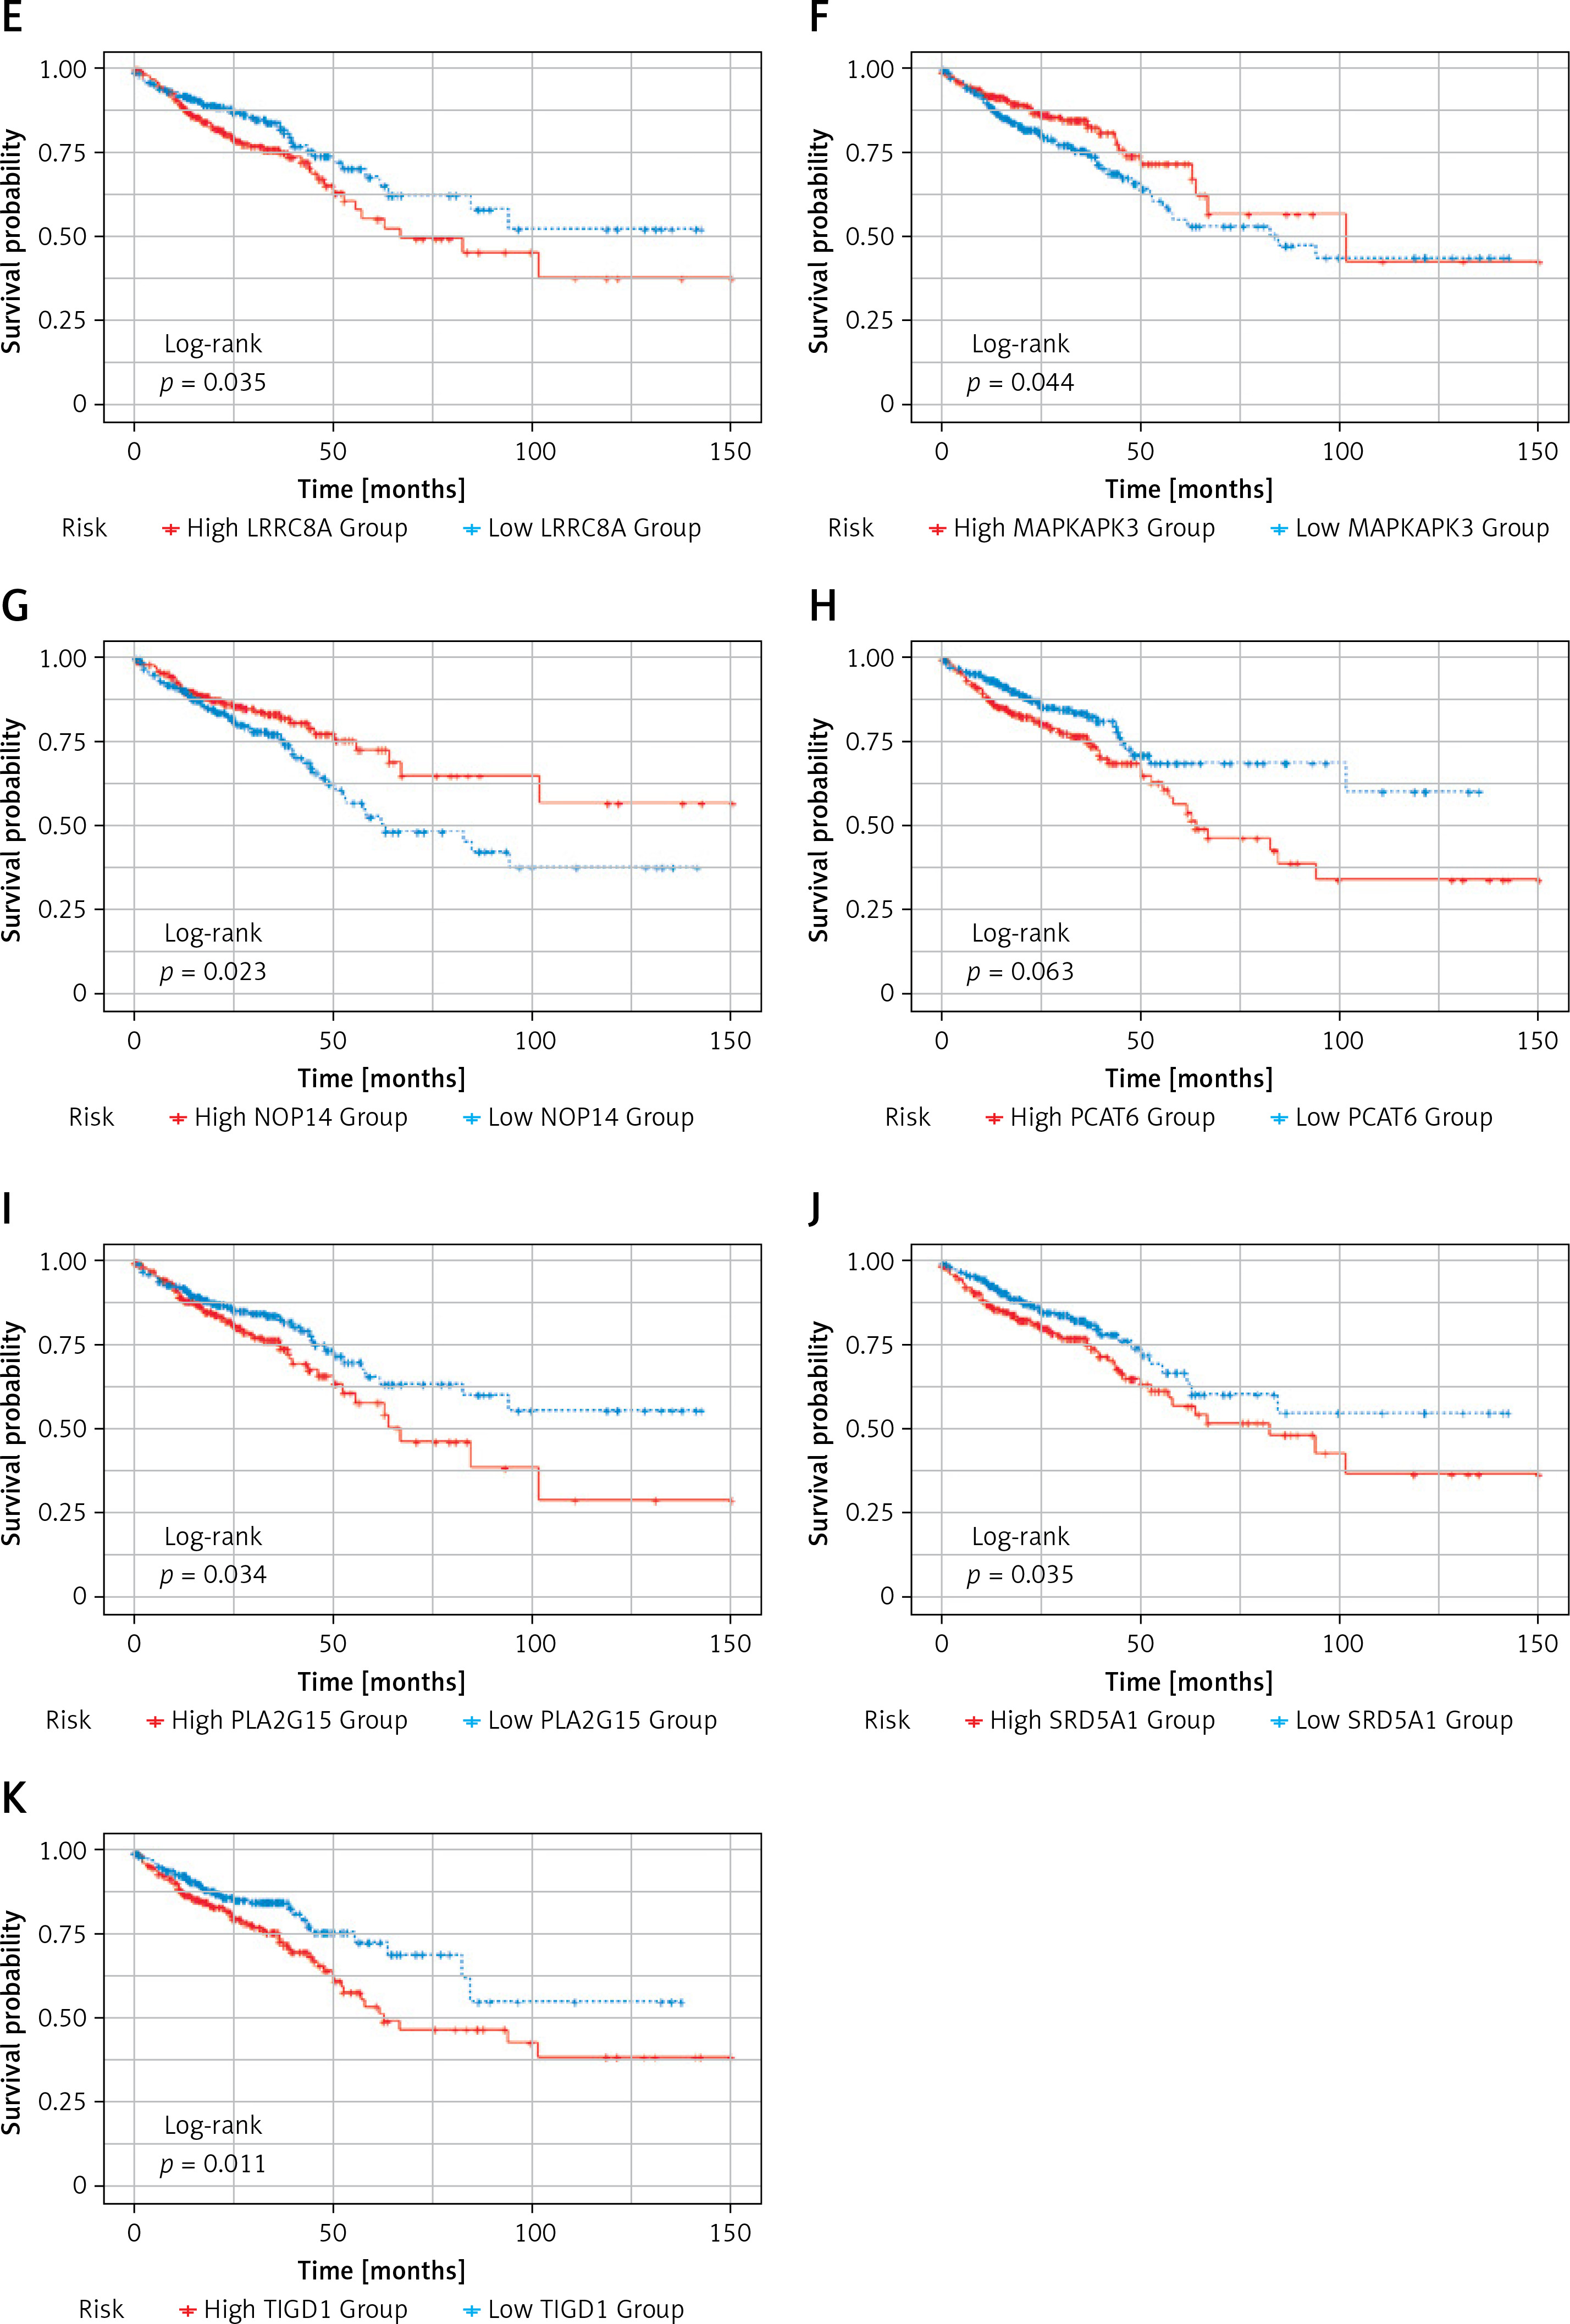
Subsequently, survival analysis was performed on the 11 DEGs, and the Kaplan-Meier curves were obtained as shown in Figure 6. Kaplan-Meier curves overall survical (OS) of these genes showed that high LRRC8A, PCAT6, PLA2G15, SRD5A1, T1GD1 expression was significantly associated with low OS in colorectal cancer patients, and high PLA2G15 expression was associated with the lowest survival after 5 years; high DSN1, ERI1, EIT1, GLMN, MAPKAPK, NOP14 expression was significantly associated with high OS in patients with colorectal cancer, and high expression of NOP14 was associated with the highest survival rate after 5 years. The former may be oncogenes, while the latter may be potential tumor suppressor genes.
Figure 6
Kaplan-Meier OS curves. Kaplan-Meier OS curves of 11 DEGs. A – Kaplan-Meier OS curves of DSN1. B – Kaplan-Meier OS curves of ERI1. C – Kaplan-Meier OS curves of ETF1. D – Kaplan-Meier OS curves of GLMN. E – Kaplan-Meier OS curves of LRRC8A. F – Kaplan-Meier OS curves of MAPKAPK3. G – Kaplan-Meier OS curves of NOP14. H – Kaplan-Meier OS curves of PCAT6. I – Kaplan-Meier OS curves of PLA2G15. J – Kaplan-Meier OS curves of SRD5A1. K – Kaplan-Meier OS curves of T1GD1
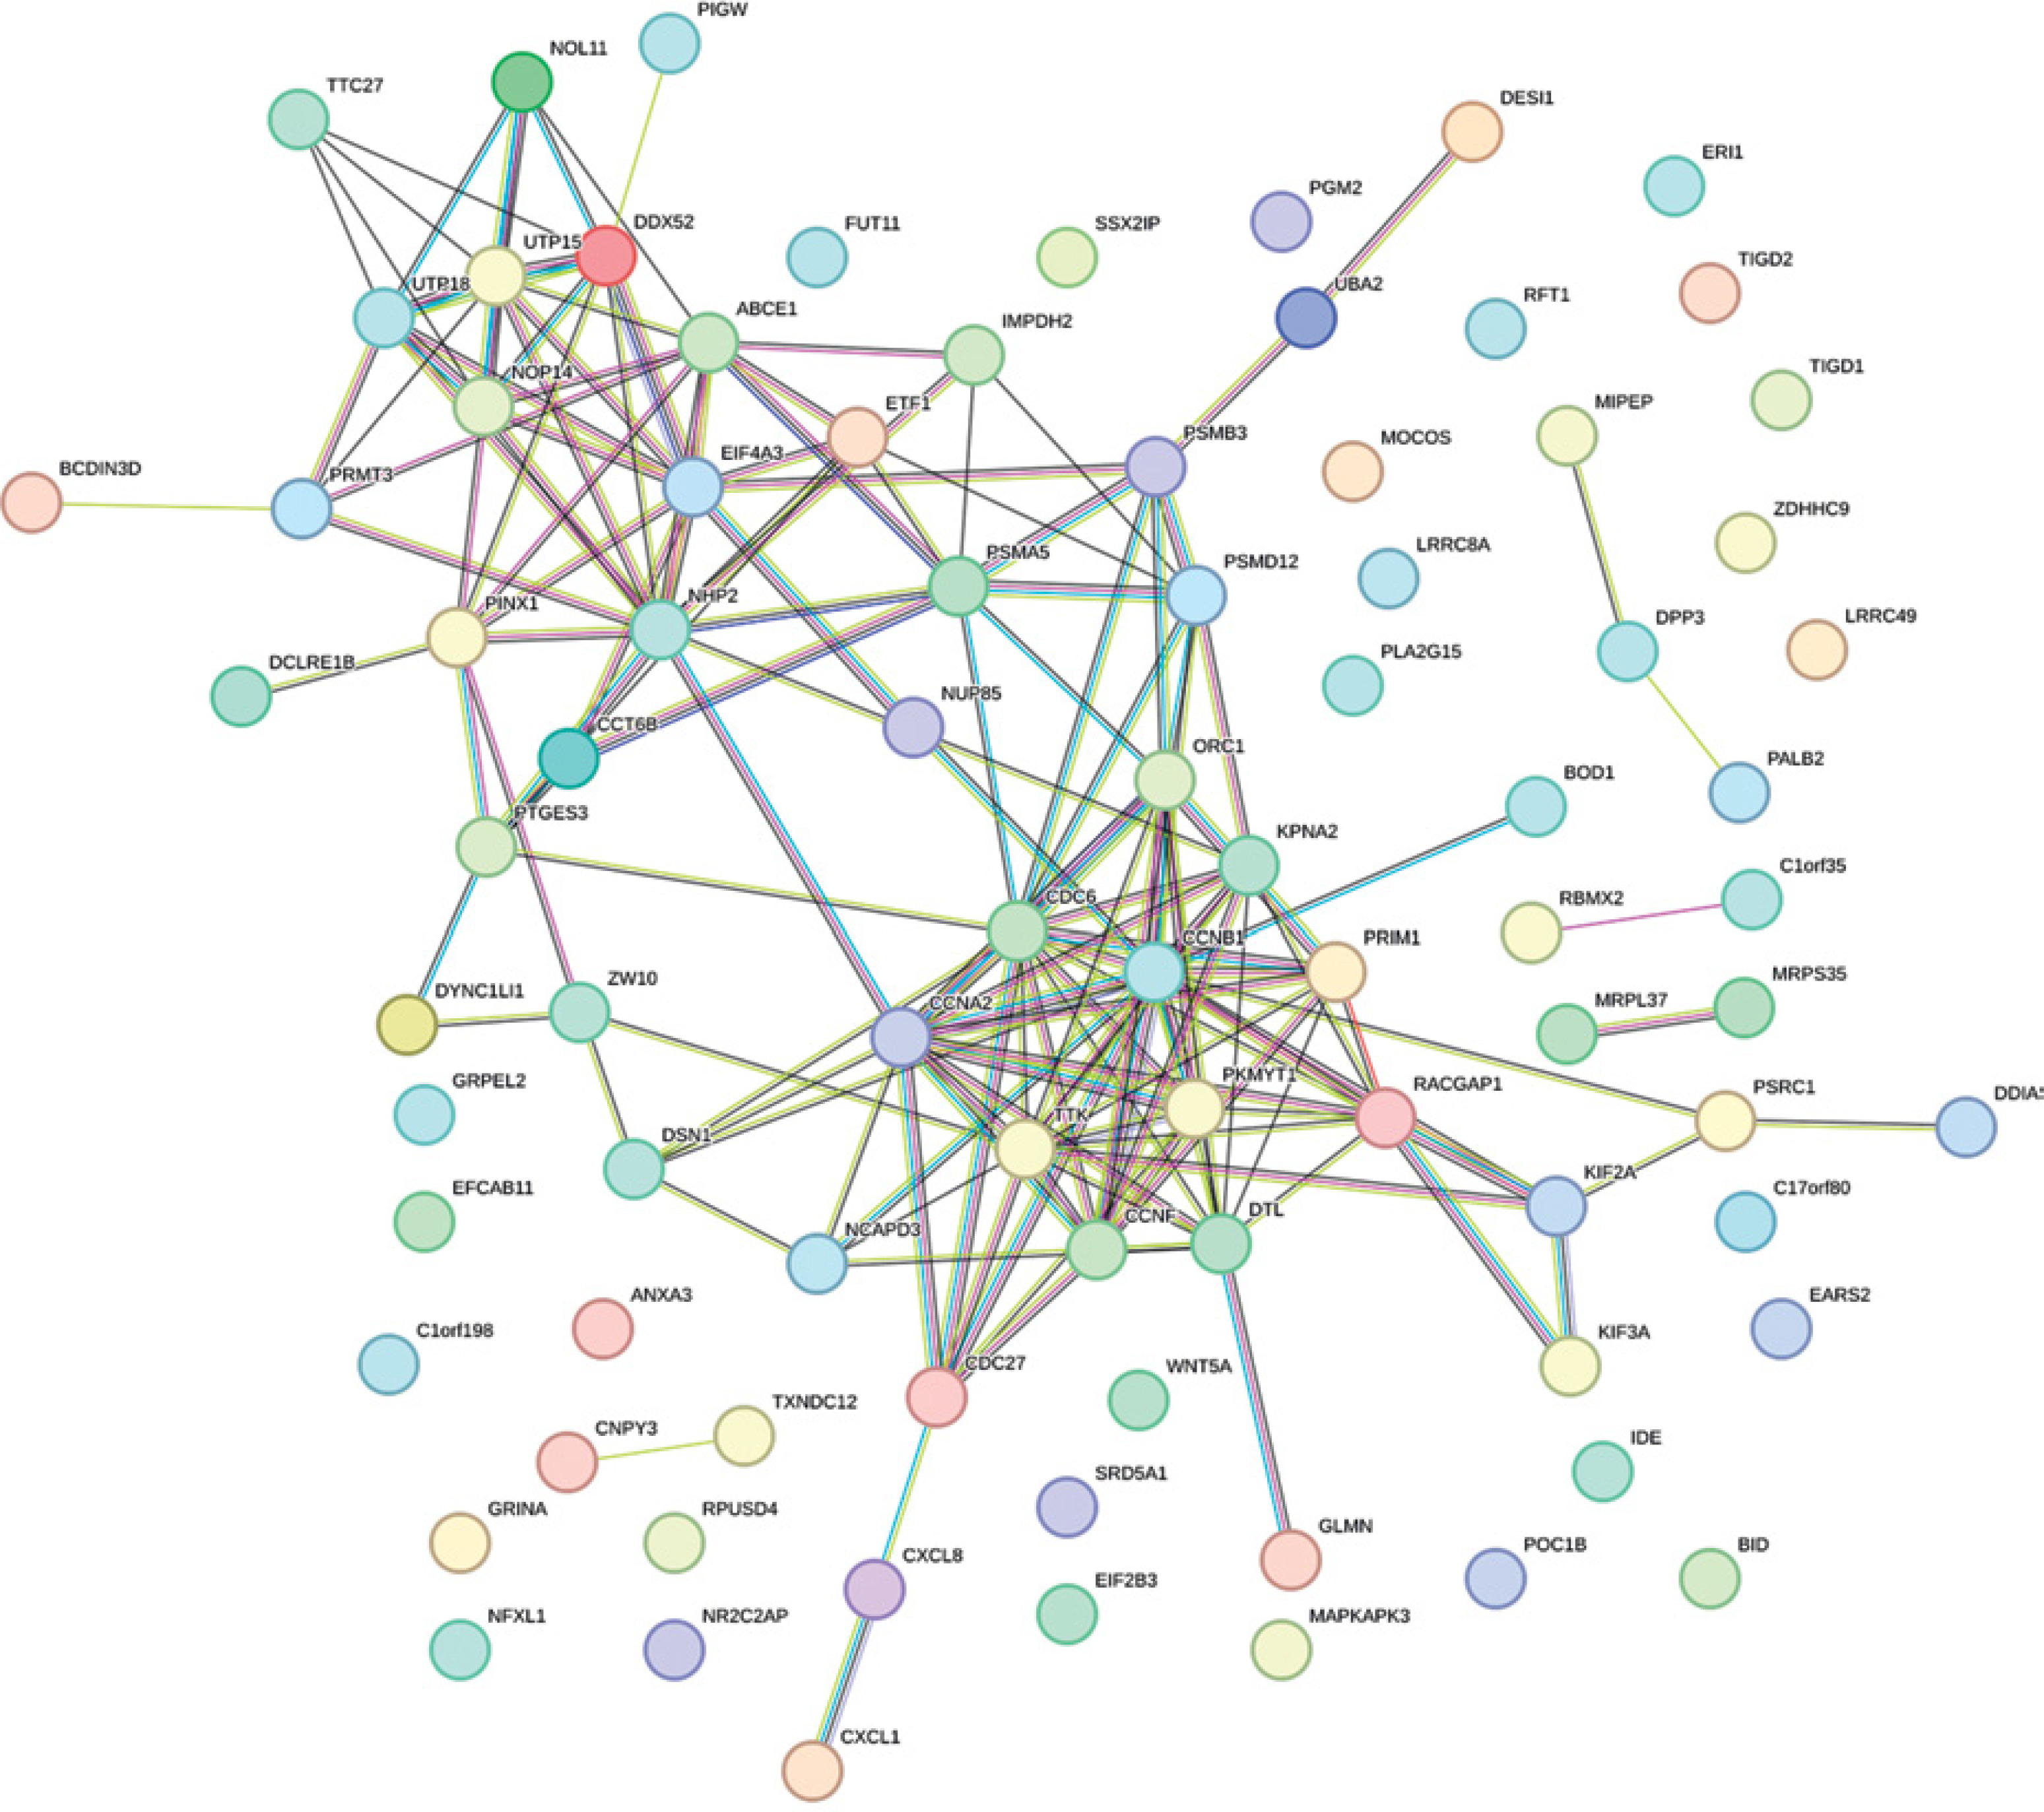
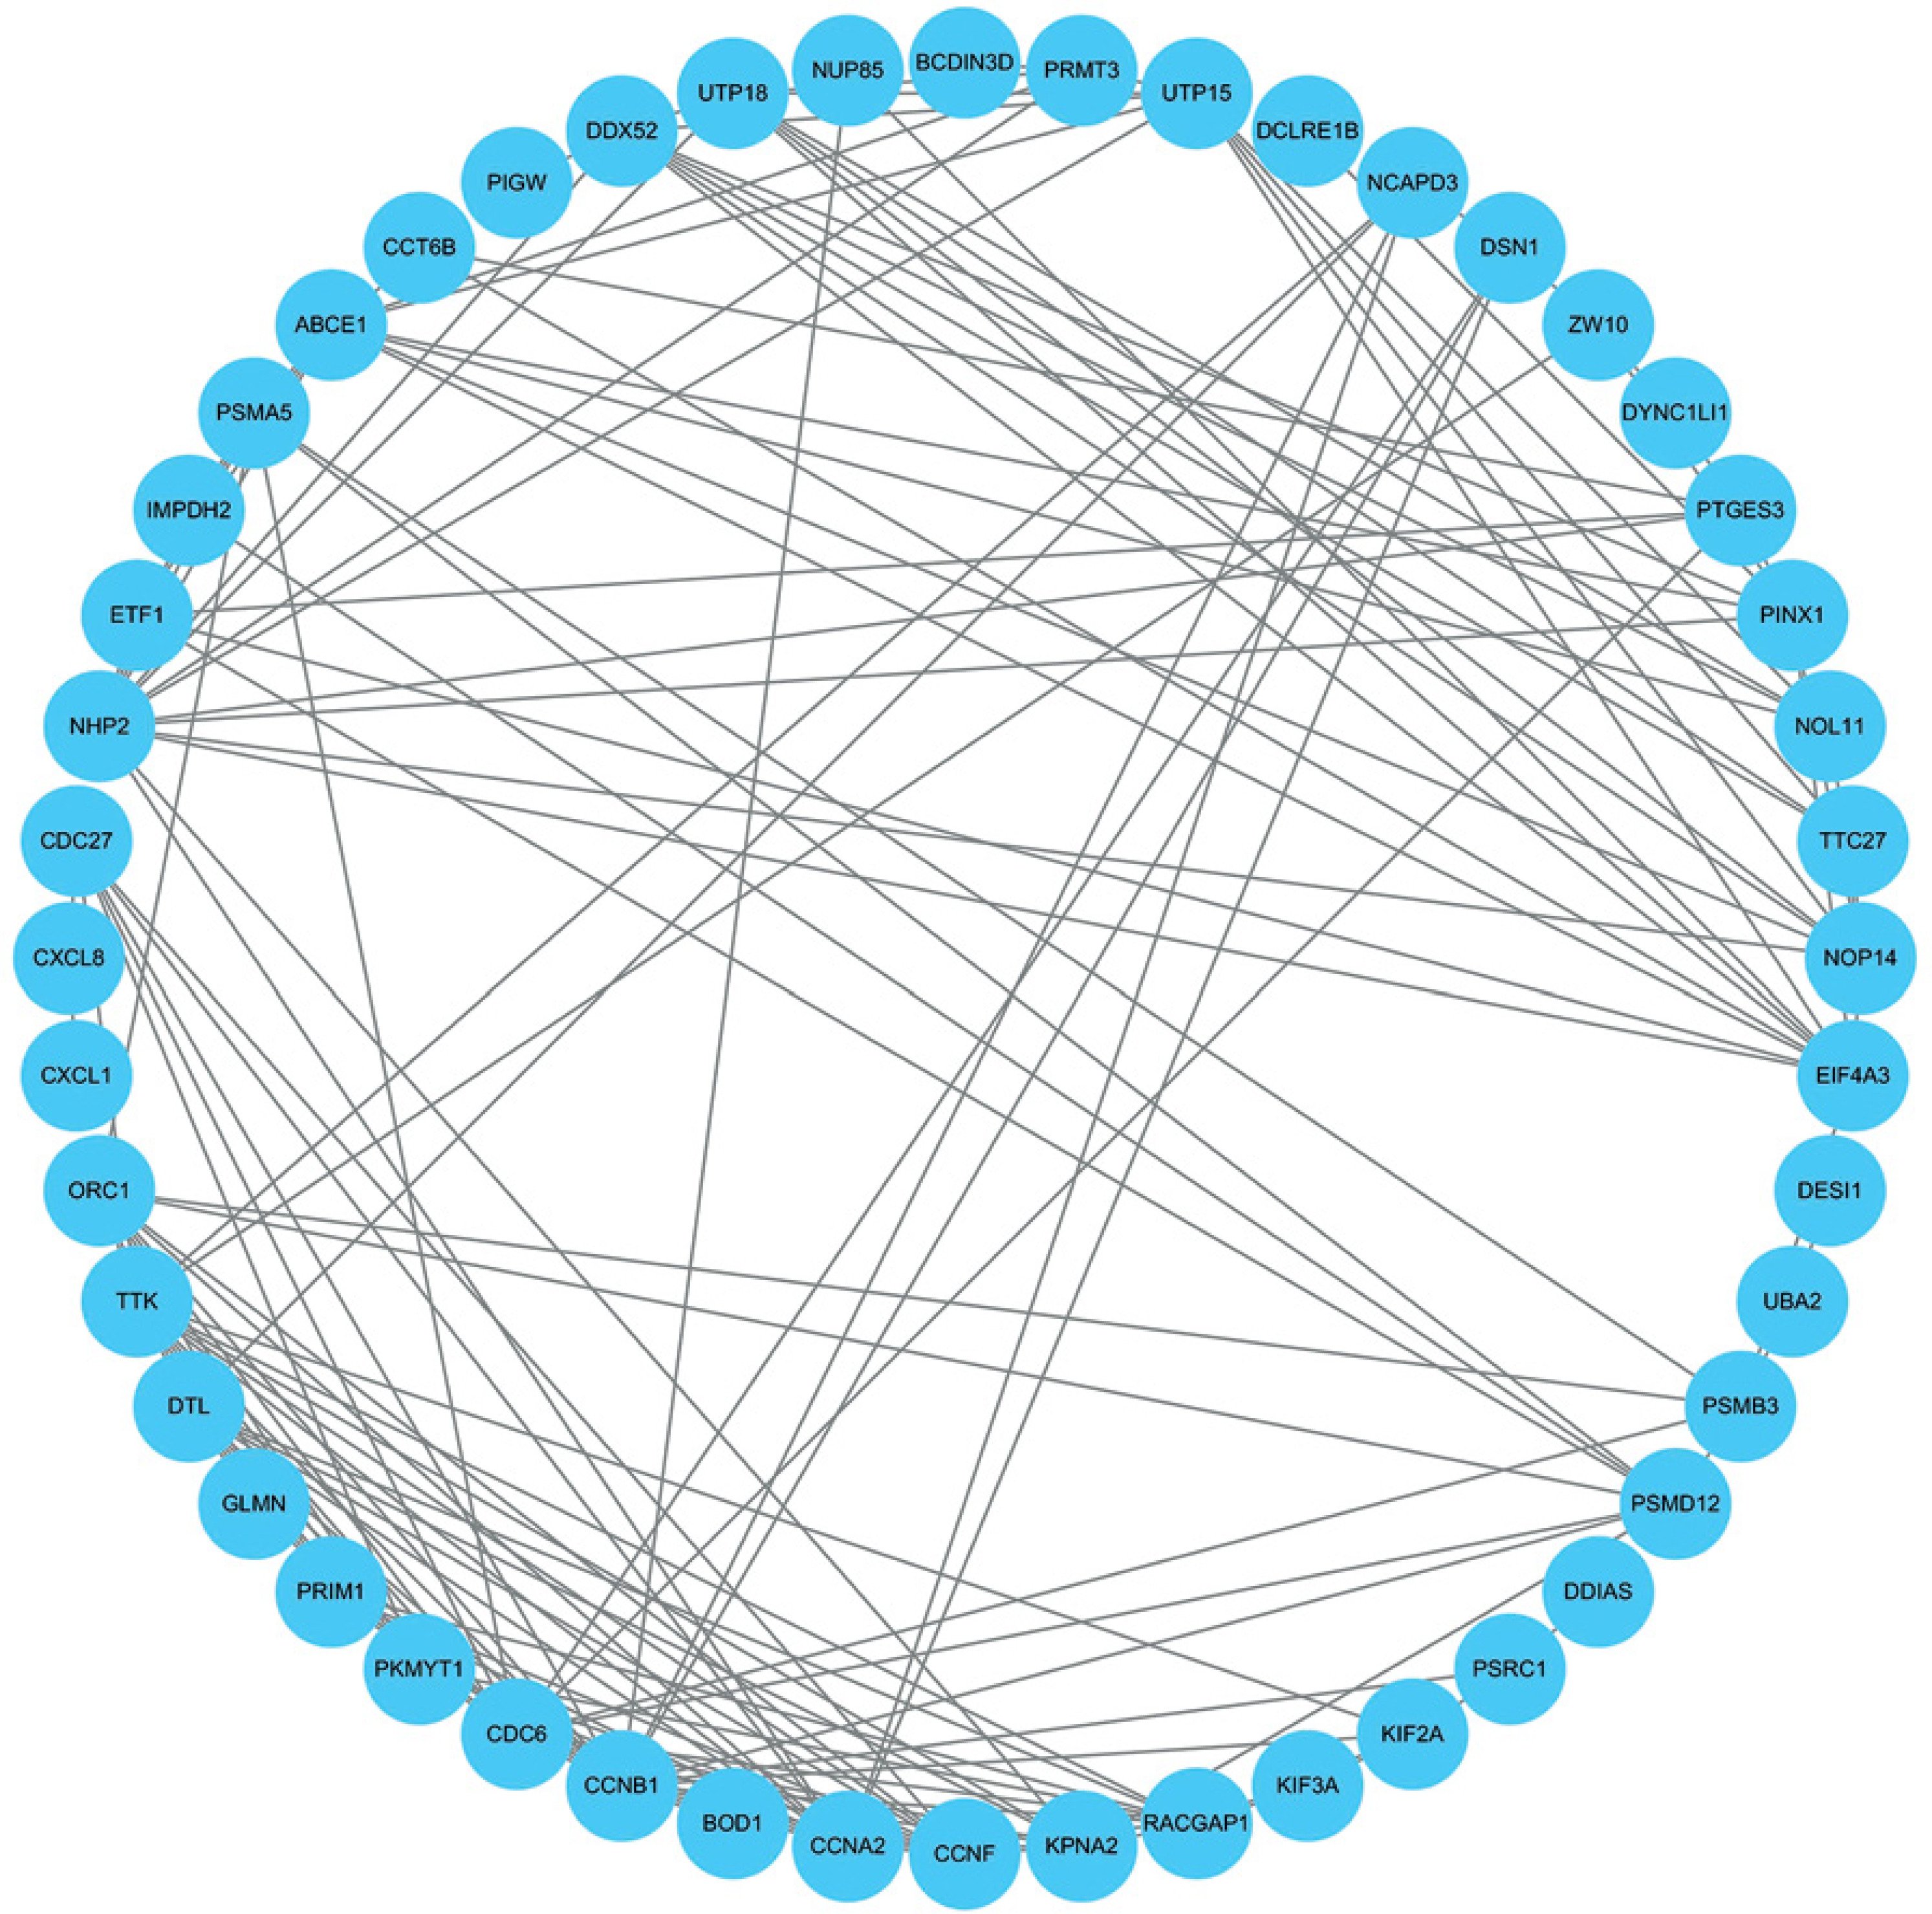
PPI analysis results of DEGs
The PPI network of 88 survival-related DEGs was constructed using the String online tool (Figure 7), and Figure 8 was obtained after removing unrelated genes.
Survival analysis and modeling
Then, based on the 11 DEGs and coefficients that can be used as prognostic indicators obtained by LASSO-Cox analysis (Table I), these potential prognostic indicators were further studied. A prognostic risk model was constructed: Risk score = DSN1* (–0.0006) + ERI1*(–0.0035) + ETF1*(–0.0005) + GLMN*(–0.0124) + LRRC8A*0.0015 + MAPKAPK3*(–0.0029) + NOP14*(–0.0003) + PCAT6*0.0020 + PLA2G15*0.0049 + SRD5A1*0.0015 + TIGD1*0.0231. We multiplied the gene expression by the coefficient to get the risk score, and then predicted the patient’s survival according to the score, and obtained the AUC value of the model result, that is, the value of each sample.
Receiver operating characteristic curve analysis
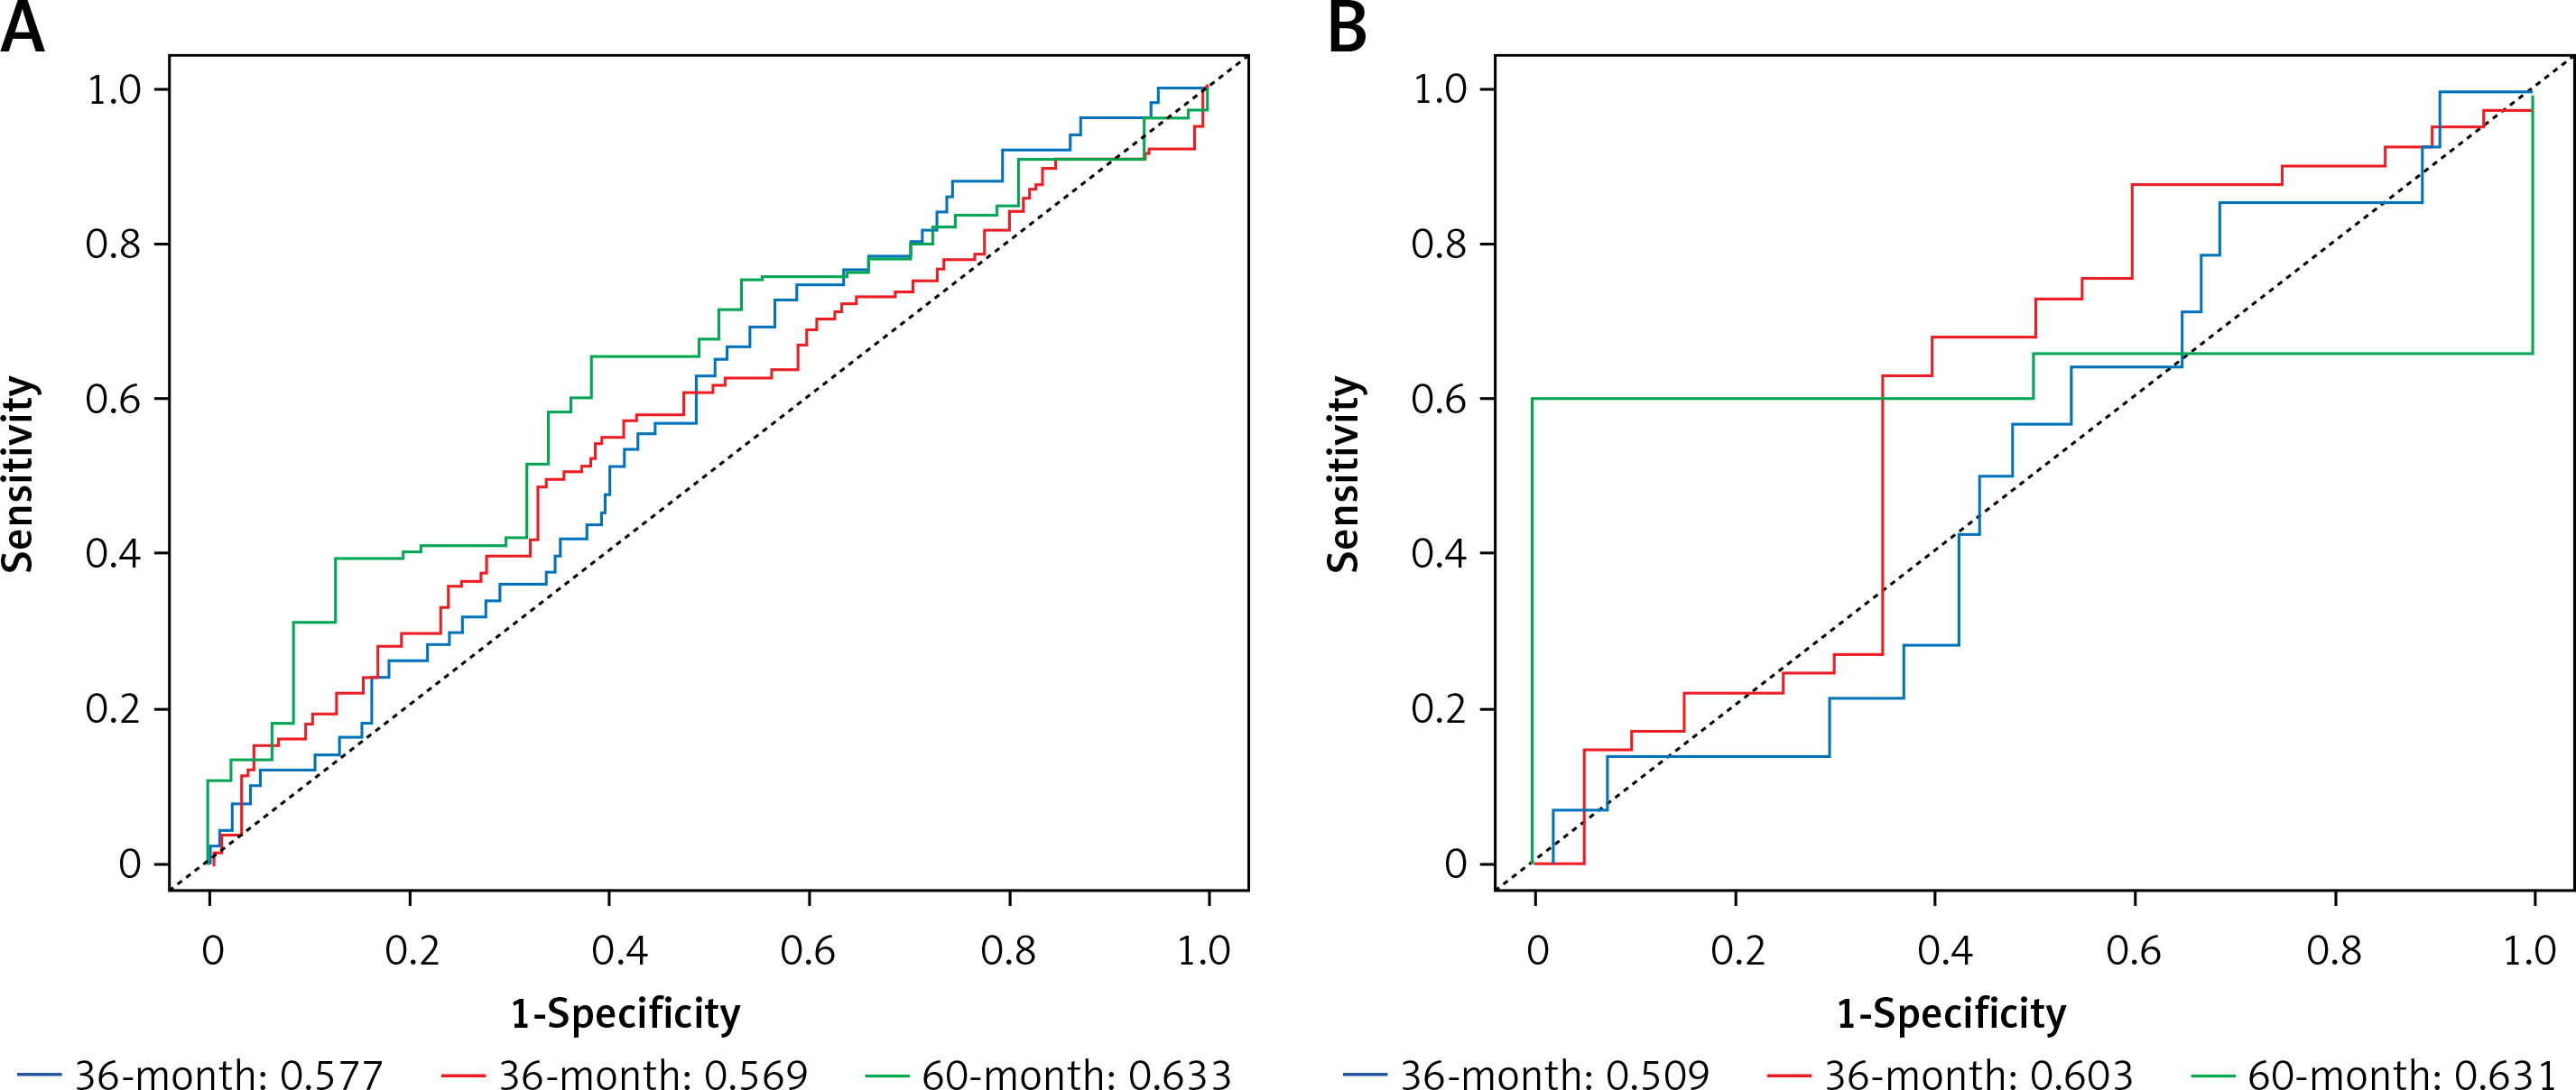
A higher AUC value indicates a better classification performance of the CRC prognostic model for the gene. The model prognostic ability was assessed using the TCGA dataset, and the model was validated using GSE72968. The performance of the model on the training set (TCGA): The AUCs for predicting 1-year, 3-year and 5-year survival are: 0.577, 0.569 and 0.633, respectively. Model performance on the validation set (GSE72968): The AUCs for predicting 1-year, 3-year and 5-year survival were: 0.509, 0.603 and 0.631, respectively. The results show that the most obvious prognostic effect is in 5 years. Comparing the AUC values of survival in each stage of the validation set and the training set, the difference between the two AUC values in 5 years is the smallest, and the result is more accurate. Finally, the model was validated. Figure 9 shows the ROC curves of the training set TCGA and the validation set GSE72968 sample data. The ROC plot is a graph reflecting the relationship between sensitivity and specificity (Figure 9).
Figure 9
Receiver operating characteristic curve (ROC curve). A – ROC curve of ROC sample data with training set TCGA. B – ROC curve of the validation set GSE72968 sample data. The X-axis of the abscissa is the specificity, also known as the false positive rate (false positive rate: 1-Specificity); the closer the X-axis is to zero, the higher the accuracy; the Y-axis of the ordinate is called the sensitivity, also known as the true positive rate (Sensitivity: Sensitivity); the larger the Y-axis, the better the accuracy. According to the position of the curve, the whole graph is divided into two parts. The area under the curve (AUC) is used to indicate the prediction accuracy. The higher the AUC value, the larger the area under the curve, indicating higher prediction accuracy. The closer the curve is to the upper left corner (the smaller the X, the larger the Y), the higher the prediction accuracy. The area under the ROC curve, AUC, is normally between 0.5 and 1. In the case of AUC>0.5, the closer the AUC is to 1, the better the diagnostic effect. Note: From Figure 9, it can be concluded that both the training set and the validation set are 60 months, that is, the area under the ROC curve in the 5-year period is the largest, and the AUC value is the highest, which is consistent with the results of the survival analysis and conforms to the above conjecture
Discussion
The morbidity and mortality of CRC remain high despite advances in surgical and medical treatment of CRC [37]. Successful screening techniques and reducing the risk of CRC are critical to helping reduce CRC mortality. Understanding the etiology and mechanisms of colorectal cancer progression is extremely important for improving the survival rate of colorectal cancer patients. Recently, the rapidly developing microarray technology has been widely used to compare the expression levels of genes and has been used to predict disease progression to make an accurate assessment of prognosis [38].
In this study, two microarray datasets (GSE20916, GSE33133) were analyzed to identify DEGs in CRC tissue samples. A total of 5267 and 4233 DEGs were identified in the two datasets. GSE20916 included 2847 up-regulated genes and 2420 down-regulated genes. GSE33133 identified a total of 4233 differential genes, including 2104 up-regulated genes. The intersection of up-regulated genes in the two datasets was obtained by Venn analysis as 1058 DEGs. Subsequently, GO enrichment analysis and pathway analysis were performed. Among the 1058 genes, 992 genes with survival and clinical information in TCGA were screened. Then, survival analysis was performed based on Cox regression and LASSO regression analysis models from 992 genes, and a prognostic risk model was obtained. Eleven DEGs were identified as potential prognostic markers. The results of the model show that the time period with the most obvious prognostic effect is 5 years, and the AUC value is the highest. The verification results of the ROC curve are consistent with the model results of the survival analysis. The survival curve showed that LRRC8A, PCAT6, PLA2G15, SRD5A1, T1GD1 may be oncogenes, and DSN1, ERI1, EIT1, GLMN, MAPKAPK, and NOP14 may be tumor suppressor genes. Among them, PLA2G15 and NOP14 have the most significant effect. It can be speculated that DSN1, ERI1, EIT1, GLMN, MAPKAPK, and NOP14 are effective in inhibiting the further development and lethality of CRC, and the most obvious period is 5 years.
NOP14 encodes nucleolar protein, an 875 amino group protein that is highly conserved in eukaryotes and is involved in many biological processes such as DNA repair and replication and cell cycle control. Recent studies support the involvement of NOP14 in cancer initiation and progression. NOP14 expression has been reported in various cancers such as melanoma and breast cancer, bladder cancer and pancreatic cancer [39–41], for example, NOP14 inhibits the Wnt/β-catenin signaling pathway, thereby reducing the proliferation and metastasis of melanoma and breast cancer, thus having a tumor suppressor role. Likewise, in bladder cancer, NOP14 attenuated miR-502-5p-mediated inhibition of tumor cell migration and proliferation. Nonetheless, the role of NOP14 depends on the specific type of cancer. In pancreatic cancer, NOP14 is highly expressed and has been shown to promote tumor cell growth and invasion by stabilizing mutant P53, which inhibits P21 expression by inducing miR-17-5p. Apart from that, as a recent analysis reports, increased expression of NOP14 is associated with improved prognosis in CRC [42]. This suggests that it inhibits tumor development in CRC, consistent with the findings of this study. Another study found that the mRNA and protein levels of NOP14 were significantly upregulated in CRC tissues, which suggested that NOP14 could serve as a potential biomarker for CRC. Moreover, its high expression improves the prognosis of CRC patients by inhibiting signaling pathways involved in tumor growth and promoting the immune response [43].
DSN1 is a protein-coding gene that is part of the MIS12 kinetochore complex and is required for proper kinetochore assembly and cell cycle progression [44]. It is critical for malignant transformation associated with chromosome 20q amplification in CRA (colorectal adenomas). Elevated DSN1 expression was positively correlated with chr20 amplification, a high CIN index, and SKA3 overexpression while DSN1 knockdown resulted in slightly increased G2/M phase arrest but did not affect cell growth rate or apoptosis in both CRC cell lines [45]. These results suggest that overexpression of DSN1 contributes to the development of colorectal cancer. In addition, a recent study reported that overexpression of DSN1 is associated with poor survival in patients with colorectal cancer, gastric cancer, liver cancer, and breast cancer, and can be used as a prognostic biomarker for various tumor diseases [46–48].
Lysosomal phospholipase A2 (PLA2G15) is a transacylase that recognizes short-chain ceramides as fatty acyl receptors; it is 50% identical to lecithin cholesterol acyltransferase; these enzymes share close structural homology [49]. Besides, PLA2G15 has broad substrate recognition capacity for a variety of glycerophospholipids, including oxidized phospholipids, it catabolizes pulmonary surfactant and processes lipid antigens for CD1 protein presentation [50]. Moreover, PLA2G15 is a ubiquitous enzyme that is uniquely characterized by its subcellular localization to lysosomes and late endosomes and it is the first and only lysosomal phospholipase A identified to date [51]. Although initially characterized as a member of the PLA2 family, recent work has supported its unique properties as transacylases, clearly demonstrating PLA1 and PLA2 activities. Additionally, according to a recent study, knockdown of NFATC3-PLA2G15 reduces the expression of markers of epithelial-mesenchymal transition (EMT) such as vimentin, twist, and fibronectin in colo-320 cells when studying CRC samples and adjacent normal tissue, mRNA expression, and increased mesenchymal-epithelial transition markers of E-cadherin, claudin-1, and FOXC2. Similarly, the NFATC3–PLA2G15 FT-containing line, NFATC3-PLA2G15 knockdown also inhibited invasion, colony formation capacity, and cell proliferation [52], and NFATC3-PLA2G15 fusion transcript levels were elevated in 19 pairs of CRC tumor and adjacent normal tissue samples [53]. This evidence suggests that NFATC3-PLA2G15 may promote CRC development by enhancing EMT invasion and proliferation, consistent with the results of this study indicating that PLA2G15 might be a considerable prognostic biomarker of CRC.
The results of this study may have clinical implications for the prognosis of CRC. However, the current study has certain limitations. First of all, the AUC value obtained by the survival analysis is not particularly large, between 0.5 and 07, and the effect is not particularly significant. Second, among the 11 DEGs screened, the potential roles of some genes are still unknown, and further experimental studies are needed.
In conclusion, 11 DEGs were identified as significantly associated with OS in CRC patients by performing the above-mentioned analysis of GEO and TCGA. These 11 genes can be used as new independent prognostic biomarkers, among which the most significant ones are NOP14 and PLA2G15, which can be used to predict the clinical outcome of CRC patients. However, further analysis of the role and underlying mechanisms of gene expression in CRC is required to establish its specific role in CRC prognosis.