Introduction
Inflammatory bowel disease (IBD) is a chronic inflammatory condition, including Crohn’s disease (CD), ulcerative colitis (UC) and IBD-unclassified (IBD-U). The prevalence of IBD varies geographically, but the incidence of IBD is increasing worldwide [1]. There are many suggestions regarding the etiology of IBD, such as the genetic and environmental factors or impaired intestinal microbiota, but the exact pathogenesis of the disease is still unknown [2]. Diagnosis of IBD is made based on comprehensive investigations including laboratory, radiological, endoscopic, and histological tests. Among non-invasive tests, serum markers of inflammation and acute phase proteins such as white blood cells (WBC), platelet count (PLT), erythrocyte sedimentation rate (ESR), C-reactive protein (CRP), ferritin, albumin, and fecal calprotectin (fCal) are used to diagnose as well as to monitor patients with IBD.
In animal studies, the role of the gastrointestinal microbiota as an environmental factor was noted. It was observed that germ-free mice did not develop colitis, which may indicate the involvement of the microbiome in the development of colitis [3]. Dysbiosis, a microbial imbalance, has been linked to IBD, but there is no clear evidence whether it is a cause or a consequence of the development of disease [4]. The intestinal microbiota, through the synthesis and secretion of the complex pro-inflammatory polysaccharide glucomannan and the induction of tumor necrosis factor α (TNF-α) secretion by dendritic cells, may play an important role in the pathogenesis of CD [5]. Despite the demonstration of changes in the intestinal microbiota, it is worth noting that the diagnostic and therapeutic management of patients with IBD has not changed [6–12]. However, long-term population studies are necessary to assess whether the composition of the intestinal microbiome in people with IBD is a cause or a consequence of the development of the disease.
In recent years, metabolomic analysis of biological samples from IBD patients has been used to find markers of these diseases or to understand their pathomechanisms [13–16]. Differences in metabolite levels in urine and fecal samples of IBD patients were observed. Despite the few studies suggesting a link between the microbiome and metabolome based on stool analysis, it is still unclear whether metabolites produced by the host can interact to cause changes in the gut microbiota, or whether the microbiota in turn is responsible for changes in host metabolites [16–21]. We have already shown that there are metabolites that differentiate serum from CD and UC patients [15, 22]. To the best of our knowledge, there are no studies evaluating the relationship between microbiota composition and serum metabolites, the source of which seems to be human and bacterial processes [23] with different types of IBD. Therefore, the purpose of this study was to assess whether the gut microbiome and serum metabolic profile are in accordance with a diagnosis of CD or UC in children with newly diagnosed disease.
Material and methods
Patients
The study was conducted in accordance with the ethical standards of the Declaration of Helsinki on human experimentation. The study was conducted with approval from the Ethics Committee of our institute (approval number: R-I-002/294/2018). The aim of the study was explained to the parents of the subjects, and a written informed consent form was signed prior to enrollment.
We prospectively selected 18 treatment-naive patients with newly diagnosed IBD based on ESPGHAN guidelines [24]. All subjects were admitted to our department. Disease activity was estimated according to the Pediatric Crohn’s Disease Activity Index (PCDAI) and the Pediatric Ulcerative Colitis Activity Index (PUCAI). Exclusion criteria were systemic use of antibiotics, probiotics or steroids in the last 6 months prior to diagnosis. Due to the influence of diet, patients on an extensive diet were excluded from the study [25]. We also recruited 10 healthy controls with normal levels of fCal, a marker of intestinal inflammation.
Serum analysis
Blood samples were collected after a 12-h fast, followed by immediate centrifugation and freezing at –80°C for further analysis. Routine biochemical analyses (erythrocyte sedimentation rate (ESR), C-reactive protein (CRP), complete blood count, ferritin, albumin) were performed using standard methods in a local diagnostic laboratory. The levels of serum CRP, ferritin, and albumin were determined by immunoturbidimetry (Roche, Hitachinaka, Japan). The erythrocyte sedimentation rate was evaluated according to the Westergren method. The complete blood count was measured using an automated hematology analyzer (Sysmex, Kobe, Japan). Serum metabolomics measurements and data analysis were performed as described previously [15].
Fecal analysis
Fecal samples were collected in a container with stool DNA stabilizer, at the time of the IBD diagnosis and before administration of any drugs. Samples were immediately frozen at –80°C and remained in the freezer until DNA extraction. DNA extraction was performed using a QIAamp DNA Stool Mini Kit (QIAGEN) according to the manufacturer’s instructions. The hypervariable V3-V4 regions of the 16S rRNA gene were amplified using polymerase chain reaction (PCR) with universal bacterial primer sets (341F and 785R). The PCR reaction was performed using Q5 Hotstart High-Fidelity DNA Polymerase (NEBNext) according to the manufacturer’s instructions. Sequencing was performed on a Miseq sequencer using paired-end technology with the Miseq Reagent Kit v2 (Illumina). Identification of microorganisms to the genus level was conducted based on the Greengenes v13_5 registration sequence database, excluding the possibility of creating operational taxonomic units (OTUs) de novo.
The concentration of fCal was determined by an enzyme-linked immunosorbent assay kit (IDK Calprotectin, Immundiagnostik, Bensheim, Germany) according to the manufacturer’s instructions.
Statistical analysis
Descriptive data were analyzed using the Statistica 13.3 package software. The comparison of IBD with the control group was evaluated with the non-parametric Mann-Whitney U-test. The Shapiro-Wilk test was used to assess the normality of the data. A p-value less than 0.05 was considered statistically significant.
Principal component analysis (PCA) was used to evaluate metabolomics data quality by checking the location of the quality control samples. A multivariate statistical analysis based on OPLS-DA models was conducted to identify the metabolites and bacteria discriminating compared groups. The contribution of each metabolite to the observed sample discrimination was assessed based on volcano plots obtained by plotting variable importance in the projection (VIP) against loading values scaled as correlation coefficient values [p(corr)] generated based on the obtained OPLS-DA models. Variables with VIP > 1.0 and absolute p(corr) > 0.4 were considered significant. The analyses were performed using SIMCA−P + 13.0.3.0 (Umetrics, Umea, Sweden). OPLS-DA models were validated by cross-validation using the leave 1/3 out approach, as described previously [25].
Results
Comparison of microbiome of patients with IBD to healthy controls
In total, 18 patients with IBD (9 with UC and 9 with CD) and 10 healthy controls were enrolled in the study. There was no IBD-U patient in the study group. There were no significant differences regarding age and sex between the study and control groups (Table I). As expected, the IBD group had higher ESR, CRP, white blood count (WBC), platelet count (PLT), fecal calprotectin (fCal), and lower albumin levels.
Table I
Comparative characteristics of IBD patients and controls
[i] IBD – inflammatory bowel disease, UC – ulcerative colitis, CD – Crohn disease, ESR – erythrocyte sedimentation rate, CRP – C-reactive protein, WBC – white blood count, PLT – platelet count, fCal – fecal calprotectin, PCDAI – Pediatric Crohn’s Disease Activity Index, PUCAI – Pediatric Ulcerative Colitis Activity Index, NS – not significant, NA – not applicable.
We identified the bacteria at different taxonomic levels: 6466 species-specific, 1086 genus-specific, 321 family-specific, 148 order-specific and 107 bacteria at higher taxonomic levels (phyla and class). We found significant differences in the presence of representatives of 25 families, 52 genera and 79 species of bacteria between patients from IBD and control groups. Significantly more genetic material was found in 12 bacterial species in the IBD group, and 50 species in the healthy controls (Supplementary Table SI). Moreover, 5 species of bacteria were detected only in children with IBD (Bacteroides clarus, Haemophilus quentini, Sporolactobacillus putidus, Pasteurella pneumotropica, Prevotella oris), and 13 only in controls (Actinomyces canis, Clostridium aldrichii, Devosia geojensis, Eubacterium cylindroides, Geobacter toluenoxydans, Lactobacillus ruminis, Leuconostoc argentinum, Leuconostoc garlicum, Methanobrevibacter woesei, Pasteuria nishizawae, Propionicimonas paludicola, Sanguibacter suarezii, Streptococcus parauberis).
Comparison of IBD patients by composition of the gut microbiome
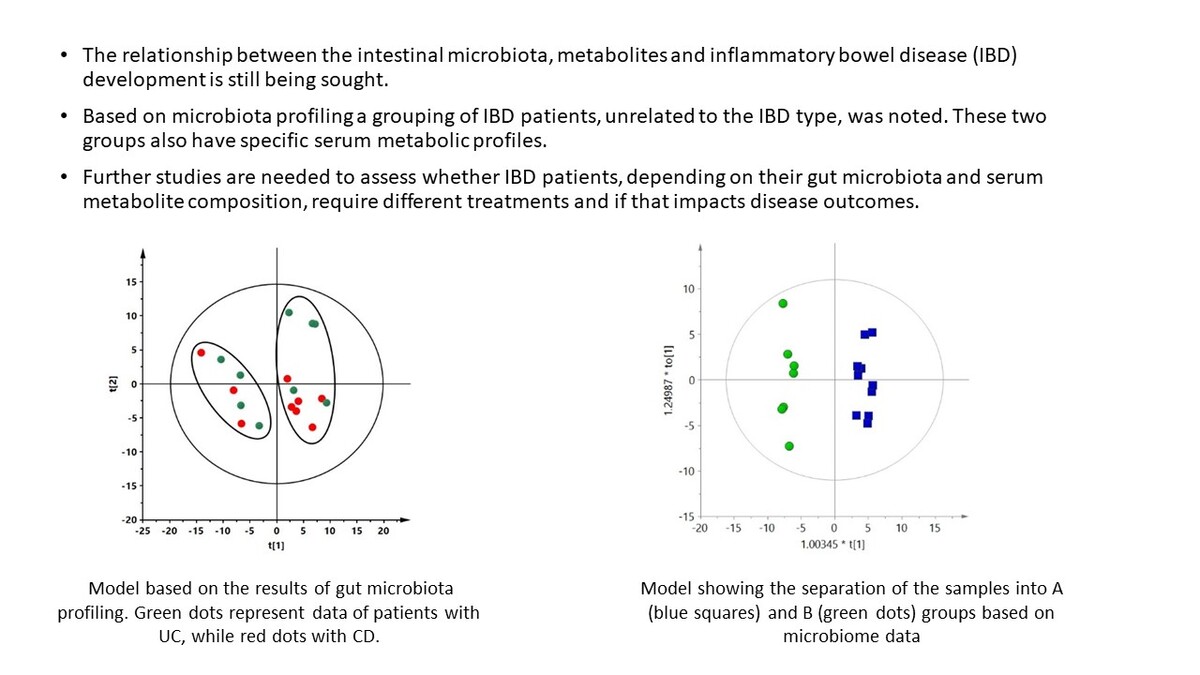
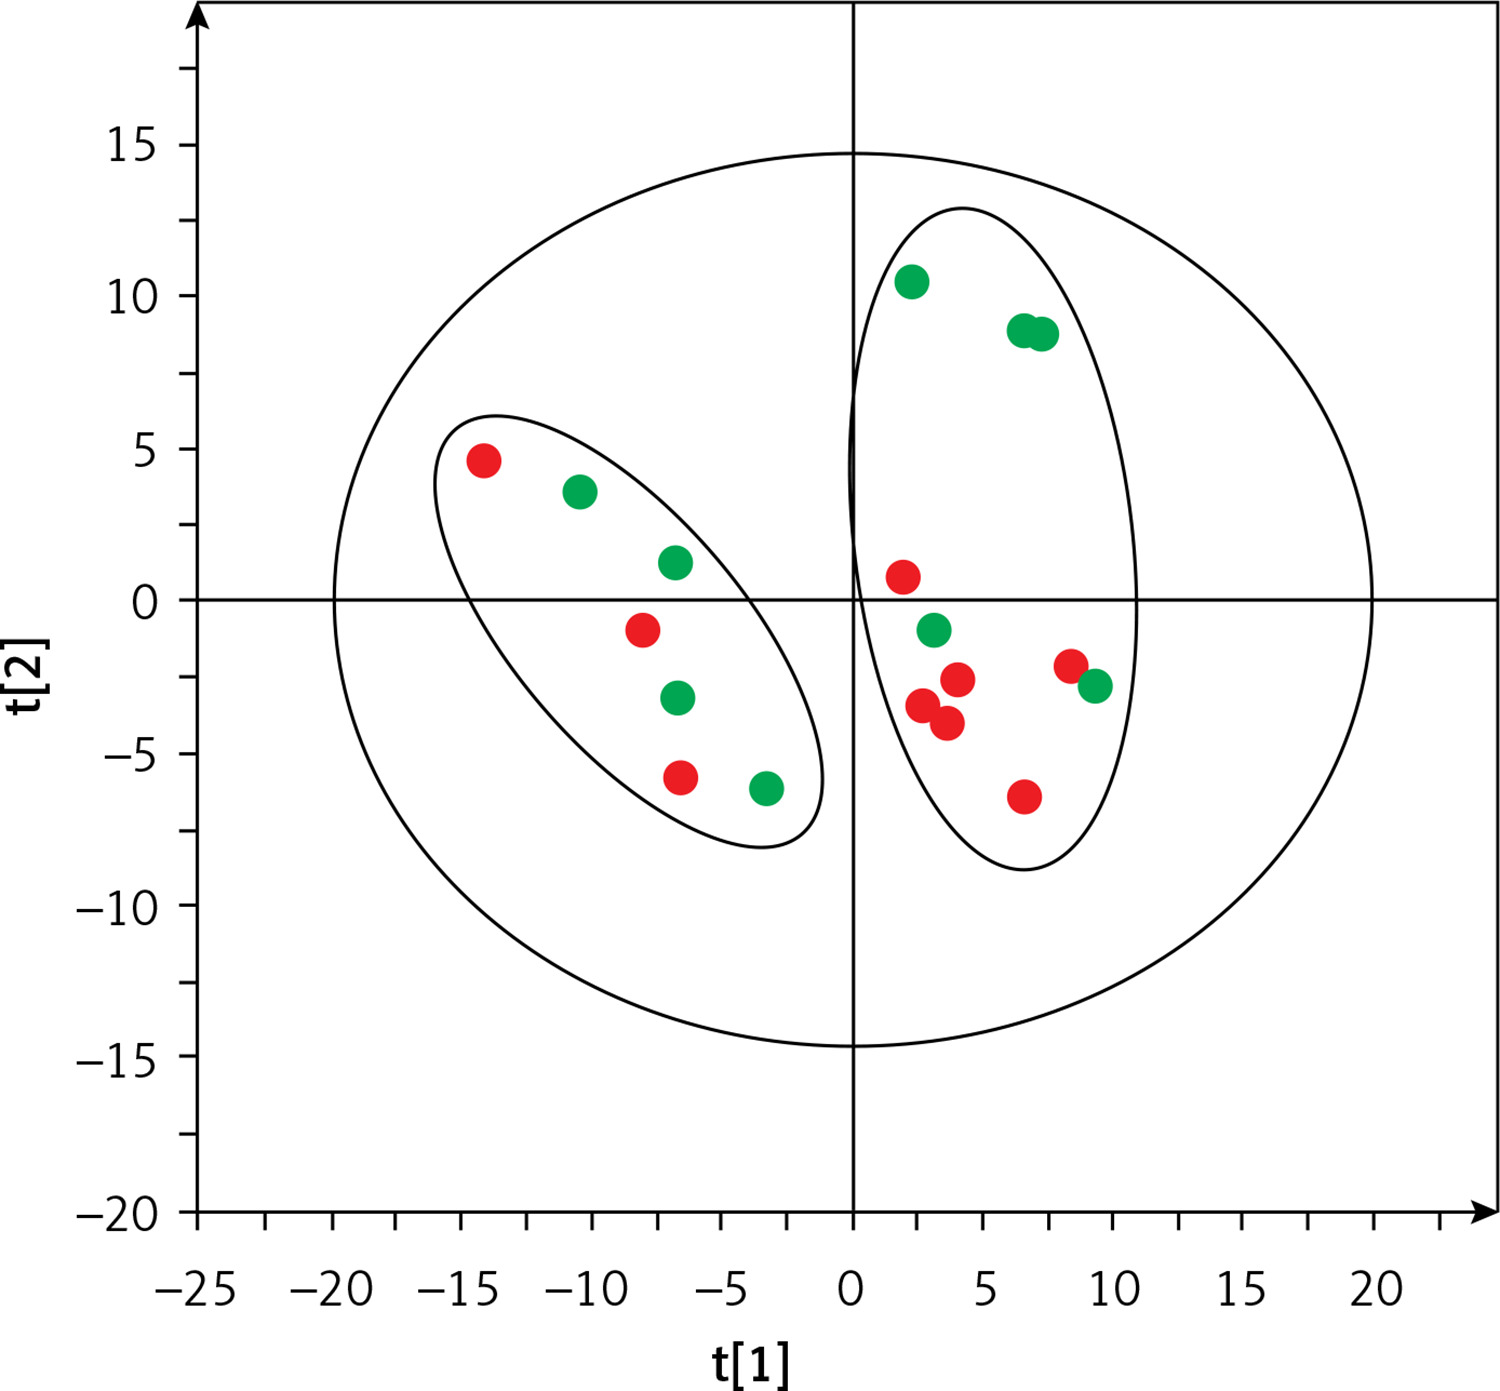
Only patients with IBD were included in the next stage of analysis. Statistical analysis was based on bacterial species present in at least 50% of all IBD samples (n = 295 species). Based on these data, it was not possible to build a supervised multivariate model with acceptable parameters (Q2 of the obtained model was negative, data not shown) that could discriminate CD and UC groups. However, in the unsupervised PCA model, we observed a spontaneous separation of IBD patients by the first component into two groups, independently of IBD type (Figure 1). The PCA plot of the data obtained for the study and control groups is presented in the supplementary materials (Supplementary Figure S1).
Figure 1
PCA model based on the results of gut microbiota profiling. R2 = 0.472, Q2 = 0.16. Green dots represent data of patients with UC, while red dots represent data of patients with CD. Two groups separated by the first component are marked with ovals
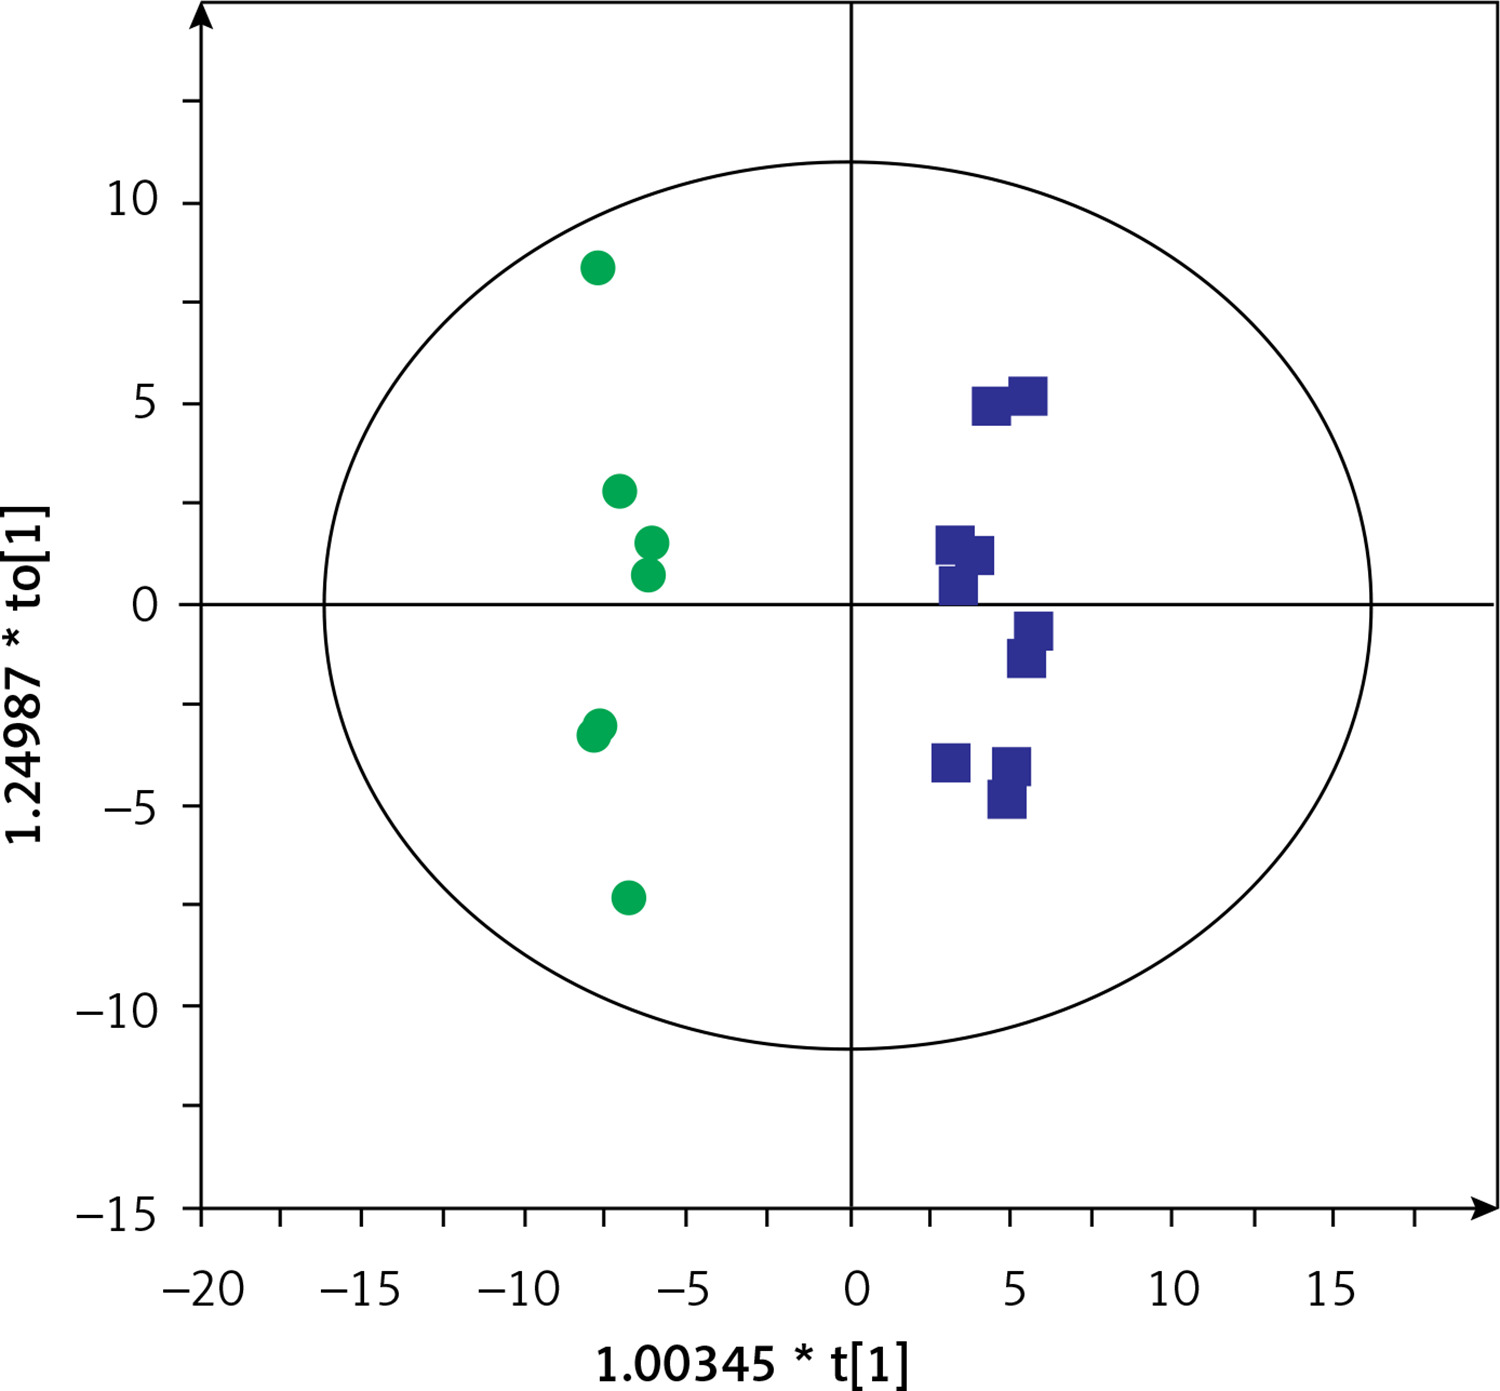
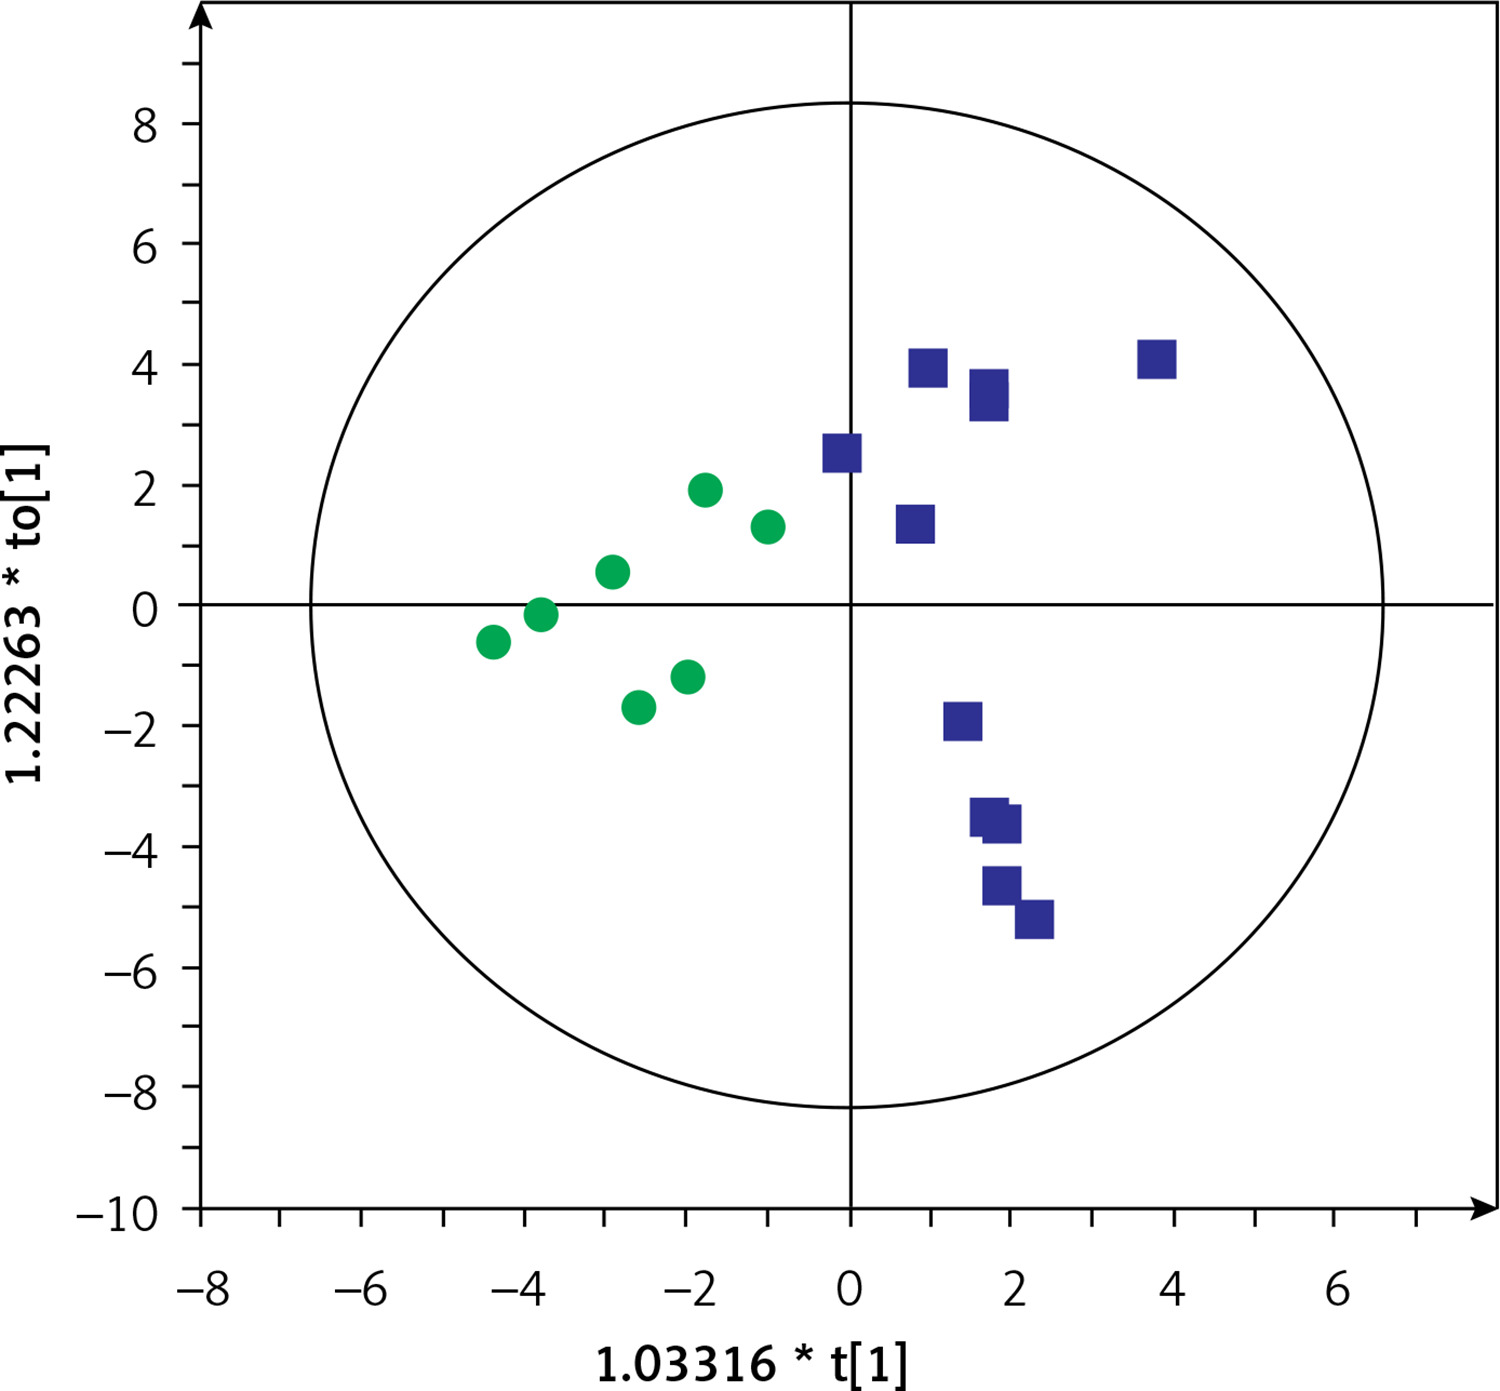
Based on this spontaneous grouping (assigned as groups A and B), additional filtering of data was performed to eliminate species of bacteria that were present in less than 80% of the samples from groups A and B. Using the obtained data set (210 species of bacteria), we created a supervised orthogonal partial least squares discriminant analysis (OPLS-DA) model (Figure 2), observing a clear separation of samples into groups A and B with excellent model parameters (R2 = 0.978, Q2 = 0.798). As a result of cross-validation using the leave 1/3 out approach, 100% of samples were correctly classified.
Figure 2
OPLS-DA model showing the separation of the samples into A (blue squares) and B (green dots) groups based on microbiome data
Group A included microbial data of stool samples collected from 6 children with CD and 5 with UC, while group B included data of samples from 3 children with CD and 4 with UC. Demographic and clinical characteristics of the patients are shown in Supplementary Table SII. There were no differences in laboratory results or disease activity assessed by the PCDAI and PUCAI indices. We found 72 species of bacteria that were significantly different between groups A and B (33 more frequent in group A and 39 more frequent in group B; data not shown). The microbiota was dominated by the genera Bacteroides (21 species), Streptococcus (9 species) and Bifidobacterium (7 species) (data not shown). The 20 species with the highest discriminative values (according to VIP and p(corr)) are shown in Table II.
Table II
Bacterial species significantly discriminating groups A and B of IBD patients
Then, serum metabolic profiles of patients divided into groups A and B were also compared. It was found that these groups can also be discriminated based on the serum metabolic profiles. Figures 3 and 4 show a separation of samples based on serum metabolomics data collected in positive and negative ion modes, respectively. Validation of these models by cross-validation using the leave 1/3 out approach showed correct classification of 85 ±14% and 87 ±17% of the samples based on the positive and negative ion mode data, respectively. Table III presents significant and identified metabolites discriminating groups A and B.
Table III
Identified serum metabolites that significantly discriminate groups A and B
| Metabolite | Group B vs. Group A | ||
|---|---|---|---|
| Change [%]* | VIP | P(corr) | |
| PC 14:0/18:2 | –37 | 1.25 | –0.51 |
| PC 16:0/20:4 | –41 | 1.31 | –0.73 |
| PC 16:0/20:4(OH) | –47 | 2.01 | –0.53 |
| PC 18:2/18:2(OH) | –52 | 1.75 | –0.64 |
| PC 16:0/22:6(OH) | –51 | 1.65 | –0.56 |
| LPE 18:2 | –39 | 1.15 | –0.62 |
| LPC 18:2 | –32 | 1.04 | –0.63 |
| SM 36:3 | +57 | 1.38 | 0.61 |
| Hexadecasphinganine | –36 | 1.07 | –0.52 |
| Linoleamide | –53 | 2.01 | –0.77 |
| P-cresol | +104 | 2.30 | 0.71 |
| P-cresol sulfate | +100 | 2.35 | 0.71 |
* A positive value means that metabolite abundance was higher, whereas a negative value indicates that the abundance was lower in the group B vs. group A comparison. SM – sphingomyelin, PC – phosphatidylcholine, LPC – lysophosphatidylcholine, LPE – lysophosphatidylethanolamine, VIP – variable influence on projection, p(corr) – predictive loading value.
Figure 3
OPLS-DA model showing the separation of the samples into groups A (blue squares) and B (green dots) based on the LC-MS-metabolomics positive ion mode data, R2 = 0.97, Q2 = 0.529
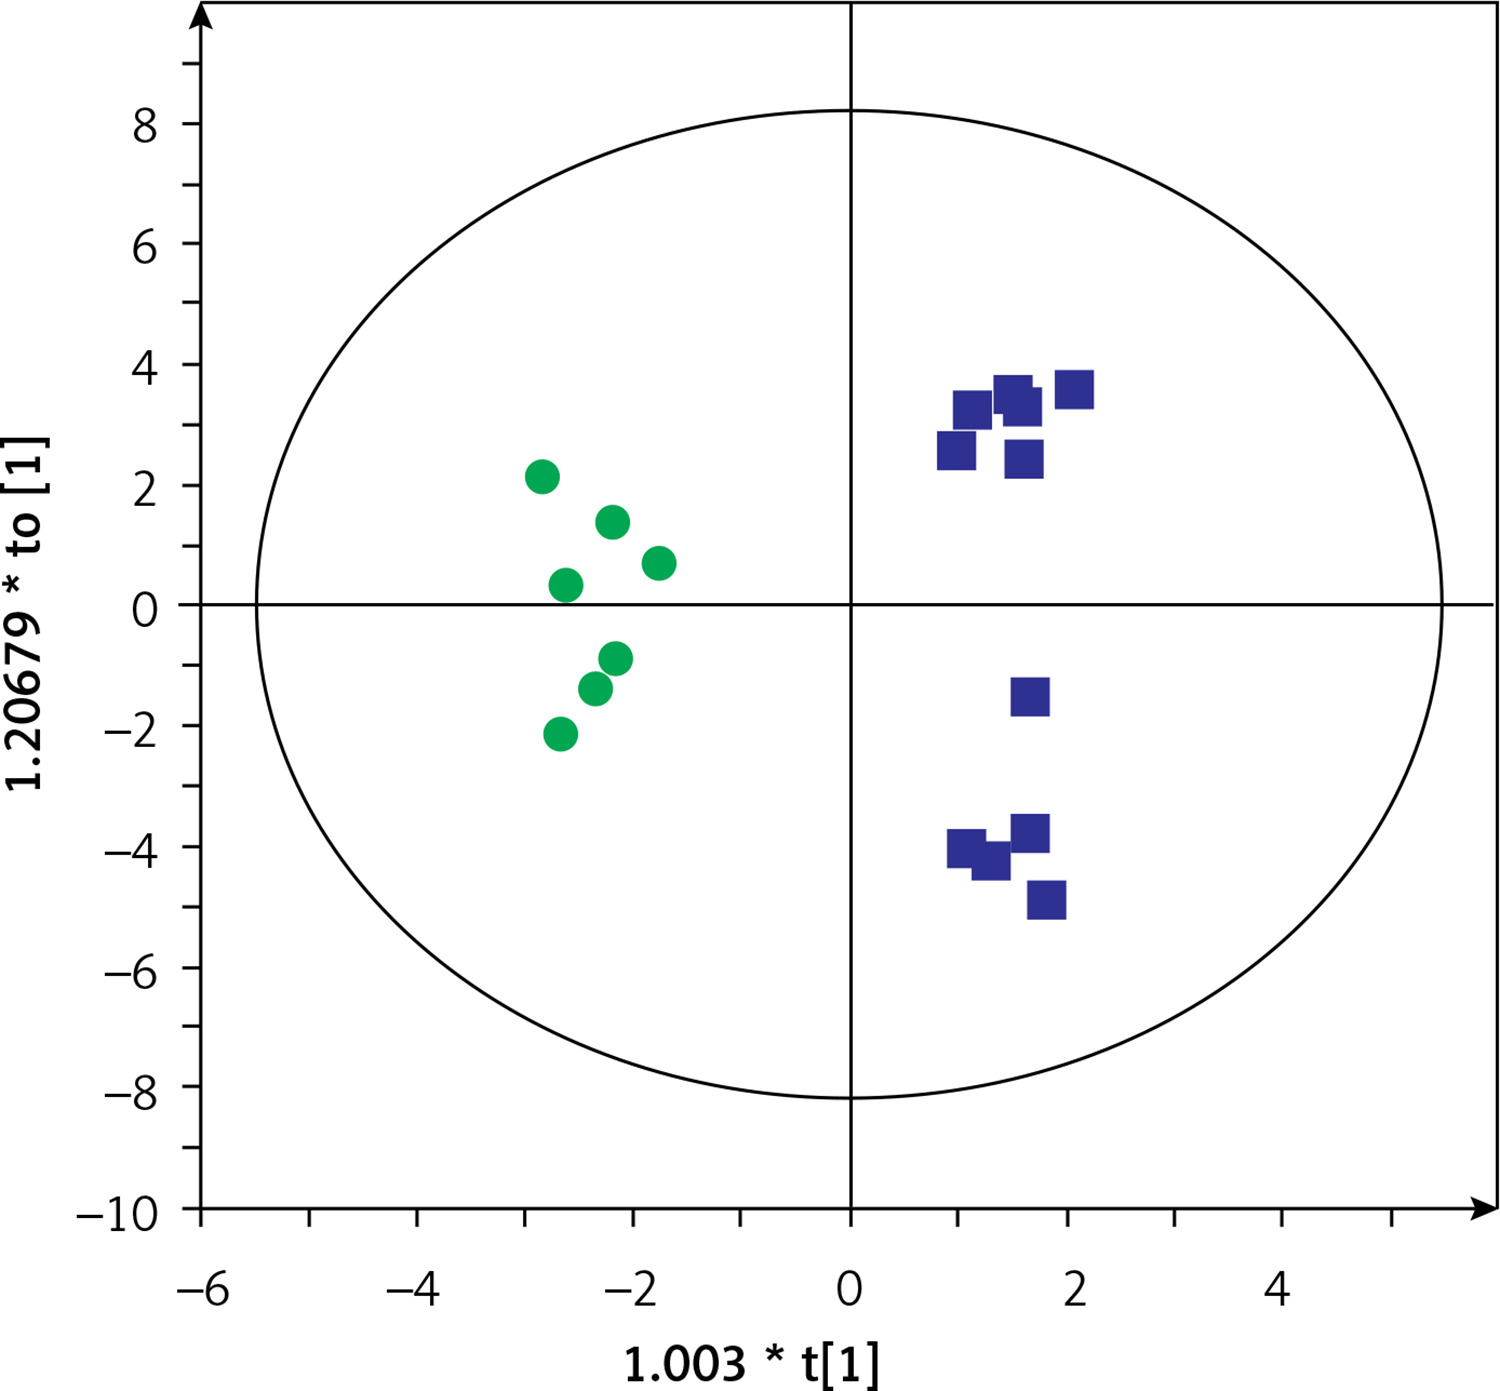
Figure 4
OPLS-DA model showing the separation of the samples into groups A (blue squares) and B (green dots) based on the LC-MS-metabolomics negative ion mode data, R2 = 0.817, Q2 = 0.575
Most of the annotated metabolites were up-regulated in group A compared to group B. Phosphatidylcholines (PCs: 14:0/18:2, 16:0/20:4, 16:0/20:4(OH), 18:2/18:2(OH), 16:0/22:6(OH)), lysophosphatidylethanolamine (LPE 18:2), lysophosphatidylcholine (LPC 18:2), hexadecasphinganine, and linoleamide levels were significantly higher in patients from group A than group B. In contrast, levels of sphingomyelin (SM 36:3), p-cresol and p-cresol sulfate were higher in group B than group A. The largest differences in values between individual metabolites concerned cresol and p-cresol (104% and 100%, respectively) (Table III).
Discussion
It is well known that the microbiome of IBD patients differs from that of healthy people [2, 26–28], which was also noted in our study. However, when we attempted to discriminate between CD and UC patients based on the gut microbiota profiles, we could not get an adequate discrimination model. This observation is consistent with the results obtained by Andoh et al., who observed no significant differences between microbiota profiles of CD and UC patients with active disease [29]. However, surprisingly, we observed a spontaneous separation of patients into two groups based on the intestinal microbiome, independently of IBD type (Figure 1). Both groups included children with UC and CD, and statistical analysis showed no significant differences in the demographics and laboratory data of these two groups. Moreover, these two cohorts of patients also had distinct serum metabolic profiles (Figures 3 and 4). To the best of our knowledge, this study is the first to show a different subdivision of children with IBD based on microbiota and metabolome profiling unrelated to the classic IBD type. We noted 20 species of bacteria (Table II) discriminating these groups, and, moreover, when we compared serum metabolic profiles of these novel subgroups, 12 metabolites (Table III) were found to be significantly different. Among adult IBD patients, no such studies have been conducted either. Patients with IBD are a heterogeneous group, and the dividing line between UC and CD is not as clear as it seems. Particularly difficult to diagnose are children with IBD-U, in whom the composition of the gut microbiome could help predict what type of IBD the patient will develop in the future. We found that both the microbiome and metabolic profile are specific to certain groups of patients despite a classic diagnosis of CD or UC. Our results showed for the first time some similarities in the metabolome and microbiome of some UC and CD patients. Such a relationship should be confirmed in a larger group of patients. Nevertheless, this discovery is perhaps the first step in clarifying the etiology of these diseases. Further studies are needed in this field.
In our study, 12 metabolites were significantly different between groups A and B of children divided based on microbiome composition. The greatest differences were observed in the levels of p-cresol and p-cresol sulfate. Recently, it has been reported that p-cresol is involved in cytotoxicity, genotoxicity and increased intestinal permeability. P-cresol is produced by Bacteroides spp. [30], which may explain the increased detection of this metabolite and bacterial genus in one of the groups (group B) in our study. P-cresol is produced by microbial degradation of tyrosine and then metabolized in the liver to p-cresol sulfate [31]. Yu et al. observed higher concentrations of p-cresol glucuronide in the urine of rats with IBD compared to controls [32]. In addition, products of putrefaction, such as p-cresol, have been observed to play a role in the pathogenesis of colorectal cancer (CRC). IBD is a risk factor for CRC, especially in patients with long-term disease. Various mechanisms of oncogenesis, such as genetic, epigenetic and chronic intestinal inflammation, are under consideration [33]. Considering the results of our study, it may be possible to select a group of patients with an increased risk of developing CRC. More studies are needed to evaluate the effect of p-cresol on the incidence of CRC in IBD patients.
Among other metabolites, our results revealed significantly higher detection of SM 36:3 in one of the patient groups (group B). SMs undergo hydrolysis by sphingomyelinases (SMases), leading to the formation of ceramides. Based on an animal model, it was found that SMase inhibition was associated with increased susceptibility to Citrobacter rodentium infection confirmed by fecal culture. This bacterium is an intestinal pathogen causing colitis very similar to the pathology seen in patients with UC. In addition, mice lacking SMase activity showed an uncontrolled Th1 and Th17 inflammatory response accompanied by more severe colonic pathology compared to infected wild-type mice [31]. Further research is needed on the relationship between changes in SM concentrations and changes in gut microbiota and the inflammatory response in humans. Another interesting finding of our study was the significantly higher detection of LPC, PC, linoleamide, hexadecasphinganine, and LPE in the second group (group A) combined with the detection of more genetic material of Gram-positive bacteria (Streptococcus vestibularis, Actinomyces meyeri, Alkaliphilus peptidifermentans) in the stool of the same group, compared to group B. These results again suggest a link between metabolites and the microbiota. So far, trials with fecal microbiota transplantation (FMT) as a treatment option for patients with UC represent one attempt at an experimental treatment with fairly good but short-lasting results [34, 35]. Perhaps therapy should be based on modifying selected metabolites in patients, which would be associated with a beneficial change in the microbiota. Prospective studies aimed at long-term follow-up of IBD patients with an assessment of the course of the disease and response to treatment in relation to the composition of the intestinal microbiome and the metabolomic profile would be interesting.
To date, studies assessing metabolites and the gut microbiome have been performed in pediatric patient groups based on the classic division of IBD. The few studies published to date have analyzed both the microbiome and the metabolite profile in the feces of patients with IBD [23, 24, 36–39]. Jacobs et al. observed a correlation between adrenic acid and 2 unidentified metabolites with Ruminococcus gnavus, Eubacterium dolichum and Veillonella dispar, while bile acids appeared to be associated with Lachnospiraceae in children with IBD [27]. Another study found higher levels of taurine and heme in children and adolescents with IBD and Clostridium difficile infection compared to healthy children and children with IBD without C. difficile infection [37]. However, bacterial species detected in these studies differed from those found in our patient groups. Furthermore, we analyzed the metabolic profile in the patients’ serum; hence it is difficult to compare these results. Only one study simultaneously assessed the composition of the microbiome, serum and fecal metabolite levels of IBD patients. However, the aim of the study was to identify prognostic markers of response to treatment in patients with CD, and not to look for associations between individual bacteria and the profile of metabolites [39]. Due to the lack of previous reports on the differentiation of IBD patients based on the microbiome profile in combination with metabolomic analysis, it is difficult to formulate clear conclusions from the results obtained in our study. Our observations showing that IBD patients are a heterogeneous group may be a precursor to further studies on IBD patients.
Taking into account the influence of the intestinal microbiome as one of the factors in the development of IBD, attempts have been made to modify the microbiome through the use of probiotics, prebiotics, synbiotics, postbiotics, FMT, regulation of bile acids in feces, or modification of diet [40–42]. The short-term effect of using antibiotics, probiotics, synbiotics and postbiotics on modifying inflammatory markers locally in the gut as well as systemically has been demonstrated in both animal and human models. However, interventions to address the composition of the gut microbiome in children with IBD are not recommended as routine treatment. Given the results of our study, interventions in the gut microbiome in IBD should perhaps not refer to a rigid division into patients with CD or UC. Perhaps consideration should be given to selecting children with IBD (both CD and UC) in whom individualized therapy based on the gut microbiome, as well as the metabolic profile, can be applied.
The most significant finding of our study was the discovery that some IBD patients had a similar microbiome and serum metabolomic profile despite differing in their diagnosis of CD or UC. So far, published studies have only looked at differences in microbiome and metabolic profiles between CD and UC or IBD patients versus healthy individuals. The other strengths of our study are the homogeneous group of patients with defined inclusion and exclusion criteria and the consistent data and sample collection protocols. This study also has limitations that should be noted. First, the small number of participants, which is, however, comparable to other published studies, does not allow us to generalize our results, and it limits the statistical power to detect differences in microbiota. Our study was designed as an explanatory study to generate only pathophysiological theories of disease. The number of patients enrolled in the study was low due to the time span and the monocentric nature of the study. We understand that our results may be subject to errors of omission (type II error), and we did not interpret non-significant statistical results as underlying a true lack of differences. Second, we describe microbiota composition in fecal samples without simultaneously assessing the mucosa-associated microbiome, which is quite a different ecosystem. Future work to address these limitations would be useful.
In conclusion, based on microbiome profiling, some similarities in the metabolome and microbiome of some UC and CD patients, unrelated to the IBD type, were noted. IBD patients are a heterogeneous group, and the dividing line between UC and CD is not as clear as it seems to be. Despite the growing number of studies assessing the impact of gut microbiota on gastrointestinal diseases, there are still relatively few of them in children and adolescents with IBD. Our analysis is designed to help understand intestinal dysbiosis in treatment-naive IBD children. More research is needed to evaluate the effect of variability in the incidence of microbial and serum metabolomics composition and the course of IBD. Further observation of patients depending on the composition of the microbiome and metabolic profile may allow for better therapeutic results. In the future, the study of the gut microbiota in combination with the metabolic profile may be helpful in the diagnosis and treatment of patients with IBD.