Introduction
Meningioma [1–3], a prevalent intracranial tumor originating from the meninges, represents a significant clinical challenge due to its varied presentation and heterogeneous nature. It accounts for a substantial proportion of central nervous system (CNS) tumors, representing 37.6% of primary tumors within the CNS and 53.3% of benign neoplasms in this region [4]. Additionally, its incidence tends to escalate with advancing age, indicating that the likelihood of diagnosis increases as individuals grow older. The median age at diagnosis for meningioma is reported to be 66 years [4]. The common clinical manifestations of meningioma include headaches resulting from increased intracranial pressure, as well as generalized and partial seizures triggered by focal neurological deficits or local mass effects affecting the central nervous system [5]. Numerous factors can contribute to the development of meningioma, including hormonal factors [6] and head trauma [7]. Despite typically being classified as benign, certain subtypes of meningioma [8–10] exhibit aggressive behavior, which underscores the importance of prompt diagnosis and the implementation of tailored treatment strategies. While traditional diagnostic modalities, such as neuroimaging techniques, are indispensable in clinical practice, they may sometimes lack specificity and fail to capture the underlying molecular complexities that drive meningioma progression, highlighting the need for more advanced diagnostic approaches.
In recent years, there has been a growing interest in utilizing metabolomics [11, 12], a high-throughput approach for profiling small molecule metabolites in biological samples, to elucidate the intricate metabolic alterations linked to a wide array of diseases [13, 14], including cancer [15]. Metabolic profiling provides a comprehensive snapshot of cellular physiology and has the potential to reveal metabolic dysregulations that may precede obvious pathological changes, thus offering considerable promise for early detection, prognosis, and the development of targeted therapeutic interventions. Plasma metabolites refer to the diverse array of small molecules found in the blood plasma that are the products of various metabolic processes occurring within the body. These metabolites include sugars, amino acids, lipids, hormones, and other organic compounds that play essential roles in cellular metabolism and physiological functions. The profiling of plasma metabolites provides valuable insights into the metabolic status of an individual and can be used to identify metabolic dysregulations associated with diseases, such as type 2 diabetes [16], colorectal cancer [17], gut microbiome [18] and cardiometabolic health [19]. However, the relationship between the characteristic plasma metabolite profile and meningioma remains largely unknown.
Mendelian randomization (MR) [20–25], an innovative analytical method, capitalizes on genetic variants as instrumental variables (IVs) to infer causal relationships between modifiable exposures and disease outcomes. By mimicking the random allocation of alleles during meiosis, MR enables researchers to assess the potential causal effects of plasma metabolites on meningioma risk and vice versa, providing insights into the underlying biological mechanisms. In this study, we employed MR analysis aiming to elucidate the causal relationship between plasma metabolites and meningioma risk.
Material and methods
Study design
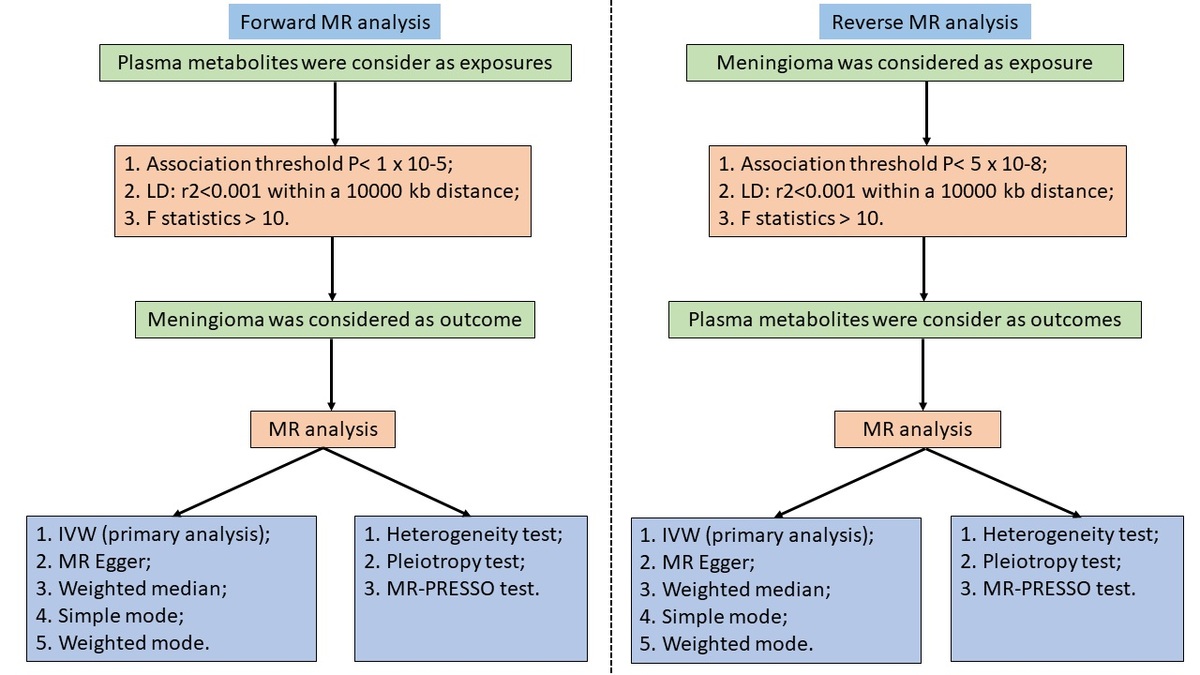
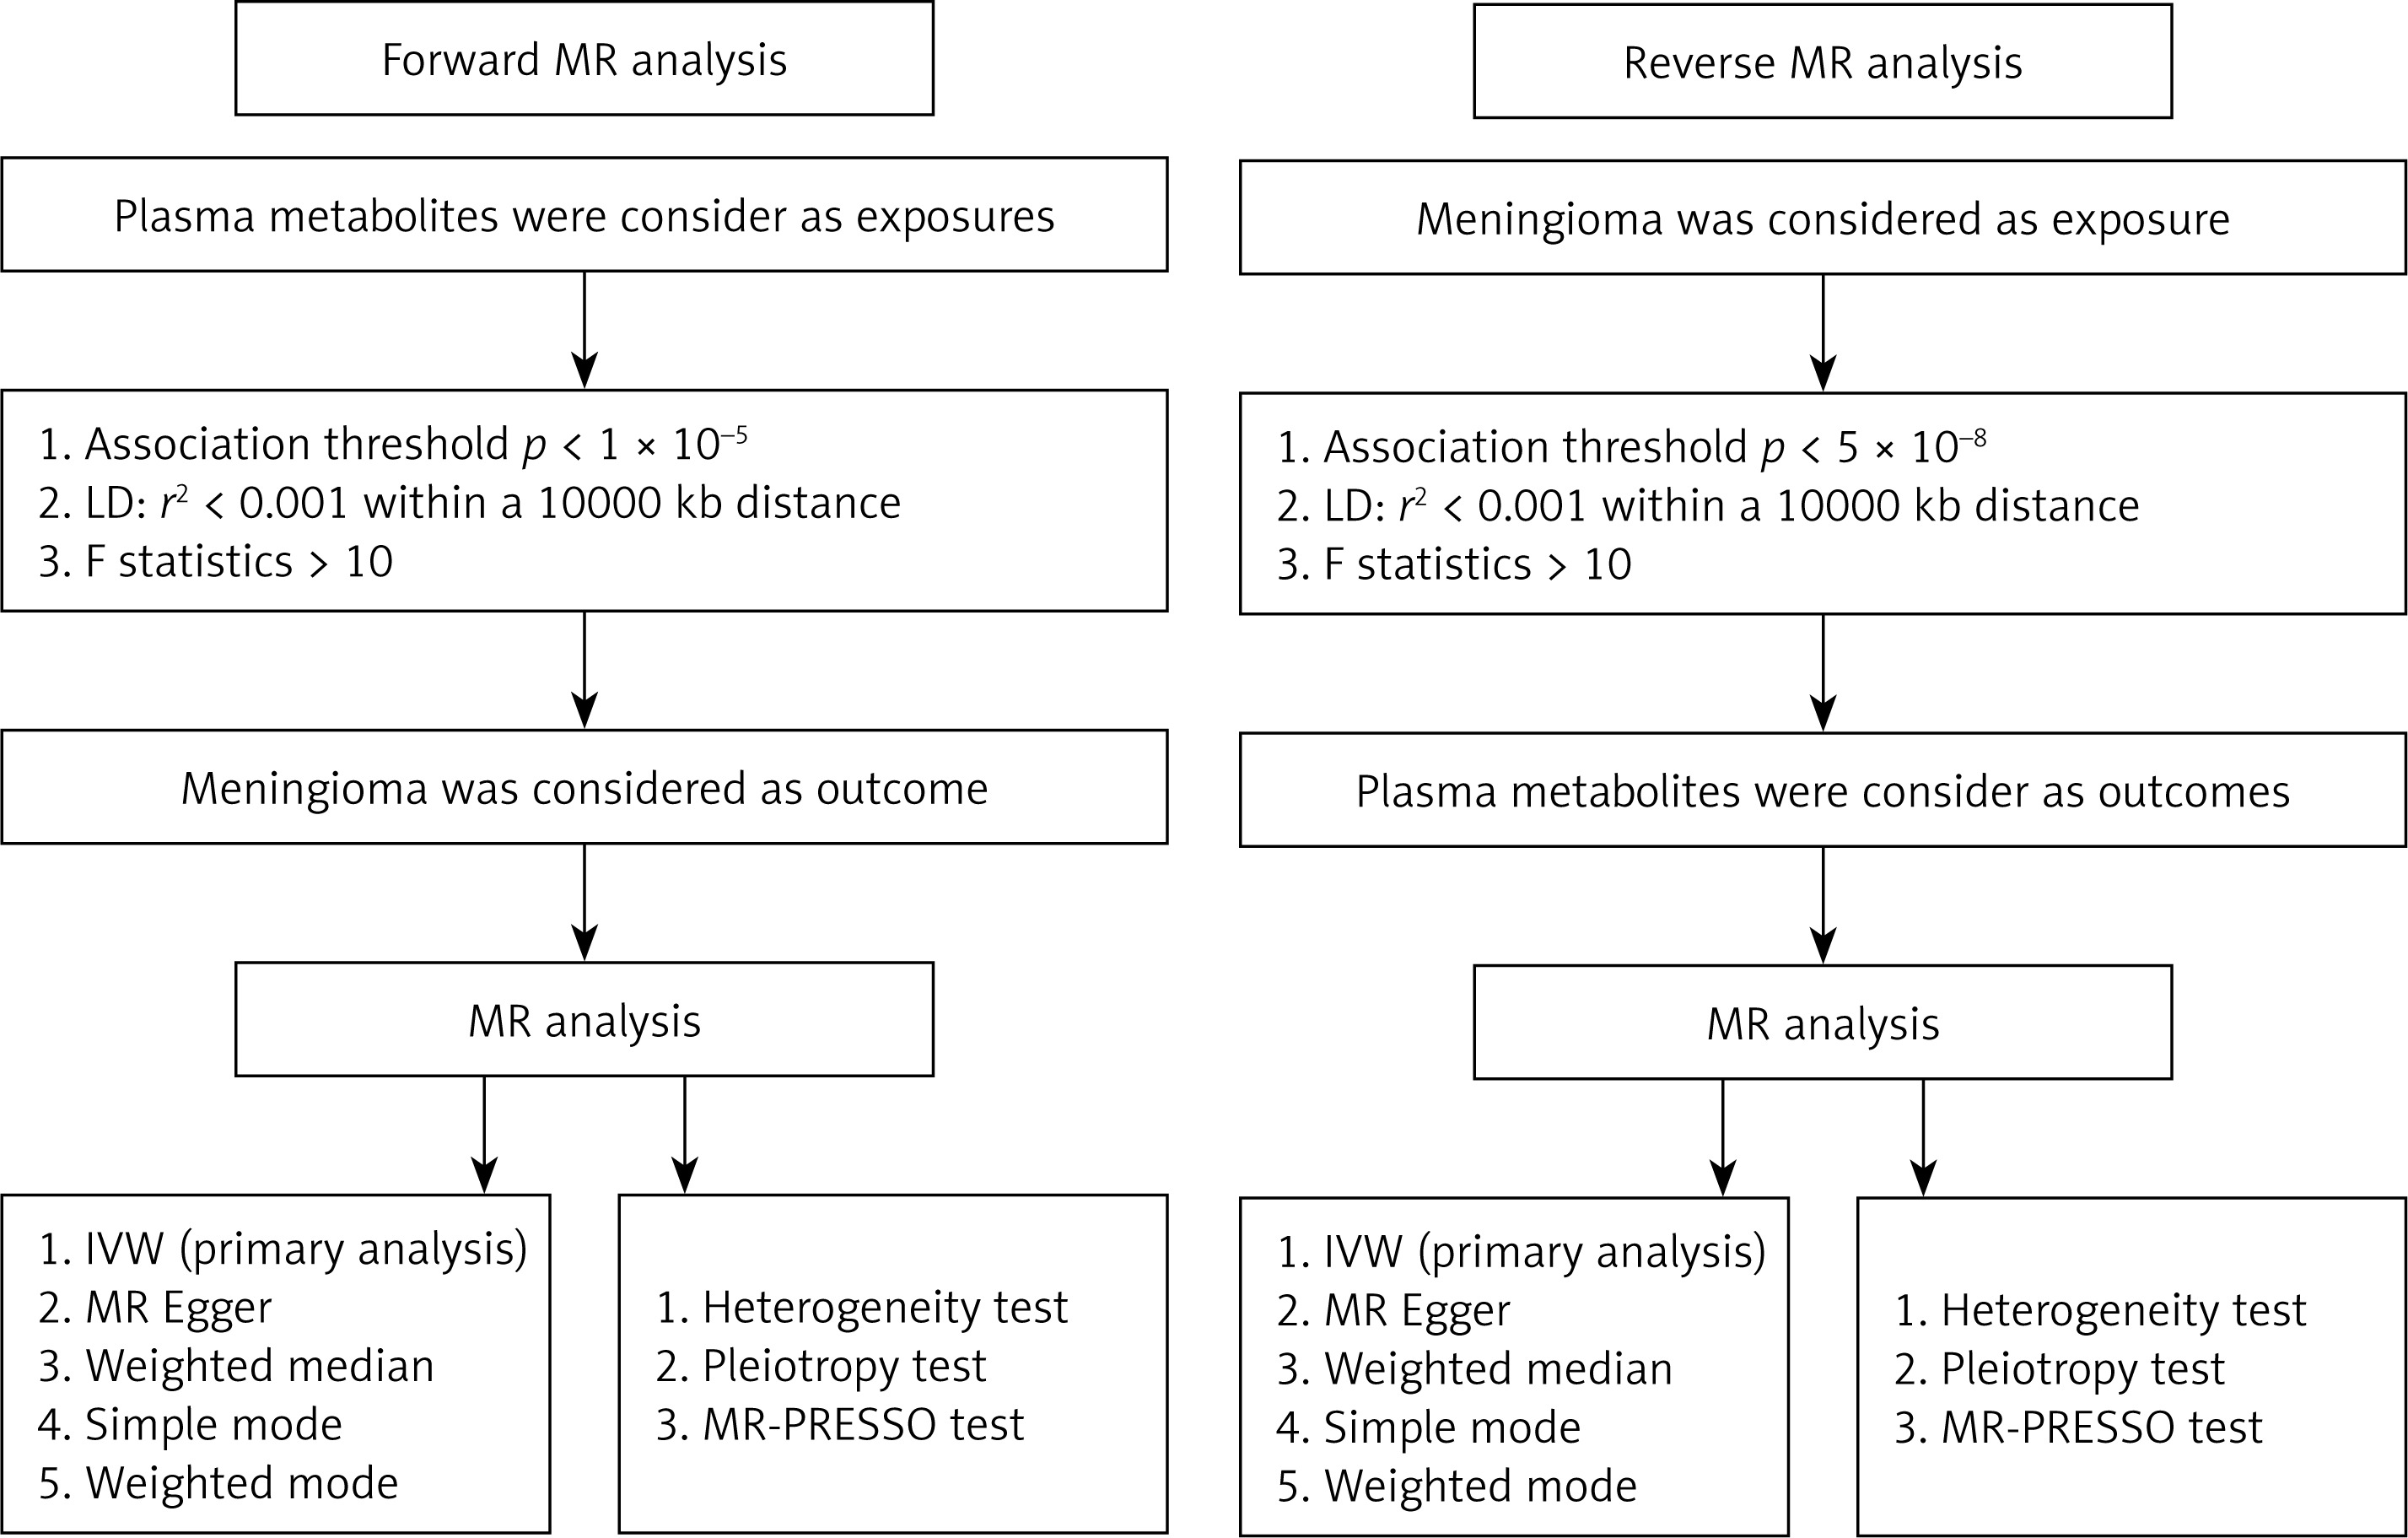
We employed a two-sample MR analysis, leveraging large-scale genome-wide association studies (GWAS), to accurately investigate the causal relationship between plasma metabolites and the risk of meningioma. Subsequently, reverse MR analysis was conducted to demonstrate the causal impact of meningioma on plasma metabolites, providing a comprehensive understanding of the bidirectional relationship between these variables. This study is built upon three foundational assumptions of MR [20, 26, 27]: (1) genetic variants, specifically IVs, display a strong association with the exposure; (2) IVs are devoid of any correlation with confounding factors; and (3) the effect of IVs on the outcome is solely mediated through the exposure, excluding involvement in alternative pathways. This study was performed according to the relevant MR guidelines, and Figure 1 provides a brief overview of the process of this bidirectional MR study.
Ethical considerations
This study used GWAS data that had been previously published. In each study, participants provided informed consent and obtained ethical approval from their respective institutional review boards. Consequently, ethical approval was deemed unnecessary, as the study exclusively used summarized data and did not contain any patient information.
GWAS data for blood metabolites
The GWAS data for plasma metabolites were obtained from the study by Chen et al. [28], which included approximately 8,000 participants of European descent. These plasma metabolite GWAS data are accessible through the GWAS catalog (https://www.ebi.ac.uk/gwas/), with accession numbers ranging from GCST90199621 to GCST90201020. This extensive dataset provides a wealth of information on the genetic associations underlying plasma metabolite profiles in individuals of European ancestry. The information regarding blood metabolites GWAS is described in Table I.
Table I
Genome-wide association studies (GWAS) data included in this Mendelian randomization study
GWAS data for meningioma
The data for the meningioma GWAS were obtained from the FinnGen database (https://www.finngen.fi/), a comprehensive repository encompassing a cohort of 314,708 participants of European descent. Among these participants, 1,316 individuals were diagnosed with meningioma, while 313,392 individuals were without meningioma. This extensive dataset offers valuable insights into the genetic factors contributing to meningioma susceptibility in individuals of European ancestry. Table I provides information regarding meningioma GWAS.
IV selection
Following the three fundamental assumptions of MR analysis, we used publicly available GWAS databases to select IVs for our study. A thorough screening process was conducted to address issues of linkage disequilibrium (LD) among genetic variants and to explore the causal relationship between plasma metabolites and meningioma. This involved employing clump window sizes of r2 = 0.001 and kb = 10 000 to mitigate LD issues. Additionally, we applied a significance threshold of p < 1 × 10⁻⁵ to filter IVs strongly associated with plasma metabolites, aiming for comprehensive coverage of relevant genetic variants. Furthermore, we examined the correlation of selected IVs with potential confounding factors. The screening process for confounding factors primarily involved searching the IEU OpenGWAS project (https://gwas.mrcieu.ac.uk/) and the GWAS catalog (https://www.ebi.ac.uk/gwas/), where single nucleotide polymorphisms (SNPs) associated with factors such as age, obesity, smoking, alcohol consumption, renal dysfunction, cardiovascular diseases, medication use, and other tumors were excluded from our study to ensure the robustness and accuracy of our analysis. In the reverse MR analysis, aimed at elucidating the causal association between meningioma and plasma metabolites, we implemented a rigorous threshold of p < 5 × 10⁻⁸ to meticulously identify IVs strongly correlated with meningioma. The other screening criteria were consistent with the criteria specified above. Following this selection process, we conducted an exploration of the causal relationship between the identified IVs associated with meningioma and plasma metabolites.
Furthermore, we calculated the F-statistic to identify and eliminate weak IVs. Those with an F-statistic below 10 were considered weak and consequently removed from the analysis. The F-statistic was calculated using the following formula [29–31]: F-statistics = R2 × (N – 2)/(1 – R2), R2 = 2 × β2 × EAF × (1 – EAF)/[2 × β2 × EAF × (1 – EAF) + 2 × SE2 × N × EAF × (1 – EAF)]. N – sample size for exposure; EAF – effect allele frequency for exposure; β – estimated effect.
Metabolic pathway analysis
We used the online platform MetaboAnalyst 6.0 (https://www.metaboanalyst.ca/) to conduct a comprehensive analysis of the metabolic pathways through which plasma metabolites may influence the occurrence of meningioma. This process predominantly incorporates the Kyoto Encyclopedia of Genes and Genomes (KEGG) pathway analysis, providing a robust framework for identifying and elucidating the specific biochemical pathways implicated in the pathogenesis of meningioma.
Statistical analysis
This study extensively investigated the causal relationships between plasma metabolites and meningioma, as well as the bidirectional causal association between meningioma and plasma metabolites. The primary method used for estimating causal effects was the inverse variance-weighted (IVW) method [29–32]. In instances of substantial heterogeneity, random-effects IVW analysis was performed, while fixed-effects IVW was employed when heterogeneity was absent. Additionally, four supplementary MR methods – MR-Egger, weighted median, simple mode, and weighted mode – were applied to conduct sensitivity analyses and assess the causal connection between plasma metabolites and meningioma, and vice versa. With the inclusion of 1400 plasma metabolites in this investigation, consistent findings across IVW, MR Egger, weighted median, simple mode, and weighted mode were considered significant only when estimated values, whether positive or negative, consistently indicated a notable association between plasma metabolites and meningioma, as well as vice versa. The results were presented using odds ratios (OR) or β coefficients and their respective 95% confidence intervals (CI).
Moreover, to ensure the robustness of our findings, we conducted supplementary sensitivity analyses, which included assessing potential heterogeneity and horizontal pleiotropy. Heterogeneity was evaluated using IVW and MR Egger regression techniques, with Cochran’s Q statistic serving as the primary measure. A p-value surpassing 0.05 for both IVW and MR Egger Cochran’s Q tests indicated the absence of significant heterogeneity, while values below 0.05 suggested its presence. Additionally, we examined the intercept in MR Egger regression to gauge the impact of horizontal pleiotropy on our results. An intercept approaching 0 with a p-value exceeding 0.05 suggested a lack of horizontal pleiotropy, indicating that confounding factors did not influence the causal relationship. Conversely, a markedly deviated intercept with a p-value below 0.05 indicated potential confounding effects. Furthermore, we employed MR-PRESSO analysis to identify and address significant outliers. The analytical procedures for this MR investigation were conducted using RStudio statistical software (version 4.2.2) and the TwoSampleMR package (version 0.5.6). Results were deemed statistically significant when p-values were less than 0.05.
Results
Causal relationships between plasma metabolites and meningioma risk
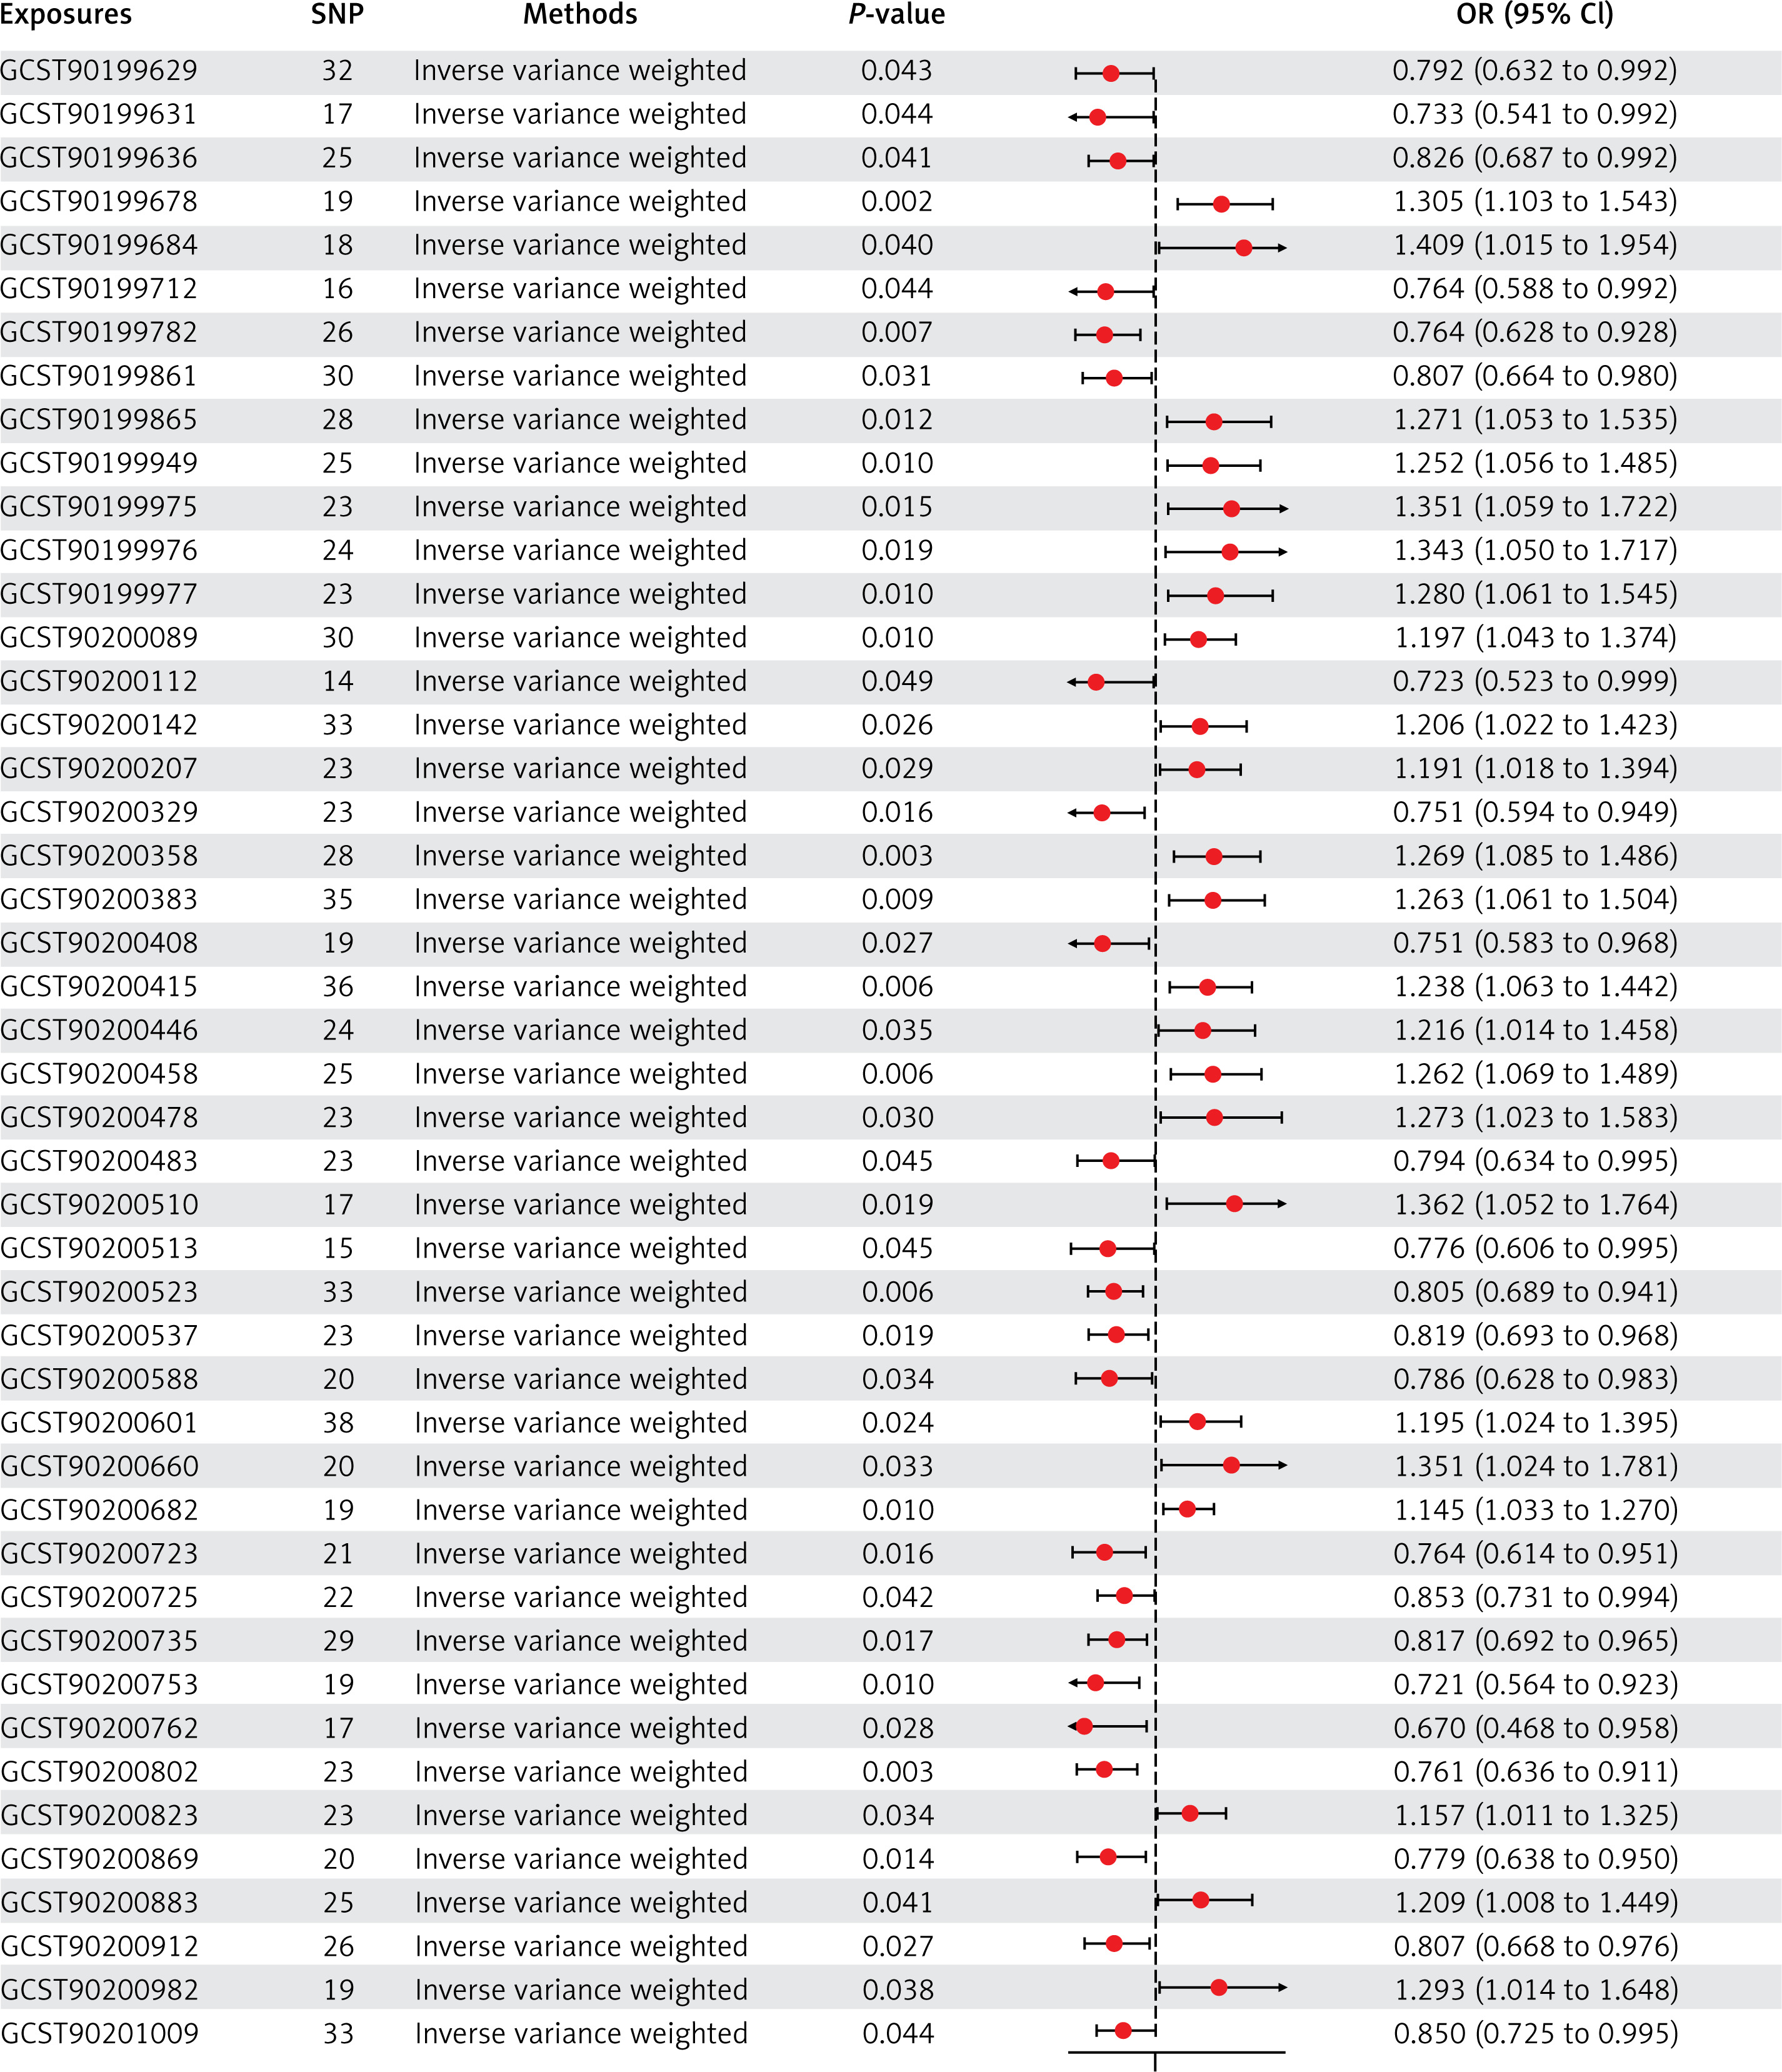
According to the criteria outlined above, a total of 46 plasma metabolites and metabolite ratios were ultimately found to be associated with the risk of meningioma. Among these, 23 were linked to a decreased risk, including: glycerophosphorylcholine (GPC) levels (OR = 0.792, 95% CI: 0.632 to 0.992), 3-methyl-2-oxovalerate levels (OR = 0.733, 95% CI: 0.541 to 0.992), kynurenine levels (OR = 0.826, 95% CI: 0.687 to 0.992), 3-carboxy-4-methyl-5-propyl-2-furanpropanoate (CMPF) levels (OR = 0.764, 95% CI: 0.588 to 0.992), glutamine degradant levels (OR = 0.764, 95% CI: 0.628 to 0.928), pregnenediol sulfate (C21H34O5S) levels (OR = 0.807, 95% CI: 0.664 to 0.980), 2,3-dihydroxy-2-methylbutyrate levels (OR = 0.723, 95% CI: 0.523 to 0.999), 3-phosphoglycerate levels (OR = 0.751, 95% CI: 0.594 to 0.949), plasma lactate levels (OR = 0.751, 95% CI: 0.583 to 0.968), X-12216 levels (OR = 0.794, 95% CI: 0.634 to 0.995), X-13507 levels (OR = 0.776, 95% CI: 0.606 to 0.995), X-12844 levels (OR = 0.805, 95% CI: 0.689 to 0.941), X-16087 levels (OR = 0.819, 95% CI: 0.693 to 0.968), X-21742 levels (OR = 0.786, 95% CI: 0.628 to 0.983), S-adenosylhomocysteine (SAH) to 5-methyluridine (ribothymidine) ratio (OR = 0.764, 95% CI: 0.614 to 0.951), adenosine 5′-diphosphate (ADP) to creatine ratio (OR = 0.853, 95% CI: 0.731 to 0.994), arginine to ornithine ratio (OR = 0.817, 95% CI: 0.692 to 0.965), aspartate to citrulline ratio (OR = 0.721, 95% CI: 0.564 to 0.923), palmitate (16:0) to myristate (14:0) ratio (OR = 0.670, 95% CI: 0.468 to 0.958), histidine to pyruvate ratio (OR = 0.761, 95% CI: 0.636 to 0.911), adenosine 5′-monophosphate (AMP) to valine ratio (OR = 0.779, 95% CI: 0.638 to 0.950), tryptophan to tyrosine ratio (OR = 0.807, 95% CI: 0.668 to 0.976), and threonine to pyruvate ratio (OR = 0.850, 95% CI: 0.725 to 0.995). Conversely, 23 plasma metabolites and metabolite ratios were associated with an increased risk of meningioma, including: tartronate (hydroxymalonate) levels (OR = 1.305, 95% CI: 1.103 to 1.543), 1-linoleoylglycerol (18:2) levels (OR = 1.409, 95% CI: 1.015 to 1.954), 2-hydroxyglutarate levels (OR = 1.271, 95% CI: 1.053 to 1.535), 6-oxopiperidine-2-carboxylate levels (OR = 1.252, 95% CI: 1.056 to 1.485), sphingomyelin (d18:2/14:0, d18:1/14:1) levels (OR = 1.351, 95% CI: 1.059 to 1.722), 1-dihomo-linolenylglycerol (20:3) levels (OR = 1.343, 95% CI: 1.050 to 1.717), 4-hydroxychlorothalonil levels (OR = 1.280, 95% CI: 1.061 to 1.545), methylsuccinoylcarnitine levels (OR = 1.197, 95% CI: 1.043 to 1.374), carotene diol (1) levels (OR = 1.206, 95% CI: 1.022 to 1.423), methyl vanillate sulfate levels (OR = 1.191, 95% CI: 1.018 to 1.394), arachidonate (20:4n6) levels (OR = 1.269, 95% CI: 1.085 to 1.486), cystathionine levels (OR = 1.263, 95% CI: 1.061 to 1.504), serine levels (OR = 1.238, 95% CI: 1.063 to 1.442), arachidate (20:0) levels (OR = 1.216, 95% CI: 1.014 to 1.458), X-11315 levels (OR = 1.262, 95% CI: 1.069 to 1.489), X-12221 levels (OR = 1.273, 95% CI: 1.023 to 1.583), X-12680 levels, (OR = 1.362, 95% CI: 1.052 to 1.764), X-23654 levels (OR = 1.195, 95% CI: 1.024 to 1.395), X-25957 levels (OR = 1.351, 95% CI: 1.024 to 1.781), 3-methylcytidine levels (OR = 1.145, 95% CI: 1.033 to 1.270), adenosine 5′-diphosphate (ADP) to N-palmitoyl-sphingosine (d18:1 to 16:0) ratio (OR = 1.157, 95% CI: 1.011 to 1.325), phosphate to acetoacetate ratio (OR = 1.209, 95% CI: 1.008 to 1.449), and paraxanthine to linoleate (18:2n6) ratio (OR = 1.293, 95% CI: 1.014 to 1.648). The relationships between the 46 plasma metabolites/metabolite ratios and meningioma elucidated by IVW are depicted in Figure 2, while the relationships between the 46 plasma metabolites/metabolite ratios and meningioma elucidated by the five methods are presented in Supplementary Table SI.
Figure 2
Causal relationship between plasma metabolites and meningioma risk
MR – Mendelian randomization, SNP – single nucleotide polymorphisms, OR – odds ratio, CI – confidence interval. GCST90199629: glycerophosphorylcholine (GPC) levels; GCST90199631: 3-methyl-2-oxovalerate levels; GCST90199636: kynurenine levels; GCST90199678: tartronate (hydroxymalonate) levels; GCST90199684: 1-linoleoylglycerol (18:2) levels; GCST90199712: 3-carboxy-4-methyl-5-propyl-2-furanpropanoate (CMPF) levels; GCST90199782: glutamine degradant levels; GCST90199861: pregnenediol sulfate (C21H34O5S) levels; GCST90199865: 2-hydroxyglutarate levels; GCST90199949: 6-oxopiperidine-2- carboxylate levels; GCST90199975: sphingomyelin (d18:2/14:0, d18:1/14:1) levels; GCST90199976: 1-dihomo-linolenylglycerol (20:3) levels; GCST90199977: 4-hydroxychlorothalonil levels; GCST90200089: methylsuccinoylcarnitine levels; GCST90200112: 2,3-dihydroxy-2-methylbutyrate levels; GCST90200142: carotene diol (1) levels; GCST90200207: methyl vanillate sulfate levels; GCST90200329: 3-phosphoglycerate levels; GCST90200358: arachidonate (20:4n6) levels; GCST90200383: cystathionine levels; GCST90200408: plasma lactate levels; GCST90200415: serine levels; GCST90200446: arachidate (20:0) levels; GCST90200458: X-11315 levels; GCST90200478: X-12221 levels; GCST90200483: X-12216 levels; GCST90200510: X-12680 levels; GCST90200513: X-13507 levels; GCST90200523: X-12844 levels; GCST90200537: X-16087 levels; GCST90200588: X-21742 levels; GCST90200601: X-23654 levels; GCST90200660: X-25957 levels; GCST90200682: 3-methylcytidine levels; GCST90200723: S-adenosylhomocysteine (SAH) to 5-methyluridine (ribothymidine) ratio; GCST90200725: adenosine 5′-diphosphate (ADP) to creatine ratio; GCST90200735: arginine to ornithine ratio; GCST90200753: aspartate to citrulline ratio; GCST90200762: palmitate (16:0) to myristate (14:0) ratio; GCST90200802: histidine to pyruvate ratio; GCST90200823: adenosine 5′-diphosphate (ADP) to N-palmitoyl-sphingosine (d18:1 to 16:0) ratio; GCST90200869: adenosine 5′-monophosphate (AMP) to valine ratio; GCST90200883: phosphate to acetoacetate ratio; GCST90200912: tryptophan to tyrosine ratio; GCST90200982: paraxanthine to linoleate (18:2n6) ratio; GCST90201009: threonine to pyruvate ratio.
Heterogeneity test of plasma metabolites and meningioma
The heterogeneity test results for the 46 plasma metabolites/metabolite ratios and meningioma are presented in Table II. The IVW method revealed significant heterogeneity in the relationships between glycerophosphorylcholine (GPC) levels (Cochran’s Q test = 46.694, p = 0.035) and the palmitate (16:0) to myristate (14:0) ratio (Cochran’s Q test = 26.455, p = 0.048) with meningioma. Similarly, the MR Egger method indicated significant heterogeneity in the relationship between 1-dihomo-linolenylglycerol (20:3) levels and meningioma (Cochran’s Q test = 34.449, p = 0.044). Interestingly, regardless of whether the IVW or MR Egger method was employed, a significant association was detected between the S-adenosylhomocysteine (SAH) to 5-methyluridine (ribothymidine) ratio and meningioma (p < 0.05). Furthermore, no significant heterogeneity was observed in the relationship between meningioma and the remaining plasma metabolites (p > 0.05).
Table II
Heterogeneity test of plasma metabolites and meningioma
Horizontal pleiotropy testing of plasma metabolites and meningioma
The assessment of horizontal pleiotropy for the 46 plasma metabolites and meningioma is presented in Table III. As depicted, the intercepts for the relationships between the 46 plasma metabolites/metabolite ratios and meningioma tended towards 0, indicating minimal evidence of horizontal pleiotropy. The scatter plot illustrating the relationships between the 46 plasma metabolites/metabolite ratios and meningioma is presented in Supplementary Figure S1. Moreover, all p-values associated with these intercepts exceeded 0.05, further suggesting the absence of significant horizontal pleiotropy. This implies that the relationships between the 46 plasma metabolites/metabolite ratios and meningioma are unlikely to be influenced by other confounding factors.
Table III
Horizontal pleiotropy testing of plasma metabolites and meningioma
Causal relationship between meningioma and plasma metabolites
We further investigated the impact of meningioma on the identified 46 plasma metabolites/metabolite ratios using reverse MR analysis. Based on the established criteria, we found no significant effect of meningioma on 24 plasma metabolites/metabolite ratios, including 3-methyl-2-oxovalerate levels, kynurenine levels, tartronate (hydroxymalonate) levels, CMPF levels, glutamine degradant levels, 1-dihomo-linolenylglycerol (20:3) levels, 4-hydroxychlorothalonil levels, 2,3-dihydroxy-2-methylbutyrate levels, carotene diol (1) levels, methyl vanillate sulfate levels, plasma lactate levels, serine levels, arachidate (20:0) levels, X-11315 levels, X-12216 levels, X-13507 levels, X-23654 levels, 3-methylcytidine levels, adenosine 5′-diphosphate (ADP) to creatine ratio, arginine to ornithine ratio, palmitate (16:0) to myristate (14:0) ratio, tryptophan to tyrosine ratio, paraxanthine to linoleate (18:2n6) ratio, and threonine to pyruvate ratio, suggesting that the occurrence of meningioma has no notable influence on the levels of these 24 plasma metabolites/metabolite ratios. The results are depicted in Table IV and Supplementary Table SII.
Table IV
Causal relationship between meningioma and plasma metabolites
Heterogeneity test of meningioma and plasma metabolites
Supplementary Table SIII presents the results of the heterogeneity test examining the association between meningioma and plasma metabolites/metabolite ratios. According to the MR Egger method, a notable level of heterogeneity was observed in the relationship between meningioma and serine levels (Cochran’s Q test = 5.252, p = 0.022), indicating significant variability in this association. Similarly, the IVW method also revealed significant heterogeneity in the relationship between meningioma and adenosine 5′-diphosphate (ADP) to creatine ratio (Cochran’s Q test = 6.005, p = 0.050). However, no significant heterogeneity was detected in the relationship between meningioma and other plasma metabolites, suggesting a more consistent association in those cases.
Horizontal pleiotropy testing of meningioma and plasma metabolites
Supplementary Table SIV provides an overview of the assessment of horizontal pleiotropy between meningioma and 24 plasma metabolites/metabolite ratios. Importantly, the analysis revealed no significant horizontal pleiotropy in the relationship between meningioma and these 24 plasma metabolites/metabolite ratios. This suggests that the association between meningioma and the examined plasma metabolites remains unaffected by potential confounding factors.
Metabolic pathway analysis
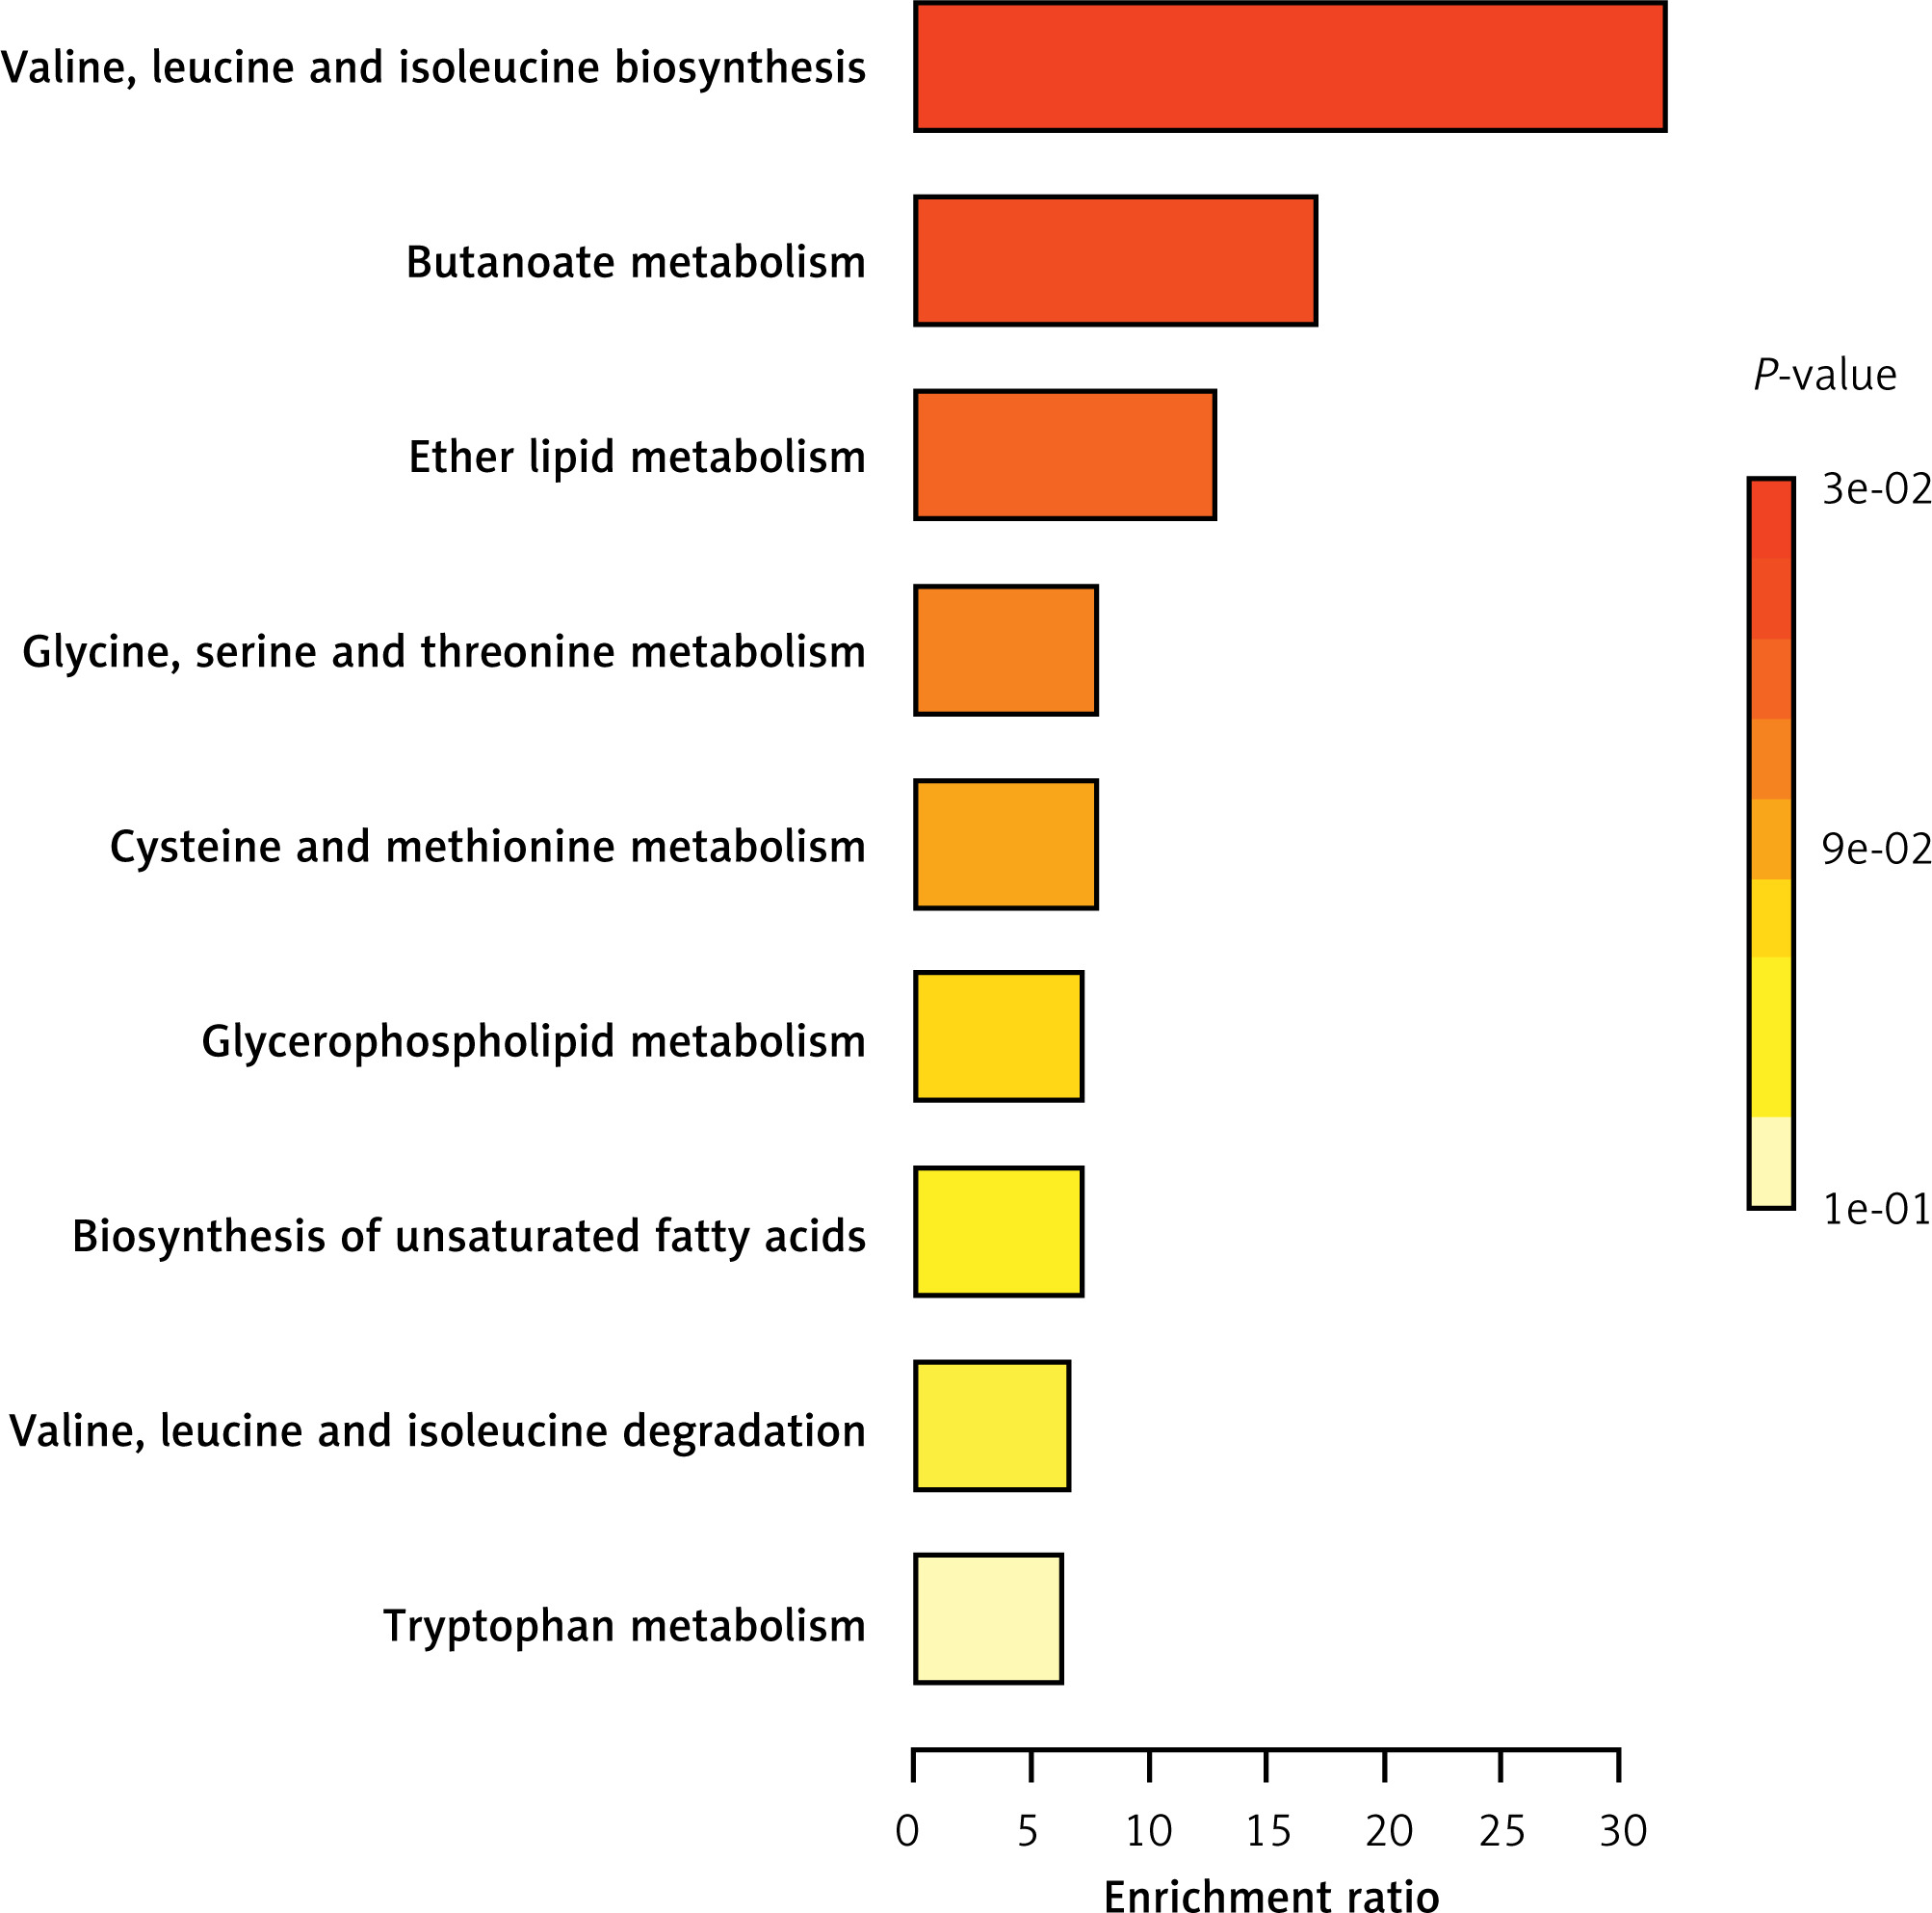
The KEGG analysis indicates that the identified plasma metabolites influence the occurrence of meningioma through nine metabolic pathways: valine, leucine, and isoleucine biosynthesis; butanoate metabolism; ether lipid metabolism; glycine, serine, and threonine metabolism; cysteine and methionine metabolism; glycerophospholipid metabolism; biosynthesis of unsaturated fatty acids; valine, leucine, and isoleucine degradation; and tryptophan metabolism (Figure 3).
Discussion
Key findings
Our bidirectional MR analysis initially revealed significant associations between 46 plasma metabolites/metabolite ratios and meningioma risk, with 23 associated with a decreased risk and 23 associated with an increased risk of meningioma. Importantly, these relationships showed no significant horizontal pleiotropy, indicating that they are not influenced by other confounding factors. Additionally, reverse MR analysis demonstrated that meningioma has no significant impact on the levels of 24 plasma metabolites/metabolite ratios and is unaffected by confounding factors. Finally, the main finding of this study is that 24 plasma metabolites/metabolite ratios are significantly associated with the occurrence of meningioma, with 13 associated with a decreased risk and 11 associated with an increased risk of meningioma. In addition, the identified plasma metabolites influence the occurrence of meningioma through nine metabolic pathways. These findings underscore the potential of plasma metabolite profiles as serological tools for the early diagnosis of meningioma and suggest implications for precision medicine and targeted therapeutic interventions.
Plasma metabolites and meningioma
The relationship between plasma metabolites and meningioma has been a subject of increasing interest due to its potential implications for both understanding the pathogenesis of meningioma and identifying biomarkers for early detection. The investigation conducted by Masalha et al. [33]. involved a comparative analysis of 43 individuals diagnosed with either low- or high-grade meningiomas, including 28 cases of grade I meningiomas, 12 cases of grade II meningiomas, and 3 cases of grade III meningiomas. Their results revealed a marked decrease in the glycine/serine cluster in relation to both the disease grade and proliferation of meningiomas. Moreover, the study identified a significantly prolonged progression-free survival linked to the glycine/serine cluster, suggesting a potential association between metabolite levels and the differentiation and recurrence of meningiomas. Moreover, Talari et al. [34] conducted an investigation into the alterations in tryptophan metabolism in human meningiomas. Their findings revealed a preference for the kynurenine (KYN) pathway in tryptophan (TRP) metabolism in human meningiomas, potentially attributed to elevated levels of indoleamine 2,3-dioxygenase 2, with mRNA levels being upregulated in human meningiomas. Additionally, notable increases were observed in KYN and 5-hydroxy indole acetic acid (5-HIAA) levels in meningiomas compared to control meninges, while the levels of TRP, 5-hydroxy tryptamine (5-HT), 5-hydroxy tryptophan (5-HTP), N-acetyl serotonin (NAS), and melatonin (MEL) were significantly decreased. Similarly, Petersen et al. [35]. found in their study that meningioma tissues exhibit higher levels of 2-monoacylglycerols compared to human non-tumor brain tissue. Furthermore, they observed an enhanced capacity for phosphatidylcholine to convert into monoacylglycerol and suggested that 2-arachidonoylglycerol, anandamide, and other N-acylethanolamines may serve as endogenous anti-tumor mediators.
To our knowledge, this study represents the first exploration of the relationship between plasma metabolites and meningioma based on large-scale GWAS data, involving 1400 plasma metabolites, 1,316 diagnosed meningioma patients, and 313,392 non-meningioma patients. The results of this study reveal that 24 plasma metabolites/metabolite ratios – 3-methyl-2-oxovalerate levels, kynurenine levels, tartronate (hydroxymalonate) levels, CMPF levels, glutamine degradant levels, 1-dihomo-linolenylglycerol (20:3) levels, 4-hydroxychlorothalonil levels, 2,3-dihydroxy-2-methylbutyrate levels, carotene diol (1) levels, methyl vanillate sulfate levels, plasma lactate levels, serine levels, arachidate (20:0) levels, X-11315 levels, X-12216 levels, X-13507 levels, X-23654 levels, 3-methylcytidine levels, adenosine 5′-diphosphate (ADP) to creatine ratio, arginine to ornithine ratio, palmitate (16:0) to myristate (14:0) ratio, tryptophan to tyrosine ratio, paraxanthine to linoleate (18:2n6) ratio and threonine to pyruvate ratio – can serve as important serum markers for early prediction of meningioma occurrence. The conclusions of this study are consistent with previous research [33–35], demonstrating the significant predictive ability of meningioma occurrence risk from the perspective of plasma metabolites. Additionally, it is worth noting that while previous studies compared the characteristics of plasma metabolites between patients with high-grade and low-grade meningiomas, this study compared the plasma metabolite characteristics between patients with and without meningioma, providing novel insights for even earlier prediction of meningioma occurrence.
Clinical implications
The identification of specific plasma metabolites associated with meningioma occurrence holds significant clinical implications. Firstly, these findings provide potential biomarkers for the early detection and diagnosis of meningioma, which could lead to improved patient outcomes through earlier intervention and treatment initiation. Additionally, understanding the metabolic profile characteristic of meningioma could aid in risk stratification and personalized treatment strategies. Furthermore, these findings may open avenues for the development of novel therapeutic targets aimed at modulating the metabolism of meningioma cells. Overall, the integration of plasma metabolite profiling into clinical practice has the potential to enhance the management and treatment of meningioma patients, ultimately contributing to better prognosis and quality of life. In addition, KEGG analysis revealed that the identified plasma metabolites influence the occurrence of meningioma through nine metabolic pathways: valine, leucine, and isoleucine biosynthesis; butanoate metabolism; ether lipid metabolism; glycine, serine, and threonine metabolism; cysteine and methionine metabolism; glycerophospholipid metabolism; biosynthesis of unsaturated fatty acids; valine, leucine, and isoleucine degradation; and tryptophan metabolism. This provides an important theoretical basis for subsequent meningioma treatment and drug development.
Limitations
Firstly, while bidirectional MR analysis provides insights into potential causal relationships, it is essential to consider the assumptions and limitations of this method, including the reliance on genetic variants as IVs. Secondly, the study’s reliance on data from GWAS databases may introduce bias or confounding factors, and the generalizability of the findings may be limited to the populations represented in these datasets. Thirdly, this study identified a series of plasma metabolites associated with the occurrence of meningioma. However, the underlying mechanisms driving these associations remain poorly understood due to a lack of related research. Therefore, there is a pressing need for further mechanistic studies to elucidate the potential pathways through which these metabolites may influence meningioma development, thereby validating the findings of this study and advancing our understanding of meningioma pathogenesis. Finally, we employed MR, which uses genetic variants as IVs to infer causal relationships between exposures (plasma metabolites) and outcomes (meningiomas). In this context, genetic conditions are considered, suggesting that the plasma metabolite profiles identified in this study might be useful for the early detection of meningiomas caused by genetic factors, such as neurofibromatosis type 2 [36, 37]. However, further prospective, multi-center studies are still needed to validate these findings.
In conclusion, our MR study demonstrates the complicated association between plasma metabolites and meningioma, offering potential insights into early diagnosis, risk stratification, and therapeutic interventions. The identification of specific plasma metabolites associated with meningioma occurrence underscores their potential utility as biomarkers for early detection and personalized treatment strategies. However, further research is warranted to elucidate the underlying mechanisms driving these associations and validate the findings in diverse populations.