Introduction
Membranous nephropathy (MN) is a renal disorder characterized by abnormalities within the glomerular compartment of the kidney, with patients exhibiting reduced levels of serum albumin and widespread edema [1]. MN represents approximately 30% of the cases of nephrotic syndrome in adult populations [2]. MN affects populations worldwide and across all ethnicities, and the estimated annual incidence of MN is 10–12 per million in North America and 2–17 per million in Europe [3–7]. The overall prevalence of membranous nephropathy (MN) is estimated at approximately 690 per 100,000 individuals worldwide [2, 8]. Approximately 20–30% of the cases of MN arise secondarily due to factors such as persistent infections, systemic illnesses, medication exposure, or cancer [9]. However, the mechanisms underlying the pathogenesis of MN have yet to be fully understood.
B lymphocytes constitute an essential element of the immune system, primarily tasked with the generation of antibodies to neutralize pathogens [10]. A subset of B lymphocytes, termed regulatory B cells (Bregs), exhibit immunosuppressive capabilities and can arise at multiple phases of B cell development [11]. Dysregulated B cell function can result in tissue injury across a spectrum of diseases, encompassing cancers, autoimmune disorders, and responses to transplanted organs [12]. Abnormalities in B cells have been reported within the peripheral blood and renal tissues of patients with MN [13]. The available literature suggests that B cells are implicated in multiple facets of the immune response in MN, ranging from the identification of self-antigens to the generation of autoantibodies [14–17]. Furthermore, certain subsets of B cells are gaining recognition as potential novel biomarkers. In aggregate, these observations highlight the pertinence of B cell dysregulation as a pivotal factor in the etiology of MN.
Mendelian randomization (MR) is an epidemiological tool that employs genetic variation as an instrumental variable (IV) to infer causality between exposure and outcome. By exploiting the random allocation of genetic variants at conception, MR minimizes the confounding and reverse causation biases inherent in observational studies, thus offering a robust means to assess causality in complex diseases [18]. Thus far, the application of MR has been instrumental in elucidating causal relationships in various diseases.
This study aimed to apply the MR approach to investigate the causal association of peripheral blood B cell subtypes with the risk of MN. By using large-scale GWAS summary statistics, this study sought to clarify whether perturbations in B cell function are causally associated with the onset and progression of MN. This work can enhance our understanding of the etiology of MN and can potentially inform novel therapeutic targets and preventive strategies.
Material and methods
Study design
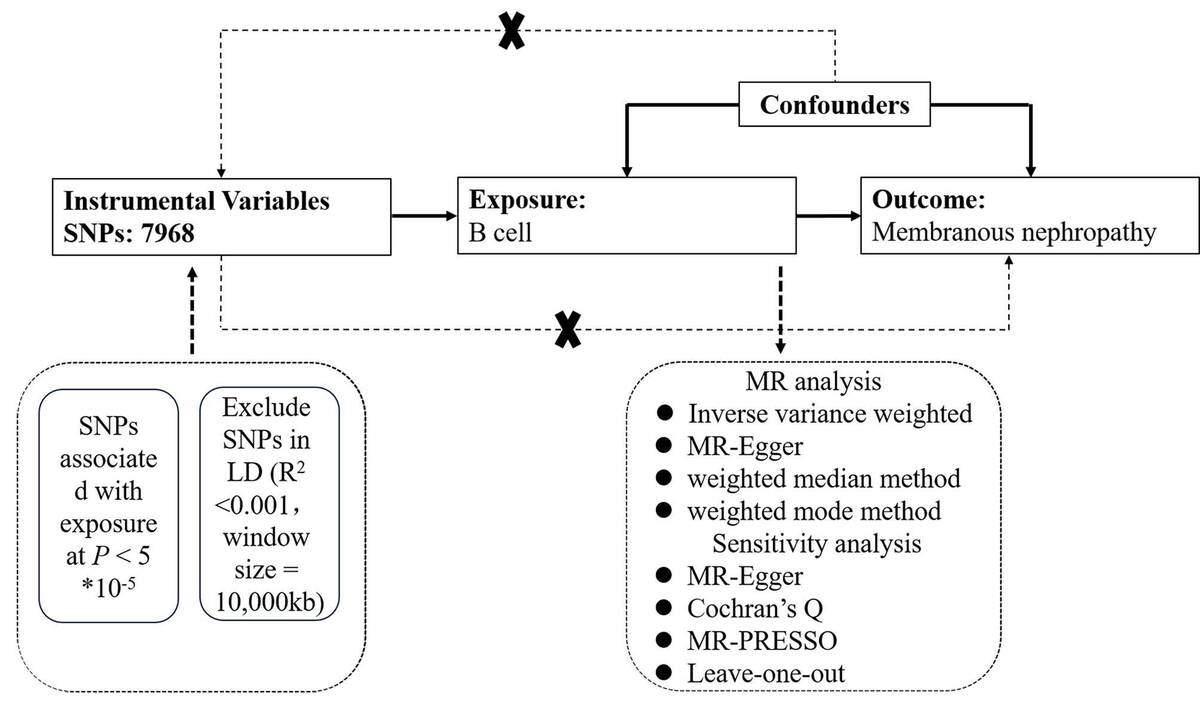
A two-sample MR design adhering to the STROBE-MR statement was used in the present study [19]. Single nucleotide polymorphisms (SNPs) that had a robust association with exposures were used as genetic instrumental variables to deduce causality between exposures and outcomes. The MR design met the following assumptions (Figure 1): (1) association assumption: the SNPs were strongly associated with the predicted exposures (p < 5 × 10⁻⁵), (2) independence assumption: the SNPs were not influenced by recognized potential confounding factors, and (3) exclusivity assumption: the SNPs exerted their influence on the outcomes via intermediary exposure factors, without a direct association with the outcome itself [20, 21].
Figure 1
Flow chart of the research methodology and the sequence of MR analysis
MR – Mendelian randomization, MR-PRESSO – MR pleiotropy residual sum, and outlier test, SNP – single nucleotide polymorphism, MR-Egger – Mendelian randomization-Egger.
The summary data used in the present study were obtained from publicly available GWASs of European ancestry. The relevant cohort ethics committees for human studies approved these data; therefore, separate ethical approval was not required for this study.
Data sources
The MR analyses were performed using summary-level data obtained from publicly available GWAS for each trait listed in Supplementary Table SI. Specifically, genetic instrumental variables (IVs) were obtained for MN from a genome-wide association study (GWAS), which included a total of 7,979 individuals of European ancestry (2,150 cases and 5,829 controls) [22]. The GWAS summary statistics for B cell subsets are publicly available from the GWAS catalog (https://gwas.mrcieu.ac.uk). The details of the selected GWAS datasets are presented in Supplementary Table SI.
Selection of instrumental variables (IVs)
First, SNPs with a lower significance threshold (p < 5 × 10⁻⁵) were selected for B cells due to only two SNP being identified at p < 5 × 10⁻⁶ in the B cell summary GWAS statistics. Subsequently, IVs were grouped within a 10-megabase genetic interval, applying a stringent linkage disequilibrium (LD) cutoff of R2 = 0.001 to ascertain the independence of the SNPs. When the selected IV was absent in the summary data for the outcome, an alternative proxy SNP in high linkage disequilibrium (LD, with R2 > 0.8) with the original IV was sought for substitution. F-statistics, calculated as the ratio of β2 to its standard error squared (SE2), were employed to evaluate the potency of the genetically determined IVs. A threshold of F greater than 10 was applied, aligning with the initial MR assumption and indicating the absence of bias towards IVs with low strength [23–25].
MR analysis
The primary analytical method was the IVW approach, which calculates the weighted average of effect sizes using the inverse variance as weights to estimate odds ratios (ORs) and their corresponding 95% confidence intervals (CIs). This methodology leveraged IVW and stipulated that the intercept of the regression line should be constrained to pass through the origin [26]. Supplementary MR methods were employed to reinforce the robustness of the findings, including the MR-Egger regression, weighted median, and weighted mode estimation. The MR-Egger method, accounting for potential pleiotropic bias through an intercept term, ensures accurate causal effect estimation even if there is directional pleiotropy [27]. The weighted median analysis assumes that at least half of the IVs are valid, thereby providing a conservative estimate of causality [28]. Multiple testing correction was applied using the false discovery rate (FDR) adjustment to account for multiple comparisons, with statistical significance defined as PFDR < 0.05.
The heterogeneity among the IVs was assessed using Cochran’s Q statistic, with a p-value for Q < 0.05, indicating significant heterogeneity. The MR-PRESSO test was implemented to identify and adjust for horizontal pleiotropy, thereby enhancing the precision of the effect size calculations [29]. The MR-Egger regression intercept was used to assess directional pleiotropy, with a p-value threshold of < 0.05 for significance. Leave-one-out (LOO) cross-validation and visual inspections through funnel and scatter plots were conducted to reinforce the validity and symmetry of the effect size estimates. All MR analyses were performed using an R-based two-sample MR package (version 4.1.2).
Results
SNP selection and data harmonization
A total of 10,991 IVs related to B cells were identified based on the inclusion and exclusion criteria. Out of the 10,991 SNPs, 3370 were not matched in the summary data for the outcome. Among the 3370 unmatched SNPs, 3023 did not have a proxy identified, and the remaining 347 were successfully assigned proxy SNPs. Supplementary Table SII displays the details of the IVs that were used.
Influence of B cells on membranous nephropathy
The F-statistics of the IVs related to B cells varied from 16.47 to 2037.04, indicating no weak IVs in the study and no evidence of weak instrument bias. The MR analysis using the IVW method revealed that genetically predicted IgD+ CD24- B cell absolute count (OR = 0.8285, 95% CI: 0.7317–0.9381, p = 0.003), BAFF-R on IgD+ CD24- B cells (OR = 0.9045, 95% CI: 0.8275–0.9886, p = 0.0269), BAFF-R on IgD+ CD38dim B cells (OR = 0.9057, 95% CI: 0.8277–0.991, p = 0.0311), BAFF-R on IgD- CD27- B cells (OR = 0.9134, 95% CI: 0.8404–0.9928, p = 0.0332), CD19 on IgD- CD24- B cells (OR = 0.884, 95% CI: 0.7906–0.9886, p = 0.0306), CD24 on switched memory B cells (OR = 0.8927, 95% CI: 0.8133–0.9798, p = 0.0169), and CD25 on switched memory B cells (OR = 0.8768, 95% CI: 0.7745–0.9927, p = 0.0379) may prevent MN (Table I). For the remaining cellular subtypes, the analyses indicated no significant causal effects on the risk of MN, with estimates attenuating toward the null.
Table I
Association between B cell and membranous nephropathy
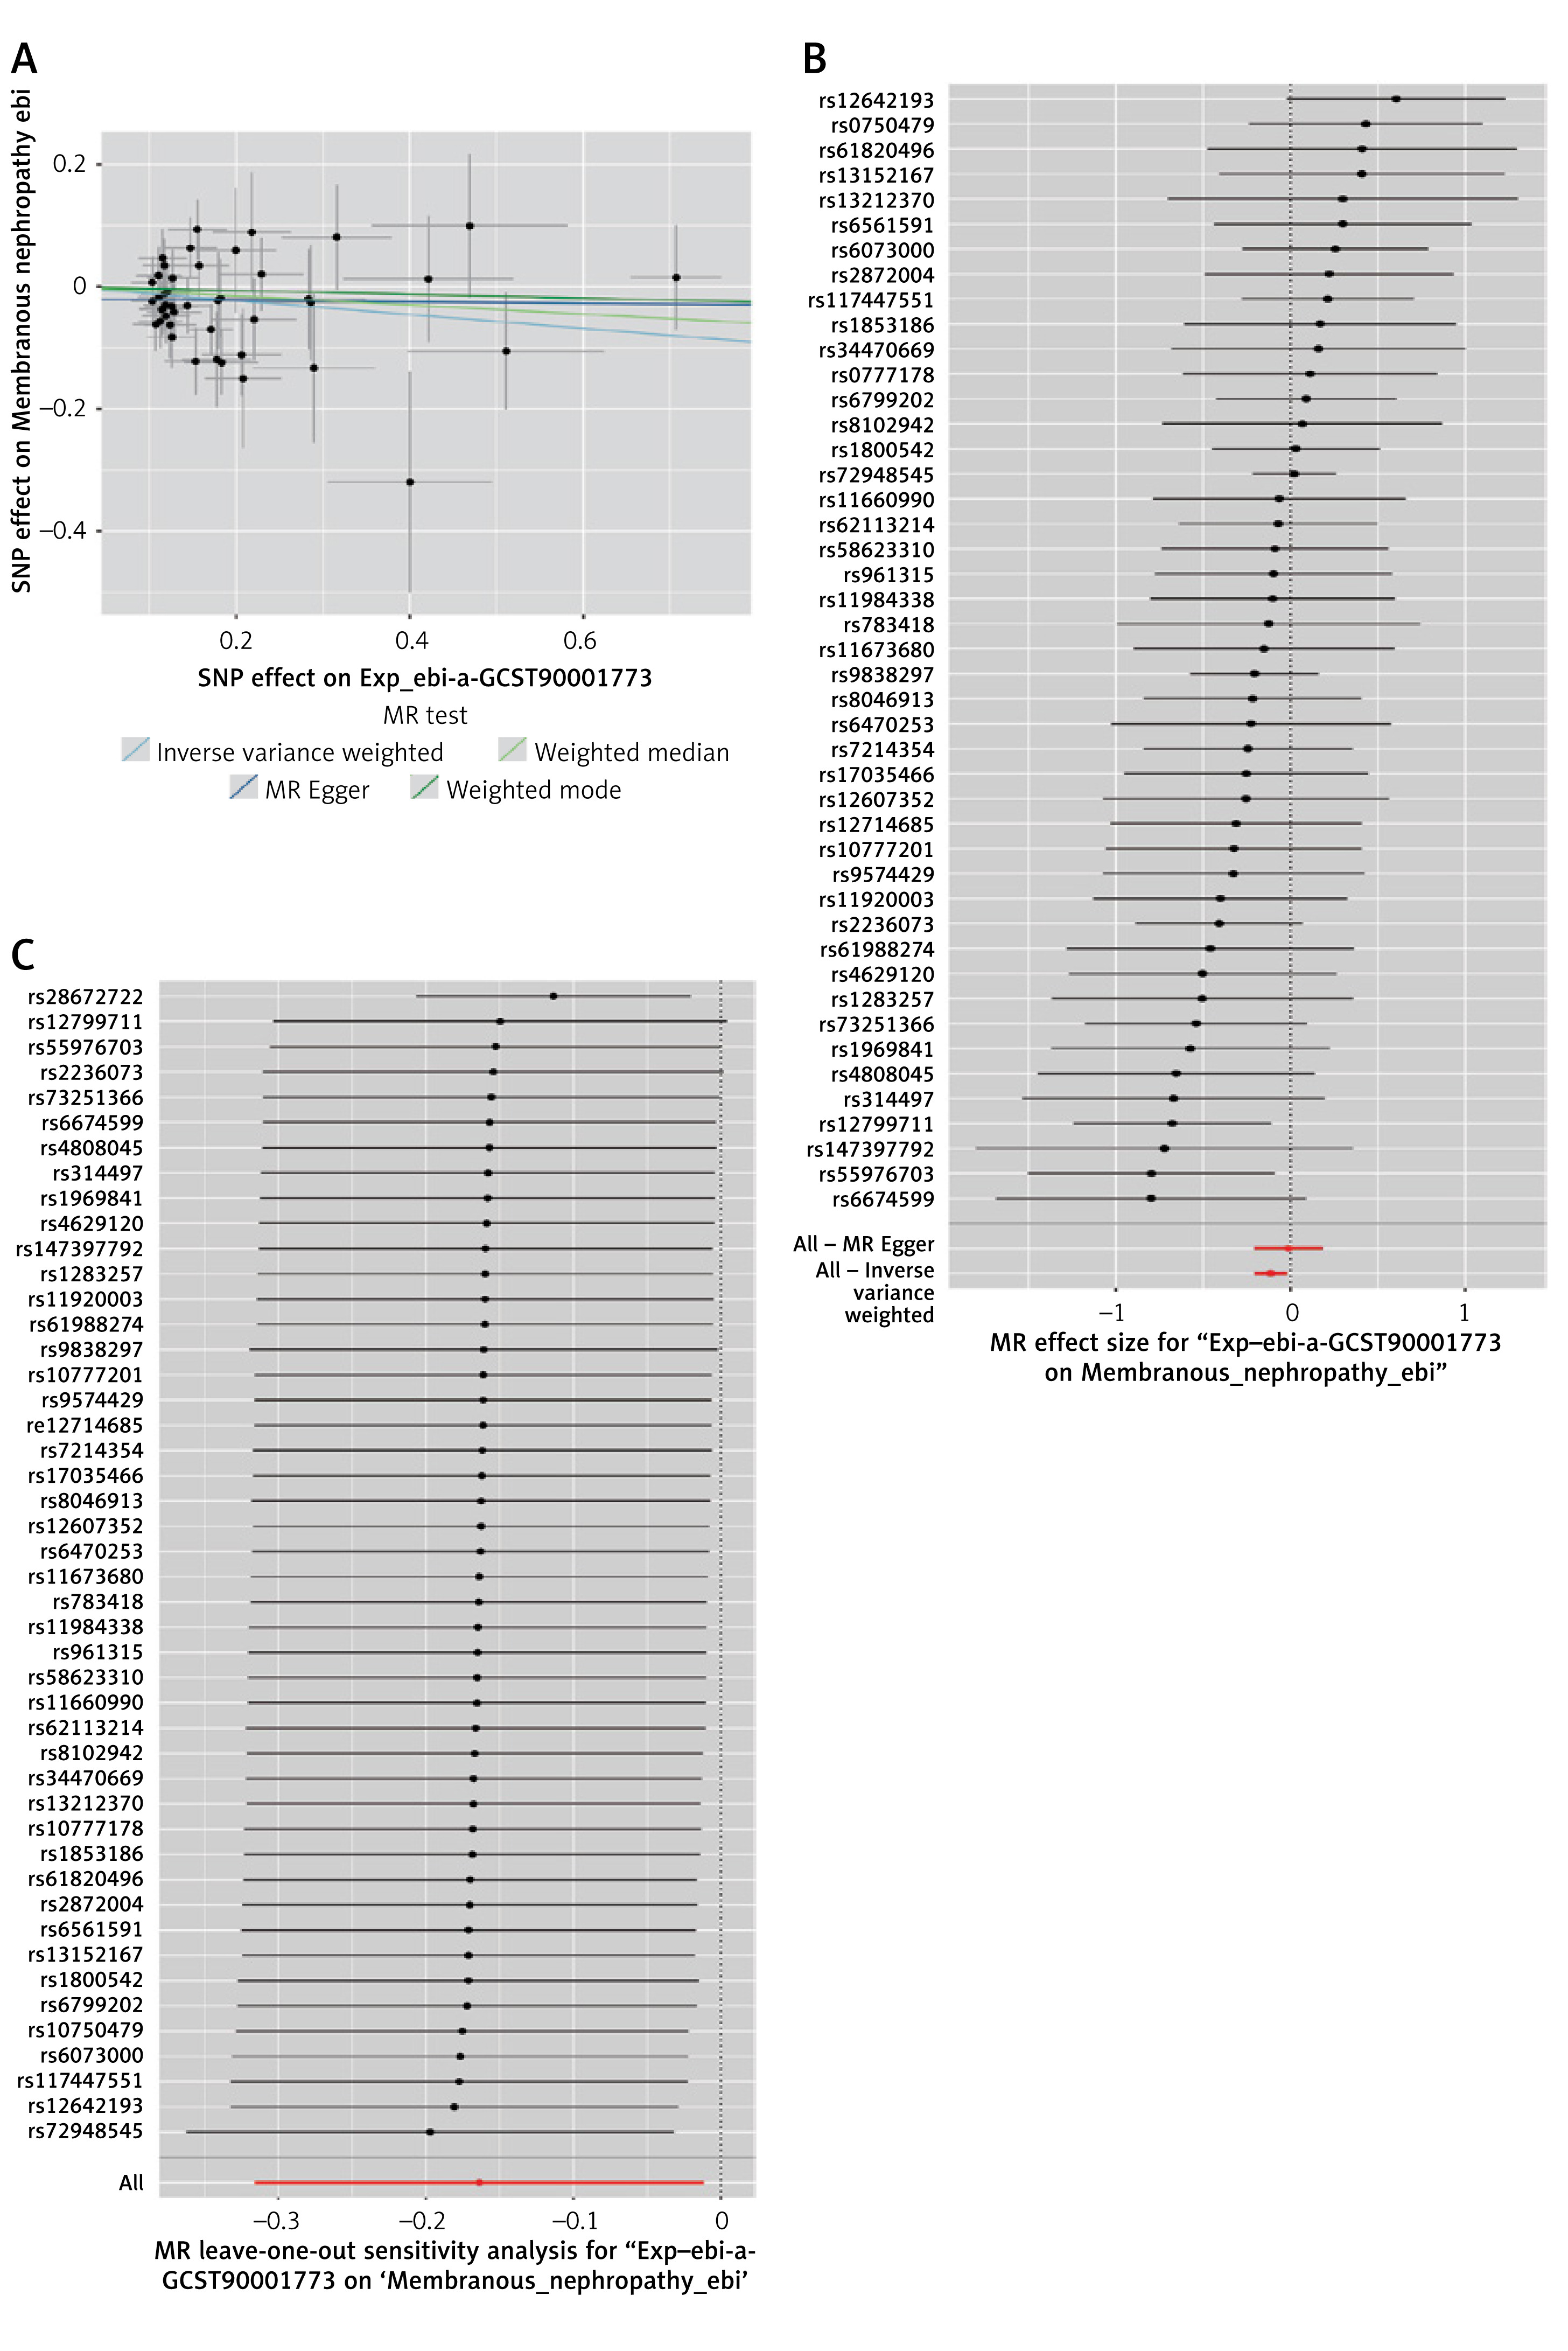
A sensitivity analysis of the MR results was performed. Cochran’s Q test did not indicate significant heterogeneity across the analyses, except in the following associations: between CD20- B cell %, B cell % of CD3- lymphocytes, CD24 on switched memory B cells, and MN. These specific comparisons revealed significant heterogeneity (Table II). However, the results from the MR Egger intercept test indicated that the analysis remained robust. We initially discovered a significant association between CD20- B cell % (OR = 1.2601, 95% CI: 1.0033–1.5827, p = 0.0468), B cell % of CD3- lymphocytes (OR = 1.2354, 95% CI: 1.009–1.5126, p = 0.0407), CD24 on switched memory B cells (OR = 0.849, 95% CI: 0.7292–0.9884, p = 0.0349), HLA DR on B cells (OR = 1.3251, 95% CI: 1.0969–1.6008, p = 0.0035) and MN. Following the removal of each outlier individually, the data were reanalyzed, finding that the associations were no longer statistically significant under the IVW method except CD24 on switched memory B cells and MN (OR = 0.8927, 95% CI: 0.8133–0.9798, p = 0.0169), and there was no pleiotropy (Table III, Figure 2). The leave-one-out sensitivity analysis revealed similar results (Figure 2).
Table II
Results of heterogeneity test and pleiotropy test of instrumental variables
Table III
MR-PRESSO test results
Figure 2
Scatter plots, forest plots, and leave-oneout for MR analyses of CD24 on switched memory B cells and MN. A – Scatter plot of CD24 on switched memory B cells and MN. B – Forest plot of CD24 on switched memory B cells and MN. C – Leave-oneout for MR analyses of CD24 on switched memory B cells and MN
Discussion
MN is a prototypical autoimmune glomerular disease and represents a significant health burden as the leading cause of nephrotic syndrome in non-diabetic adults. Aiming to understand the pathogenesis of MN, B cells with their role in the production of pathogenic autoantibodies against key podocyte antigens, such as the M-type phospholipase A2 receptor (PLA2R), have emerged as having a pivotal role [30]. However, the available evidence that links B cells and MN is limited. Therefore, this study employed a two-sample MR design to investigate the potential causal relationship between peripheral blood B cell subtypes and the risk of MN, thereby providing more credible evidence for a deeper understanding of the pathophysiology of MN, enhancing diagnostic approaches, and facilitating the development of novel therapeutics.
B lymphocytes play a pivotal role in humoral immunity and are capable of antigen presentation. Available research demonstrated that B cells are integral to the development of numerous autoimmune conditions [31, 32]. Upon encountering an antigen, B cells are activated, subsequently maturing into memory B cells and plasma cells. Growing evidence indicates a disruption in the B cell repertoire among individuals with MN [13, 16, 31–34]. It appears that the B cell distribution may favor the expansion of naïve B cells, coinciding with a reduction in the numbers of switched and unswitched memory B cells. The present study confirmed that the expression of CD24 on switched memory B cells and CD25 on switched memory B cells was associated with a reduced risk of developing MN. A transcriptomic analysis demonstrated that the frequency of IGHM, IGHD, and IGHE genes governing the expression of µ, δ, and ε heavy chains on IgM, IgD, and IgE, respectively, was higher in MN patients compared with healthy controls [34]. B cells produce antibodies, and in MN, these antibodies are directed against podocyte antigens. These podocyte-specific autoantibodies bind to the glomerular basement membrane, leading to the formation of immune complexes. The immune complexes formed by the autoantibodies and antigens are deposited beneath the podocytes, causing inflammation and damage to the glomerular structure [13, 35]. The present MR analysis also suggested a potential association between IgD+ CD24- B cell absolute count and MN. B cell selection and survival are regulated by several critical cytokine systems, including the BAFF, the latter of which additionally binds to the BAFF-R. Serum BAFF and APRIL levels were found to be elevated in MN [36, 37]. The aberrant number and function of CD19+ CD24hi CD38hi B cells are associated with the pathogenesis of autoimmune diseases [38]. Idiopathic MN (IMN) patients showed an increased frequency of CD19+CD24hiCD38hi B cells compared with healthy controls [33]. Consistent with previous research, our results indicated that BAFF-R on IgD+ CD24- B cells, BAFF-R on IgD+ CD38dim B cells, and BAFF-R on CD19 on IgD- CD24- B cells reduced the risk of MN. The findings also suggested a potential association between IgD- CD27- B cell and MN, although few studies have reported this.
Due to the potential impact of heterogeneity or pleiotropy, the relationship between CD20- B cell %, B cell % of CD3- lymphocytes, HLA DR on B cells, and MN was no longer statistically significant after outlier removal. It would be advisable to conduct further cohort studies to validate these findings. The mechanisms by which B cells operate within the initial stages of the immune response and trigger the ensuing sequence of pathological events remain a significant question to address [39].
Employing the MR method, this study endeavored to mitigate the influence of confounders typically encountered in observational epidemiological research. In addition, the datasets contained tens of thousands of individuals, adding robustness and statistical power to the analyses. The selected SNPs demonstrated robust correlations with B cells. Furthermore, the sensitivity analysis showed no pleiotropy or heterogeneity after outlier removal, indicating that the results were statistically robust.
However, there were several limitations to this study. First, patients in the GWAS summary data used in our study were of European ancestry, which may lead to biased estimates and limit generalizability to other ethnic groups, such as Asians. Future studies should use, when available, multi-ethnic GWAS datasets or GWAS datasets from other populations. Second, the investigation of potential non-linear relationships and sex-specific associations was not feasible because of the absence of granular, individual-level data. In addition, the lack of individual-level data prevents assessment of potential stratification that could inflate the associations between SNPs and the outcomes. Third, a relaxed significance threshold of 5 × 10⁻⁵ had to be used for IV selection because too few SNPs could be selected using a more stringent genome-wide significance level of 5 × 10⁻⁸. Fourth, several analyses showed negative results, but negative MR results do not mean that there is no link between exposure and outcome. Fifth, the absence of association may be caused by the genetic variation being insufficient to model the effect of exposure on outcome adequately. It is a known limitation of MR studies, especially where genetic variants have less or weaker effects on exposure. Finally, the risk of residual pleiotropy cannot be entirely ruled out despite MR-Egger regression and MR-PRESSO results indicating the absence of pleiotropy. Additional studies are necessary to examine the causal associations between B cells and MN.
In conclusion, this study constitutes a step in elucidating the genetic architecture underlying MN, leveraging the power of MR to investigate the causal associations between peripheral blood B cell subtypes and MN development. By correlating B cell-related biomarkers with histopathological and clinical indices, the present study could suggest potential non-invasive biomarkers for determining the risk of MN, which could be of significance in the era of personalized medicine. Future studies should perform in vitro and in vivo experiments that may support the present study mechanistically and provide biological explanations for the results observed here.