Introduction
Glioblastoma (GB, World Health Organization grade IV) is the most common malignant primary brain tumor in adults [1, 2]. Due to its rapid growth and inherent tendency to recur, GB is inevitably fatal within a short time after diagnosis, despite an extensive search for novel treatment modalities [3–5]. The current standard of care (called “Stupp’s regimen”), i.e., maximal extent of surgical resection followed by radiotherapy with concomitant and adjuvant temozolomide chemotherapy, results in a median survival of ~15 months [3, 4, 6]. MGMT methylation is associated with a better response to adjuvant temozolomide (TMZ) and a median overall survival of 22 months [7]. Treatment of refractory tumors is particularly difficult as secondary chemoresistance frequently develops, and no alternative treatment has proven effective thus far [8].
The huge majority of GBs arise de novo and are termed primary, IDH-wild type, which differ from secondary GB having a mutation within IDH1 or IDH2 and resulting from the progression of a lower grade glioma [9]. Almost all GBs feature alterations in three molecular pathways: the RTK/RAS/PI-3K, TP53, and RB1 pathways in 88%, 87%, and 78%, respectively [10]. TP53 mutations are reported in 28% to 37.5% of primary GBs [11, 12]. TP53 promoter methylation, TP53 mRNA level, and TP53 protein overexpression are not related, suggesting that other mechanisms are involved, probably including microRNAs (miRNAs) [13, 14]. TP53 activity is closely associated with miRNAs as it regulates the expression and maturation of several miRNAs, while its expression and function are modified by other miRNAs [15]. MGMT is a key DNA repair enzyme that specifically removes the promutagenic methyl/alkyl group from the O6 position of guanine by transferring it to the cysteine acceptor site on the protein itself and restores the guanine to its normal form without causing DNA strand breaks [8, 16]. Methylation of the O6 position of guanine is the most clinically relevant effect of alkylating agents (as it cannot be repaired by mismatch repair mechanisms), which is directly repaired by MGMT and, therefore, reduced MGMT expression is associated with a better response to alkylating chemotherapy [8, 16]. Methylation of the O6 position of guanine commonly results from MGMT promoter methylation, which is reported in 45% to 70% of GBs [7, 17, 18]. Additionally, Kreth et al. showed that GBs may downregulate MGMT expression independently of promoter methylation by elongation of the 3’-untranslated region of the mRNA, rendering the alternatively polyadenylated transcript susceptible to miRNA-mediated regulation [19].
In the present study, we investigated whether selected miRNAs levels associate with TP53 and MGMT levels in primary glioblastoma patients with special reference to specific alterations in these genes. We analyzed miR-21, miR-34a, and miR-125b as potential regulators of TP53 and miR-648, and miR-181d and miR-125b as potential regulators of MGMT [15, 19–23]. MiR-21 is one of the most frequently overexpressed miRNAs in human GB cell lines [23–25]. Expression of miR-34 family members directly regulates TP53 [26–28]. Expression of miR-34a promotes TP53-mediated apoptosis, cell cycle arrest, and cell senescence, whereas inactivation of endogenous miR-34a strongly inhibits TP53-dependent apoptosis [15]. miR-125b is an important negative regulator of TP53 and TP53-induced apoptosis during development and during the stress response [29]. Additionally, miR-125b confers TMZ resistance by targeting tumor necrosis factor α-induced protein 3 (TNFAIP3) and NF-κB inhibitor interacting RAS-like 2 (NKIRAS2) independently of TP53 and MGMT, suggesting a potential predictive value of this microRNA [30]. miR-181d and miR-648 were identified as the most important post-transcriptional regulators of MGMT in GBs, as miR-181d induces MGMT mRNA degradation, while miR-648 affects MGMT protein translation [19, 31].
Material and methods
Study cohort
We recruited 49 patients (31 males, 18 females) with newly diagnosed glioblastoma multiforme (GBM) from 2006 to 2011. All tumors were histopathologically examined and classified according to the World Health Organization classification of tumors of the central nervous system [32]. Median age at surgery was 63.00 (interquartile range (IQR): 58.00–68.00) years. Formalin-fixed paraffin-embedded (FFPE) samples were collected at the Department of Pathology, Chair of Oncology, Medical University of Lodz, Poland. For details, see Table I. Ethics committee approval was obtained from the Institutional Review Board of the Medical University of Lodz (Number RNN/226/11/KE).
Table I
Study group characteristics. Nominal variables are presented as number followed by percentages and continuous variables are presented as medians followed by interquartile ranges
RNA isolation
Total RNA was extracted from FFPE tissue using the miRNeasy FFPE Kit (Qiagen, Germany) according to the manufacturer’s instructions. The yield and quality (260/280 ratio) of the RNA were measured using a Picodrop spectrophotometer (Picodrop Limited, UK). Purified total RNA was immediately used for cDNA synthesis or stored at –80°C until use.
MGMT and TP53 mRNA quantification
Total RNA (500 ng) was used for cDNA synthesis. We used a QuantiTect Reverse Transcription Kit (Qiagen) and followed the manufacturer’s protocol. The cDNA samples were kept frozen at –20°C.
mRNA expression levels were measured using standard TaqMan Gene Expression Assays (Applied Biosystems, Foster City, CA, USA): tumor protein TP53 (TP53, Hs01034249_m1), methylguanine-DNA methyltransferase (MGMT, Hs01037698_m1), and glyceraldehydes-3-phosphate dehydrogenase (GAPDH, Hs99999905_m1) as the endogenous control. TaqMan PCR assays were performed in 10-μl reactions using 50 ng cDNA, 5 μl KAPA PROBE FAST qPCR Kit Master Mix ABI Prism (Kapa Biosystems), and 0.5 μl of the appropriate TaqMan Gene Expression Assay. All reactions were run in duplicate on a Rotor Gene 3000 Real-Time PCR System (Corbett Life Science) according to the following thermal cycling conditions: 10 min at 95°C and 40 cycles each of 10 s at 95°C and 60 s at 60°C.
TP53 and MGMT expression levels were calculated using the 2–ΔCt method. ΔCt was calculated by subtracting the Ct of the investigated gene from the Ct of the endogenous control. Samples were excluded from further analysis if the Ct difference between duplicates was greater than 1 (treated as experiment error, e.g., degraded RNA). All patients with good quality RNA available (n = 46, 3 patients were found to have degraded RNA) were included in this analysis.
miRNA quantification
Reverse transcription was carried out on 10 ng of total RNA in 15-μl reactions using the TaqMan MicroRNA Reverse Transcription Kit (Applied Biosystems) according to the manufacturer’s instruction. miRNA was quantified using standard TaqMan MicroRNA Assays (Applied Biosystems): hsa-miR-21 (Assay ID: 000397), hsa-miR-34a (Assay ID: 000426), hsa-miR-125b (Assay ID: 000449), hsa-miR-181d (Assay ID: 466352_mat), hsa-miR-648 (Assay ID: 001601), and hsa-miR-103 (Assay ID: 000439) as a control. The 20-μl qPCR included 1.33 μl RT product, 10 μl TaqMan Universal PCR Master Mix and 1 μl TaqMan miRNA Assay (20×). The reactions were incubated in a 96-well plate at 95°C for 10 min, followed by 40 cycles of 95°C for 15 s and 60°C for 1 min. All reactions were run in duplicate.
TaqMan PCR assays were performed on a 7900HT Fast Real-Time PCR System (Applied Biosystems) and analyzed using Sequence Detection System 2.3 software. Fold induction values (RQ) were calculated according to the equation 2–ΔΔCt, where ΔCt represents the differences in the cycle threshold numbers between the target gene and spike-in control, and ΔΔCt represents the relative change in these differences between examined and control groups.
DNA isolation
Genomic DNA was extracted from FFPE tissue using the QIAamp DNA FFPE Tissue Kit (Qiagen) in accordance with the manufacturer’s protocol. The concentration (A260) and purity (A260/A280 ratio) of isolated DNA were determined using a Picodrop spectrophotometer (Picodrop Limited). The DNA was stored at –20°C.
Polymerase chain reaction amplification
Exons 5–8 of the TP53 gene were amplified by polymerase chain reaction (PCR). The purified DNA was used as a template for PCR amplification. The reaction mixture in 20 μl volume contained 50 ng of DNA, 1 U Taq DNA polymerase (Promega, Fitchburg, WI, USA), 1.5 mM MgCl2, 0.25 mM each of dATP, dCTP, dGTP, and dTTP, and 0.5 μM of the primers. The amplification was performed in a GeneAmp PCR System 9700 (Applied Biosystems).
The primer sequences were as follows: for TP53Ex5_6, forward 5′-CACTTGTGCCCTGACTTTCA-3′ and reverse 5′-CTTAACCCCTCCTCCCAGAG-3′ (product of 464 bp); for TP53Ex7, forward 5′-TCATCTTGGGCCTGTGTTATCTC-3′ and reverse 5′-GTGCAGGGTGGCAAGTGG-3′ (product of 163 bp); and for TP53Ex8, forward 5′-CAAGGGTGGTTGGGAGTAGA-3′ and reverse 5′-TGCTAGGAAAGAGGCAAGGA-3′ (product of 331 bp). Thermal cycling conditions for PCR reactions were: “touchdown” protocol for TP53Ex5_6 and TP53Ex8: 94°C for 5 min, 63°C for 45 s, 72°C for 1 min, 1 cycle 94°C for 1 min, 61°C for 45 s, 72°C for 1 min, 34 cycles 94°C for 1 min, 60°C for 45 s, 72°C for 1 min, and 72°C for 10 min; conditions for TP53Ex7 were 94°C for 5 min, 40 cycles 94°C for 30 s, 60°C for 30 s, 72°C for 30 s, and 72°C for 7 min.
Microchip electrophoresis of DNA fragments
The PCR amplification products were separated and analyzed on the automated microchip electrophoresis system MCE-202 MultiNa (Shimadzu, Japan) using the DNA-1000 kit according to the manufacturer’s protocol. A SYBR Gold fluorescent dye for DNA staining (Invitrogen, Carlsbad, CA, USA) and PhiX174 DNA/Hae III Markers (Promega) were used to determine the sizes of the PCR products.
TP53 sequencing analysis
Amplification products were purified using the MiniElute PCR Purification Kit (Qiagen). The sequencing reactions were run using a Big Dye Terminator v1.1 Cycle Sequencing Kit (Applied Biosystems, USA) on the GeneAmp PCR System 9700 using standard sequencing protocols. Sequence analysis was performed using the same primers used in the preamplification step.
The PCR products were purified to eliminate unincorporated primers and dNTPs using the BigDye XTerminator Purification Kit and then subjected to separation by the 3130xl GeneGenetic Analyzer (Applied Biosystems).
IDH1 sequencing analysis
Exon 4, including codon 132 of the IDH1 gene, was amplified by PCR and sequenced using the dideoxy termination method and SequiTherm Excel DNA Sequencing Kit (Epicentre Technologies). The primers used for PCR amplification of the DNA sequences were IDH1 – 5′- GGCACCCATCTTCTGTGTTT-3′ (sense) and 5′-ATATATGCATTTCTCAATTTCA-3′ (antisense). The sequencing primers used were IDH1-exon 4 – 5′-CGGTCTTCA GAGAAGCCATT-3′ (sense) and IDH1 exon 4 – 5′-CA CATTATTGCCAACATGAC-3′ (antisense). A Li-Cor automatic sequencer system was used for the separation and analysis of PCR-sequencing products.
Methylation-specific PCR for TP53 and MGMT promoter methylation analysis
Sodium bisulfite modification of isolated genomic DNA was performed using the CpGenome DNA kit (Chemicon International Inc., Temecula, CA, USA) according to the manufacturer’s protocol. The bisulfite-treated DNA was stored at –80°C until use. CpGenome Universal Methylated DNA was used as a methylation-positive control for the methylated alleles, and DNA from peripheral blood leukocytes was used as the control for unmethylated alleles. The methylation-specific PCR for TP53 promoter methylation was performed as previously described. Methylation-specific PCR for MGMT promoter methylation was performed in a two-step approach as previously reported [13, 17]. For each PCR, methylated and unmethylated DNA was included as positive and negative controls, and water was used as a control for the PCR reaction. PCR products were separated on 3% agarose gels containing ethidium bromide and documented using the Gel Doc 1000 Bio Rad Image System. Repeat testing was performed to confirm the results.
Immunohistochemistry for TP53 and MGMT protein expression
Immunohistochemical overexpression of TP53 was studied using monoclonal antibody anti-TP53 (clone DO-7, 1 : 100 dilution; DAKO, Glostrup, Denmark) and that of MGMT was evaluated using anti-MGMT antibody (clone MT23.2, dilution 1 : 50; Zymed), processed with the EnVision (DAKO) system. The TP53 antibody labels wild-type, which has a very short half-life and is present in small amounts in normal cells, and mutant-type TP53 protein that significantly prolongs the half-life of the protein and is detected by positive staining as product of a point mutation in the TP53 gene. Tumor sections were examined for TP53 immunoreactivity under a microscope at 20× and 40× magnifications. Expression of TP53 was considered positive when the proportion of positive cells was greater than 10% (Figure 1 A) [33]. Negative TP53 staining in tumor sections is presented in Figure 1 B.
Figure 1
A – Immunohistochemically detected TP53 protein overexpression. B – Sample negative for TP53 overexpression. C – Immunohistochemically detected MGMT protein overexpression. D – Sample negative for MGMT overexpression. 200× magnification was used for presentation of all images
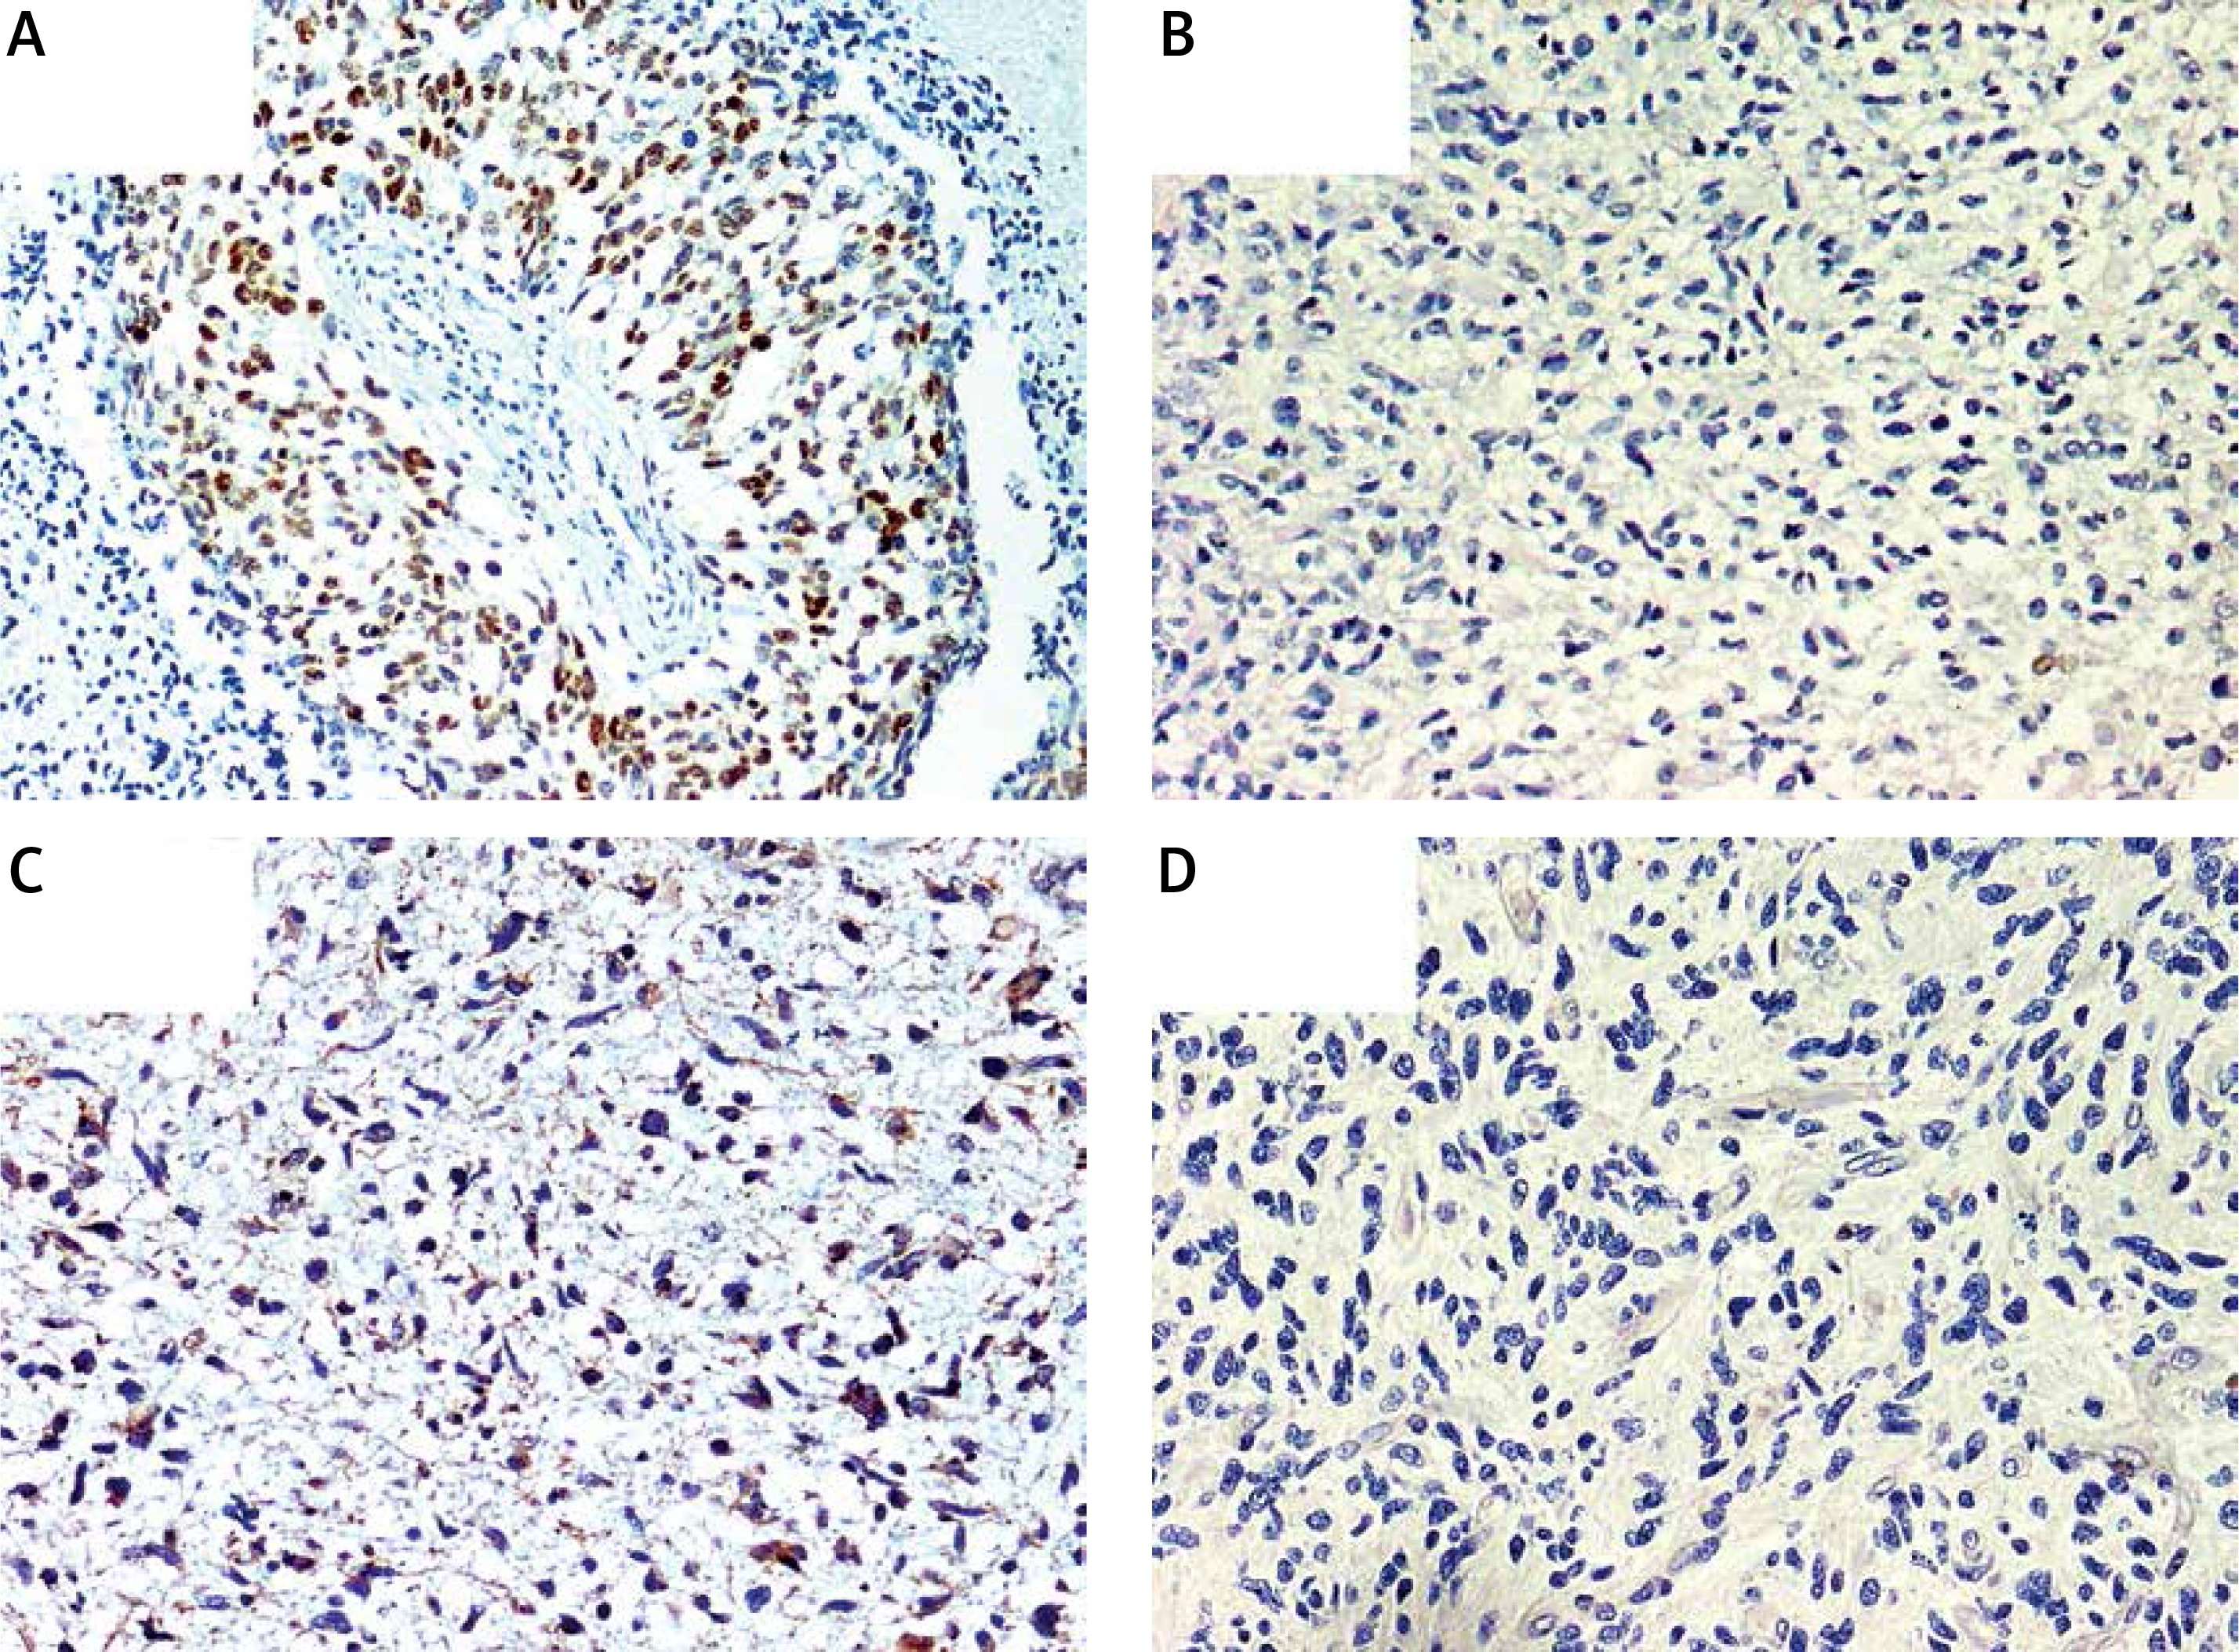
We used MT23.2 antibody due to the best agreement between methylation-specific PCR and immunohistochemistry (IHC) results reported previously [34]. For the semiquantitative immunohistochemical MGMT scoring we applied a cut-off of 15% immunolabeled cells for GBM, based on a prior publication (Figures 1 C, D) [35]. Only nuclear staining was considered for the evaluation. Positive endothelial and lymphocytes cells were considered as internal positive controls.
The IHC results were validated using positive and negative tissue controls in all series of immunostained slides. The positive controls (with tissues containing the target antigen at a known and stable expression level) were performed for validation of TP53 and MGMT on ovarian carcinoma and additionally for MGMT in breast carcinoma. Positive endothelial and lymphocytes cells were considered as internal positive controls. To examine negative control staining, neoplastic tissue slides were evaluated using mouse isotype antibody Ready-to-Use FLEX Negative Control Mouse (Cocktail of mouse IgG1, IgG2a, IgG2b, IgG3 and IgM, IR750, DAKO, Denmark).
Statistical analysis
Continuous variables are presented as medians followed by IQR, while nominal variables are presented as numbers followed by percentages in brackets. The Shapiro-Wilk test was used for the distribution assessment. Grubbs’ test was used to detect outliers. Continuous variables were compared using the Mann Whitney U-test due to the non-normal distribution. Spearman’s rank test was used for correlation assessment. Differences between categorical variables were evaluated using the χ2 or two-tailed Fisher’s exact test. The statistical analysis was exploratory, which is why we did not perform post-hoc corrections for multiple testing. For the outcome analyses, overall survival was defined as the time period from diagnosis to last follow-up, with censoring of live patients at the last follow-up. Overall survival data are presented as Kaplan-Meier survival curves and compared within subgroups using the log-rank test. Cox hazards regression analyses of overall survival adjusted for age were performed for each variable. The Statistica 12.5 PL package (StatSoft, Tulsa, OK, USA) was used for the analysis. P-values < 0.05 were considered statistically significant.
Results
Molecular characteristics of the study group
Twelve (24.49%) patients carried TP53 mutations, of which 5 were detected in exon 5, 2 in exon 6, another 2 in exon 7, and 3 in exon 8 of TP53. TP53 promoter methylation was detected in 4 (8.16%) patients. No association between TP53 mutations and TP53 promoter methylation was detected (p = 1.00). TP53 protein was overexpressed in 20 (40.82%) patients. Quantification of TP53 mRNA was successful among 41 (83.67%) patients. TP53 mRNA levels were lower in tumor samples than in samples from normal brain. The TP53 mRNA level tended to be higher in patients with IHC-detected TP53 overexpression than in patients without TP53 protein overexpression (p = 0.048, Figure 2 A). Neither TP53 mutations nor promoter methylation affected the TP53 expression levels (p = 0.846 and p = 0.9384).
Figure 2
A – TP53 mRNA level according to TP53 immunohistochemically detected overexpression status; B – MGMT mRNA level according to MGMT promoter methylation status
Bolded bars represent median and whiskers indicate interquartile ranges. Dots represent row data.
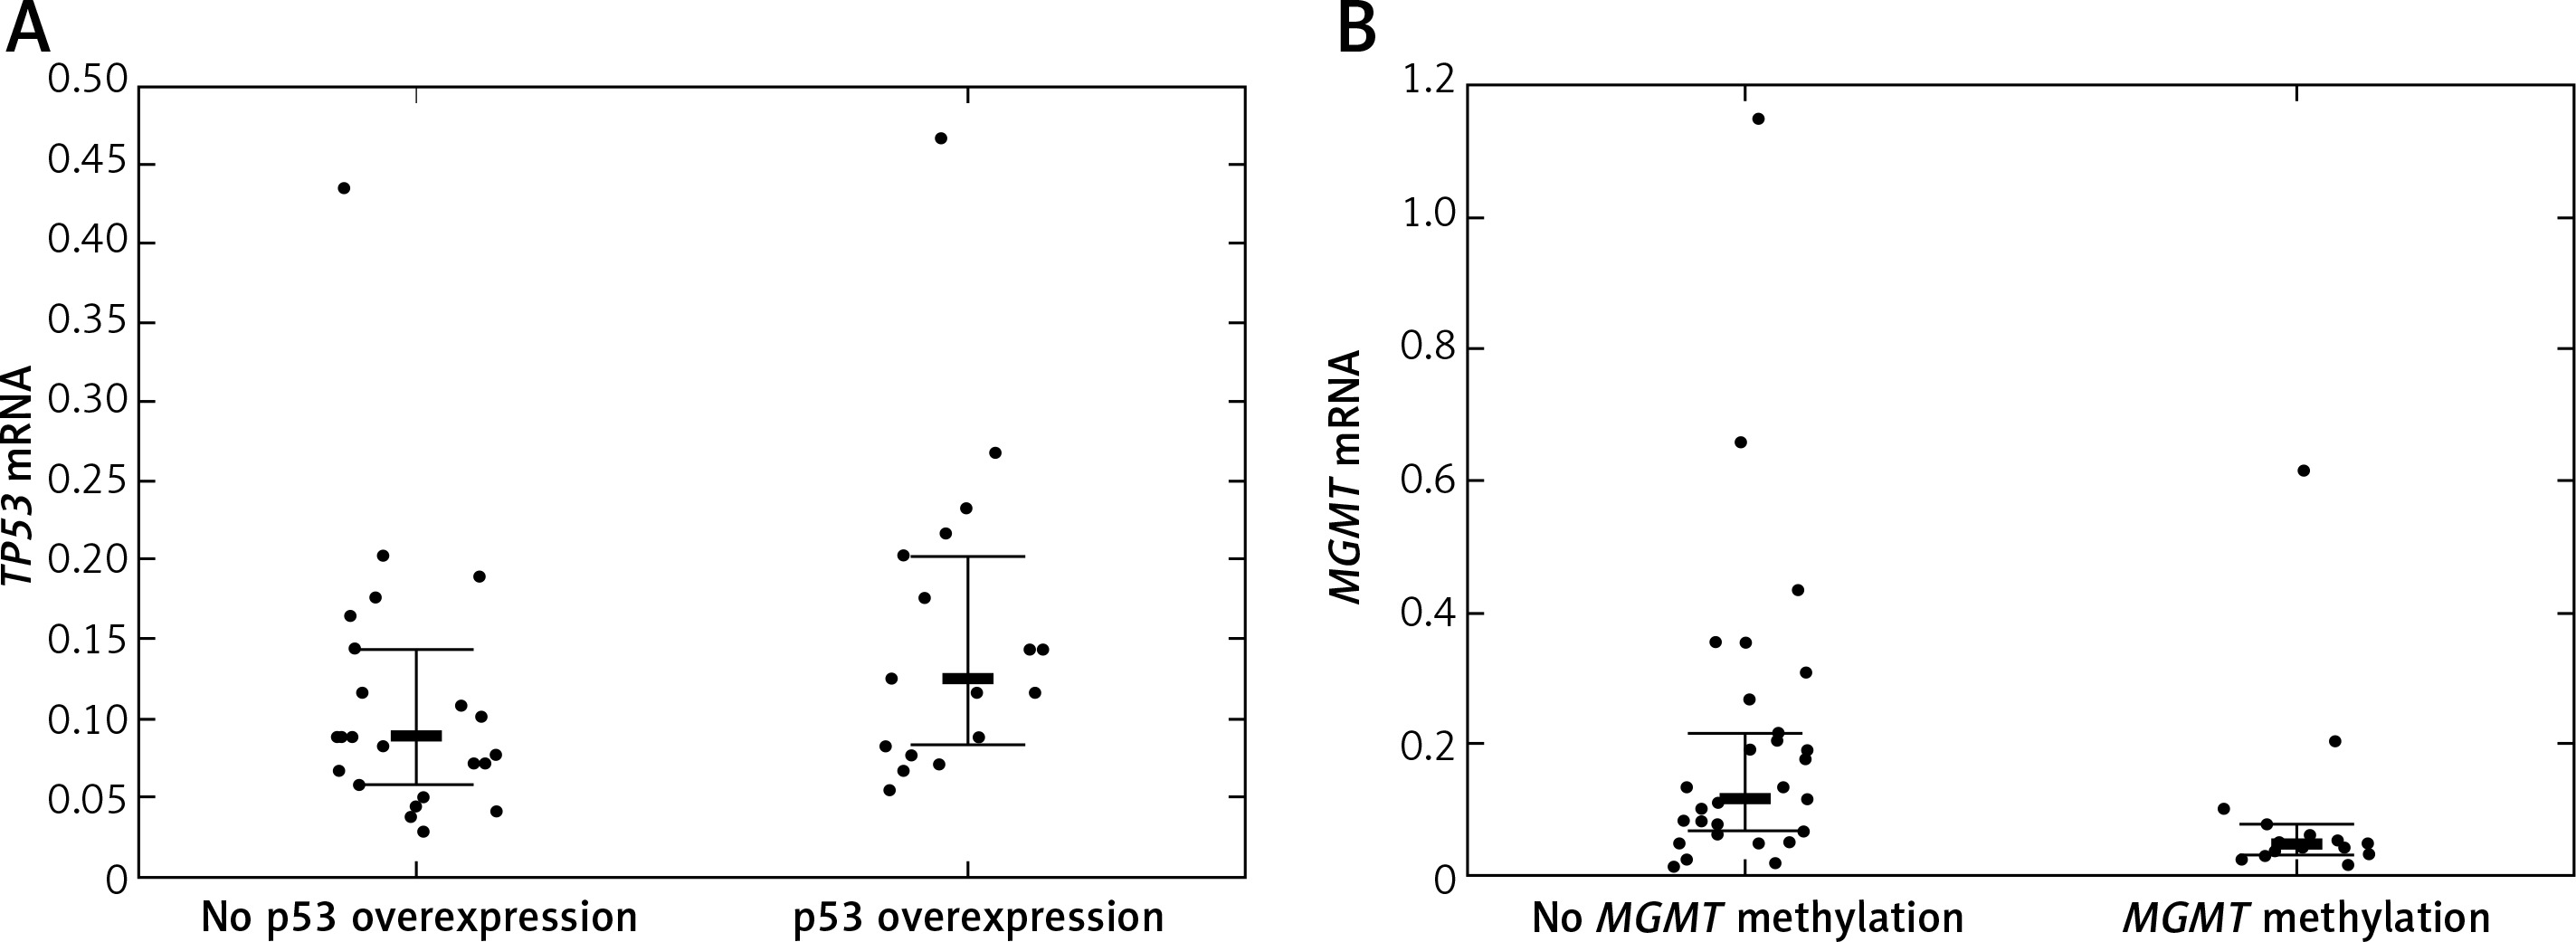
MGMT was methylated in 19 (38.78%) cases. IHC-detected MGMT overexpression was found in 17 (34.69%) patients. MGMT mRNA was quantifiable in 45 (91.84%) patients. MGMT expression tended to be lower in patients with MGMT methylation than in patients without MGMT methylation (p = 0.0242, Figure 2 B). IHC-detected MGMT overexpression was not associated with elevated MGMT mRNA levels (p = 0.0645). MGMT mRNA levels were higher in tumor tissue samples than in normal tissue samples.
We detected no IDH1 mutations. Nine (18.37%) patients carried none of the investigated molecular lesions.
Association between selected miRNAs and mRNA levels of TP53 and MGMT
MiRNA quantification was applicable among 48 (97.96%) patients included in the analyses. The levels of all but miR-125b were higher in tumor samples than in control normal brain tissue.
There were no significant correlations between miRNAs and TP53 mRNA levels in the whole group (p > 0.05 for all comparisons). miR-34a and TP53 expression levels were negatively correlated in patients with IHC-detected TP53 overexpression (r = –0.56, p = 0.0195). The levels of miR-34a were higher in patients without TP53 mutations than in patients with TP53 mutations (p = 0.0051). In addition, TP53 and miR-21 expression levels were negatively correlated in patients with TP53 mutations (r = –0.67, p = 0.0330).
We found no significant correlations between MGMT mRNA and selected miRNA levels in the whole study group (p > 0.05 for all comparisons). MGMT and miR-648 expression levels were, however, negatively correlated in patients with MGMT methylation (r = –0.61, p = 0.0269). Additionally, MGMT and miR-125b were negatively correlated in patients without MGMT methylation (r = –0.34, p = 0.0727). The negative correlation between MGMT mRNA and miR-181d was close to significant (r = –0.27, p = 0.0760). The miR-21 level was lower in patients with MGMT methylation than in patients without MGMT methylation (p = 0.0391).
Survival analyses
We recorded 47 deaths and median (IQR) overall survival was 9.00 (3.00–14.00) months (Table I). None of the investigated molecular alterations affected overall survival in the univariate analysis and only age at diagnosis affected the prognosis (p = 0.0295). The Cox proportional hazards regression analyses of each molecular variable adjusted for age at diagnosis showed no prognostic effect.
Discussion
In the present study, we investigated whether TP53 and MGMT expression levels were associated with the levels of preselected miRNAs, and found that the associations may be revealed in a specific molecular setting (i.e., mutation or methylation).
This analysis was performed in a representative group of 49 adult GB patients undergoing standard treatment and close follow-up. The IDH1R132H mutation was excluded by sequencing all patients, confirming that all tumors could be considered primary GBs [1]. We investigated the associations between selected miRNAs and TP53 and MGMT levels at both the mRNA and protein levels.
We observed lower expression of miR-34a in GB patients with a TP53 mutation than in those without a mutation, consistent with previous reports [26, 36, 37]. Furthermore, in patients with a nuclear accumulation of TP53, which is usually associated with a mutation [38, 39], miR-34a expression was negatively correlated with TP53 mRNA levels. In contrast with previous reports, however, we detected higher miR-34a expression in tumor tissue than in normal tissue [36, 37]. Gao et al. and Ren et al. indicated a potential prognostic role of miR-34a in GB, but such an association was not observed in this group [37, 40]. Additionally, we detected a negative correlation between miR-21 and TP53 mRNA levels in patients with TP53 mutations, in accordance with the report by Mraz et al. [41]. We observed higher expression of this miRNA in tumor tissues than in normal tissues, which has been reported for many solid tumors, including GB [42–46]. Some authors postulate miR-21 as a negative prognostic marker, but this was not confirmed in the present study [46, 47].
MGMT can be cooperatively downregulated by miR-181d and miR-648 at the post-transcriptional or translational level [19, 31, 48]. We detected a negative correlation between MGMT expression and miR-648 in patients with MGMT promoter methylation. Similarly, Kushwaha et al. reported that transfection with miR-648 did not consistently affect MGMT expression [48]. Additionally, we observed a negative correlation between MGMT mRNA and miR-181d. Although this finding was not statistically significant, it supports the previous report that miR-181d may induce MGMT mRNA degradation [19]. This miRNA was also suggested by Zhang et al. to be a potential negative prognostic factor in GB, but we did not observe such an association in this group [31].
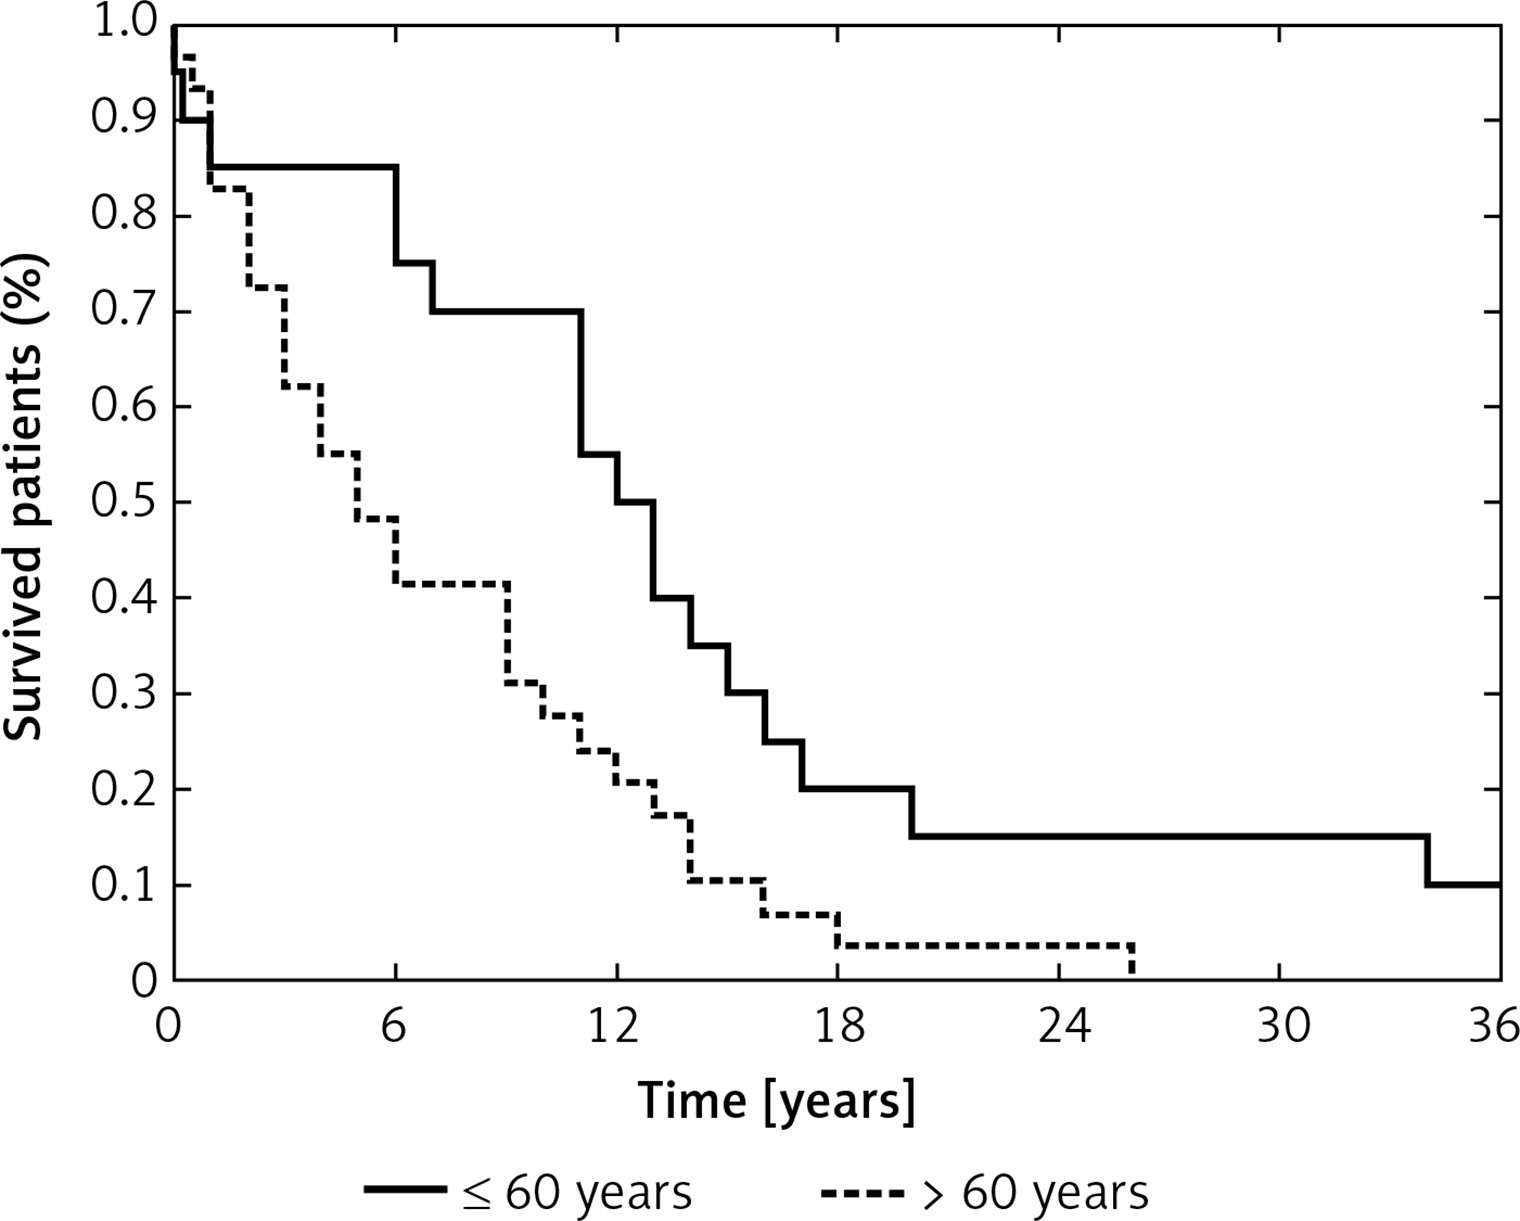
Age at diagnosis is considered a key prognostic factor in GB patients, which was also apparent in our study – patients older than 60 years had worsened overall survival compared with younger patients (p = 0.0099, Figure 3) [1, 49, 50]. We also analyzed the effect of molecular lesions inactivating TP53 and MGMT on overall survival, but those analyses showed no prognostic value of any of the examined variables, including the levels of selected miRNAs. Taking into consideration that previous reports indicated the prognostic impact of the molecular characteristics of GBs, we think that our analysis could have been underpowered and plan to extend our study group in the future.
Figure 3
Probability of overall survival in the study group according to age at diagnosis (≤ 60 years vs. > 60 years) (p = 0.0099)
In this paper, we also corroborated the previous findings of no relation between TP53 promoter methylation and TP53 mRNA expression or nuclear protein accumulation [14]. Additionally, TP53 expression was not associated with TP53 mutations.
When conducting the study and analyzing the data, we encountered two problems that could have influenced our final conclusions. First, we did not have fresh frozen tissue for the DNA and RNA isolation and in 4 patients the FFPE material was degraded. Nevertheless, we consider the expression levels detected in the other patients robust, as we used the standard methodology, which was found to be optimal previously [51, 52]. Second, the study group consisted of 49 GB patients and some analyses (especially the survival analyses) could have been underpowered. Additional investigation in a larger group is intended.
In conclusion, the MGMT and TP53 alterations are major features in GB pathogenesis that affect the survival of patients with primary GB. We demonstrated that miR-21, miR-34a, miR-125b, miR-181d, and miR-648 can be considered good indicators of TP53 and MGMT function in GB patients; however, other mechanisms of inactivation should be taken into consideration in subsequent studies investigating this important issue.