Introduction
Cardiovascular disease (CVD) is considered to be the major cause of death globally [1]. Several risk factors, such as smoking, dyslipidemia, hypertension, obesity, a sedentary lifestyle, and ethnicity, are closely related to CVD risk [1]. It is worth mentioning that up to 90% of CVD cases may be preventable by considering behavioral risk factors [2]. Furthermore, CVD is closely linked with diet and dietary factors [3]. Omega-6 (or n-6) polyunsaturated fatty acids (PUFAs) play an important role in a wide range of physiological functions [4]. In this context, linoleic acid (LA, 18:2, n-6), the shortest-chained omega-6 fatty acid, is an essential fatty acid since it is not synthesized by the human body and must be obtained through the diet [5] (e.g. vegetable oils, nut oils, poultry, meet, egg, milk, and margarines [6]). Adrenic acid (AA, 22:4, n-6) is another omega-6 PUFA, which can be synthesized from LA in the human body [7, 8].
There is increasing evidence on the possible effects of omega-6 PUFAs on CVD risk [9–12]. Indeed, an inverse relationship between omega-6 PUFAs intake and CVD risk was reported in a meta-analysis of observational studies (n = 25 case-control studies with 1,998 cases and 6,913 controls); circulating and tissue LA levels were inversely related to coronary heart disease (CHD) risk [9]. In contrast, no significant link was found between AA and CHD risk in another study [9]. The effect of dietary LA consumption on CHD was also assessed in another meta-analysis including 13 prospective cohort studies with 310,602 individuals and 12,479 CHD events (5,882 CHD deaths); it was showed that a 5% energy increment in LA intake, replacing energy from saturated fat, was associated with a 9% lower risk of CHD events [10]. A pooled analysis of 11 cohort studies (n = 344,696; 5,249 coronary events and 2,155 coronary deaths) also showed a significant negative association between PUFAs and the risk of CHD events (hazard ratio (HR) = 0.87; 95% confidence intervals (CI): 0.77–0.97) and CHD mortality (HR = 0.74; 95% CI: 0.61–0.89) [9]. In the next study, the replacement of saturated fat with omega-6 PUFAs significantly reduced total cholesterol (TC) (by 19%), low-density lipoprotein cholesterol (LDL-C) (by 22%) and high-density lipoprotein cholesterol (HDL-C) (by 14%) in a small group (n = 29) of healthy free-living nutrition students [10]. Another RCT found that omega-6 PUFAs beneficially affected blood lipids; each 5% of PUFA replacing saturated fatty acids (SFA) lowered LDL-C by 10 mg/dl, as well as the TC:HDL-C ratio by 0.16 [13].
Even though some studies support a beneficial effect of omega-6 PUFAs on CVD risk, there are mainly observational studies that report conflicting results. In this context, in the Sydney Diet Heart Study, an RCT of 458 participants aged 30–59 years with a recent coronary event, the replacement of saturated fats with LA significantly increased all-cause mortality (HR = 1.62; 95% CI: 1.00–2.64, p = 0.05), CHD mortality (HR = 1.74; 95% CI: 1.04–2.92, p = 0.04) and CVD mortality (HR = 1.70; 95% CI: 1.03–2.80, p = 0.04) [14]. A Cochrane review found no significant association between either increased or decreased omega-6 PUFA intake and CVD risk factors [15]. Similarly, a meta-analysis of 32 observational studies and 27 RCTs reported no correlation between omega-6 PUFA supplementation and CHD [16]. From a pathophysiological point of view, the production of prostaglandins and leukotrienes is increased following diets rich in omega-6 PUFAs, and since prostaglandins and leukotrienes exert proinflammatory effects, this might negatively affect CVD risk [5, 17].
The interpretation of the results from single studies is limited by sample size, research design (including dose) and participant characteristics (gender, ethnicity, age, etc.), thus being underpowered to provide a comprehensive and reliable conclusion. A meta-analysis overcomes these limitations by increasing the sample size and the power of the study. Furthermore, in observational studies, the possibility of residual bias, confounding factors and reverse causation cannot be ruled out. A Mendelian randomization (MR) approach can circumvent these limitations (13). Taking all these factors into consideration, along with the paucity of data and the conflicting findings, we aimed to perform an up-to-date meta-analysis of RCTs on the association between omega-6 PUFA supplementation and CVD risk. Furthermore, an MR analysis was carried out on the recognized single nucleotide polymorphisms (SNPs) of serum omega-6 PUFA – AA, and its causal impact on cardiometabolic risk factors. Finally, we applied trial sequential analysis (TSA) to determine whether the pooled clinical trial data provided sufficient evidence to reach a reliable conclusion regarding the effects of omega-6 PUFA supplementation on studied outcomes.
Material and methods
Systematic review and meta-analysis
Literature search strategy
The present meta-analysis was conducted according to the Preferred Reporting Items for Systematic Reviews and Meta-Analyses (PRISMA) Guidelines [18, 19]. The primary exposure of interest was omega-6 PUFA supplementation, while the primary outcome of interest was CV health following treatment with omega-6 PUFA supplementation. We searched multiple databases, including PubMed/Medline, Cochrane Central Register of Controlled Trials (CCTR), Cochrane Database of Systematic Reviews (CDSR), Web of Science and www.clinicaltrials.gov register until September 2019. This was accompanied by a hand search of the reference list of eligible articles and email correspondence with authors for additional data where relevant.
Selection criteria
We included all RCTs evaluating the effect of omega-6 PUFA [LA, AA, dihomo-γ-linolenic acid (DGLA), γ-linolenic acid (GLA)] supplementation on the outcomes of interest. Eligible studies had to meet the following criteria: (1) an RCT with either parallel or crossover design, (2) studies of patients treated with long-chain omega-6 PUFA supplementation compared with a control group (either with no omega-6 supplementation or placebo), and, (3) containing sufficient information on the primary outcomes at the end of follow-up in each group, with at least 2 years of follow-up duration and having a sample size of at least 100. Exclusion criteria were: (i) non-clinical studies, (ii) observational studies with case-control, cross-sectional or cohort design, (iii) sample size < 100 participants, and, (iv) duration of treatment < 2 years. Narrative reviews, comments, opinion papers, methodological papers, editorials, letters or any other publications lacking primary data and/or explicit method descriptions were also excluded.
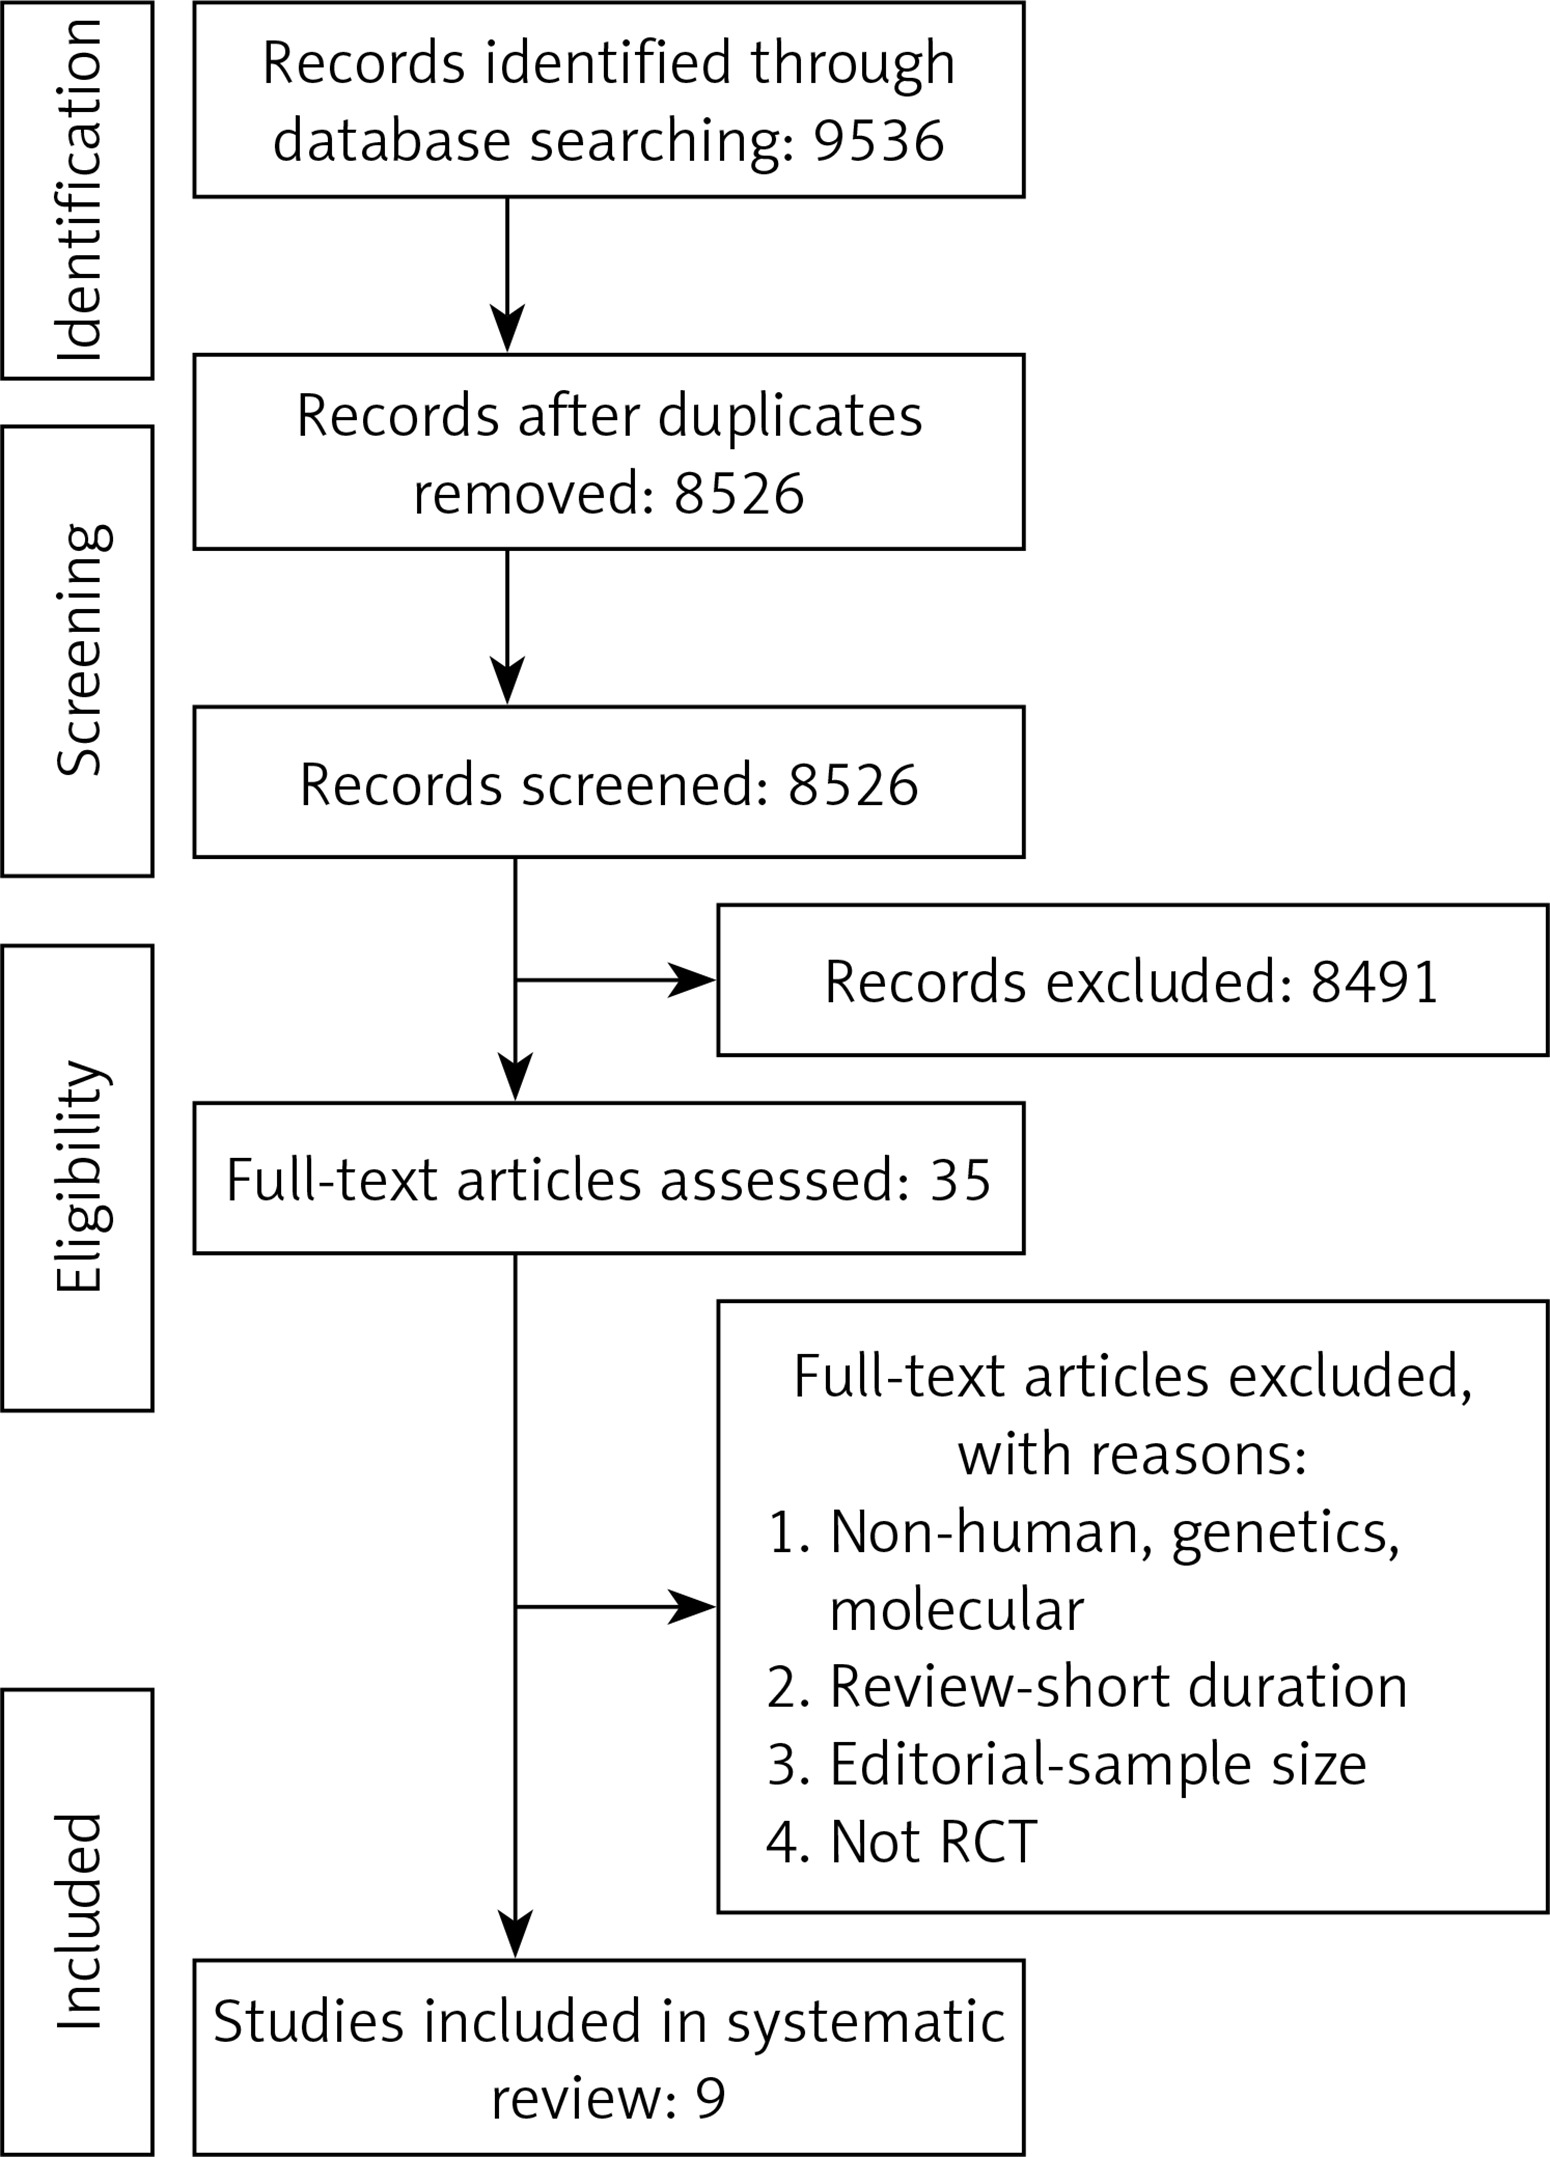
Study selection started with the removal of duplicates; titles and abstracts were screened by two reviewers (MM and NS). To avoid bias, they were blinded to the names, qualifications or the institutional affiliations of the study authors. The agreement between the reviewers was excellent (κ index: 0.90; p < 0.001). Disagreements were resolved at a meeting between reviewers prior to selected articles being retrieved (the flow chart is presented in Figure 1).
Data extraction and management
The full text of studies meeting the inclusion criteria was retrieved and screened to determine eligibility by two reviewers (MM, NS). Following assessment of methodological quality, the same two reviewers extracted data onto a purpose-designed data extraction form, and independently summarized what they considered to be the most important results from each study. These summaries were compared and any differences of opinion were resolved by discussion and consultation with the remaining co-authors of the paper. Any further calculations on study data considered necessary were conducted by the first reviewer (MM) and checked by the second reviewer (NS). Descriptive data extracted included the name of the study, year of publication, country of origin, study design, status, number of participants, percent of women, intervention, supplemented dose of omega-6 PUFAs, follow-up duration and reported outcome.
Quality assessment
A systematic assessment of bias in the included RCTs was performed using the Cochrane criteria [20]. The items used for the assessment of each study were the following: adequacy of random sequence generation, allocation concealment, blinding of participants, personnel and outcome assessment, handling of drop-outs (incomplete outcome data), selective outcome reporting, and other potential sources of bias. According to the recommendations of the Cochrane Handbook [21], a judgment of ‘yes’ indicated low risk of bias, while ‘no’ indicated a high risk of bias. Labeling an item as ‘unclear’ indicated an unclear or unknown risk of bias.
Data synthesis
Based on the recommendations of the Cochrane Handbook [21], for each RCT we used the number of events (at the end of the study) and the sample size for the treatment and control group separately to calculate the risk ratio. A random effects model (using the DerSimonian-Laird method) and the generic inverse variance method (IVM) were used to compensate for the heterogeneity of the studies in terms of study design and demographic characteristics of the studied populations [21]. Heterogeneity was quantitatively assessed using the I2 index. In order to evaluate the influence of each study on the overall effect size, sensitivity analysis was conducted using the leave-one-out method, i.e. removing one study each time and repeating the analysis [21].
To reduce the risk of type I error caused by pooling data from the same trials or from trials with missing data, TSA was applied. Interim analysis of a single RCT avoids type I error by creating monitoring boundaries for an estimated difference between groups; if the estimated difference is reached, the trial can be terminated. TSA uses a similar accurate method to create monitoring boundaries and estimate the optimal sample size in meta-analyses. TSA performs a cumulative meta-analysis with the results of the available studies (represented by the Z-curve): as each new study is included, significance is tested and CIs are estimated. It also creates adjusted boundaries for benefit, harm, and futility, and estimates the optimal sample size for a given difference between treatment arms, so that a smaller estimated difference would result in wider boundaries and a greater optimal sample size. If one of the boundaries (benefit, risk or futility) or if the optimal sample size is reached, firm conclusions might be made (for that predefined difference) and further studies are deemed unnecessary. In contrast, if no boundaries are reached, further studies are needed to settle the question.
Random errors were accounted for by calculating a diversity-adjusted required information size, which represented monitoring boundaries to determine whether the evidence in our cumulative meta-analysis was sufficient to reach a conclusion. It was also adjusted for the variability between trials and for the amount of available evidence. The required sample size for the TSA was estimated using two-side testing, α = 0.05 (two-sided), β = 0.20 (power of 80%), the incidence rate in the control group, and 20% relative risk reduction (RRR) in the omega-6 PUFA intervention group. TSA was conducted using the TSA version 0.9 beta (Copenhagen Trial Unit, Copenhagen, Denmark; available at www.ctu.dk/tsa).
MR analysis
Study design
A two-sample MR study design was used, in which summary statistics from different genome wide association studies (GWAS) were analyzed for the exposures and outcomes, to estimate the effects of exposure on outcome [22]. Essentially, we applied genetic predictors of serum AA to extensively genotyped case-control studies of CHD events and serum concentrations of TC, LDL-C, HDL-C, triglycerides (TG) and fasting blood glucose (FBG) to obtain estimates of the association of exposure to our clinical outcomes.
Genetic predictors of exposures
We retrieved summary data for the association between SNPs and circulating AA levels from the CHARGE meta-GWAS (n = 8,866 adults of European descent) [23].
Genetic predictors of outcomes
Genetic associations with CHD were obtained from the largest publicly available extensively genotyped CHD case (n ≤ 76,014)-control (n ≤ 264,785) study based on a meta-analysis with the use of double genomic-control-correction of the CARDIoGRAMplusC4D 1000 Genomes case (n = 60,801)-control (n = 123,504) study (a meta-analysis of GWAS of CHD case-control studies of people of mainly European descent (77%) imputed using the 1000 Genomes phase 1 v3 training set with 38 million variants) [24]. The study interrogated 9.4 million variants and included 60,801 CHD cases and 123,504 controls, the UK Biobank SOFT CHD study (cases n = 10,801, controls n = 137,371), and 2 small case (n = 4,120)-control (n = 3,910) studies from Germany and Greece [24]. CHD case status encompassed a diagnosis of myocardial infarction (MI), acute coronary syndrome (ACS), chronic stable angina or coronary stenosis [25]. Diagnoses were based on clinical diagnosis, procedures (coronary angiography results or bypass surgery), use of medications or symptoms that indicate angina, as well as self-report of a doctor diagnosis, as described elsewhere [24, 25]; more information on medical records, clinical diagnosis and procedures that indicate CHD and MI can be found elsewhere [24, 25]. This study also used double-genomic control [25].
GWAS results in persons of mostly European ancestry were obtained from the Global Lipid Genetics Consortium (GLGC) (up to 188,577 individuals) for plasma lipids [26]. They included rigorous quality control, imputation to the 1000 Genomes Project panel and adjustments for age and population structure. Individuals of European descent from 47 studies genotyped with different GWAS arrays (n = 94,595) or on the Metabochip array (n = 93,982) with imputation to the 1000 Genomes Project reference were studied. In most included studies, blood lipid levels had been measured after > 8 h fasting. Participants on lipid-lowering medications were excluded. Traits were adjusted for age, age-squared, sex and principle components, as well as quantile-normalized within each cohort. For genetic association analysis by linear regression, lipid levels were inverse normal-transformed and cohort-wise results combined in a fixed effect meta-analysis [26].
For FBG, we used two large GWAS conducted by the MAGIC consortia, which identified multiple genetic loci associated with FBG markers [27]. All participating cohorts (n = 21) in the meta-analyses were of European ancestry [27]. In these meta-analyses, 46,186 individuals without diabetes mellitus were included. A SNP that highly correlated (R 2 > 0.99) with the original SNP was used as a proxy when the original SNP was not available for outcomes.
Genetic associations with stroke were obtained from the largest available extensively genotyped dataset, METASTROKE, a collaboration of the International Stroke Genetics Consortium, which brings together genome-wide data on a total of 34,217 ischemic stroke (IS) cases and 404,630 controls of European ancestry from across 15 studies [28]. The majority of IS cases had brain imaging confirmation. Additional phenotype descriptions and details of individual studies, including data collection and genetic data quality control procedures, are reported elsewhere [28].
Ethics
This investigation uses published or publicly available summary data. No original data were collected for this manuscript. Ethical approval for each of the studies included in the present analysis can be found in the original publications (including informed consent from each participant). The study conforms to the ethical guidelines of the 1975 Declaration of Helsinki.
Statistical analysis
We combined the effect of instruments using the inverse variance weighted (IVW) method as implemented in the TwoSampleMR package running under R. Heterogeneity was assessed using the Q value for IVW. To address the potential effect of pleiotropic variants on the final effect estimate, we performed sensitivity analysis including weighted median (WM) and MR-Egger. Sensitivity analysis was conducted using the leave-one-out method to identify instruments that might drive the MR results. The WM estimate provides correct estimates as long as SNPs accounting for ≥ 50% of the weight are valid instruments. Inverse variance is used to weight the variants and bootstrapping is applied to estimate the CIs [22]. MR-Egger is able to make estimates even under the assumption that all SNPs are invalid instruments, as long as the assumption of instrument strength independent of direct effect (InSIDE) is satisfied [22]. However, the InSIDE assumption cannot be easily verified. Average directional pleiotropy across genetic variants was assessed from the p-value of the intercept term from MR-Egger [22]. Causal estimates in MR-Egger are less precise than those obtained by using IVW MR [29]. Analysis using MR-Egger has a lower false-positive rate, but a higher false-negative rate, than IVW, i.e. it has lower statistical power [30].
Heterogeneity between individual genetic variant estimates was assessed using the Q′ heterogeneity statistic [31] and the MR pleiotropy residual sum and outlier (MR-PRESSO) test [31]. The Q′ statistic uses modified 2nd order weights that are a derivation of a Taylor series expansion, taking into account the uncertainty in both the numerator and the denominator of the instrumental variable ratio [31]. The MR-PRESSO framework detects effect estimates that are outliers and removes them from the analysis by regressing the variant-outcome associations on variant-exposure associations. A global heterogeneity test is then implemented to compare the observed distance between residual sums of squares of all variants to the regression line with the distance expected under the null hypothesis of no pleiotropy [32].
Furthermore, the MR robust adjusted profile score (RAPS) was applied. This method can correct for pleiotropy using robust adjusted profile scores. We consider as results causal estimates that agreed in direction and magnitude across MR methods, passed nominal significance in IVW MR, and did not show evidence of bias from horizontal pleiotropy using heterogeneity tests. All analyses were done using the R software (version 3.4.2 R Core Team, 2017). To assess the instrumental variable analysis “exclusion-restriction” assumption, we used Ensembl release (http://useast.ensembl.org/index.html), which contains a database of SNP phenotypes.
Results
Systematic review and meta-analysis
Summary of searches and study selection process
Study selection was performed based on the PRISMA guideline (Figure 1); a total of 9,536 unique citations were identified, of which 8,526 records remained after removing duplicates. After screening titles and abstracts, 35 articles remained for further evaluation, of which 9 studies with 4,433 participants were finally included in the meta-analysis (Figure 1).
Risk of bias assessment
There is an unclear risk of bias in some of the items including allocation concealment, blinding of participants and personnel. Details of the quality of bias assessment are shown in Table I.
Table I
Quality of bias assessment of the included studies according to the Cochrane guidelines
| Studies | Random sequence generation | Allocation concealment | Selective reporting | Blinding of participants and personnel | Blinding of outcome assessment | Incomplete outcome data | Other bias |
|---|---|---|---|---|---|---|---|
| Bates, 1977 [37] | L | U | L | H | L | H | L |
| Bates, 1978 [38] | H | H | H | L | H | L | H |
| Black, 1994 [35] | U | U | L | U | L | U | L |
| Burr, 1989 [39] | H | U | L | H | H | L | L |
| Houtsmuller, 1979 [40] | L | L | H | U | U | H | L |
| Morris, 1968 [33] | H | L | U | H | L | L | H |
| Woodhill, 1978 [41] | L | H | U | L | H | U | L |
| Daytos, 1969 [36] | L | U | H | L | L | H | L |
| Vijayakamar, 2014 [34] | H | L | L | U | L | H | L |
Characteristics of the included studies
Key characteristics of the 9 RCTs are shown in Table II. The included studies have been published between 1968 [33] and 2014 [34], involving different countries, i.e. the United States of America (2 studies) [35, 36], the UK (4 studies) [33, 37–39], India (1 study) [34], the Netherlands (1 study) [40] and Australia (1 study) [41]. A total of 4 studies presented sex-specific results [33, 36, 39, 41], and 4 studies involved both men and women [34, 35, 38, 40]. The sample size of studies ranged from 102 (40) to 2,033 (39). The mean age of participants ranged from 48.9 (41) to 65.5 (36) years. The maximum follow-up duration of studies was 8 years (36).
Table II
Key characteristics of randomized controlled trials included to the meta-analysis
| Author, year of publication | Country | Study design | Status | Sample size | Gender (% women) | Mean age [years] | Intervention | Supplemented dose of omega-6 | Follow-up duration | Reported outcome |
|---|---|---|---|---|---|---|---|---|---|---|
| Bates et al., 1977 [37] | UK | Parallel, double-blind, randomized controlled trial (RCT) | With chronic progressive multiple sclerosis | 152 | – | – | Naudicelle oil | Group A: 0.6 ml of oil, 360 mg linolenic, 3.42 g linoleic Group C: 11.5 g/day linoleic | 2 years | All-cause mortality |
| Bates et al., 1978 [38] | UK | Parallel, double-blind RCT | With acute remitting multiple sclerosis | 116 | Both genders (69%) | – | Naudicelle oil | Group A: 2.92 g linoleic, 0.34 g γ-linolenic Group C: 23 g/day linoleic | 2 years | All-cause mortality |
| Black et al., 1994 [35] | USA | Parallel, double-blind RCT | With nonmelanoma skin cancer | 133 | Both genders (39%) | 51.5 | Dietary advice | Total fat 20% (omega-6 and total polyunsaturated fatty acids (PUFAs) | 2 years | All-cause mortality, cardiovascular (CV) mortality, body weight |
| Burr et al., 1989 [39] | UK | RCT (diet and reinfarction trial) | After an MI | 2033 | Men only | 56.6 | Dietary advice | Reduce fat intake to 30%, increase polyunsaturated (using polyunsaturated oils and margarine) | 2 years | All-cause mortality, CV mortality, any CV event, coronary heart disease (CHD), fatal or non-fatal myocardial infarction (MI), angina, major adverse cardiac and cerebrovascular events (MACCEs), fatal or non-fatal stroke, heart failure (HF), peripheral arterial disease (PAD), total cholesterol (TC), high-density lipoprotein (HDL), other serious events |
| Houtsmuller et al., 1980 [40] | Netherlands | RCT | With newly diagnosed diabetes | 102 | Both genders (44%) | – | Dietary advice | Total fat 40%, one-third linoleic acid, increase ~9% energy of LA | 72 months | CV mortality, CHD, fatal or non-fatal MI or angina, TC, triglycerides |
| Morris et al., 1968 [33] | UK | Parallel RCT | Survived a first MI | 393 | Men only | – | Dietary advice + soya oil | Increase 84 g/day soya oil (50% LA, 58% PUFA), reduce dietary fat to 35 g/day | 4 years | All-cause mortality, CV mortality, any CV event, CHD, fatal or non-fatal MI, angina, fatal or non-fatal stroke, sudden cardiac death, HF, body weight, systolic and diastolic blood pressure, TC |
| Woodhill et al., 1978 [41] | Australia | Parallel RCT | With previous MI | 458 | Men only | 48.9 | Dietary advice | Increase 6.6% energy PUFA, most of which omega-6 Saturated fatty acids10%, PUFA 15% | 4.3 years | All-cause mortality, CV mortality, any CV event, CHD, fatal or non-fatal MI, angina, fatal or non-fatal stroke, TC, triglycerides, body mass index, systolic and diastolic blood pressure |
| Dayton et al., 1969 [36] | USA | Parallel RCT | Men living at the veterans administration center | 846 | Men only | 65.5 | Dietary advice | Two-third of SFA replaced by unsaturated fats (corn, soybean, safflower, cottonseed oils), 12% energy of PUFA, 4% energy of LA | 8 years | All-cause mortality, CV mortality, any CV event, CHD, fatal or non-fatal MI, angina, fatal or non-fatal stroke, MACCEs, sudden cardiac death, PAD, TC |
| Vijayakamar et al., 2014 [34] | India | Parallel RCT | With stable coronary artery disease | 200 | Both genders (6.5%) | 59.0 | Food (cooking oil) provided | 15% from sunflower oil 15% energy omega-6 | 2 years | All-cause mortality, revascularization-angioplasty or coronary artery bypass grafting, TC, triglycerides, HDL, low-density lipoprotein (LDL) |
Pooled estimate of the effect of omega-6 PUFA supplementation on outcomes of interest
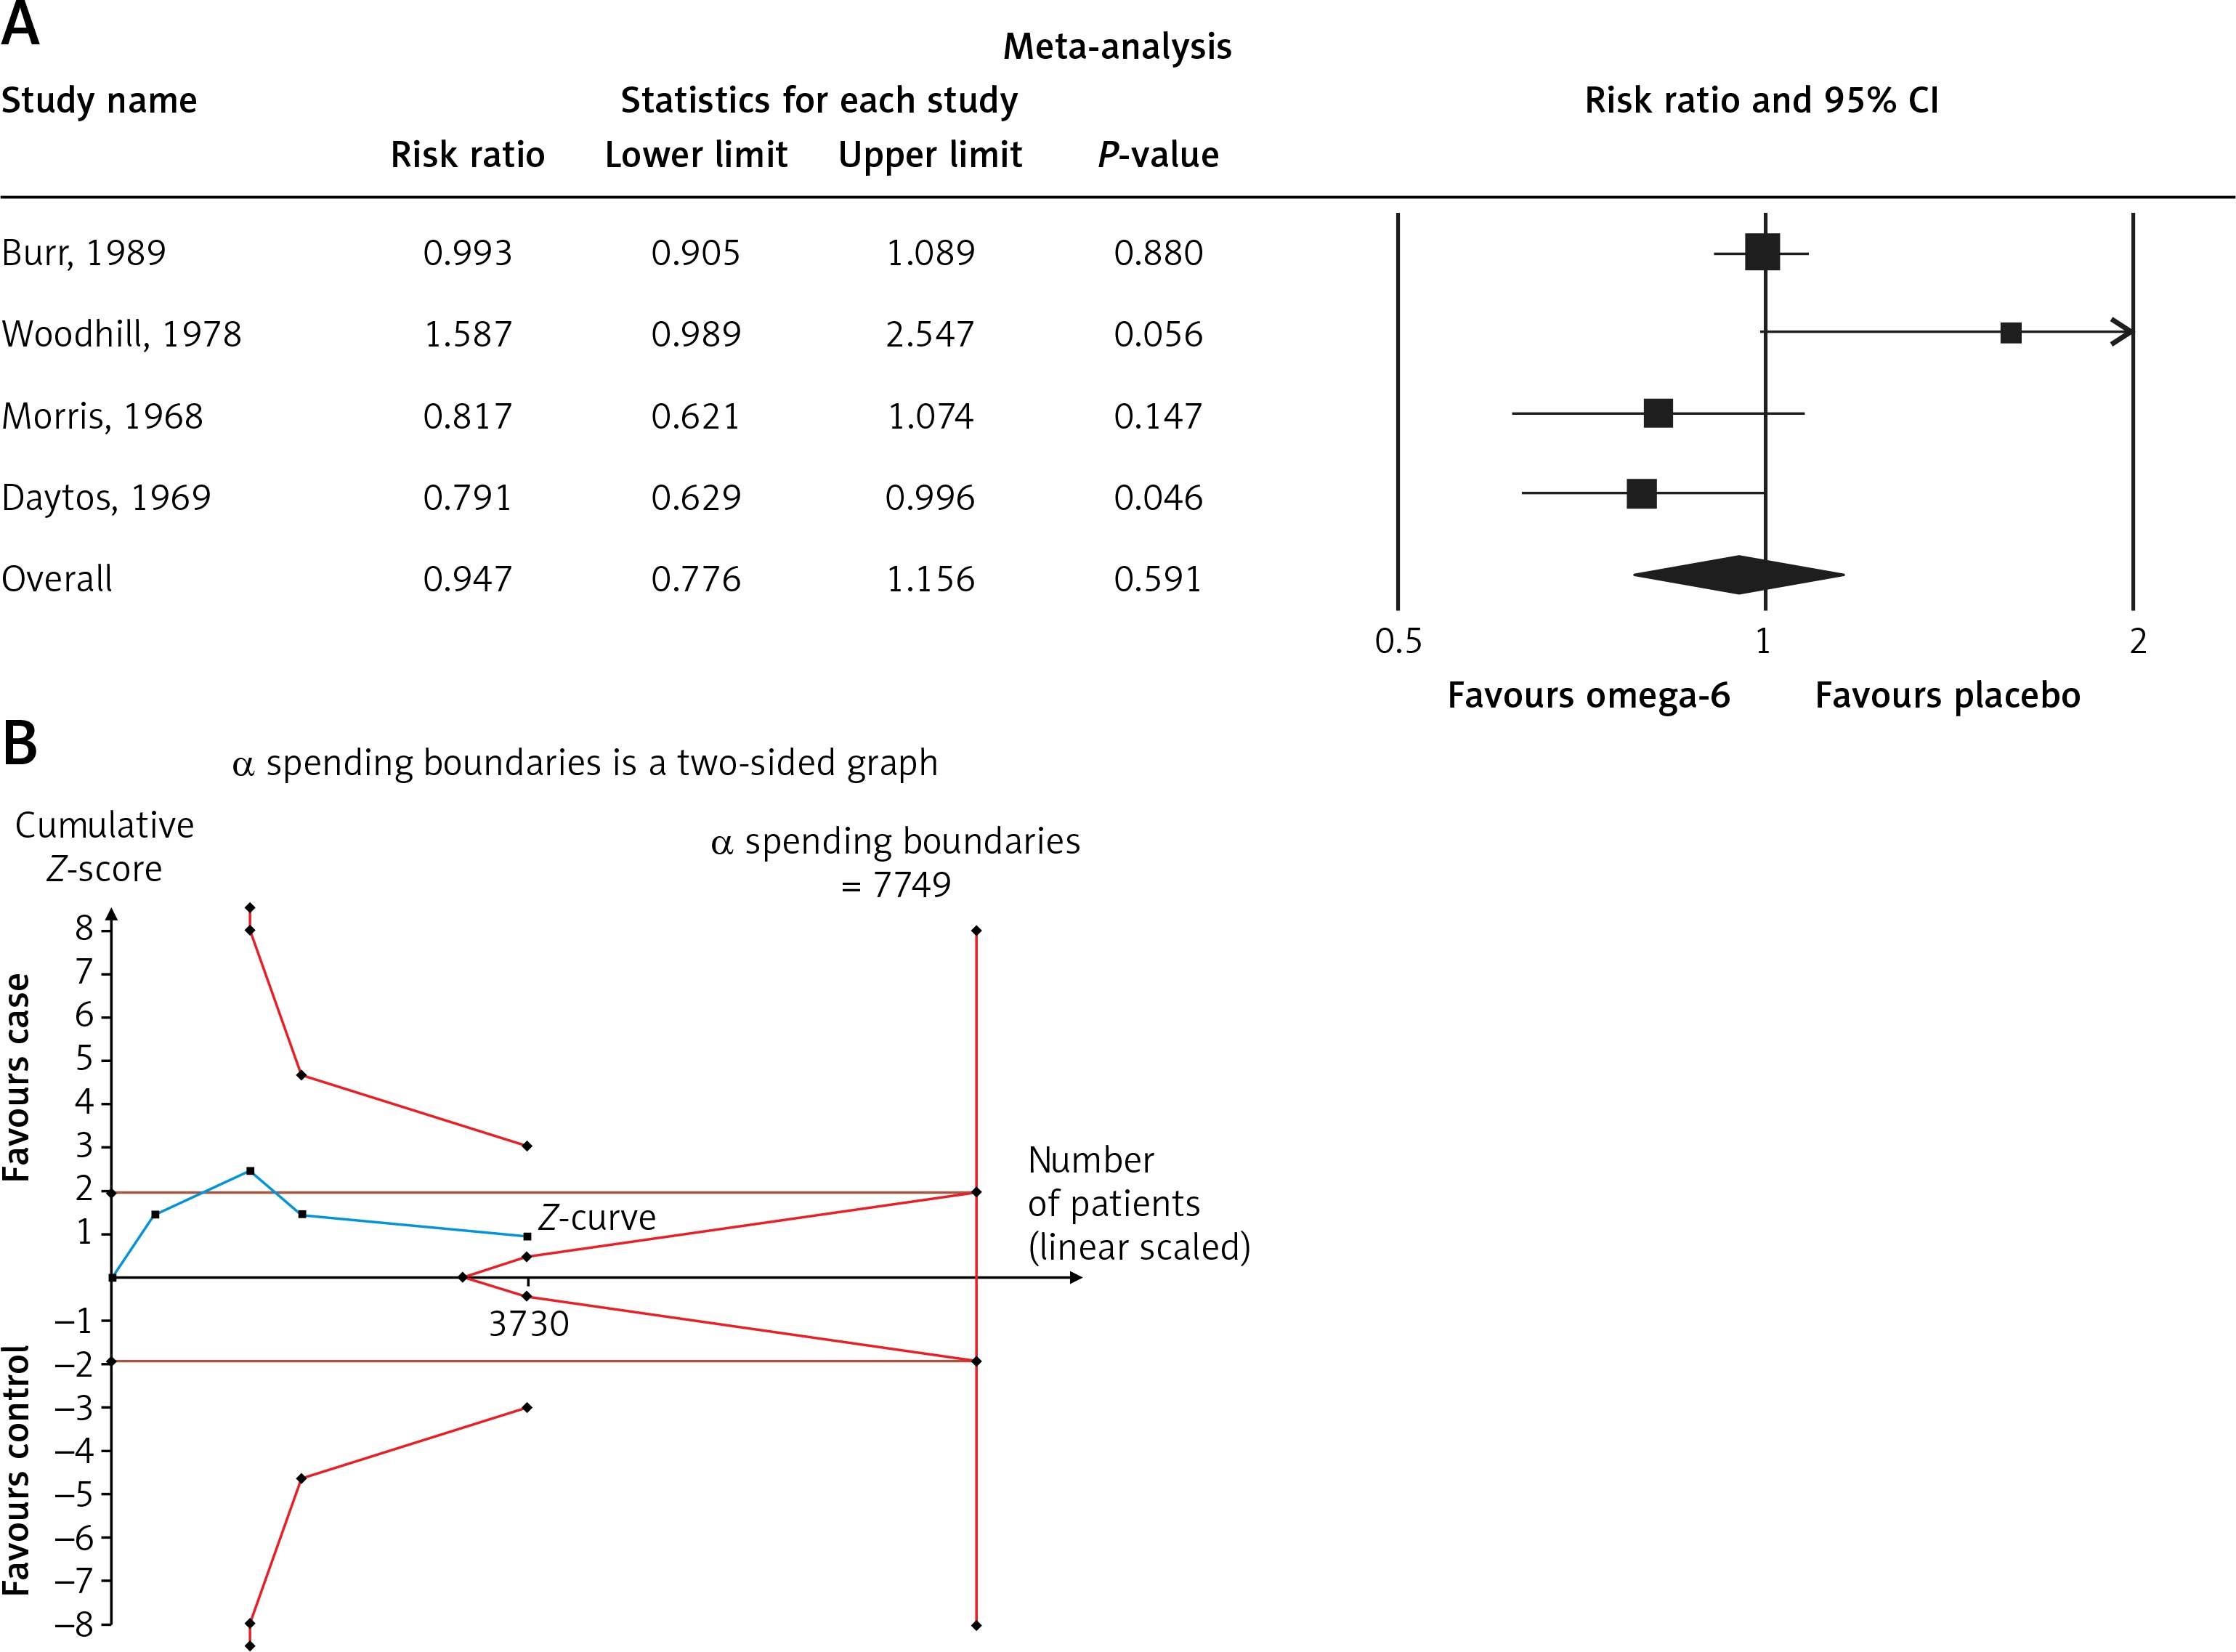
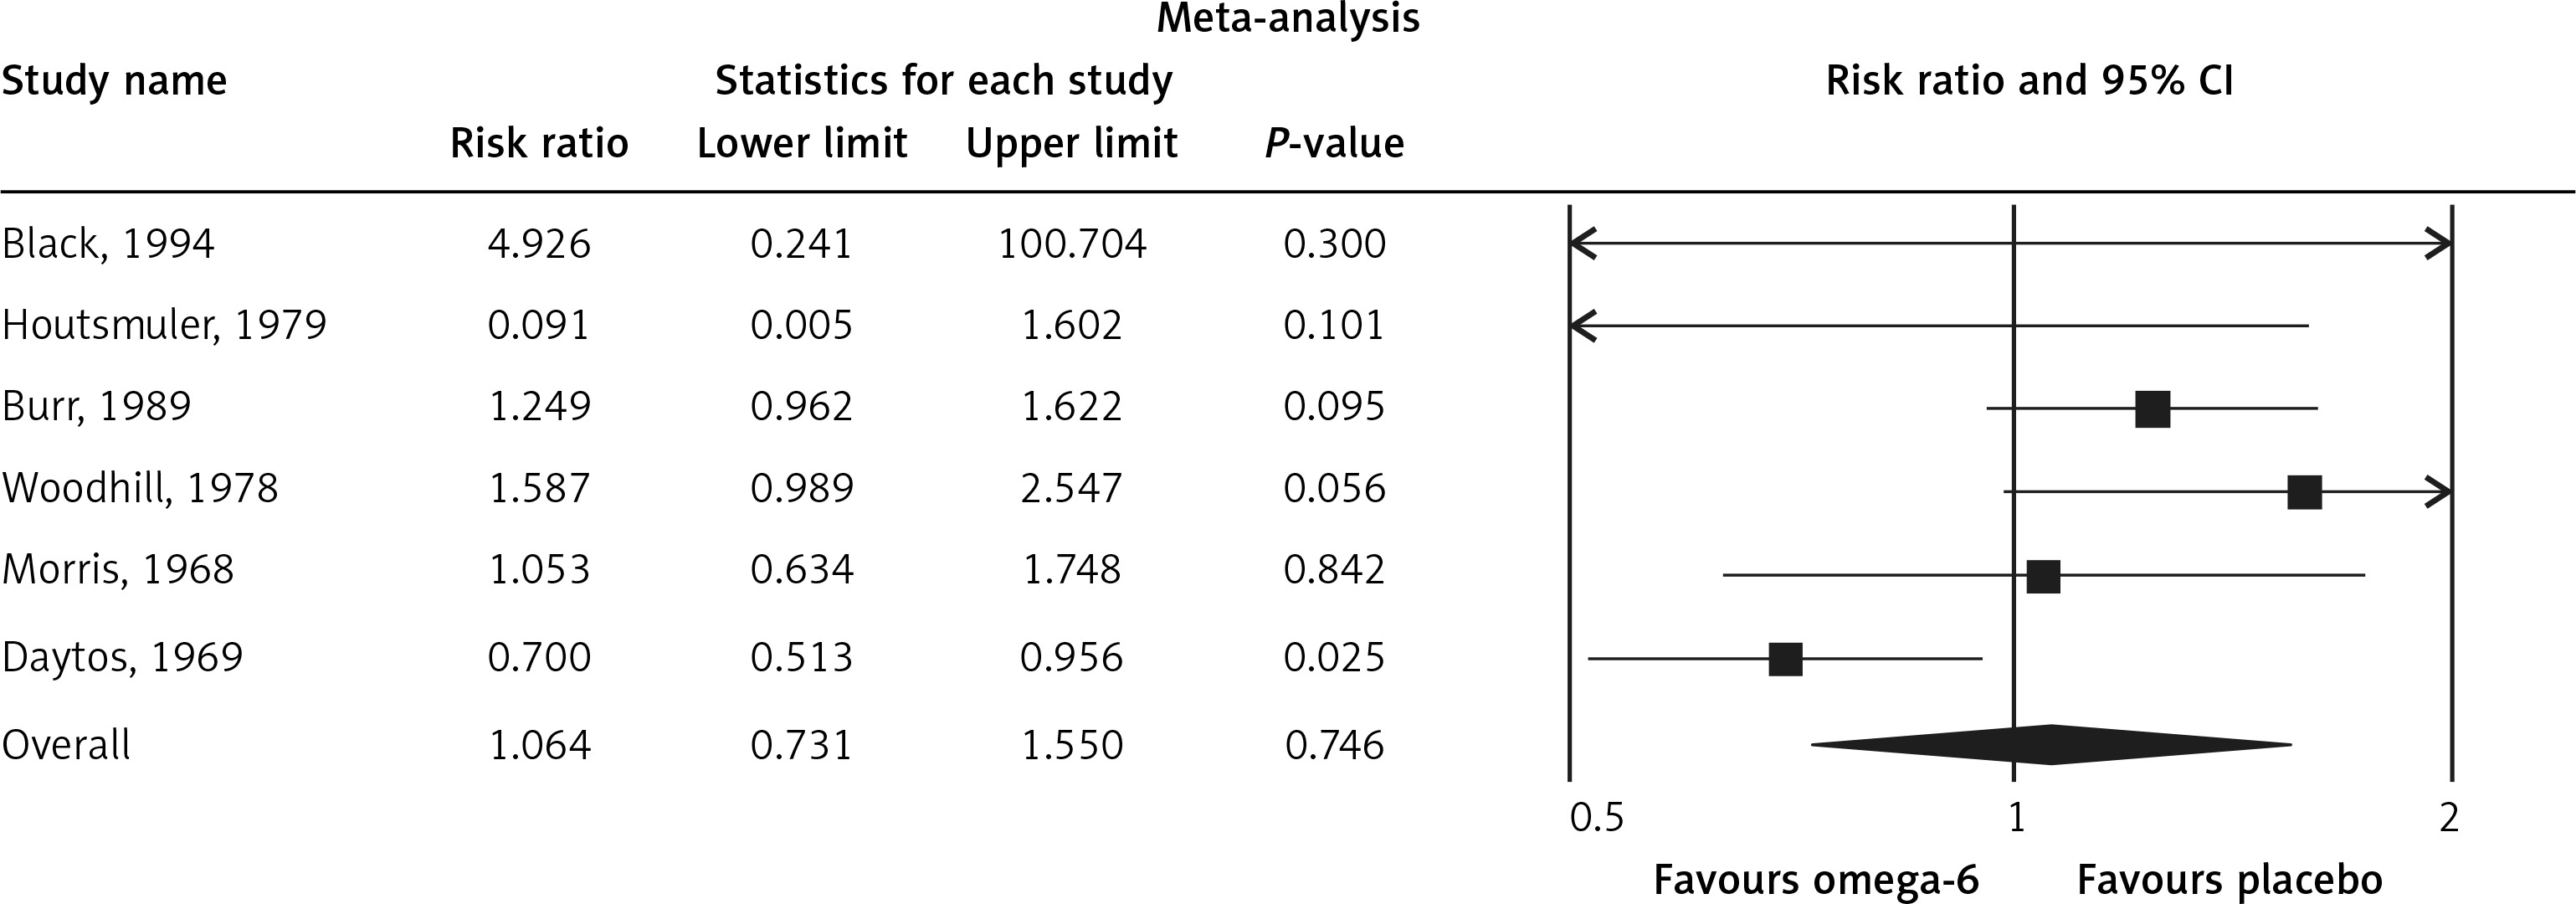
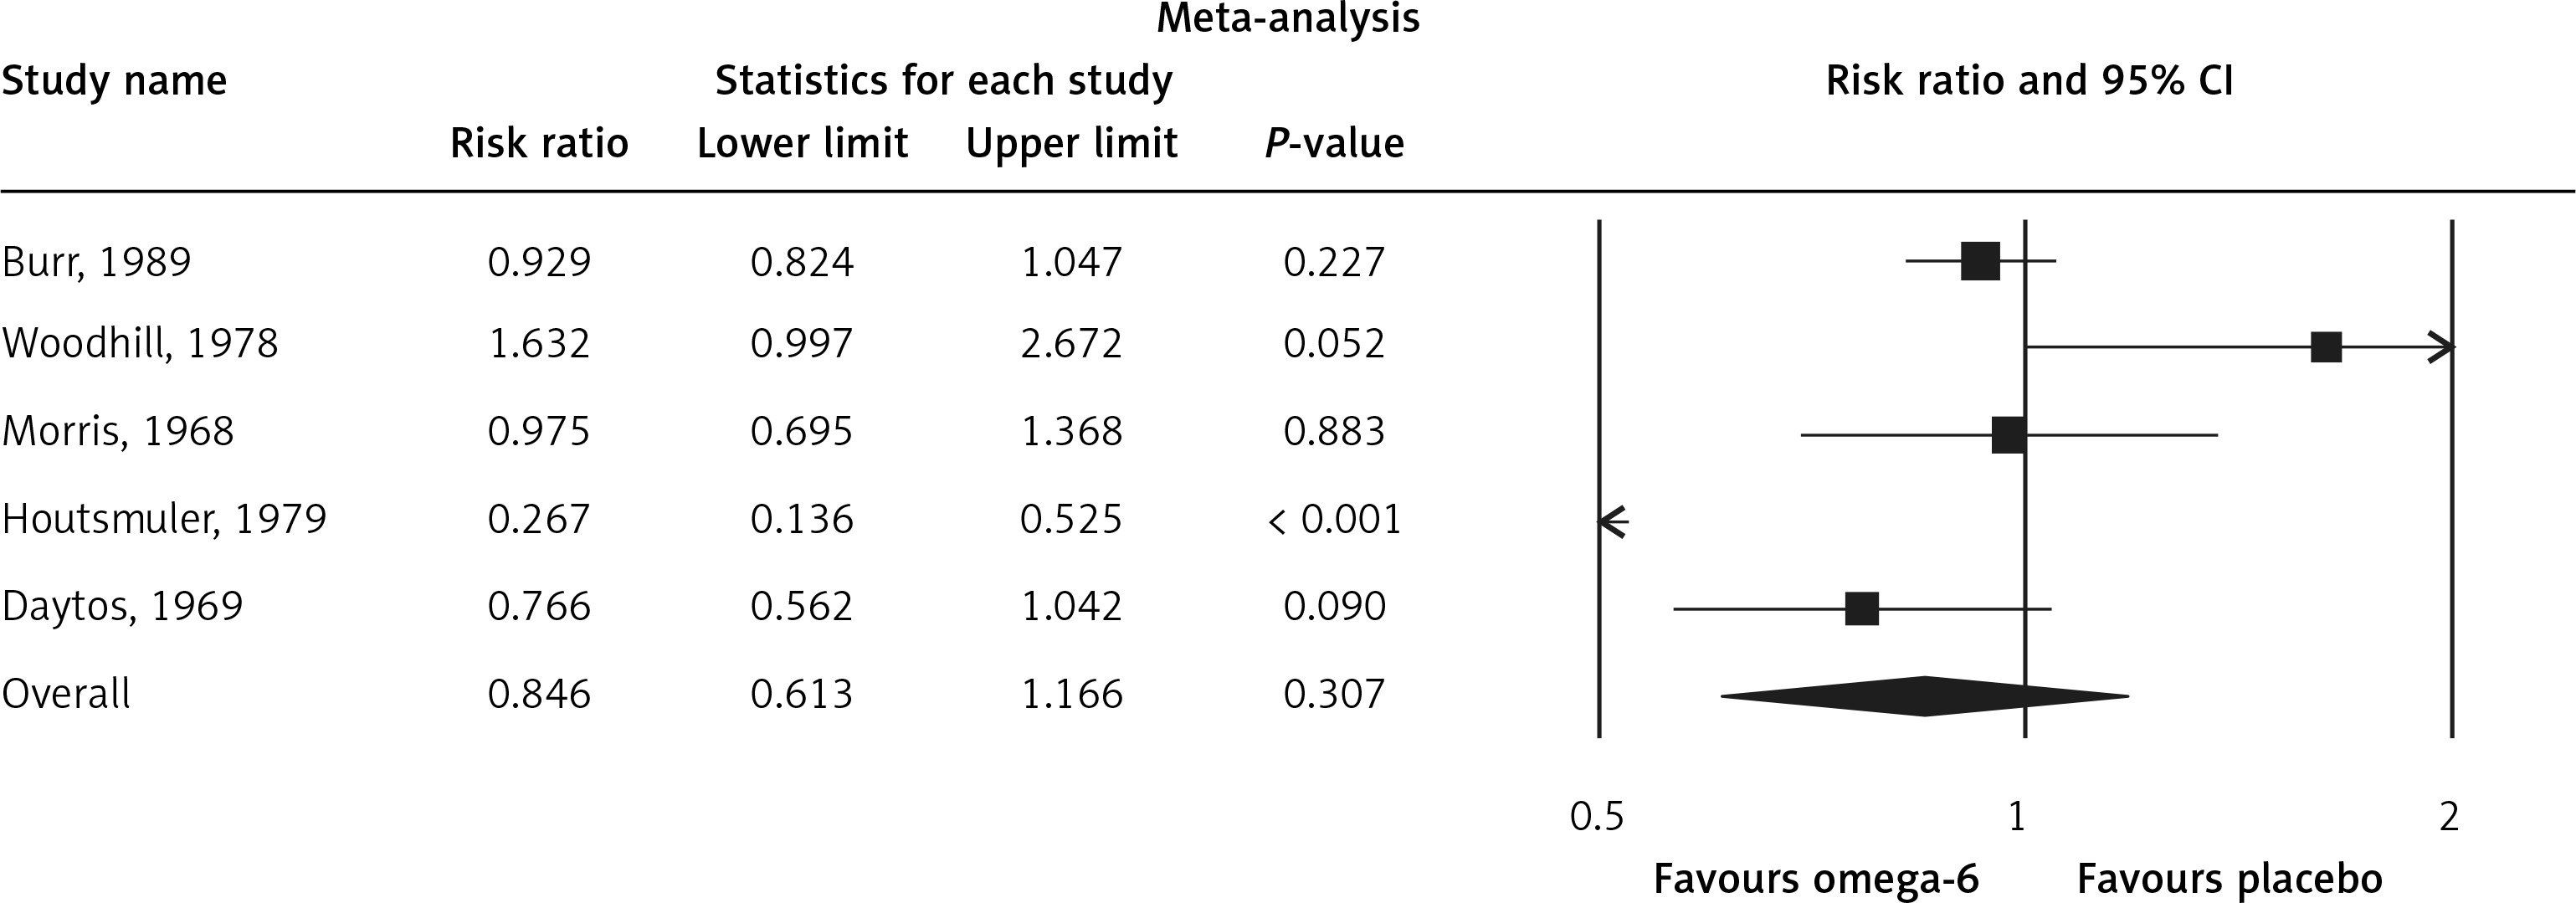
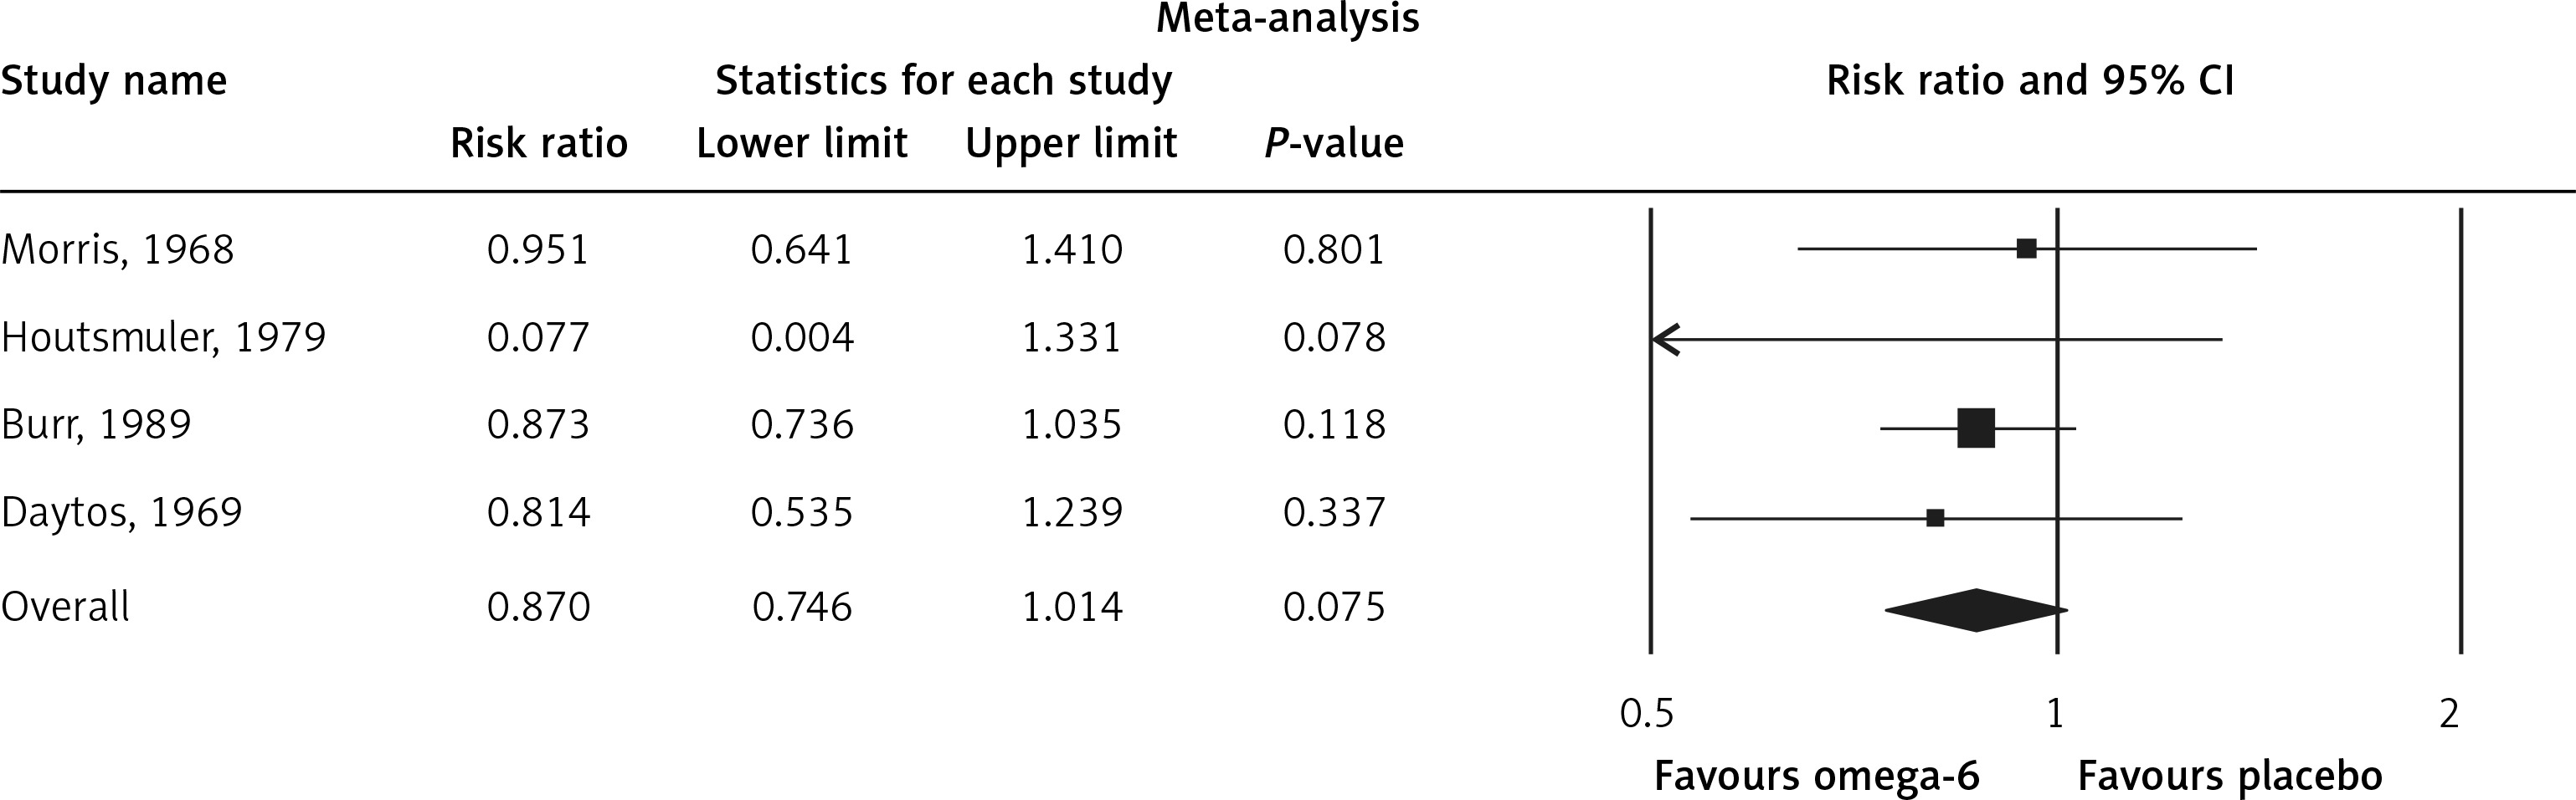
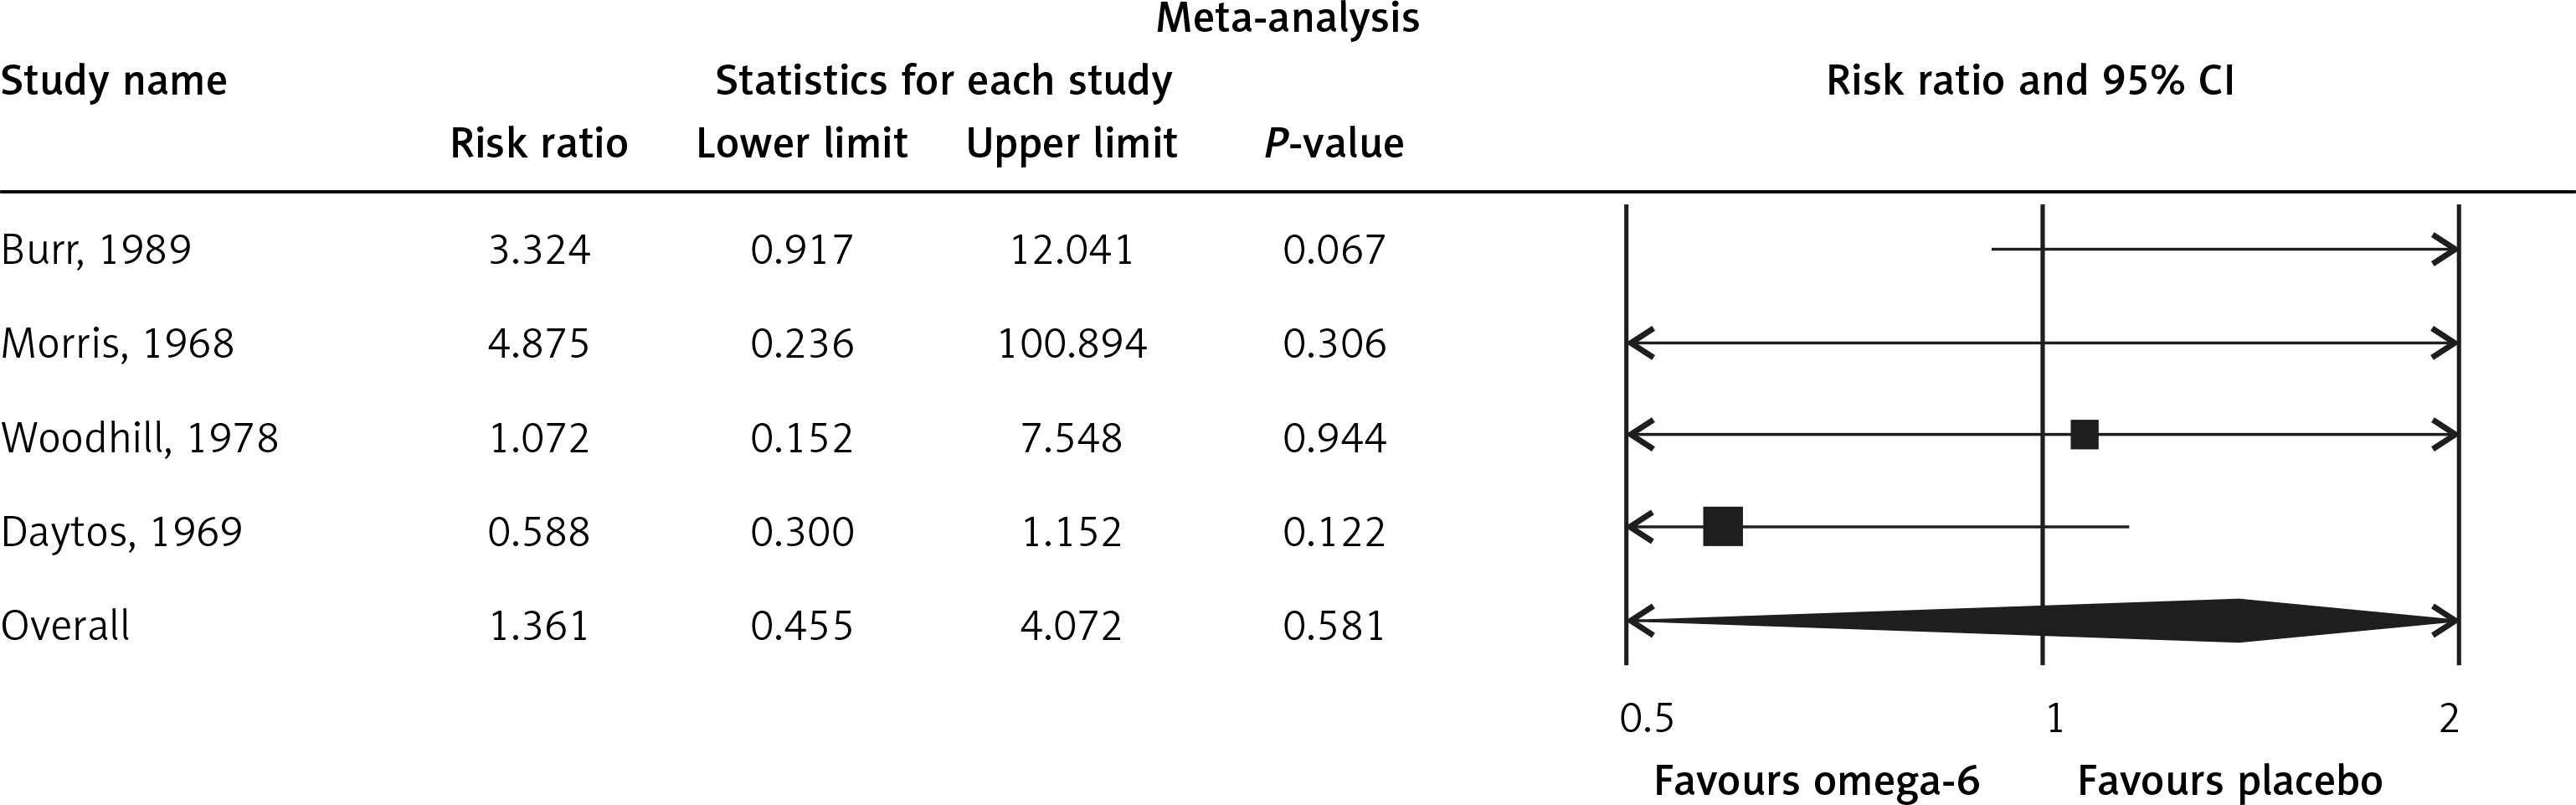
The pooled estimate risk ratio (RR) of the effect of omega-6 PUFA supplementation on any CVD event was 0.94 (95% CI: 0.77–1.15, heterogeneity p = 0.031; I 2 = 66.2%, n = 4 studies) (Figure 2 A). TSA indicated that the cumulative z-curve did not cross the conventional boundary and the trial sequential boundary, thus showing lack of robust data to support an impact of omega-6 PUFAs on CVD events (Figure 2 B). The pooled estimate RR of the effect of omega-6 PUFA supplementation on CVD death was 1.06 (95% CI: 0.73–1.55, heterogeneity p = 0.011; I2 = 66.2%, n = 6 studies) (Figure 3), on CHD events 0.84 (95% CI: 0.61–1.16, heterogeneity p = 0.001; I2 = 79.4%) (Figure 4), on MI 0.87 (95% CI: 0.74–1.01, heterogeneity p = 0.381; I2 = 2.3%) (Figure 5) and on stroke 1.36 (95% CI: 0.45–4.07, heterogeneity p = 0.082; I2 = 55.3%) (Figure 6). TSA for CVD death, CHD events, MI and stroke indicated that no boundaries were reached; thus further studies are needed to elucidate the effects of omega-6 PUFAs on CVD outcomes.
MR analysis
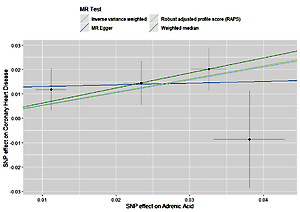
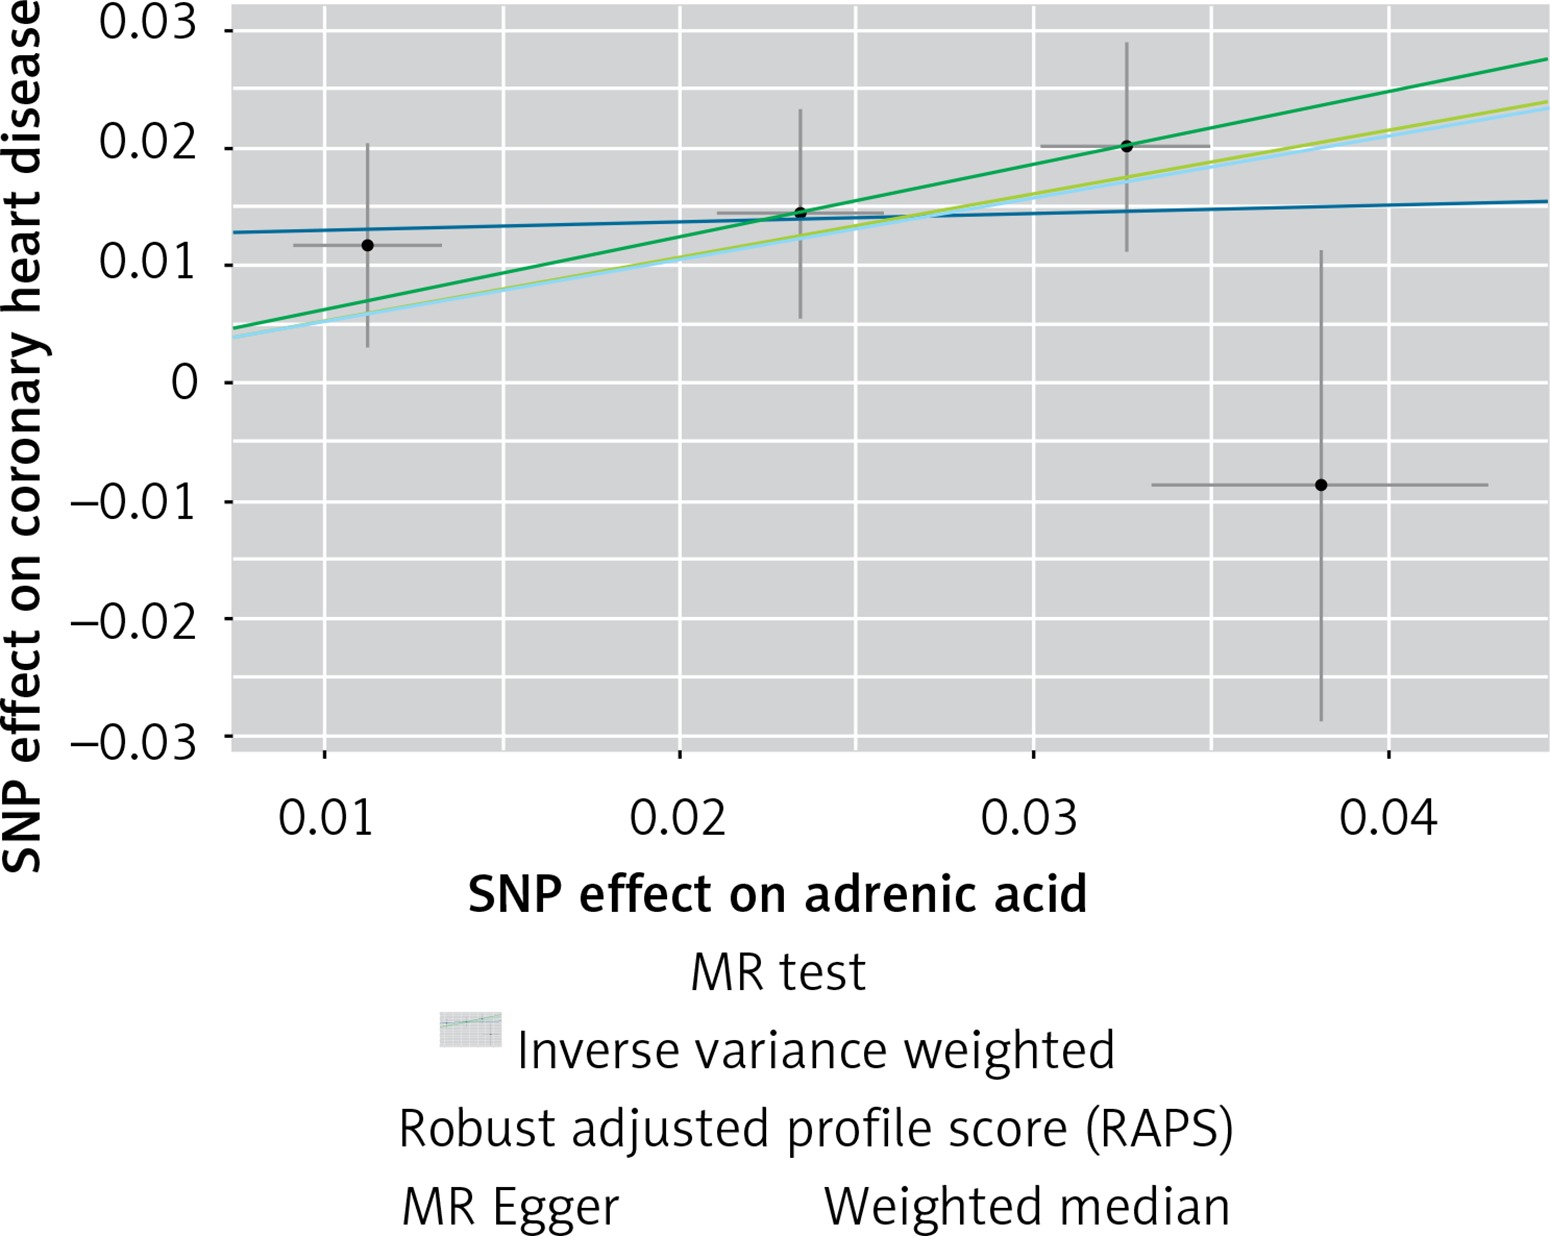
The instruments’ associations for circulatory AA levels are shown in Table III. The instruments have F-statistics ranging from 263 to 324, making significant bias from use of weak instruments unlikely [42]. The results were expressed as β coefficient values for outcomes of interest per one standard deviation (SD) increase in inverse variances AA, on varied cardiometabolic risk factors and CVD outcomes (Table IV). Individuals with genetically higher serum AA levels had a greater risk of CHD events (IVW β = 0.526, p = 0.007, Table IV, Figure 7), MI (IVW β = 0.606, p = 0.017, Table IV) and large artery stroke (IVW β = 1.694, p = 0.009, Table IV), as well as higher levels of FBG (IVW β = 0.417, p = 1.0 × 10⁻³, Table IV), LDL-C (IVW β = 0.806, p = 4.9 × 10⁻⁵, Table IV) and HDL-C (IVW β = 0.820, p = 4.3 × 10⁻¹⁷, Table IV), but lower levels of TG (IVW β = –1.064, p = 1.2 × 10⁻¹²) and TC (IVW β = –1.064, p = 1.2 × 10⁻¹²).
Table III
Summary results of the genetic loci of adrenic acid (AA 22:4, n-6)
| Traits | SNP | GX | GX SE | EA | OA | EAF |
|---|---|---|---|---|---|---|
| Adrenic acid (22:4,n6) | rs509360 | 0.0326 | 0.0024 | A | G | 0.330 |
| rs174468 | 0.0234 | 0.0024 | A | G | 0.430 | |
| rs17156442 | –0.0381 | 0.0048 | T | C | 0.051 | |
| rs2453710 | –0.0112 | 0.0021 | A | G | 0.541 |
Table IV
Results of Mendelian randomization analysis for adrenic acid
[i] WM – weighted median, IVW – inverse variance weighted, RAPS – robust adjusted profile score, SE – standard error, MR – Mendelian randomization, CHD – coronary heart disease, MI – myocardial infarction, FBG – fasting blood glucose, TG – triglyceride, TC – total cholesterol, LDL-C – low-density lipoprotein cholesterol, HDL-C – high-density lipoprotein cholesterol.
Figure 7
Scatter plots of the genetic associations of adrenic acid levels with coronary heart disease. The slopes of each line represent causal associations for each method
Heterogeneity results and pleiotropy bias are also shown in Table IV. There was a chance of heterogeneity only for TG (IVW = 7.529, p = 0.056), TC (IVW = 7.531, p = 0.059) and LDL-C (IVW = 10.710, p = 0.013), but not for the rest of the estimations (all IVW p > 0.148). The results of the MR-PRESSO did not indicate any outliers for all the estimates. The pleiotropy test, with a very negligible intercept, also indicated a low likelihood of pleiotropy for all of our estimations. The leave-one-out method demonstrated that the links were not due to single SNPs.
Discussion
In the present study, we performed a systematic review and meta-analysis of current RCTs as well as an MR analysis to investigate the effects of omega-6 PUFA supplementation levels on the risk of MI, stroke and CHD event/mortality and selected cardiometabolic risk factor levels. By pooling RCTs, omega-6 PUFA supplementation did not significantly affect the risk of MI, stroke and CHD event/mortality. TSA indicated that there is not enough information for firm conclusions and more studies are needed in this field. The MR revealed a significant association between higher AA levels and the risk of CHD, MI and large artery stroke, as well as increased levels of FBG and LDL-C. Furthermore, genetically higher AA levels were related to reduced TC and TG concentrations. Of note, estimates for the LDL-C, TG and TC were subjected to heterogeneity.
As has already been mentioned, a previous meta-analysis of observational studies with 25 case-control studies reported an inverse association between circulating and tissue LA and CHD risk [9]. Although AA was not significantly related to CHD risk, reduced AA content in adipose tissue was associated with a higher risk for CHD events in prospective studies but with a decreased risk in the cross-sectional studies [9]. Another meta-analysis that included 13 prospective cohort studies with 30,602 individuals (12,479 CHD events, including 5,882 CHD deaths) showed beneficial effects of LA on CHD events and deaths [8]. In detail, replacing saturated fat intake with a 5% energy increment in LA consumption correlated with a 9% lower risk of CHD events and a 13% lower risk of CHD death [10]. An earlier meta-analysis, including 60 clinical trials [43], and another one of 8 RCTs including 13,614 participants with 1,042 CHD events [13], reported that PUFAs (including omega-6) had positive effects on blood lipids and decreased CHD events. Furthermore, a Cochrane review of RCTs showed that modification of dietary fat by replacing saturated fats with monounsaturated fatty acids (MUFAs) or PUFAs caused a small but effective reduction in CVD risk over at least 6 months [44].
The relationships between dietary LA, total PUFA intake and CVD morbidity and mortality were assessed in a cohort of 1,551 middle-aged men, showing that omega-6 PUFAs were inversely associated with CVD death [45]. A systematic review including 19 studies with 6,461 adults (mean age: 50 years) reported that little or no effects on deaths or CVD events are plausible by increasing omega-6 PUFA consumption during 1–8 years [14]. However, the risk of heart attacks could be reduced [46]. As for cardiometabolic risk factors, omega-6 PUFAs decreased serum TC by 6%, with little or no effects on TG, HDL-C and LDL-C. Of note, certain limitations, such as the small numbers of events and participants from developing countries, as well as the participation of only a few women, could have influenced the results of this study [14].
Other cohort studies found that low intake of saturated fatty acids and a proportionally higher intake of omega-6 PUFAs was associated with a reduction in CHD risk and LDL-C [11, 12]. Mensink et al. found that the replacement of carbohydrate with PUFAs (omega-6) led to decreases in TC, HDL-C, LDL-C and TG [11]. However, this study had some limitations such as short term interventions and inclusion of non-randomized studies, thus minimizing the clinical importance of the results [43].
There is controversial evidence with regard to the effects of omega-6 PUFAs on CVD risk. Despite the beneficial impact of omega-6 PUFA supplementation on CVD outcomes supported by some studies, others still report conflicting results. One of the plausible mechanisms which may explain the relationship between omega-6 PUFAs and CVD is the increased production of 2-series prostaglandins and 4-series leukotrienes due to the high content of omega-6 PUFAs in the diet, exerting proinflammatory effects and thus potentially affecting negatively the (residual) CVD risk [5, 17]. Highly unsaturated fatty acids such as AA may be linked to an increase in LDL-C and VLDL susceptibility to oxidation, thus enhancing their atherogenic effect [5]. Furthermore, some studies found no association between omega-6 PUFA intake and CVD risk. In this context, a 14-year prospective cohort study with 43,732 men did not report any association between total fat intake, cholesterol and risk of stroke [47]. A previous meta-analysis of prospective, observational studies and RCTs showed that high consumption of PUFAs and low consumption of total saturated fats had no significant effect on CVD outcomes [16]. A Cochrane review (n = 660 participants) also found no significant association between either increased or decreased omega-6 PUFA intake and CVD risk factors [15]. In accordance with our results, a previous systematic review reported that replacement of saturated fats with cis-PUFA (which was equivalent to omega-6 PUFAs) significantly lowered TC levels, as we reported in the present study [48–56].
Our analysis has some limitations. Firstly, as with any meta-analysis, internal validity relies on the quality of individual studies. Secondly, the number of available studies concerning the described topic was relatively small, and we did not include small studies (potentially leading to overestimation of treatment effects; smaller trials might be methodologically less robust and more prone to report larger effect sizes [49, 50]), as well as those with a short follow-up. We evaluated our findings by applying MR, which is known as a powerful tool for detection of a causal impact. We also performed TSA to evaluate and decrease the chance of type I and II errors, which is a strength of the present study [52, 53].
In conclusion, in the present meta-analysis, omega-6 PUFA supplementation did not significantly affect the risk of MI, stroke, CHD or CVD mortality. The MR showed that higher AA levels significantly correlated with the risk of CHD, MI and large artery stroke, as well as with elevated levels of FBG, LDL-C and HDL-C and reduced levels of TC and TG. Further studies are still necessary to confirm the real effect of omega-6 PUFAs on cardiovascular risk and cardiometabolic parameters.