Introduction
Overactivity of the renin-angiotensin-aldosterone system (RAAS) is characterized by the proliferative, proinflammatory, prothrombotic, and profibrotic effects of angiotensin II (Ang II) and aldosterone, and leads to increased cardiovascular morbidity and mortality [1, 2]. The main physiological function of aldosterone is to maintain blood pressure (BP) and regulate the water-electrolyte balance through renal sodium and water reabsorption. An excess of aldosterone causes activation of extrarenal mineralocorticoid receptors, leading to numerous cardiovascular complications such as endothelial dysfunction, thrombosis, reduction of vascular compliance, baroreceptor function impairment, and myocardial and vascular fibrosis. Moreover, some authors consider excess of aldosterone as an independent cardiovascular risk factor [3]. In 1991, Dzau and Braunwald proposed the concept of a chain of pathophysiological changes beginning at the cellular level and leading to clinical manifestations initiated by up-regulation of the RAAS [4]. The results of the double-blind, placebo-controlled PATHWAY-2 study revealed that mineralocorticoid receptor blockade by spironolactone was the most effective add-on therapy for the treatment of resistant hypertension. The PATHWAY-2 study demonstrated in a group of 335 subjects that spironolactone is by far the most effective antihypertensive drug to add to triple A + C + D therapy (“A” is an angiotensin-converting enzyme inhibitor, “C” is a calcium channel blocker (CCB), and “D” is a thiazide or thiazide-like diuretic) for the treatment of resistant hypertension when compared to bisoprolol or doxazosin. Moreover, there was a clear inverse relation between the home systolic blood pressure fall with spironolactone and plasma renin, not seen with bisoprolol or doxazosin. The results of the PATHWAY-2 study give strong and the most contemporary evidence that the RAAS-guided therapeutic strategy can be useful in clinical practice [5]. Usually, the assessment of the RAAS begins with the measurement of plasma renin activity (PRA), which in fact is the evaluation of angiotensin I (Ang I) concentration. Ang I is transformed to Ang II, which stimulates AT1 receptors and promotes inflammation, free radical generation, endothelial dysfunction, vasoconstriction, plaque generation, and remodeling of the deeper layers of the vessel wall through processes such as smooth muscle cell hyperplasia and stromal fibrosis [1, 6]. The early consequences of these processes are myocardial remodeling, hypertrophy and fibrosis, renal damage, ultimately leading to late clinical outcomes such as ischemic heart disease, heart failure and chronic kidney disease [7].
The cardiovascular and renal asymptomatic organ damage (AOD) indices associated with arterial hypertension were listed by the ESH/ESC 2013 Guidelines [8], and included left ventricular mass index (LVMI), carotid intima-media thickness (IMT), aortic pulse wave velocity (PWV), and estimated glomerular filtration rate (eGFR). Theoretically, the values of these indices should be higher in patients with increased RAAS activity. However, there are limited and sometimes contradictory data supporting this hypothesis [9–11]. According to the ESH/ESC Guidelines, besides lowering BP, the main aim of antihypertensive therapy is to halt the progression of AOD [8]. The extent of AOD cannot be explained by the hemodynamic effect of higher blood pressure alone. A hypothesis that a connection exists between higher RAAS activity and the progression of AOD has been proposed, and we believe that confirming such a relationship would be clinically useful.
Elevated renin activity is responsible for approximately 70% of essential hypertension cases. This form of hypertension is described as renin-mediated hypertension (R-hypertension). Angiotensin-converting enzyme inhibitors, angiotensin receptor blockers, and β-blockers are particularly effective in this kind of hypertension. If the hypothesis outlined above is confirmed, it will become possible to administer proper, targeted antihypertensive therapy to slow the progression of AOD if a patient’s PRA level is known [12].
With the above in mind, the aim of this study was to assess the associations of PRA and ALDO with several AOD indices in patients with essential arterial hypertension.
Material and methods
This study was scheduled as a prospective trial. The study group comprised consecutive, non-selected patients (men and women in equal number), newly referred to our outpatient clinic within 1.07.2013–31.12.2013. Patients aged 30–75 years with essential arterial hypertension stage-1 according to the 2013 ESH/ESC Guidelines [8] (i.e. arterial blood pressure values ≥ 140/90 mm Hg and < 160/100 mm Hg) were enrolled. Patients with previously diagnosed and treated hypertension were included in the study after a minimum 6-week drug washout period. In order to exclude secondary hypertension in all patients abdominal ultrasound examination with renal Doppler flow assessment was performed. Subjects with suspected renal artery stenosis were excluded. Other exclusion criteria were: history of coronary artery disease, i.e. myocardial infarction, angina pectoris, a history of coronary revascularization, as well as cardiac valvular disease, atrial fibrillation, prior stroke or transient ischemic attack, antiplatelet, anticoagulant, or lipid-lowering therapy, acute or chronic inflammation, cancer, chronic kidney disease (i.e. eGFR below 60 ml/min/1.73 m2) or liver failure. Insulin-treated diabetic patients and pregnant women were also excluded. Accounting for aforementioned exclusion criteria, 229 from 360 initially screened subjects were excluded. Although the study group included only patients with mild essential arterial hypertension without typical indications to perform screening for primary aldosteronism according to the Endocrine Society Guidelines [13], we decided to exclude patients with an aldosterone-to-renin ratio (ARR) > 100 ng/dl/ng/ml/h and aldosterone concentration > 30 ng/dl. According to the latest exclusion criteria 9 patient were excluded. In this group 1 case of primary hyperaldosteronism (adenoma), 1 case of cancer with ectopic corticoid secretion and 1 case of unilateral hydronephrosis were confirmed.
In the hypertensive group, 89 (73%) patients were antihypertensive therapy naïve, while 33 (27%) patients had been previously treated with one or a combination of two antihypertensive drugs at low doses. In this group, 6 patients had previously received slow-release indapamide (1.5 mg) as monotherapy during 1–4 months before the study, five lisinopril (5–10) mg twice daily as monotherapy for a period of 2–3 months, five perindopril (5 mg) once daily for a period of 1–3 months, three valsartan (80 mg) once daily for a period of 1–3 months, three verapamil (120 mg/day) for 1–3 months, three carvedilol (6.125–12.5 mg) twice daily for a period of 1–4 months, two metoprolol succinate 50 mg/day (one for a period of 2 months and one for 3 months), and five combination therapy consisting of indapamide (0.625 mg) plus perindopril (2.5 mg) once daily for 2–3 months. The above-mentioned treatments were withdrawn at least 6 weeks before enrollment.
Study procedures
All subjects signed an informed consent form for inclusion in this study. The Jagiellonian University Ethics Committee approved the protocol of the study (decision number: KBET/7/B/2007). The following assessments were performed:
Office BP measurements were performed under standard conditions, twice at an interval of one minute on the non-dominant arm after 5 min rest in the sitting position. All procedures were performed in accordance with the recommendations of the European Society of Hypertension [13] using the Omron M5-I oscillometric device (Omron Healthcare Co., Japan). The average of the obtained values was entered into the final analysis.
Twenty-four-hour ambulatory BP monitoring was performed using a SpaceLabs 90207 recorder (SpaceLabs Inc, Richmond, Washington, USA) according to the ESH working group’s practice guidelines [14], with automatic measurements taken at 15-min intervals during daily activity and 20-min intervals during nighttime hours.
Carotid-femoral PWV was measured with a SphygmoCor (AtCor Medical, Sydney, Australia) device. Aortic central BP was calculated based on transfer function from tonometric recording of pulse wave in the radial artery and BP measured in the brachial artery. The cfPWV measurements were made in accordance with the recommendations of the ‘Expert consensus document on arterial stiffness: methodological issues and clinical applications’ published in 2006 [15], and the ‘Expert consensus document on the measurement of aortic stiffness in daily practice using carotid-femoral pulse wave velocity’ published in 2012 [16]. Data were collected by a single trained examiner and the mean of at least 2 PWV and 2 pulse wave analysis (central blood pressure) measurements was taken for each subject. In addition, measurements were accepted as valid only when the difference did not exceed 10%. However, to allow more effective comparisons of our results with those previously published, we did not multiply the distance measured on the body surface between the carotid and femoral arteries by 0.8 as recommended by the latter document [16].
Echocardiographic examination was performed with a Vivid 7 VingMed (GE-Healthcare Chicago, IL, USA) device and 1.7–3.4 MHz harmonic transducer with the patient in the partial left decubitus position in typical echocardiographic views. Left-ventricular dimensions, interventricular septum, and posterior wall thickness were measured using M-mode imaging. Left-ventricular mass (LVM) was calculated by the Devereux formula [17]. LVM index (LVMI) was calculated using this LVM result and body surface area.
The degree of vascular remodeling was evaluated by ultrasonography-derived IMT measurements in the common carotid artery. Measurements were performed manually in the two-dimensional long-axis view using a linear 10-MHz probe (Vivid 7, VingMed, GE-Healthcare Chicago, IL, USA). The IMT was measured within the near and far walls of both common carotid arteries, 2 cm proximally to the bifurcation. Three measurements were performed at each arterial site. We evaluated the mean value of all measurements from each site. The methodology was in agreement with the Mannheim consensus [18].
All echocardiographic and carotid artery ultrasound examinations were performed by two independent examiners. To assess intraobserver and interobserver variabilities in LVMI and IMT measurements, 15 patients were randomly selected and measurements were taken by the main observer on two separate occasions and another independent observer. We computed the coefficient of variation as the ratio of the mean difference between repeat measurements to the standard deviation of the paired differences multiplied by 100. In the case of LVMI intraobserver and interobserver variabilities were 4% and 6%, respectively. In the case of IMT intraobserver and interobserver variabilities were 3% and 7%.
Directly after the assessment of instrumental AOD indices venous blood was collected in the morning hours after a 12 h fast with patients in the sitting position. Blood was collected in silicone-treated glass tubes containing EDTA, and plasma was immediately separated and frozen at –75°C until required. Serum aldosterone concentration was determined by radioimmunoassay using the ALDO-RIACT kit (Cisbio Bioassays, Codolet, France), with a limit of detection of 7 pg/ml and a coefficient of variation < 7.5%. Plasma renin activity was determined from the same sample by radioimmunoassay using the Ang I RIA KIT (Beckman Coulter, Immunotech, Prague, Czech Republic) with a sensitivity of 0.07 ng/ml and coefficient of variation < 6.0%. Serum creatinine concentration was measured using the Jaffe reaction method. Serum concentrations of sodium and potassium were measured using the indirect ion selective electrode method. Routine biochemical assessments were performed using a Hitachi 917/Modular P automatic analyzer (Roche Diagnostics Ltd). Estimated glomerular filtration rate (eGFR) was calculated using the Modification of Diet in Renal Disease (MDRD) formula [19].
Statistical analysis
We used SAS, version 9.1 (SAS Institute Inc, Cary, NC) for data management and statistical analysis. Variables were analyzed for normal distribution using the Shapiro-Wilk test and non-parametric tests were used for non-normally distributed variables. For exploratory analyses, we assessed the characteristics of participants by groups according to the distribution of PRA. To compare proportions and means we applied the χ2 test and Student’s t-test (or one-way analysis of variance), respectively. Our statistical methods also included linear regression and multivariate-adjusted linear regression with AOD indices as the dependent variables. The possible covariates accounted for in analyses were searched using stepwise regressions with the F-value for independent variables to enter and stay in the model set at 0.10. A value of p < 0.05 was considered significant in all statistical analyses.
Results
Characteristics of the study group
The study group consisted of 122 patients with essential uncomplicated stage 1 arterial hypertension (61 men and 61 women). Based on the obtained PRA results, patients were divided into two subgroups, ‘low-renin’ and ‘high-renin’, according to the Laragh and Alderman criteria (low-renin: PRA < 0.65 ng/ml/h, high-renin: PRA ≥ 0.65 ng/ml/h) [12]. Basic clinical and biochemical characteristics, BP values, and indices of organ damage in the study group and comparisons between low- and high-renin groups are presented in Table I.
Table I
Clinical characteristics of study group
| Clinical characteristics | All participants | High renin PRA ≥ 0.65 ng/ml/h | Low renin PRA < 0.65 ng/ml/h | P-value# |
|---|---|---|---|---|
| N | 122 | 72 | 50 | |
| Age [years] (SD) | 53.3 (12.9) | 52.2 (13.3) | 55.4 (10.9) | 0.15 |
| Sex, male (%) | 61 (50) | 37 (51) | 24 (48) | 0.90 |
| BMI [kg/m2] (SD) | 27.4 (4.5) | 27.2 (4.4) | 27.4 (4.9) | 0.88 |
| Diabetes mellitus type 2 (%) | 7 (5.7) | 5 (6.9) | 2 (4.0) | 0.47 |
| Smokers (%) | 26 (21.3) | 15 (20.8) | 11 (22.0) | 0.91 |
| SBP [mm Hg]* | 150.5 (18.9) | 148.1 (18.9) | 154.2 (18.5) | 0.10 |
| DBP [mm Hg]* | 92.3 (10.6) | 91.9 (11.5) | 92.9 (9.2) | 0.62 |
| HR [beats/min]* | 73.2 (9.1) | 74.3 (10.2) | 71.3 (9.3) | 0.13 |
| Sodium [mmol/l] | 138.6 (2.5) | 137.9 (2.4) | 139.5 (2.3) | 0.001 |
| Potassium [mmol/l] | 4.2 (0.2) | 4.20 (0.3) | 4.16 (0.31) | 0.44 |
| PRA [ng/ml/h] | 1.3 (1.9) | 2.08 (2.34) | 0.31 (0.14) | < 0.001 |
| ALDO [ng/dl] | 14.8 (7.1) | 15.9 (7.9) | 13.2 (5.6) | 0.049 |
| ARR [ng/dl/ng/ml/h] | 30.0 (32.3) | 11.4 (6.8) | 54.4 (36.2) | < 0.001 |
| ABPM: | ||||
| SBP 24 h [mm Hg] | 130.8 (9.1) | 131.4 (9.4) | 129.9 (8.9) | 0.41 |
| DBP 24 h [mm Hg] | 80.4 (7.6) | 81.7 (7.7) | 79.2 (7.3) | 0.13 |
| HR 24 h [beats/min] | 75.6 (9.1) | 77.7 (8.8) | 72.6 (8.8) | 0.017 |
| SBP day [mm Hg] | 135.4 (10.0) | 136.2 (10.2) | 134.3 (9.7) | 0.54 |
| DBP day [mm Hg] | 84.7 (8.1) | 86.1 (8.1) | 82.8 (8.2) | 0.07 |
| HR day [beats/min] | 79.8 (9.9) | 82.3 (9.6) | 76.4 (9.6) | 0.01 |
| SBP night [mm Hg] | 121.1 (9.6) | 121.4 (9.8) | 120.8 (9.5) | 0.91 |
| DBP night [mm Hg] | 72.4 (8.1) | 72.8 (8.9) | 71.8 (6.9) | 0.55 |
| HR night [beats/min] | 67.0 (8.5) | 68.6 (8.1) | 64.8 (8.5) | 0.06 |
| Target organ characteristics: | ||||
| cfPWV [m/s] | 8.27 (1.8) | 8.19 (1.7) | 8.4 (1.9) | 0.59 |
| cPP[mm Hg] | 45.8 (16.7) | 44.3 (15.5) | 47.9 (15.3) | 0.22 |
| Creatinine [µmol/l] | 66.7 (12.6) | 66.6 (12.3) | 66.4 (14.1) | 0.94 |
| eGFR [ml/min/1.73 m2] | 97.4 (18.7) | 97.8 (18.4) | 96.9 (19.5) | 0.68 |
| LVMI [g/m2] | 129.3 (33.6) | 131.0 (34.6) | 127.2 (37.4) | 0.70 |
| IMT [mm] | 0.64 (0.15) | 0.64 (0.15) | 0.63 (0.16) | 0.47 |
PRA – plasma renin activity, BMI – body mass index, SBP – systolic blood pressure, DBP – diastolic blood pressure, HR – heart rate, ALDO – aldosterone plasma concentration, ARR – aldosterone to renin ratio, ABPM – ambulatory blood pressure monitoring, cfPWV – carotid-femoral pulse wave velocity, cPP – central pulse pressure, eGFR – estimated glomerular filtration rate, LVMI – left ventricular mass index, IMT – intima-media thickness in common carotid artery (average value from measurements of near and far walls on both sides).
In the high-renin group, lower plasma sodium concentrations, higher ALDO, heart rate and 5-fold lower ARR were observed compared to the low-renin group. No between-group differences were observed with respect to office BP and 24-h ambulatory BP values, as well as AOD indices.
Regression analyses of AOD and RAAS indices
Linear regression analyses for AOD indices (cfPWV, cPP, IMT, LVMI, and eGFR) and RAAS indices (PRA, ALDO, and ARR) were performed to assess the association of AOD indices with the parameters of RAAS.
A significant positive association was found between cPP and ARR (β = 0.117, p = 0.019) as well as between cfPWV and ARR (β = 0.112, p = 0.04). In linear regression analysis, eGFR was significantly negatively associated with ALDO (β = –0.663, p = 0.008). In multivariate regression analysis including age, sex and BMI, only the negative association between eGFR and ALDO remained statistically significant (Table II).
Table II
Determinants of studied asymptomatic organ damage parameters in the whole group
| Parameter | cfPWV | cPP | eGFR |
|---|---|---|---|
| R2 | 0.25 | 0.15 | 0.22 |
| Age [years] | |||
| β ± SE | 0.48 ±0.088# | 0.37 ±0.095# | –0.38 ±0.090# |
| Gender (0 men 1 women) | |||
| β ± SE | –0.11 ±0.089 | 0.08 ±0.094 | –0.11 ±0.089 |
| BMI | |||
| β ± SE | 0.20 ±0.087# | 0.044 ±0.093 | 0.10 ±0.088 |
| PRA | |||
| β ± SE | –0.05 ±0.094 | –0.04 ±0.097 | 0.12 ±0.093 |
| ALDO | |||
| β ± SE | 0.11 ±0.091 | 0.13 ±0.097 | –0.27 ±0.095# |
Comparison of three groups defined based on PRA and ARR values
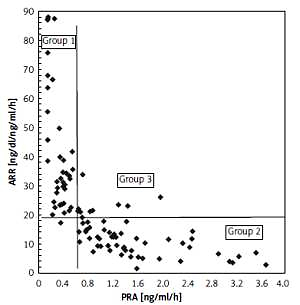
Because PRA alone did not determine differences in AOD for further analyses, we divided the study group into four subgroups depending on PRA level and ARR (Figure 1). PRA below or over 0.65 ng/ml/h and the median value of ARR in our study (18.42 ng/dl/ng/ml/h) were used to create four subgroups as follows:
Figure 1
Subgroups created from study group according to PRA and median of ARR values. Group 1: PRA < 0.65 ng/ml/h and ARR ≥ 18.42 ng/dl/ng/ml/h (N = 51), group 2: PRA ≥ 0.65 ng/ml/h and ARR < 18.42 ng/dl/ng/ml/h (N = 58), group 3: PRA ≥ 0.65 ng/ml/h and ARR ≥ 18.42 ng/dl/ng/ml/h (N = 12), group 4: PRA < 0.65 ng/ml/h and ARR < 18.42 ng/dl/ng/ml/h (N = 1)
PRA – plasma renin activity, ARR – aldosterone to renin ratio.
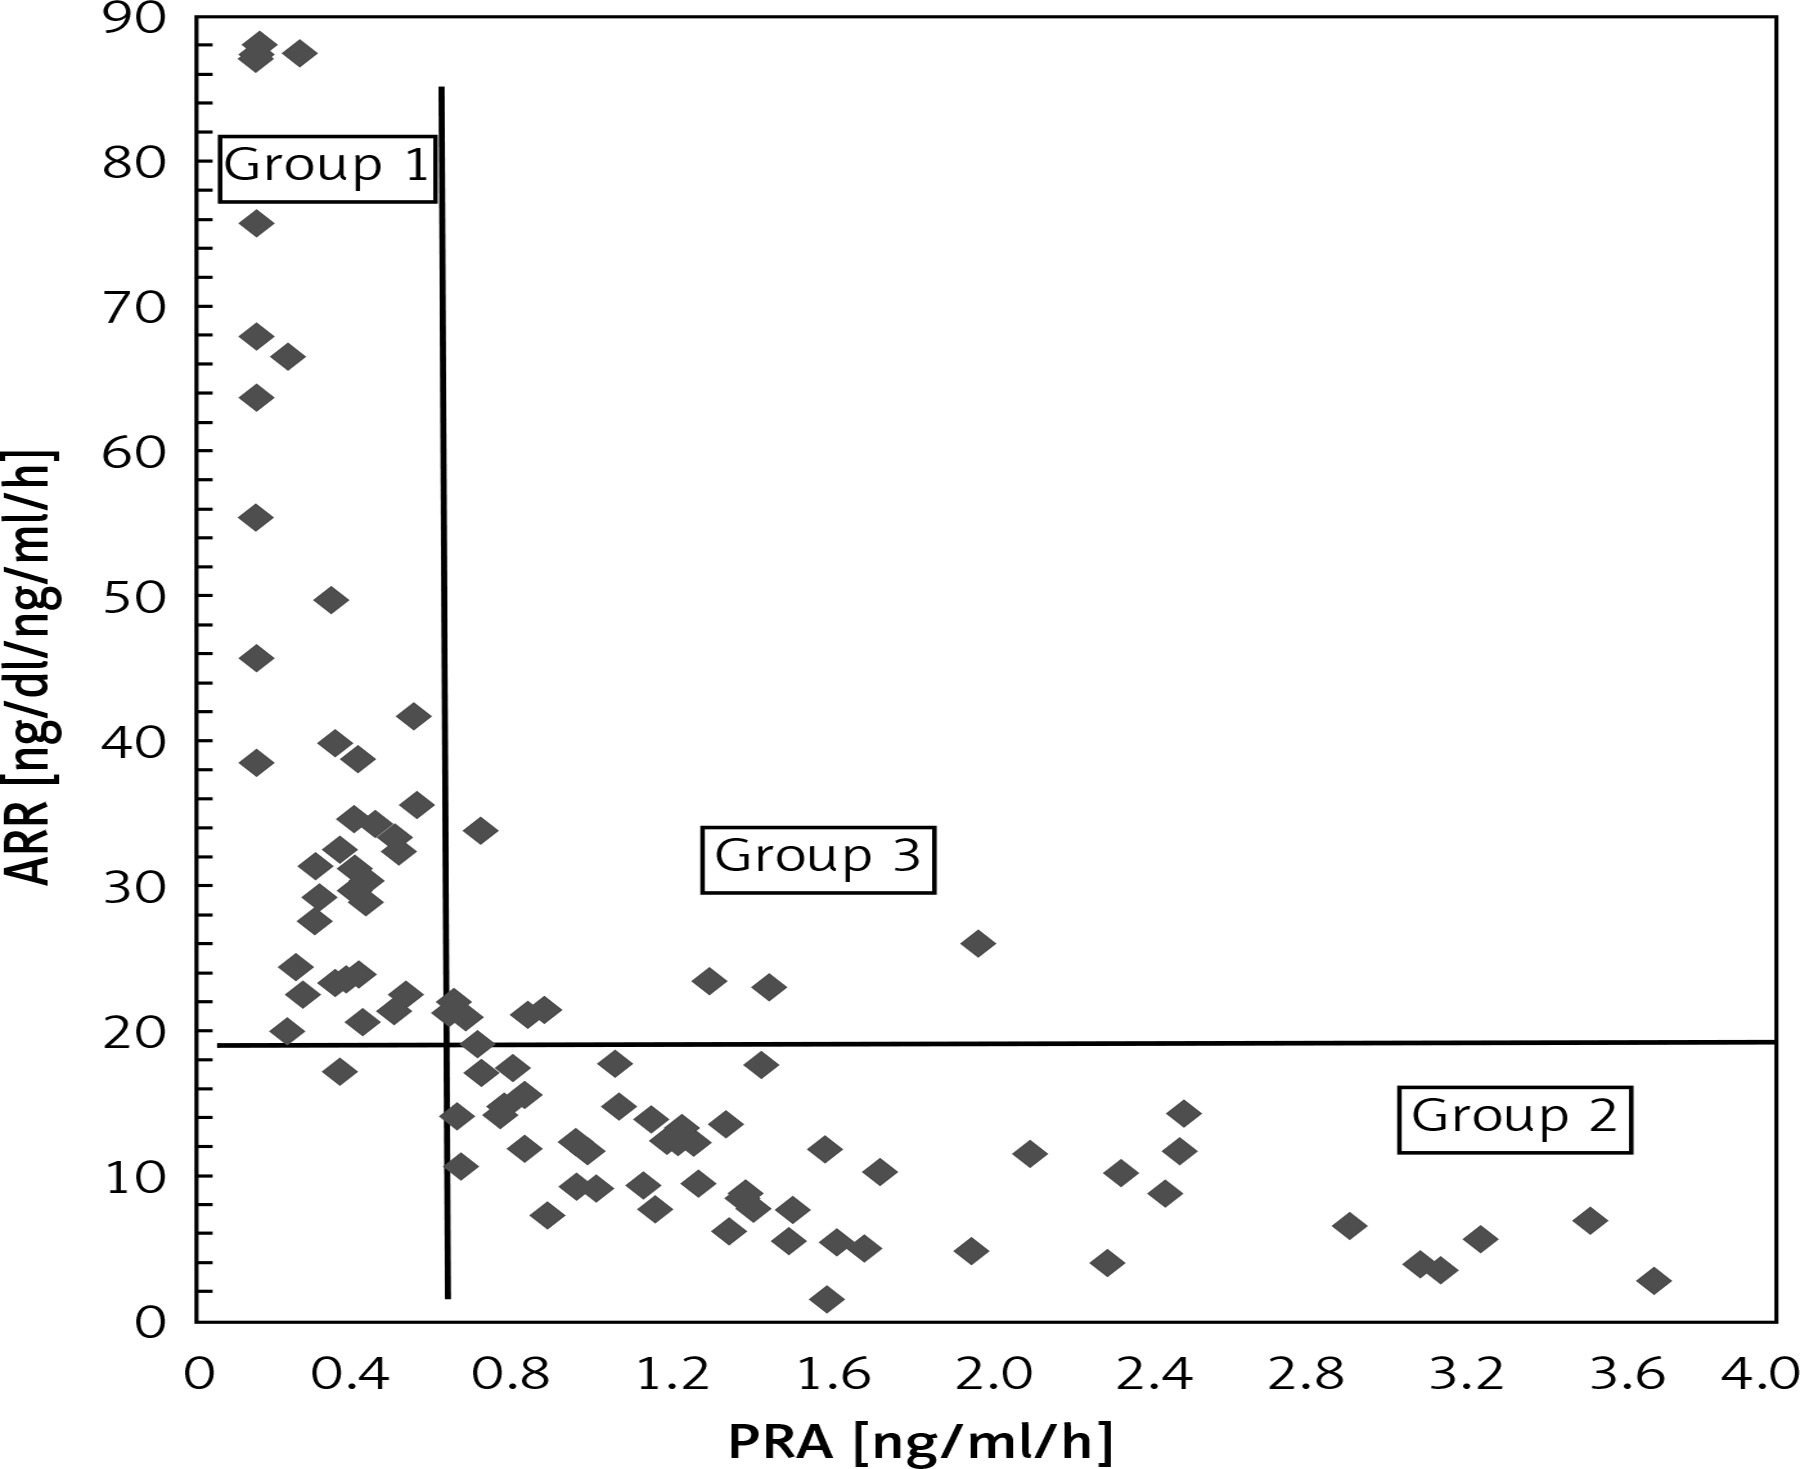
group 1: PRA < 0.65 ng/ml/h and ARR ≥ 18.42 ng/dl/ng/ml/h (number of subjects N = 51),
group 2: PRA ≥ 0.65 ng/ml/h and ARR < 18.42 ng/dl/ng/ml/h (N = 58),
group 3: PRA ≥ 0.65 ng/ml/h and ARR ≥ 18.42 ng/dl/ng/ml/h (N = 12),
group 4: PRA < 0.65 ng/ml/h and ARR < 18.42 ng/dl/ng/ml/h (N = 1).
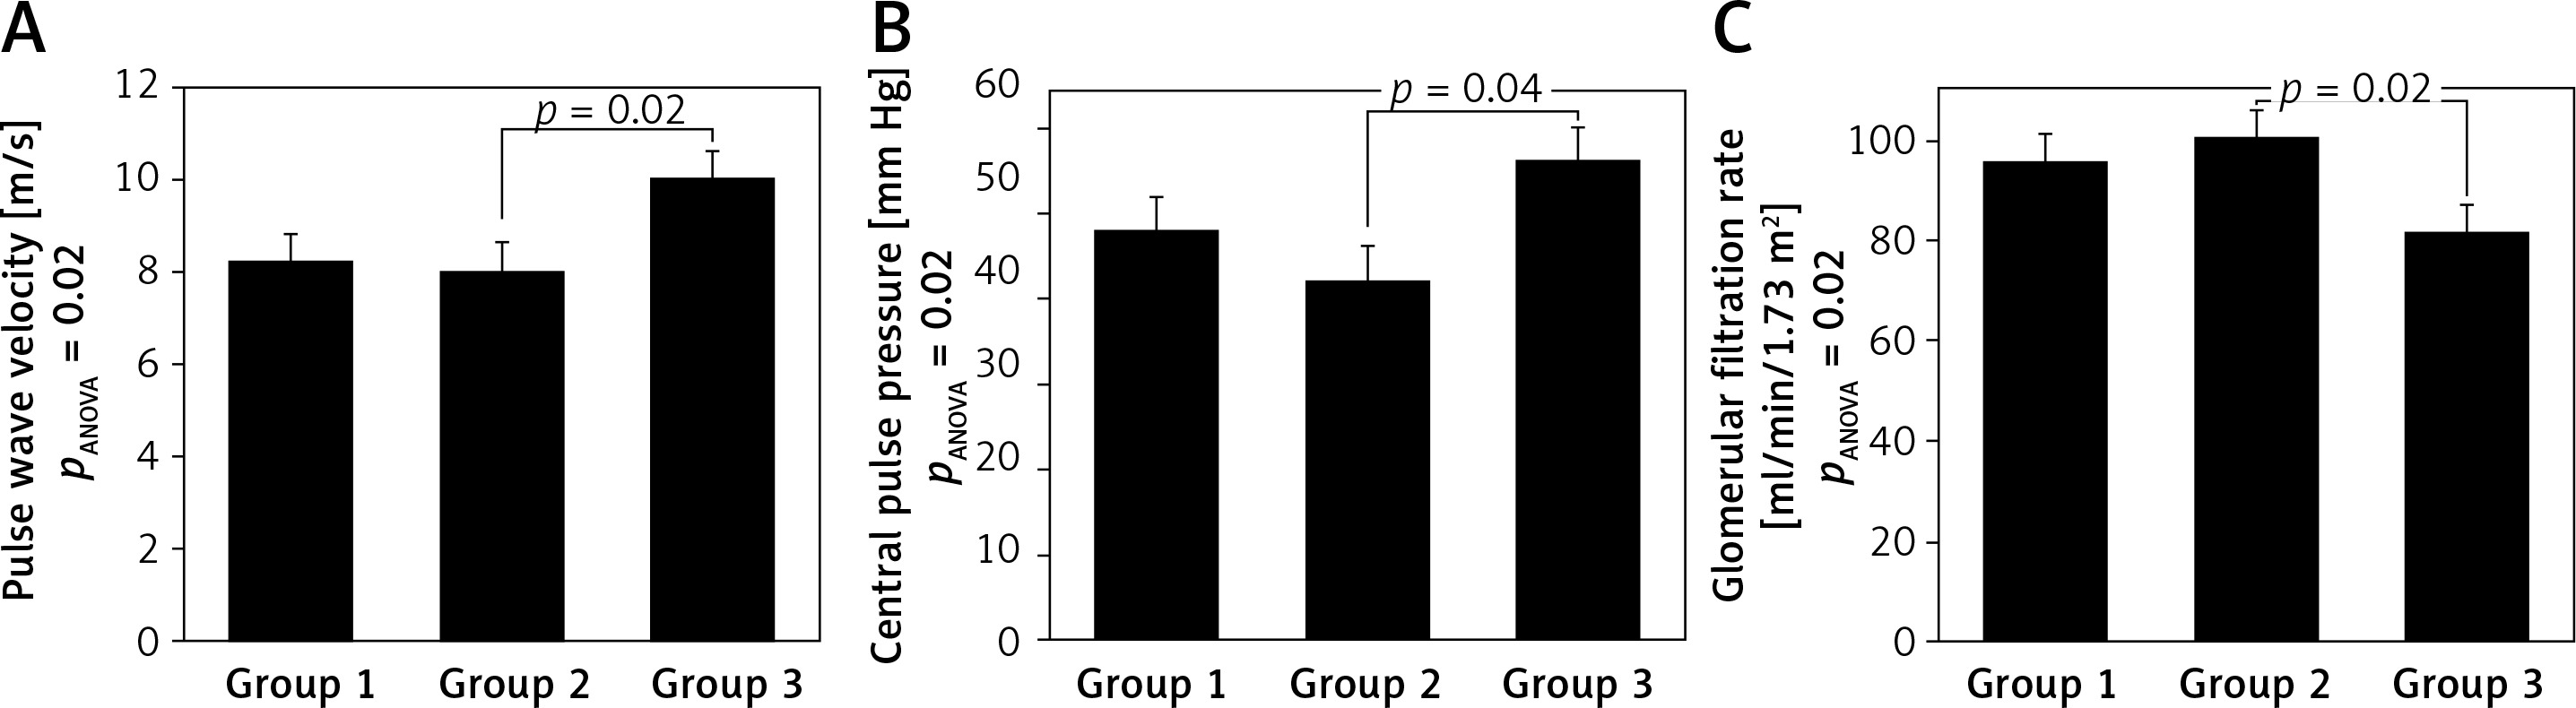
Group 4 was excluded from further analyses because only 1 patient was included. The three remaining groups were compared using analysis of variance (Table III), which revealed significant between-group differences in cfPWV, cPP and eGFR. Subjects in group 3 had significantly higher cfPWV and cPP and significantly lower eGFR values compared to those in group 2 (Figure 2). These differences remained significant for pulse wave velocity and glomerular filtration rate after adjustment for age.
Table III
Comparison of three groups defined based on PRA and ARR values. Group 1: PRA < 0.65 ng/ml/h and ARR ≥ 18.42 ng/dl/ng/ml/h (N = 51); group 2: PRA ≥ 0.65 ng/ml/h and ARR < 18.42 ng/dl/ng/ml/h (N = 58); group 3: PRA ≥ 0.65 ng/ml/h and ARR ≥ 18.42 ng/dl/ng/ml/h (N = 12)
| Clinical characteristics | Group 1 | Group 2 | Group 3 | PANOVA |
|---|---|---|---|---|
| N | 51 | 58 | 12 | |
| Age [years] (SD) | 55.4 (11.3) | 51.9 (13.2) | 57.6 (13.7) | 0.26 |
| Sex, male (%) | 23 (45) | 31 (53) | 6 (50) | 0.64 |
| BMI [kg/m2] (SD) | 27.2 (4.7) | 27.2 (4.7) | 26.0 (2.9) | 0.80 |
| Diabetes mellitus type 2 (%) | 2 (3.9) | 4 (6.9) | 1 (8.3) | 0.57 |
| Smokers (%) | 11 (21.6) | 12 (20.7) | 2 (16.7) | 0.81 |
| SBP [mm Hg]* | 155.0 (18.5) | 147.1 (20.6) | 153.2 (15.5) | 0.16 |
| DBP [mm Hg]* | 92.8 (9.4) | 90.7 (12.3) | 94.2 (7.7) | 0.60 |
| HR [beats/min]* | 69.3 (8.6) | 75.7 (10.1) | 66.6 (12.2) | 0.017#,^ |
| Sodium [mmol/l] | 139.5 (2.3) | 138.1 (2.5) | 137.0 (1.4) | 0.002#,$ |
| Potassium [mmol/l] | 4.16 (0.31) | 4.18 (0.24) | 4.37 (0.28) | 0.15 |
| PRA [ng/ml/h] | 0.32 (0.15) | 2.26 (2.42) | 1.07 (0.47) | < 0.001#,$ |
| ALDO [ng/dl] | 13.4 (5.4) | 14.9 (6.5) | 20.8 (7.7) | < 0.001$,^ |
| ARR [ng/dl/ng/ml/h] | 39.0 (27.1) | 11.2 (6.4) | 22.8 (9.7) | < 0.001# |
| ABPM: | ||||
| SBP 24 h [mm Hg] | 130.2 (9.3) | 31.3 (9.5) | 132.7 (9.5) | 0.84 |
| DBP 24 h [mm Hg] | 78.8 (7.4) | 81.1 (7.3) | 84.0 (9.6) | 0.28 |
| HR 24 h [beats/min] | 71.6 (8.1) | 76.9 (9.3) | 72.0 (10.6) | 0.002# |
| SBP day [mm Hg] | 128.9 (12.0) | 128.4 (12.4) | 132.6 (12.1) | 0.67 |
| DBP day [mm Hg] | 80.0 (8.2) | 80.6 (9.8) | 85.7 (9.3) | 0.26 |
| HR day [beats/min] | 75.5 (9.4) | 81.4 (10.2) | 74.9 (11.2) | 0.01# |
| SBP night [mm Hg] | 115.3 (11.7) | 112.2 (11.4) | 120.4 (8.7) | 0.11 |
| DBP night [mm Hg] | 68.2 (7.8) | 66.4 (8.8) | 74.0 (10.1) | 0.06 |
| HR night [beats/min] | 64.2 (8.2) | 67.2 (8.1) | 65.1 (9.8) | 0.20 |
| Target organ characteristics: | ||||
| cfPWV [m/s] | 8.2 (1.85) | 8.0 (1.50) | 10.0 (2.3) | 0.02^ |
| cPP[mm Hg] | 48.3 (15.5) | 42.5 (16.9) | 56.0 (21.7) | 0.04^ |
| Creatinine [µmol/l] | 67.2 (12.8) | 65.7 (13.0) | 72.4 (9.0) | 0.33 |
| eGFR [ml/min/1.73 m2] | 95.2 (19.7) | 100.0 (18.4) | 81.1 (12.2) | 0.02^ |
| LVMI [g/m2] | 127.2 (34.7) | 131.0 (34.6) | 130.5 (22.3) | 0.85 |
| IMT [mm] | 0.65 (0.15) | 0.60 (0.15) | 0.69 (0.16) | 0.61 |
PRA – plasma renin activity, ARR – aldosterone to renin ratio, BMI – body mass index, SBP – systolic blood pressure, DBP – diastolic blood pressure, HR – heart rate, ALDO – aldosterone plasma concentration, ABPM – ambulatory blood pressure monitoring, cfPWV – carotid-femoral pulse wave velocity, cPP – central pulse pressure, eGFR – estimated glomerular filtration rate, LVMI – left ventricular mass index, IMT – intima-media thickness in common carotid artery (average value from measurements of near and far walls on both sides).
Figure 2
ANOVA for groups distinguished according to PRA and ARR values. Group 1: PRA < 0.65 ng/ml/h and ARR ≥ 18. 4 ng/dl/ng/ml/h, group 2: PRA ≥ 0.65 ng/ml/h and ARR < 18.4 ng/dl/ng/ml/h, group 3: PRA ≥ 0.65 ng/ml/h and ARR ≥ 18.4 ng/dl/ng/ml/h. Values presented as means ± standard error.
PRA – plasma renin activity, ARR – aldosterone to renin ratio, pulse wave velocity – carotid-femoral pulse wave velocity measured using Sphygmocor device, central pulse pressure – central aortic pulse pressure measured using Sphygmocor device, glomerular filtration rate – estimated glomerular filtration rate using MDRD formula [18].
Discussion
In this study, we assessed the relationship between RAAS indices and a wide spectrum of asymptomatic organ damage indices in patients with mild essential hypertension. Most of the previous studies assessed only a single AOD index or several selected AOD indices. Hypothetically, higher RAAS activity should promote and accelerate the development of AOD. However, the available data do not consistently support this hypothesis. For example, Schunkert et al. found that in both men and women, serum aldosterone concentration was strongly related to septal and posterior wall thickness. Furthermore, in women, ALDO was positively and independently associated with LVMI. However, in the same study, no significant associations with LVMI were observed for angiotensinogen, renin, or pro-renin [9].
In a cohort of patients with arterial hypertension, who had never been treated, Catena et al. demonstrated that higher ALDO but not higher PRA characterized patients with left ventricle hypertrophy [20]. Edelmann et al. found in a group of 1575 patients with preserved ejection fraction a significant correlation between serum aldosterone concentration and LVM in women but not in men [21]. In a group of children with arterial hypertension, Loureiro et al. demonstrated an association between carotid IMT and aldosterone as well as ARR. Such association was not confirmed for PRA. The multivariate regression analysis reported by Laureiro et al. revealed that ARR was the only variable that explains changes in carotid IMT [10]. Lee and Lai showed that PRA and ARR but not aldosterone are independently associated with the presence of carotid plaques in patients with coronary artery disease [22].
In the present study, we did not detect a significant relationship between LVMI or IMT and RAAS indices. The most likely explanation for this was the small size of the study group. Previous studies revealing (for example) significant changes of LVMI or IMT under the influence of antihypertensive treatment were large population-based studies or meta-analyses of many studies [23, 24].
In the present study, arterial stiffness indices: cfPWV and cPP were significantly associated with ARR. We consider this result to be important in the light of previously published results. Kisaka et al. demonstrated over a long-term observation period that high ARR is an independent risk factor for cardiovascular events in patients with essential hypertension [25]. Moreover, Newton-Cheh et al. found that increased ARR was a hereditary factor of arterial hypertension. In non-hypertensive participants, the authors observed that a gradual increase in baseline ARR was associated with significantly increased risk for the progression of high BP and incident hypertension, and that renin and aldosterone were more predictive of BP outcomes together than either hormone alone [26].
The highest values of cfPWV and cPP in the present study were observed in patients with high PRA and ARR, i.e. with relatively high ALDO. Tzamou et al. (in a study methodologically similar to the present one) found that higher values of arterial stiffness indices (including cfPWV) were present in patients with increased ALDO and high aldosterone urine secretion levels. However, the correlations between arterial stiffness and RAAS indices obtained in that study were rather weak [11]. Tomaschitz et al. demonstrated in a large cohort of patients undergoing coronary angiography (N = 3056) that a positive correlation exists between ARR and peripheral and central BP [27]. This finding is in full accordance with our results concerning cPP. Meanwhile, the results obtained by Mahmud and Feely are only partially congruent with our findings [28]. These authors demonstrated a significant, positive correlation between ARR and aortic pulse pressure, but not aortic PWV.
In summary, the stiffness of the large arteries seems to depend on RAAS activity, and especially on ALDO. Arterial stiffening is probably one of the most important long-term harmful effects of aldosterone in the cardiovascular system. In a previous study comparing the influences of different antihypertensive drugs on cfPWV, decreased cfPWV was accompanied by decreased ALDO. The latter relationship reached statistical significance in the ACE-inhibitor (quinapril)-treated group [29].
The ESH/ESC Guidelines state that eGFR in the range 30–60 ml/min/1.73 m2 is one of the markers of AOD in patients with arterial hypertension [8]. However, even less pronounced renal function impairment can indicate higher cardiovascular risk. In the VALIANT trial (Valsartan in Acute Myocardial Infarction Trial) the risk of death and composite end point – death from cardiovascular causes, congestive heart failure, recurrent myocardial infarction, resuscitation after cardiac arrest, and stroke – increased with decreasing GFR in a 2-year follow-up of 14.5 thousand patients with myocardial infarction complicated by heart failure or left ventricular dysfunction. It is worth emphasizing that this relationship occurred from a relatively high value of GFR – i.e. 81 ml/min/1.73 m2 – below which any decline in GFR of 10 units was associated with an increase in the risk coefficient for death and cardiovascular complications of 1.10 [30].
In the Kaiser Permanente Southern California study, higher levels of PRA were found to be associated with greater rates of chronic kidney disease (CKD), while increased ARR was inversely correlated with the frequency of CKD [7]. Contradictory results were obtained in a Japanese population in the Ohasama Study, where lower PRA and higher ARR were associated with the development of CKD in the general population, suggesting that they are independent predictors of CKD [31]. These discrepant results probably arose from ethnic differences and different eating habits, particularly those concerning salt intake. In our study, patients with high renin levels had simultaneously high ARR, and in consequence relatively high serum aldosterone concentration. This group of patients also had the lowest eGFR values. We demonstrated, using multiple regression, that aldosterone concentration was in our group of patients significantly and independently associated with the eGFR value. Furthermore, the most severe configuration of RAAS indices in terms of renal dysfunction was simultaneously increased renin and ARR. These results indicate that eGFR should be calculated with the MDRD formula in all patients with essential arterial hypertension and an exact value, rather than a rough estimate (> 60 ml/min/1.73 m2), should be determined.
Despite the fact that increased RAAS activity worsens the prognosis for survival and cardiovascular events as indirectly evidenced in large clinical trials with different drugs reducing RAAS cascade components (in heart failure, ischemic heart disease and arterial hypertension) [8, 32–35], many other studies (cited by us previously) are still focused on the relationships between RAAS activity and AOD indices. In the early stages of arterial hypertension this is due to the need to identify the subjects in whom treatment with RAAS blocking agents can bring the greatest clinical benefits. Another reason to search for the RAAS phenotype associated with more advanced AOD is the greater availability and lower cost of PRA, aldosterone and ARR determination compared to the assessment of broad spectrum AOD indices using echocardiographic, carotid ultrasound and arterial stiffness examination. If such a phenotype might be predefined (according to the results of our study it is the configuration of simultaneously high PRA and high ARR), this might limit and specify the indication for AOD assessment.
The most important limitation of this study was the relatively small sample size. The consequences of the small sample size might be: low representativeness for the general population, overestimation of the obtained effect, high risk of unknown confounding factor presence, e.g. the duration of undiagnosed hypertension, random error and low reproducibility of results. Therefore, the obtained results need to be confirmed in a larger group of patients. In addition, previous antihypertensive treatment in about 30% of patients could have influenced our investigation of AOD indices. Another limitation of our study is the lack of data regarding sodium intake and urinary sodium excretion, which potentially may influence PRA and aldosterone levels and subsequently affect BP and target organ damage to a varying degree depending on salt sensitivity [36]. However, valuable and reproducible assessment of sodium intake in individual subjects, even assessed by 24-hour urine collection, considered as a gold standard, is hardly possible [36]. That is why we did not decide to include this parameter in our study. Moreover prospective cohort studies have reported that the association between sodium consumption and cardiovascular disease or mortality is U-shaped, with increased risk at both high and low sodium intake [37].
In conclusion, taking into consideration discrepancies concerning the relationships among PRA, aldosterone, ARR, and kidney disease discussed previously, the interdependences of these indices are likely very important and should be routinely assessed in relevant patients. Lee and Lai made a similar statement concerning the relationship between carotid atherosclerosis and RAAS indices [22], and we believe that in the light of the results of the present study, this statement should be extended to kidney damage and arterial stiffness indices. The simultaneous assessment of PRA, ALDO, and ARR should be performed to allow better prognosis of kidney damage and prediction of the development of arterial stiffness.