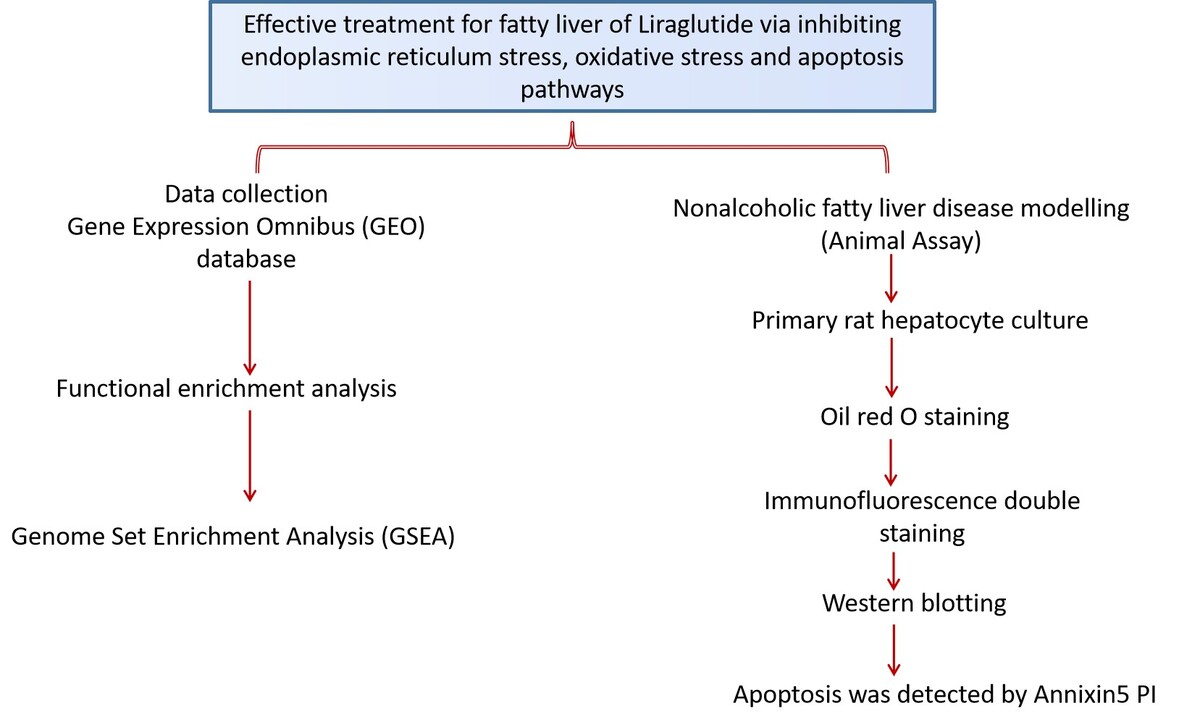
Introduction
Fatty liver disease (FLD) is a clinicopathological syndrome distinguished by an excess of lipids within hepatocytes, resulting in hepatic steatosis [1]. The disease can occur in different races, genders, and age groups, with the highest incidence among people aged 40–49, and the prevalence rate among adults in China is 15–25%. In recent times, there has been a notable increase in the prevalence of FLD, accompanied by a shift in lifestyle and dietary patterns, resulting in an earlier onset of the condition. This can be attributed to the overall enhancement in individuals’ standard of living and modifications in their daily routines and nutritional choices [2, 3]. FLD is not an independent disease but is common to a variety of diseases and will affect the recovery of other diseases. Fatty liver (FL) affects human digestive function and liver metabolism function to different degrees. The body’s absorption of lipids is obstructed, and the body’s energy metabolism is disorganized, thus reducing its defense ability against pathogenic bacteria, viruses, and other pathogenic microorganisms [4]. At present, there is a lack of comprehensive knowledge pertaining to the pathogenesis of FLD. The elucidation of the fundamental processes is crucial to expedite and enhance the effectiveness of treatment strategies for this particular condition. The cause of the disease can be ascribed to genetic issues, chromosomal changes, gene fusion, and various other contributing factors [5]. Hence, it is imperative to investigate the molecular mechanisms underlying the development of hepatic steatosis [6].
Medical bioinformatics is a multidisciplinary field that employs computer science techniques to effectively manage, collect, evaluate, and assess biological and clinical information [7]. In the past few decades, the field of life science has witnessed significant advancements due to the rapid progress of genetic chips and high-throughput genome sequencing technologies [8]. These technological innovations have enabled researchers to efficiently conduct comprehensive analyses of the entire transcriptome and genome, thereby facilitating the development and advancement of the field [9]. The development of research on the gene expression profile of FLD, along with the establishment of multiple public databases, enables the exploration of FLD through the utilization of bioinformatics techniques. Consequently, this facilitates the expansion of knowledge regarding the pathological mechanism underlying FLD [10]. Endoplasmic reticulum stress (ERS) refers to the cellular activation of various responses, including the unfolded protein response, endoplasmic reticulum overload response, and caspase-12, as a reaction to the accumulation of misfolded and unfolded proteins in the endoplasmic reticulum lumen. This stress condition also involves the disruption of the calcium homeostasis-mediated apoptosis pathway and other signaling pathways [11]. Tunicamycin is an inducer of ERS. As an important organelle, the endoplasmic reticulum regulates the processing and modification of proteins and some lipids. Unfolded protein responses attempt to maintain the normal operation of the endoplasmic reticulum within a certain range, and adverse factors such as diet, diseases, and gene mutations disrupt the balance and induce ERS, which is related to hepatocyte fat accumulation, oxidative stress, inflammatory factors, and cell apoptosis [12, 13].
Liraglutide is a long-acting glucagon-like peptide 1 (GLP-1) analogue that has a high sequence homology with human glucagon-like peptide 1. Liraglutide can bind and activate the glucagon-like peptide 1 receptor and promote the secretion of insulin by pancreatic beta cells [14]. Liraglutide can prolong the gastric emptying time, reduce the hunger of patients, reduce the intake of energy, further promote the reduction of body weight and body fat, reduce the deposition of liver fat, and promote the improvement of FLD [15].
Nevertheless, the precise molecular mechanism underlying the therapeutic effects of this treatment on FLD remains elusive. Hence, the objective of this study is to employ bioinformatics technology to identify the differentially expressed genes associated with FLD, to conduct enrichment analysis and pathway analysis. The FLD cell model was developed through the induction of free fatty acids (FFAs) in a liver cell line. Subsequently, an investigation was conducted to examine the inhibitory impact of liraglutide on hepatic steatosis, as well as to elucidate the underlying molecular mechanism involved. This study combined the medical bioinformatics and molecular experiments, to provide a better perspective for the study of FLD as well as the use of liraglutide on the treatment of FLD, which will provide bright light for patients.
Material and methods
Data collection
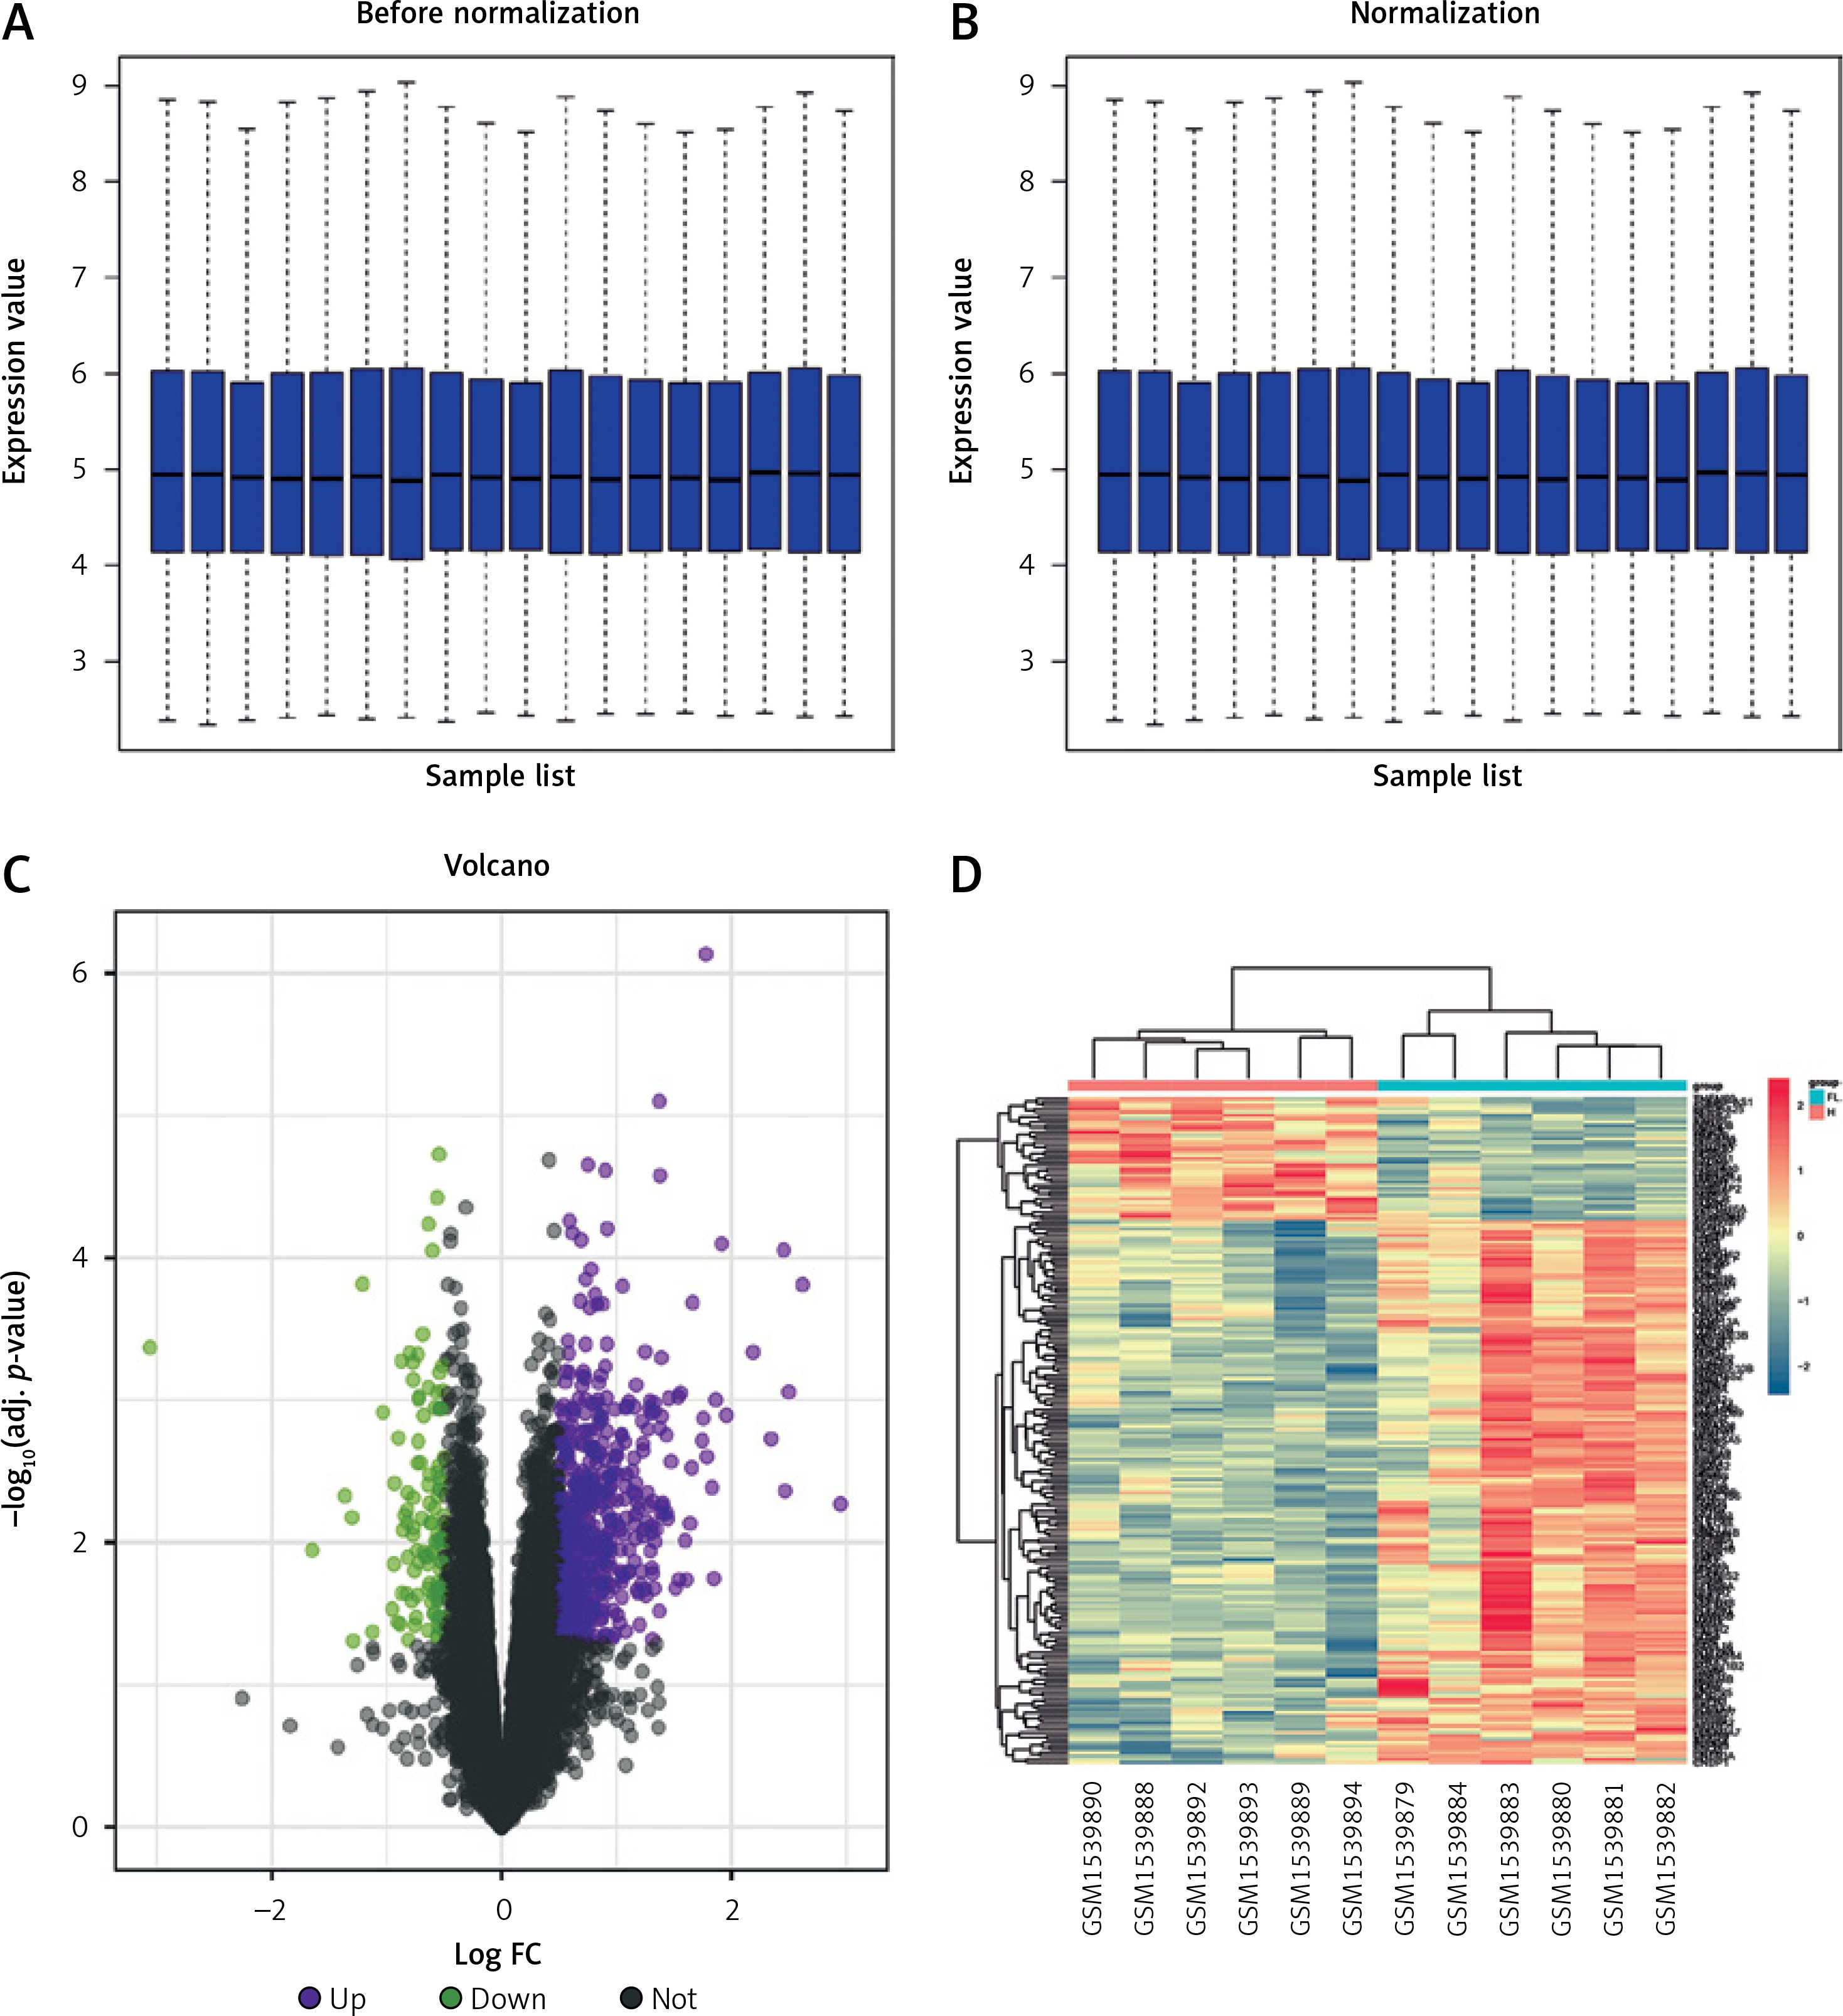
In the Gene Expression Omnibus (GEO) database, the FL gene expression dataset GSE63067 [GPL570 platform (Affymetrix Human Genome U133 Plus 2.0 Array)] was downloaded. This platform is a data set for mRNA sequencing for FL. Using the R language Limma package, analysis of differentially expressed genes (|logFC| > 0.5, p < 0.05) and cluster assessment were conducted at the same time. The GGPLOT2 software package was used to draw the volcano map of the GSE63067 data set, and the PHEATMAP software package was used to draw the cluster assessment heat map of DEGS.
Functional enrichment analysis
Gene Ontology (GO) enrichment assessment, KEGG (Kyoto Encyclopedia of Genes and Genomes) enrichment assessment and BIOCARTA enrichment assessment were performed for GSE63067 genes. With DAVID online tools (https://david.ncifcrf.gov/), the biological process (BP) levels of differentially expressed genes were analyzed, and the BP network was established. GGplot2 and GOplot software packages were used for GO and KEGG pathway enrichment analysis of DEGs in the R language environment.
Genome set enrichment analysis (GSEA)
GSEA is a computational approach used to evaluate the enrichment of gene sets within a given genome. In this analysis, a selection of functioning sets of genes is chosen from the MSIgDB and sequenced according to the degree of correlation observed within gene expression data and phenotypes. Furthermore, the enrichment of genes was assessed within each genome in either the upper or lower portion of the gene list subsequent to phenotypic correlation sequencing. This analysis aimed to ascertain the impact of synergistic gene alterations within this genome on phenotypic variations. The GSEA approach was employed to conduct an enrichment assessment on all genes. Additionally, a pathway map illustrating the results of the GSEA enrichment analysis was created.
NAFLD modelling
Following 1 week of adaptive feeding, 21 Sprague-Dawley (SD) rats were utilized in this investigation and arbitrarily assigned to three distinct groups: the normal control group (n = 7, fed with a chow diet for 10 weeks), the Model group (n = 7, fed with a high-fat diet for 10 weeks), and the liraglutide group (n = 7, fed with a high-fat diet and gavaged with liraglutide/0.03 mg/kg/day for 10 weeks). After providing a high-fat diet and a standard diet for 8 weeks, body weight, Lee’s index, adipose tissue and blood metabolism related indexes were measured. The weight and conditions of these rats were monitored during this time. Upon completion of the experiment, the animals were anaesthetized and killed; they were dissected, and hepatic histopathological examination found significant hepatocyte steatosis and fat vacuoles in the model group, indicating the success of non-alcoholic FLD (NAFLD) modelling. The liver tissue of rats was quickly removed, and about 1 cm3 of liver tissue was cut from the liver lobes for quick freezing and reserved. The remaining liver tissue was divided into 1.5 ml centrifuge tubes for subsequent pathological testing. All experiments were agreed by the committee of the Second Affiliated Hospital of Bengbu Medical College, Bengbu.
Primary rat hepatocyte culture
The neonatal SD rat liver was cut into pieces and washed repeatedly with Hanks’ solution (Merck, Germany) 3 times. After digestion with 0.1% type IV collagenase for 30 min, the digestion was terminated with a complete medium of 3 times the volume. Finally, the tissue suspension was filtered through a 100-mesh steel mesh, the residue was repeatedly washed, and the filtrate was collected. The filtrate underwent centrifugation at 50×g for 2 min, resulting in the collection of precipitates. The cells were resuspended and platted with DMEM (Gibco, USA) + 10% FBS medium and then cultured for 48 h and then we grouped the cells into the FFA group, the FFA+ liraglutide (100 nmol/l) group, the FFA + tunicamycin (1 µg/ml) group, and the FFA + liraglutide + tunicamycin group for western blot testing, and cell climbing slices were used for immunofluorescence double staining.
Oil red O staining
The quick-frozen tissue was placed in the constant refrigerator slicer to freeze the sections and fix them. They were soaked with 60% isopropyl alcohol for 2 min. After 4 min of oil-red O staining, 60% isopropyl alcohol was mixed and washed with water. Hematoxylin redyeing, differentiation, and antiblue staining were performed. The tablets were sealed with a water-based sealant.
Immunofluorescence double staining
Immunofluorescence staining was performed on cultured cells. The slides that had climbed onto the cells in the culture plate were soaked and fixed with PBS. Goat serum was dropped on the slide and it was sealed for 20 min. The primary antibodies of mouse anti-rat CHOP (No. 66741-1-Ig), Proteintech, and rabbit anti-rat PERK (phospho T982) (Ab192591, Abcam) were dropped on the slide at 4°C overnight and washed, followed by immersion and addition of the corresponding fluorescent secondary antibody; repeat dyeing with DAPI was conducted for 5 min, then sealing, and finally observation under a fluorescence microscope.
Western blotting
The liver tissue was removed and ground and the total protein of the liver tissue was extracted using the total protein extraction kit. The Bradford method was used to measure the protein concentration after extraction. The protein was added to the load buffer and boiled to denature it. The protein was then subjected to sodium dodecyl sulphate-polyacrylamide gel electrophoresis (SDS-PAGE). After electrophoresis to the appropriate position, the electrophoresis was finished, and the film was transferred to the transfer tank. After membrane transfer, the PVDF membrane was taken out, immersed in TBST, and shaken for 5 min in a shaker. The TBST was poured out and the PVDF film immersed into the skim milk powder solution. The tray was shaken slowly for 2 h. After the closure, the diluted primary antibodies, all purchased from Abcam and diluted to 1 : 1000, were poured into the antibody incubator box, and the closed PVDF membrane was put into the antibody incubator for overnight incubation. The second antibody was incubated in the same manner for 1 h. After the second antibody was incubated, the PVDF membrane antibody incubator box was taken out and immersed in TBST. The process was repeated 3 times by shaking the incubator for 45 min. Finally, the exposure was initiated, and the optical density of the strips was analyzed using a gel image processing system.
Apoptosis was detected by Annixin5 PI
We inoculated the hepatocytes in a 12-well plate at a concentration of 4 × 10⁴/ml, changed to serum-free RPMI 1640 medium after 24 h, and used TGF-β1 at a final concentration of 20 ng/ml to culture the cells in the medium for 72 h. We centrifuged the cells and their supernatants, adjusted the cell concentration to 1 × 10⁶/ml, added 100 µl of cell suspension to 5 µl of annexin and 2.5 µl of PI staining solution (Thermo Scientific, USA), shook and mixed gently (10 min on ice, avoiding light), and within 30 min performed flow cytometric quantitative analysis. Annexin and PI staging solutions were all from Annexin 5 in the PI Kit.
Ethics statement
The Experimental Animal Ethics Committee of The Second Affiliated Hospital of Bengbu Medical College (No. 2020253) approved all the experiments conducted.
Statistical analysis
The experiments conducted in our study were repeated three times, and the mean value and standard deviation were calculated. The assessment of variations in the outcomes was performed using the GraphPad Prism 6 system, using one-way analysis of variance (ANOVA) and the t-test. In the context of statistical assessment, a significance level of p < 0.05 was deemed to indicate statistical significance.
Results
Impact of liraglutide on lipid metabolism
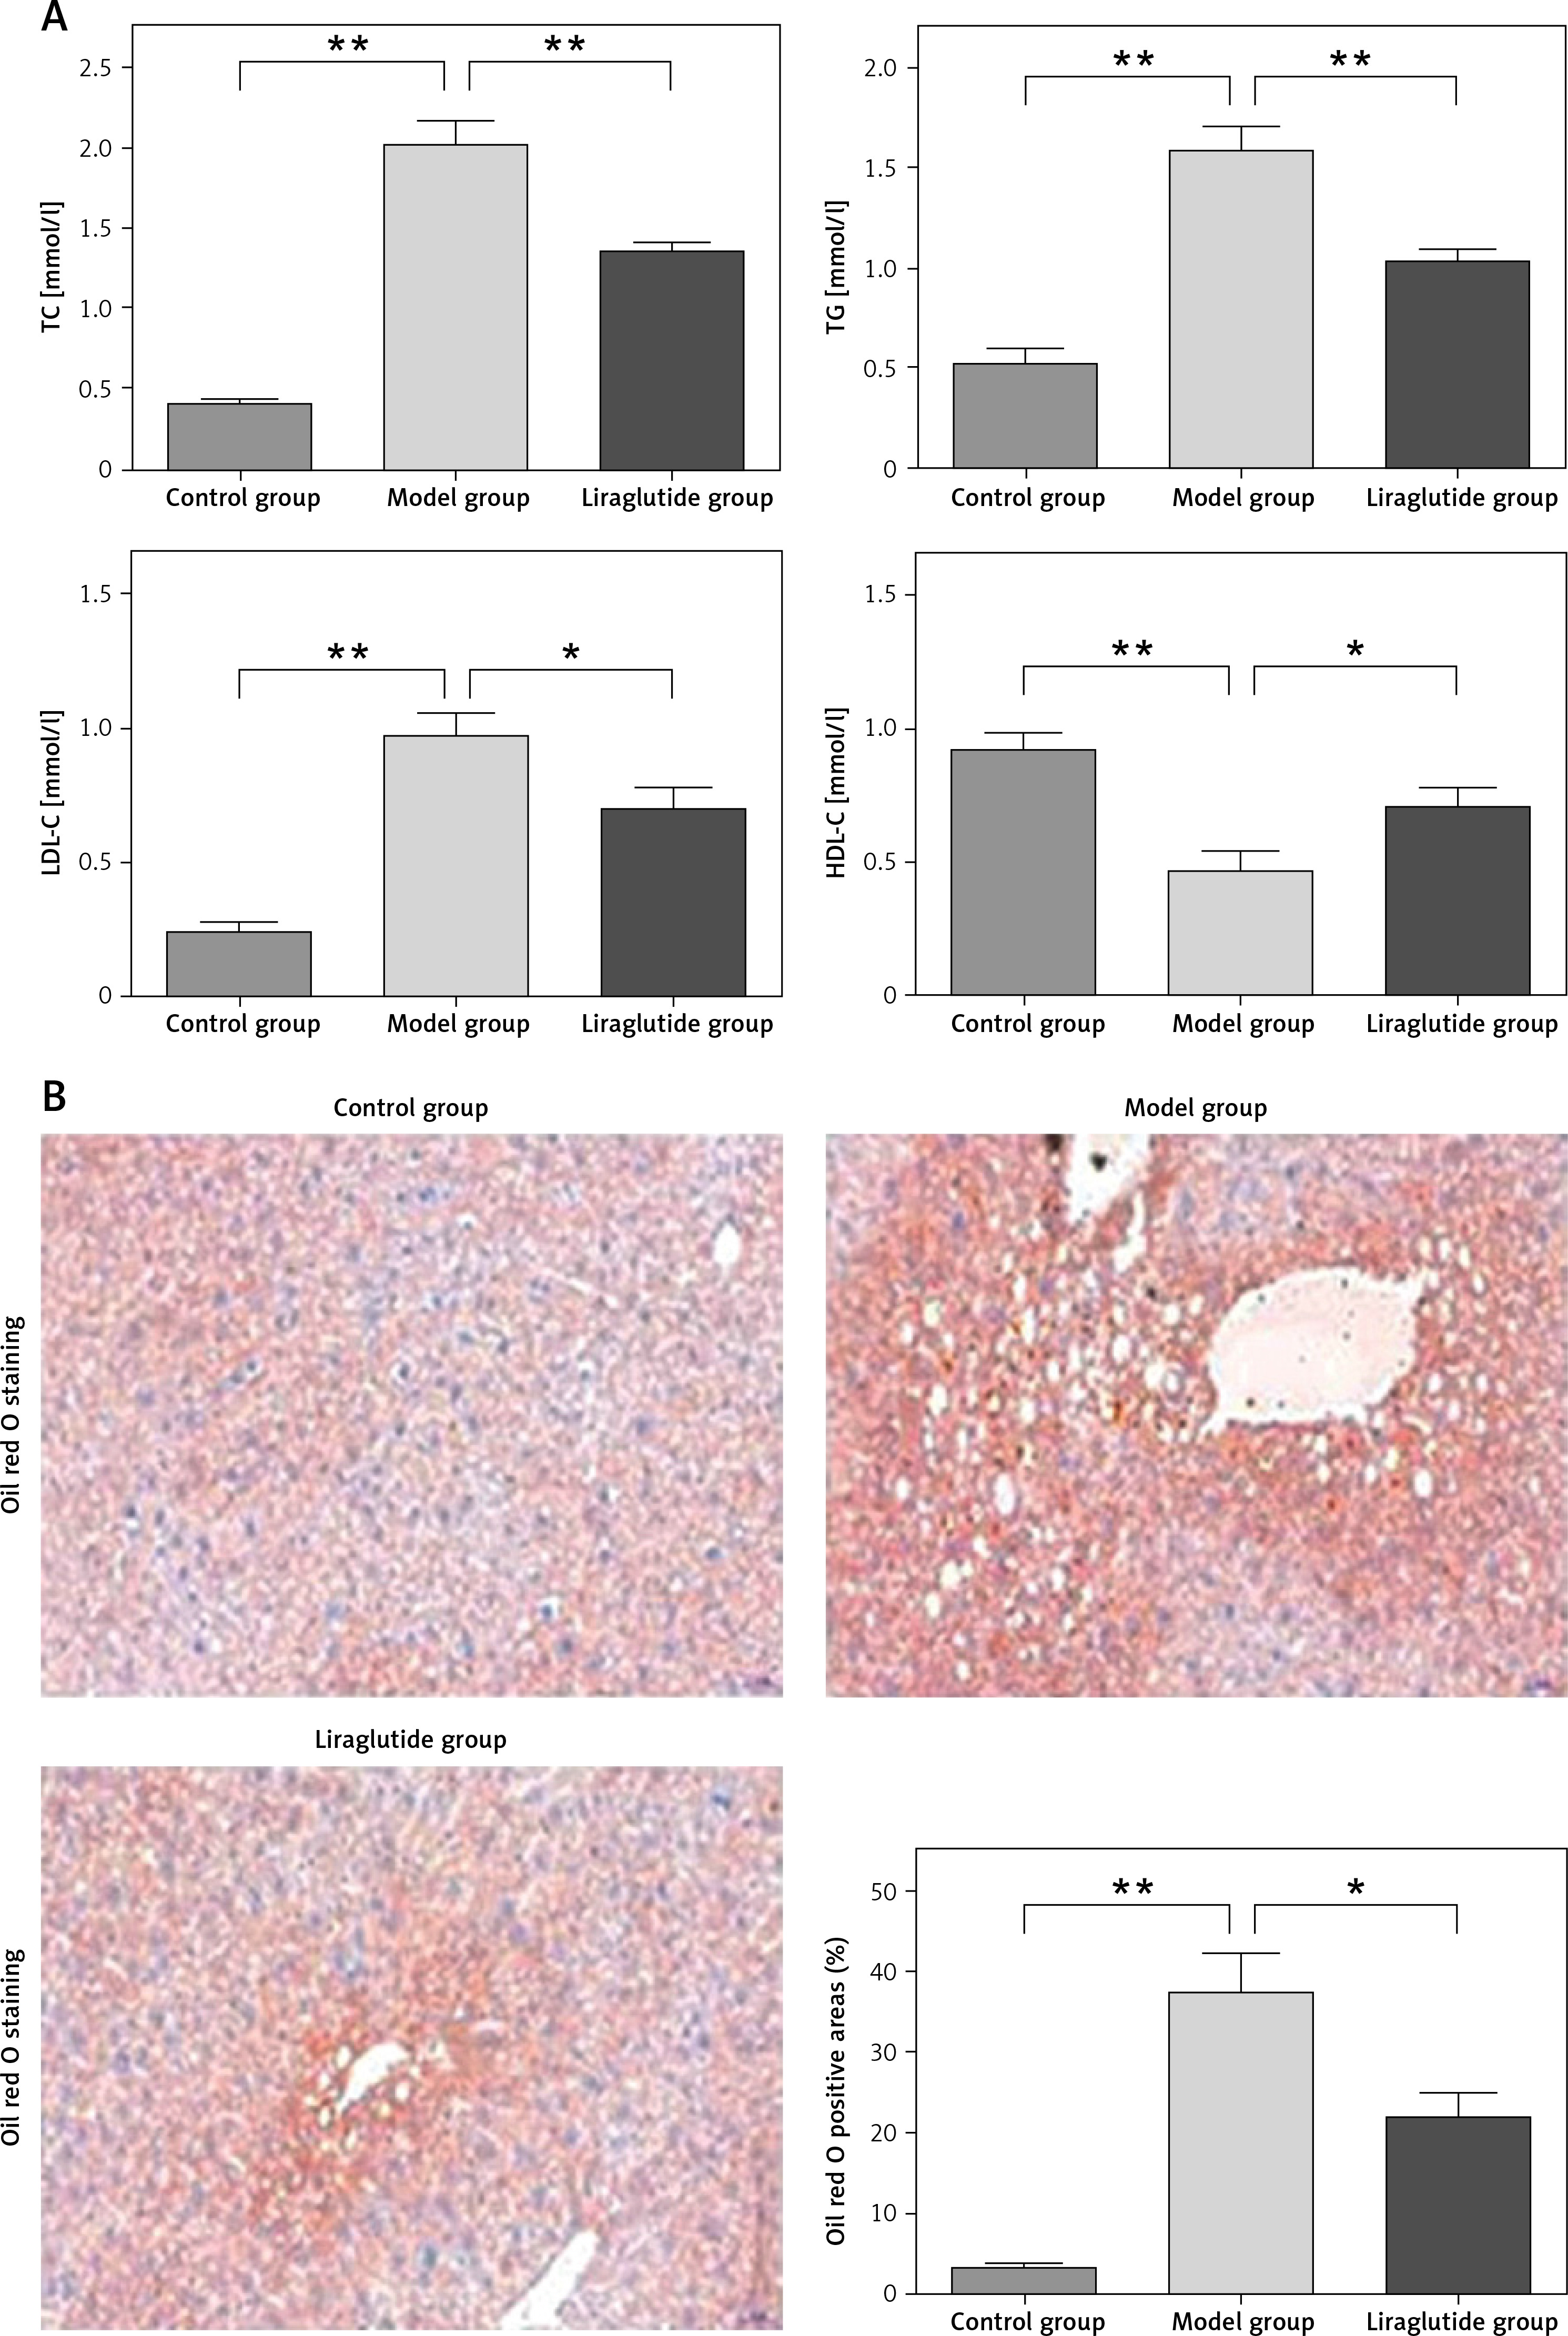
The study presented the serum levels of total cholesterol (TC), triglycerides (TG), low-density lipoprotein cholesterol (LDL-C), and high-density lipoprotein cholesterol (HDL-C), as well as the histological alterations observed in the liver of SD rats across various experimental groups. The serum concentrations of TC, TG, LDL-C, and HDL-C were measured. The experimental group demonstrated an elevation in TC, TG, and LDL-C levels while concurrently experiencing a reduction in HDL-C levels. Conversely, the group treated with liraglutide exhibited an increase in plasma HDL-C levels and a reduction in TC, TG, and LDL-C levels. The results revealed that liraglutide treatment improved plasma lipid profiles (Figure 1 A). Histological analyses of liver tissues from each group were performed. The Oil Red O dye is used to visually emphasize the presence of lipid droplets, which are rendered in a vivid shade of red within the biological sample. The bar graph displays the percentages of Oil Red O-positive areas, indicating the presence of large vacuoles in the livers of SD rats. The results demonstrate that treatment with liraglutide led to a reduction in the occurrence of these vacuoles (Figure 1 B).
Figure 1
Effects of liraglutide on lipid metabolism. A – Serum levels of TC, TG, LDL-C, and HDL-C. B – Histological changes in the liver of SD rats in different groups. Images of Oil Red O staining on frozen liver sections (magnification, 200.), as indicated (scale bars: 50 µm). Data are presented as mean ± standard error (SEM). *P < 0.05, **p < 0.01. Error bars represent the SEM
Screening of DEGs
The GSE63067 dataset pertaining to FLD was obtained from the GEO database. This data set was the mRNA data set, and then quantile-standardized preprocessing was performed on the data collection, and a boxplot was drawn (Figures 2 A, B). DEGs were filtered out of GSE 63067 based on the p-value < 0.05 and |logFC| > 0.5. The data set included 384 DEGs in total, 321 of which were up-regulated and 63 of which were down-regulated. The GGplot2 program in R software was used to create the volcano map of GSE63067 (Figure 2 C), and the PHEATMAP package was employed to construct the cluster assessment heatmap of DEGS (Figure 2 D).
Analysis of DEGS enrichment in GSE63067
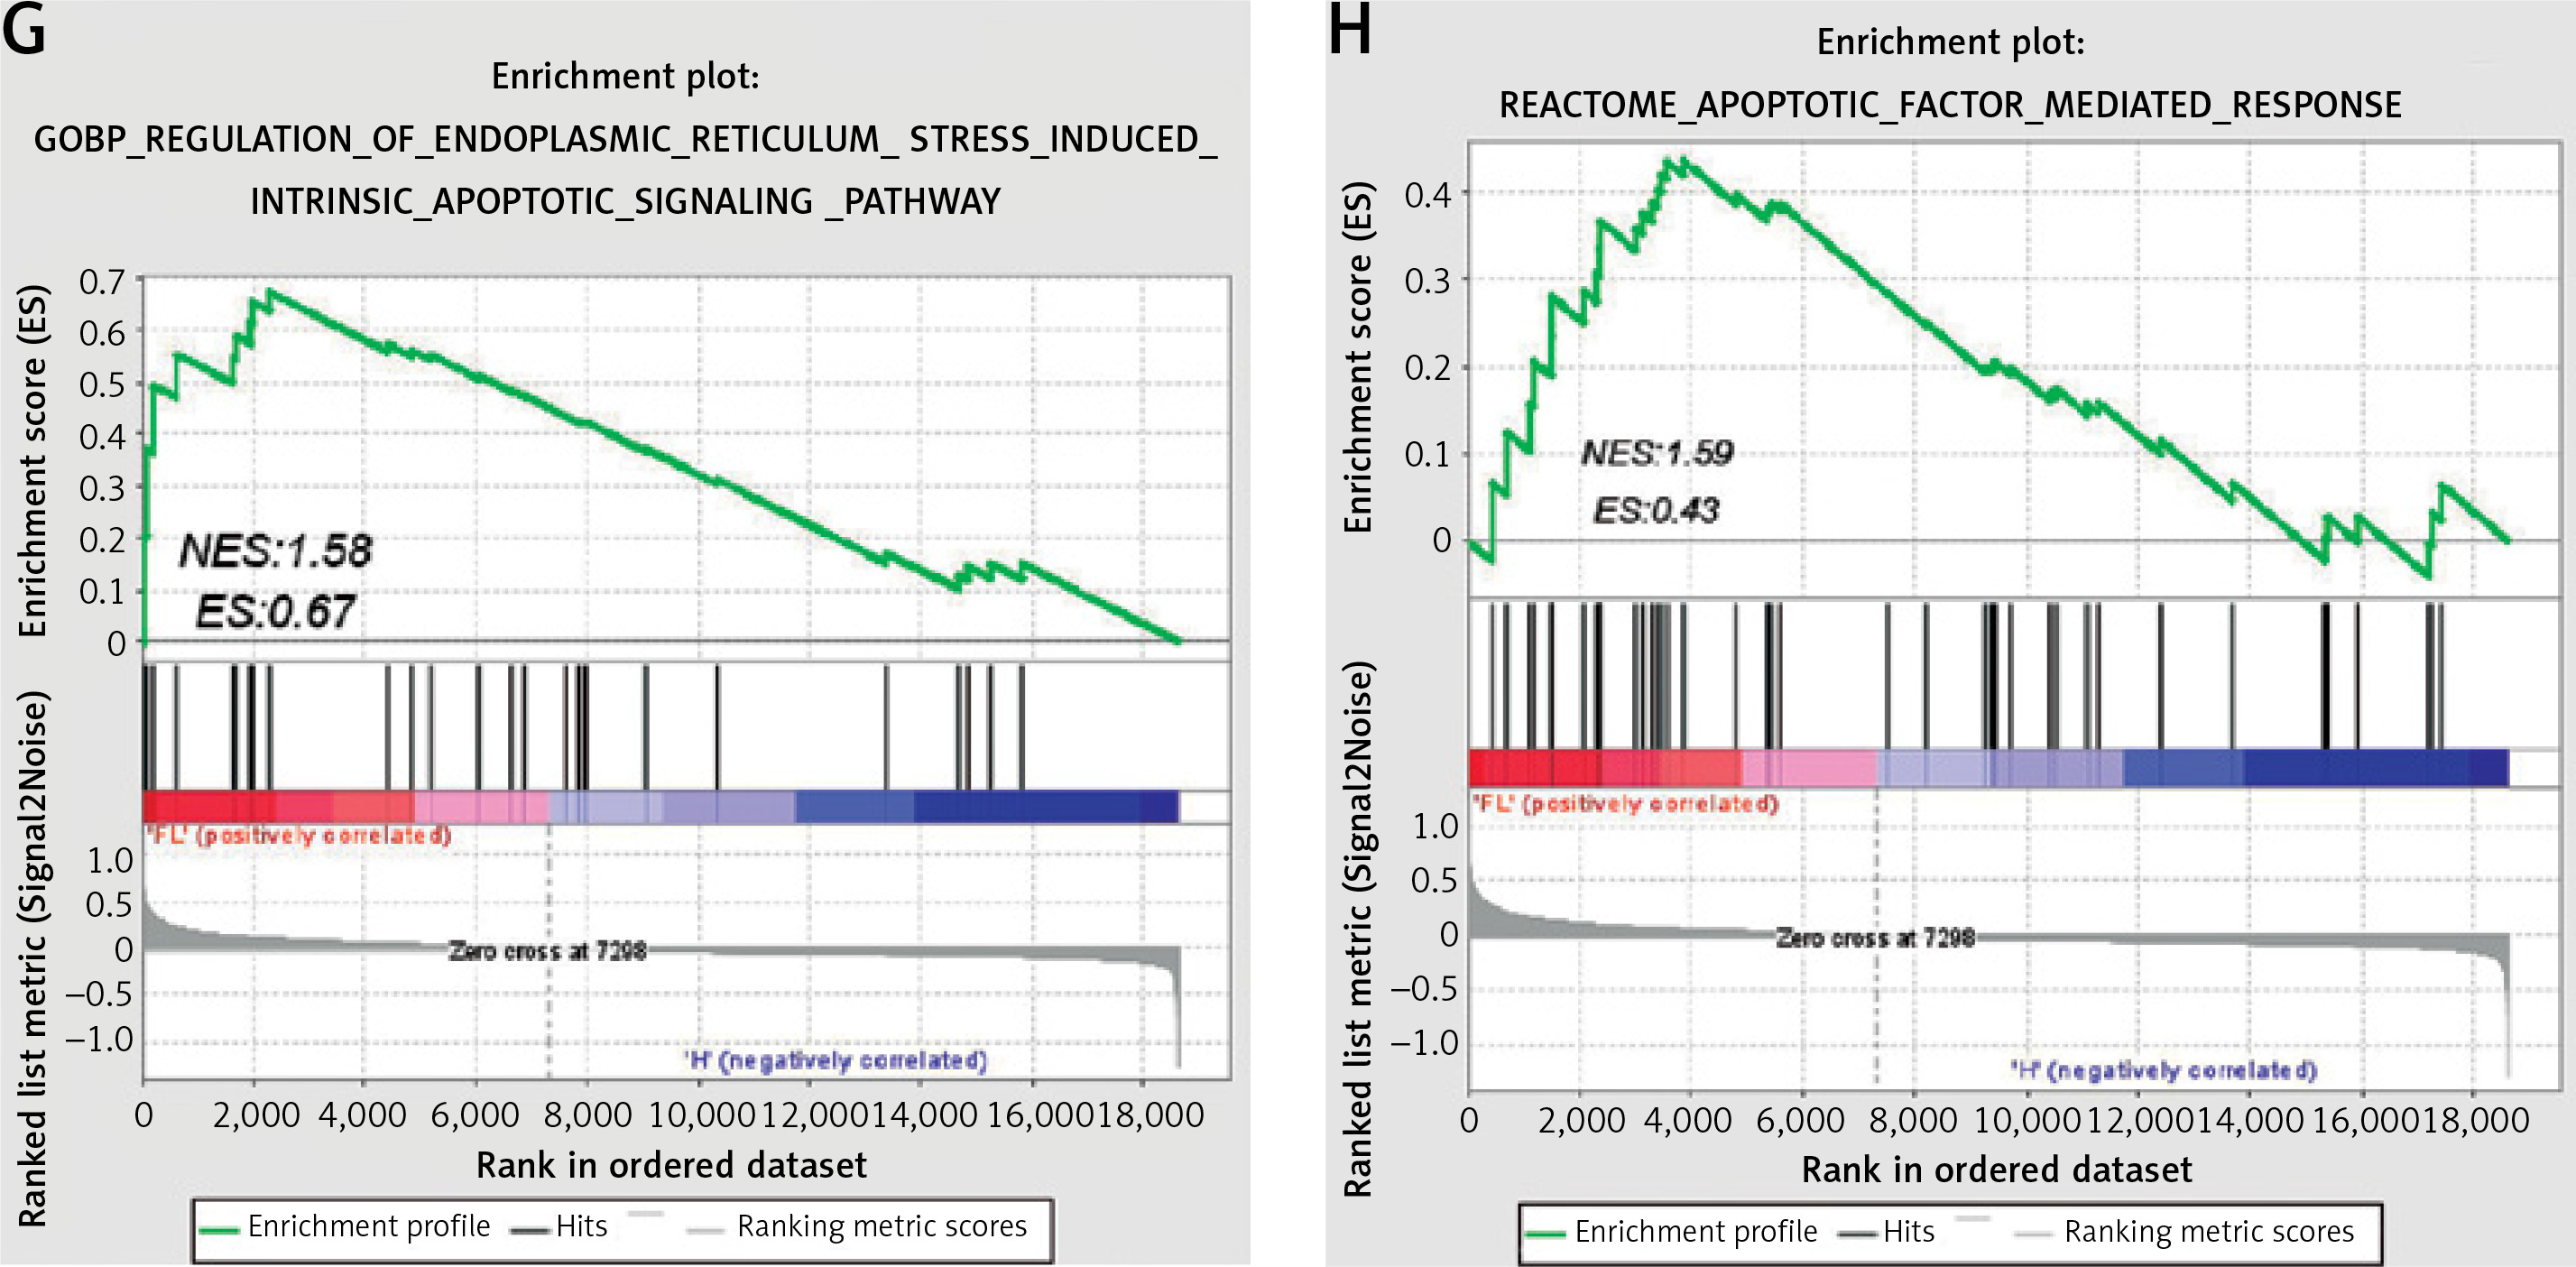
The DEGS in the GSE63067 dataset were subjected to GO enrichment assessment. The R programming tool was utilized to create the schematic diagram of the GO upregulation pathway (Figure 3 A) and chord diagram (Figure 3 B), which indicated that it was enriched in the inflammatory response, immune response, apoptosis pathway, etc. Then, the down-regulated GO pathway diagram (Figure 3 C) and the string diagram (Figure 3 D) were drawn, and it was found that the down-regulated GO gene was enriched in the signal transduction pathway of transforming growth factor β receptor, the establishment of cell polarity, the expansion of protein reaction and other pathways. The KEGG enrichment analysis diagram (Figure 3 E) and Biocarta enrichment analysis (Figure 3 F) were drawn using R language, which indicated that they were enriched in apoptosis and other related pathways. In addition, GSEA analysis also found enrichment in ER stress and apoptosis pathways (Figures 3 G, H).
Immunohistochemical staining of p-PERK and CHOP expression in SD rat liver cells
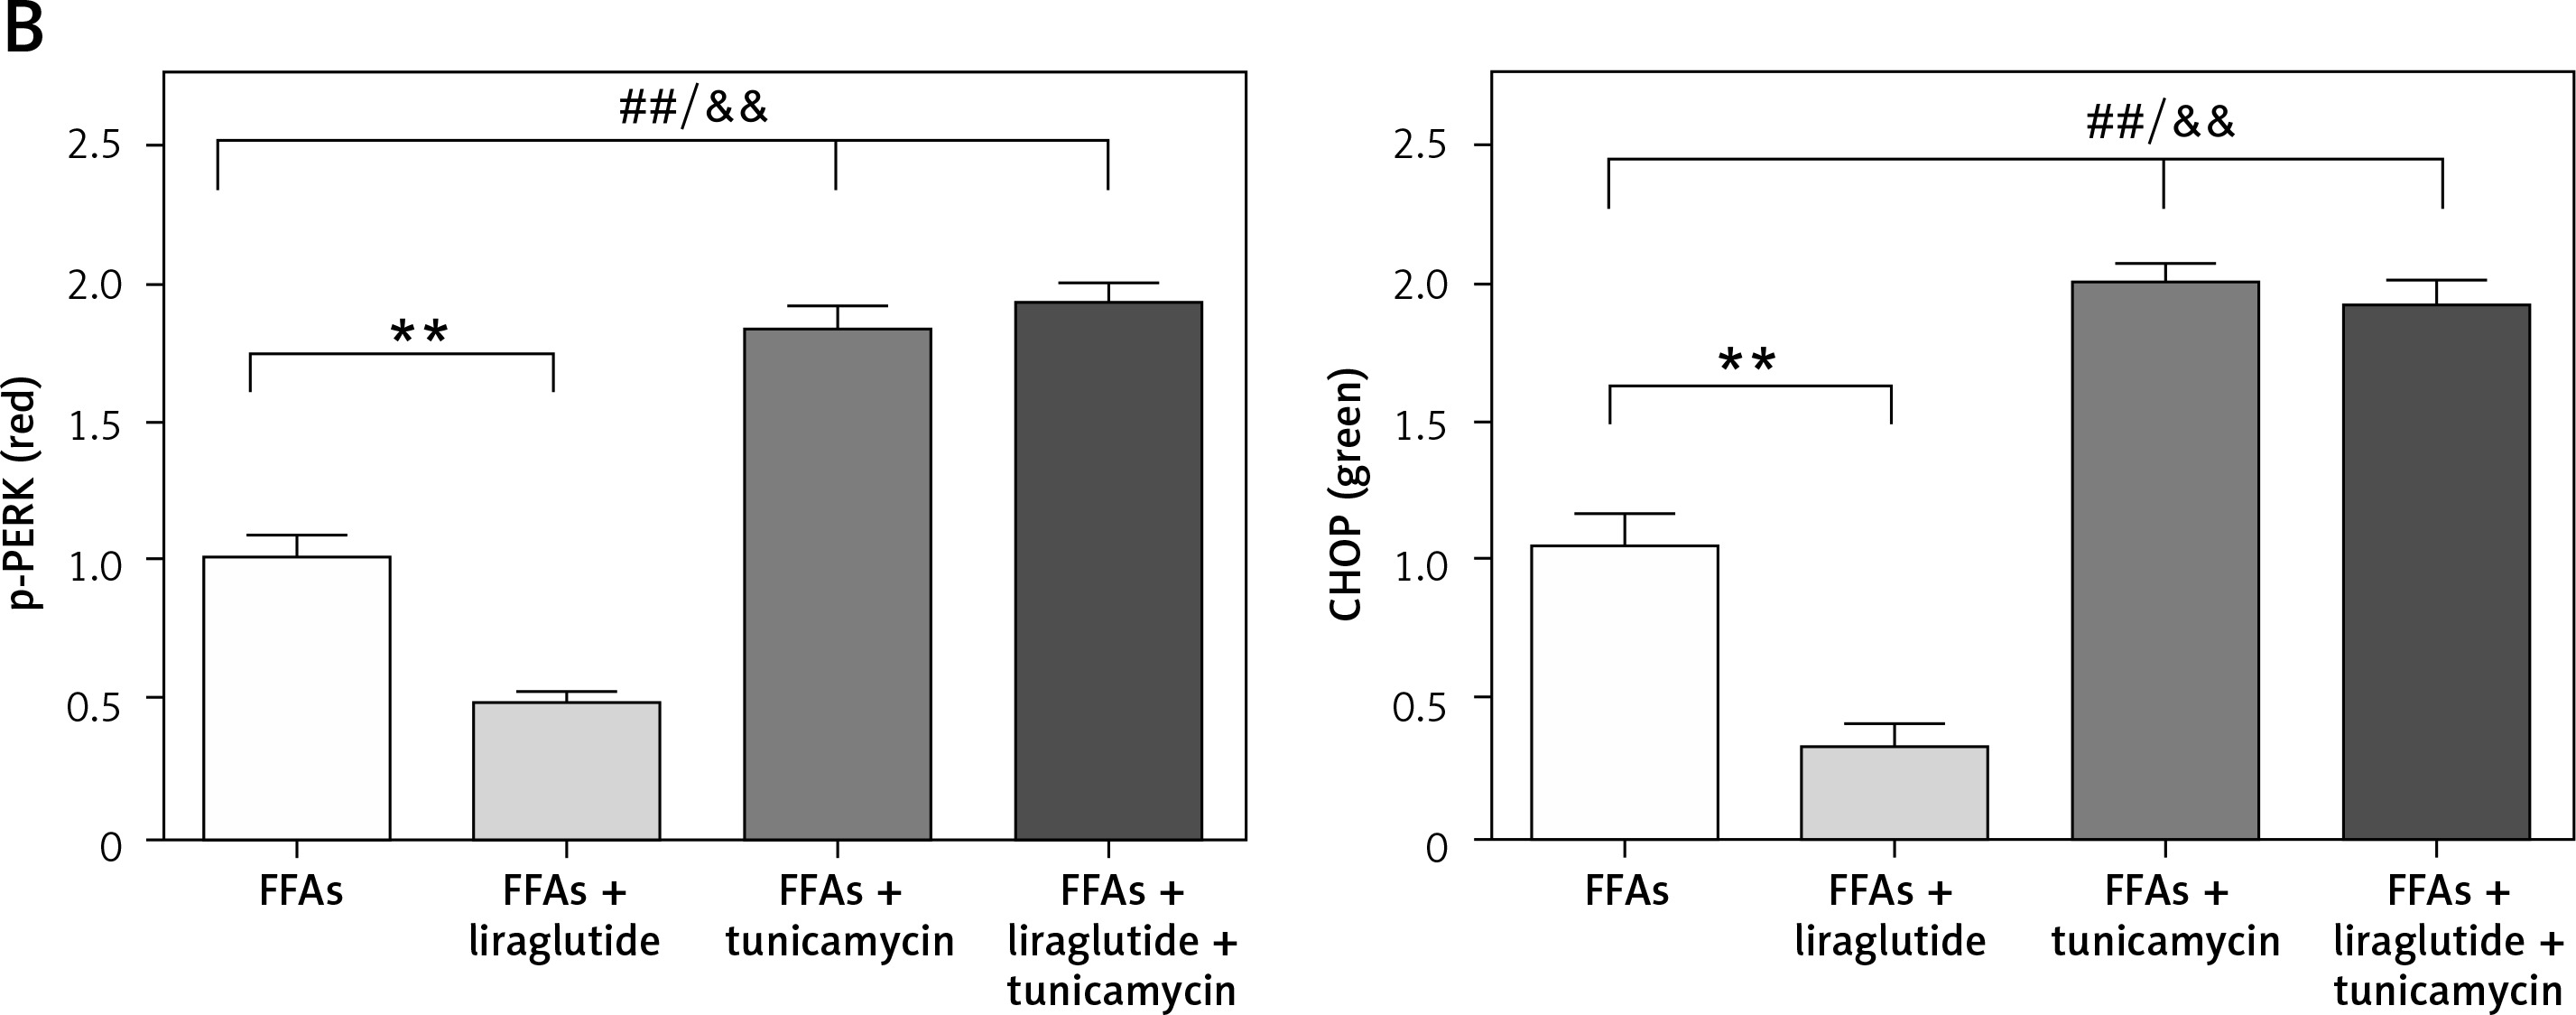
Representative images of the SD rat liver cells stained by multiplex immunohistochemistry/immunofluorescence are shown. Multiplex immunofluorescent images demonstrate the spatial distribution of p-PERK and CHOP within the SD rat liver cells. Red indicates p-PERK, green indicates CHOP, and blue indicates nuclei stained by DAPI (Figure 4 A). Bar graphs and percentages of p-PERK or CHOP positive areas from four independent experiments are shown. The results revealed that liraglutide treatment reduced the expression of p-PERK and CHOP resulting from FFAs but not the expression of these proteins resulting from FFAs and tunicamycin (Figure 4 B).
Figure 4
Immunohistochemical staining of p-PERK Primary rat cells and CHOP expression in SD rat liver cells. A– Representative images of SD rat liver cells stained by multiplex immunohistochemistry/immunofluorescence (magnification, 400.), as indicated (scale bars: 10 µm). ##P < 0.01 vs. control; **p < 0.01 vs. control. Error bars represent the SEM. Statistical analysis was performed using an unpaired, two-tailed Student’s t-test B – Percentages of p-PERK or CHOP positive areas. Data are presented as mean ± standard error (SEM). ##P < 0.01 vs. control; **p < 0.01 vs. control. Error bars represent the SEM. Statistical analysis was performed using an unpaired, two-tailed Student’s t-test
Protective effects of liraglutide on FFA-induced ERS in SD rat liver cells in vitro
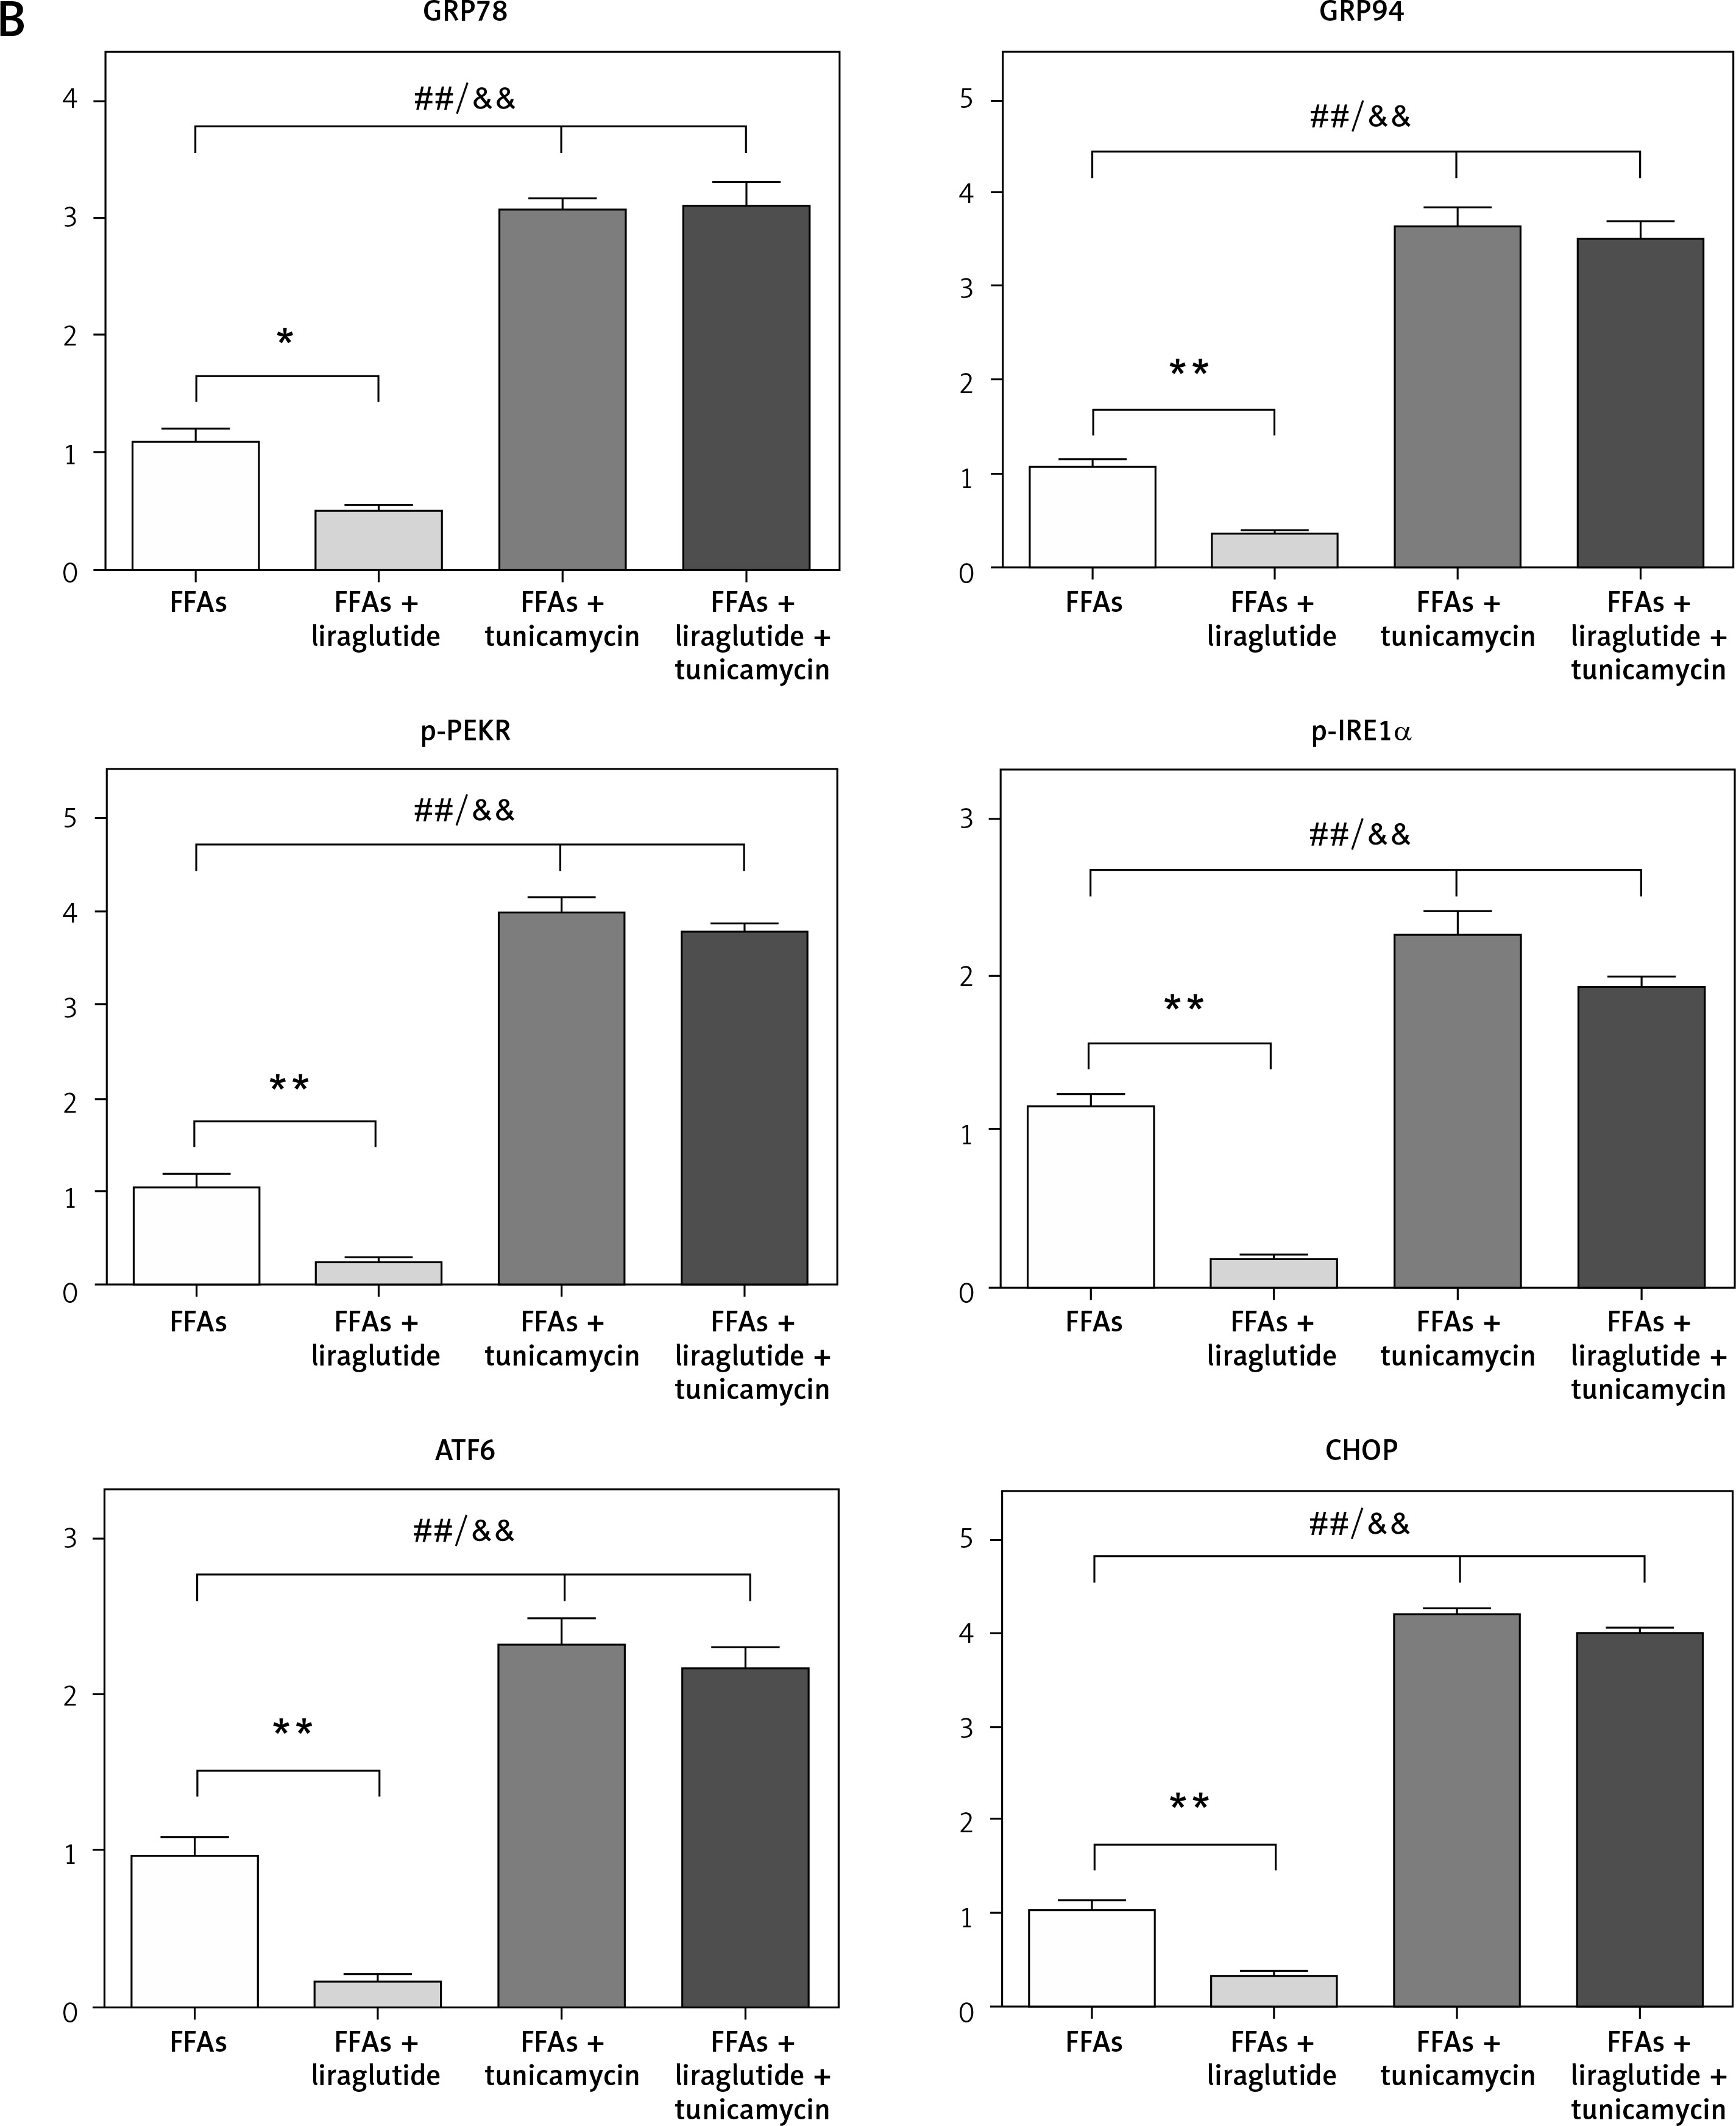
The presence of ERS-related proteins in the liver cells of SD rats was verified using western blot analysis. The loading control utilized in this study was β-actin. The evaluation of the target protein expression level was conducted by utilizing the integrated ratio of the absorbance area of the target protein band to that of the β-actin band, as depicted in Figure 5 A. Bar graphs and representative blots from four independent experiments are shown. The results obtained from the western blot examination demonstrated that treatment with liraglutide led to a reduction in expression levels of GRP78, GRP94, p-PERK, p-IRE1α, ATF6, and CHOP in response to FFAs. However, it did not have an impact on the expression of these proteins when induced by FFAs and tunicamycin (Figure 5 B). These results suggested that liraglutide has protective effects on FFA-induced ERS in the SD rat liver cells in vitro.
Figure 5
Protective effects of liraglutide on FFA-induced endoplasmic reticulum stress in SD rat liver cells in vitro. A – Endoplasmic reticulum stress-related proteins in SD rat liver cells were confirmed by western blot. β-actin was used as a loading control. Data are presented as mean ± standard error (SEM). ##P < 0.01 vs. control; **p < 0.01 vs. control. Error bars represent the SEM. Statistical analysis was performed using an unpaired, two-tailed Student’s t-test
The protective impact of liraglutide on FFA-induced apoptosis in SD rat liver cells in vitro
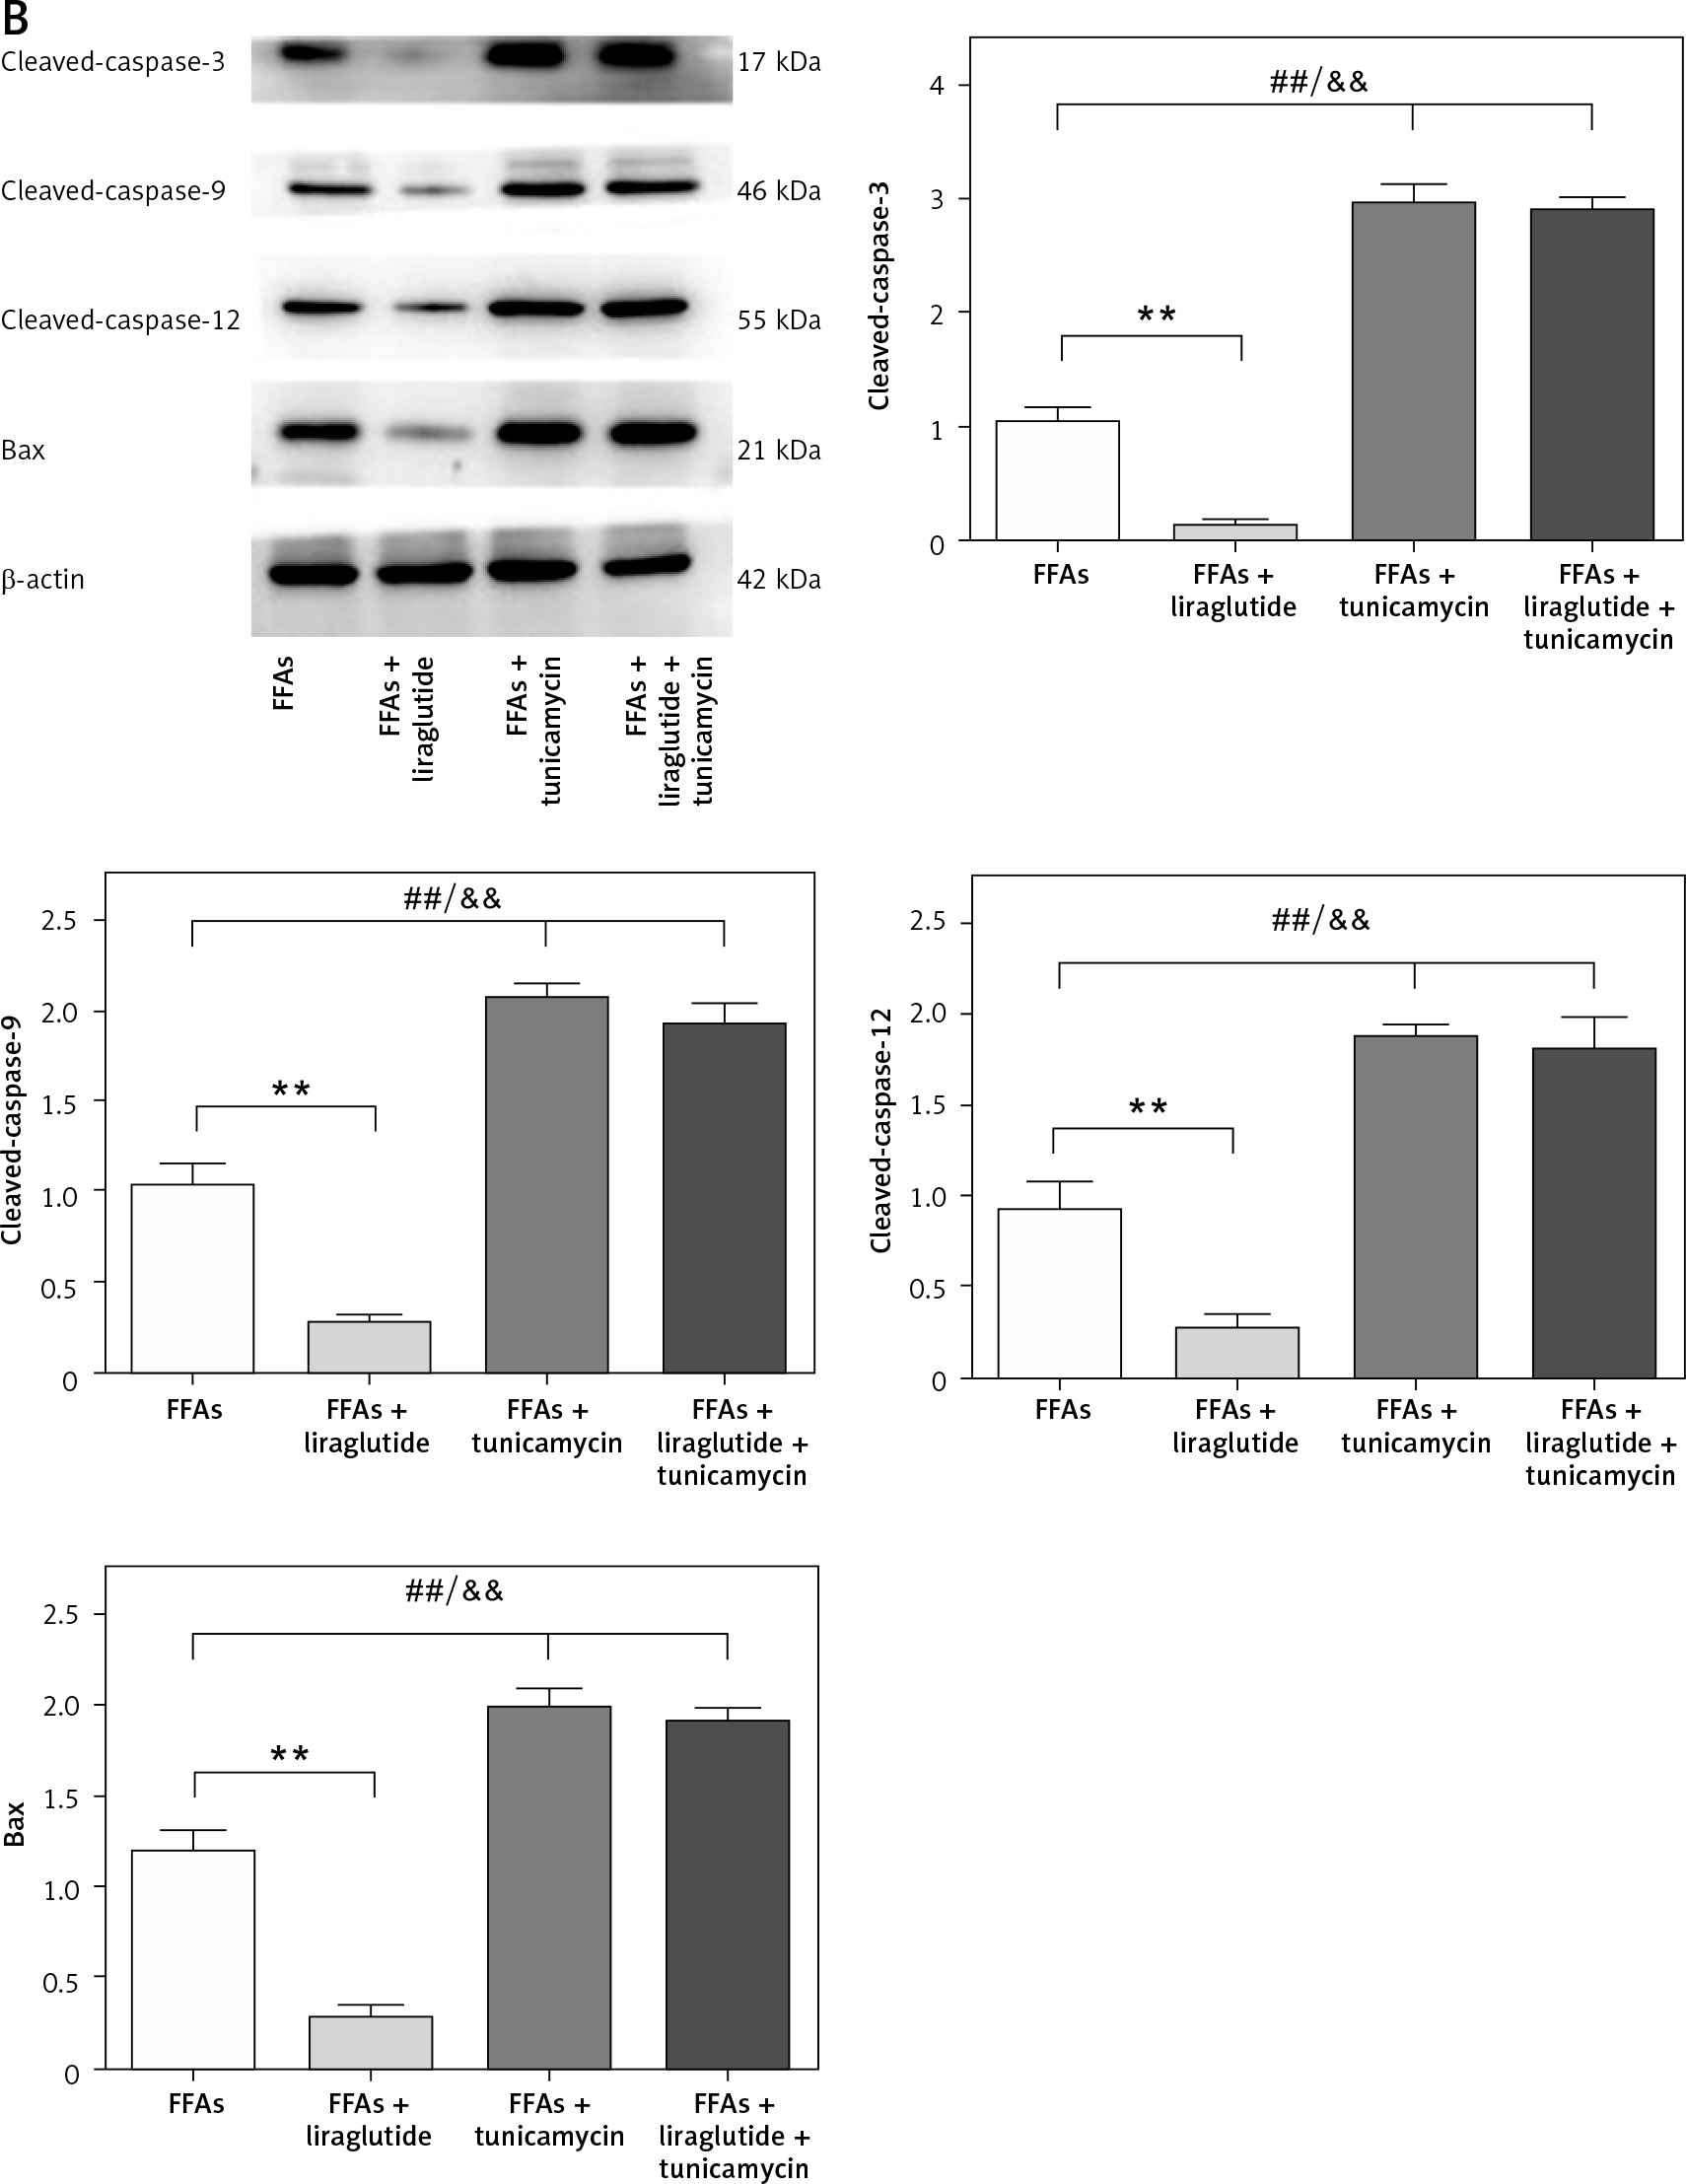
Flow cytometry investigation of Annexin V-FITC/PI-stained SD rat liver cells was performed. A histogram of the apoptotic rate in different groups was constructed. The results revealed that liraglutide therapy decreased SD rat liver cell apoptosis caused by FFAs but not apoptosis caused by FFAs plus tunicamycin (Figure 6 A). Western blot demonstrated the presence of apoptosis-related proteins in SD rat liver cells. The β-actin protein was employed as a loading control in the experiment. To determine the amount of target protein expression, the integrated ratio of the absorbance area of the target protein band to that of the β-actin band was employed. Bar graphs and representative blots from four independent experiments are shown. Western blot assay revealed that liraglutide treatment decreased the expression of cleaved caspase-3, cleaved caspase-9, cleaved caspase-12, and Bax resulting from FFAs, but did not decrease the expression of these proteins resulting from FFAs and tunicamycin (Figure 6 B). These results suggested that liraglutide has protective effects on FFA-induced apoptosis in the SD rat liver cells in vitro.
Figure 6
Protective effects of liraglutide on FFA-induced apoptosis in SD rat liver cells in vitro. A – SD rat liver cells stained with Annexin V-FITC/PI. ##P < 0.01 vs. control; **p < 0.01 vs. control. Error bars represent the SEM. Statistical analysis was performed using an unpaired, two-tailed Student’s t-test. B – Apoptosis-related proteins in SD rat liver cells. β-actin was used as a loading control. Data are presented as mean ± standard error (SEM). ##P < 0.01 vs. control; **p < 0.01 vs. control. Error bars represent the SEM. Statistical analysis was performed using an unpaired, two-tailed Student’s t-test
Discussion
Initially, FL was generally considered benign and generally left without intervention. However, studies have shown that nonalcoholic FLD can progress to cirrhosis, with 30–40% of patients dying from liver-related disease, and some developing subacute liver failure and hepatocellular carcinoma. In addition, overweight or obese patients have a significantly increased risk of cardiovascular disease due to the presence of FLD, and the lifespan of patients with FL disease varies with age [16]. Understanding the molecular mechanism of liraglutide in the therapy of FL is of significant importance. The primary finding of this study was that the genes exhibiting differential expression, which were linked to FL, were primarily concentrated within the pathways of ER stress and apoptosis. Liraglutide exerts a therapeutic role in FL by effectively inhibiting ER stress and apoptosis of hepatic cells.
Liraglutide can inhibit the ERS of liver cells by reducing the expression of P-PERK/P-IRE1α/ATF6, then reducing the expression of CHOP, and finally exerting a therapeutic effect on FL. Obesity is the basis of many chronic diseases. In the state of obesity, chronic inflammation, oxidative stress, and excess nutrition continue to stimulate adipocytes to produce and release a large number of adipokines and cytokines [17]. To meet these needs, the endoplasmic reticulum of adipocytes expands and enhances its function. Numerous studies have demonstrated that ERs occur in various tissues and organs of the body under the condition of obesity [18, 19]. The unfolded protein response (UPR) is regulated by three ER stress proteins – inositol demand kinase 1 (IRE-1), PKR-like endoplasmic reticulum kinase (PERK), and transcriptional activator 6 (ATF-6) – to restore ER homeostasis [20]. CHOP is a transcription factor produced by ERS-induced apoptosis [21]. The ATF6α pathway potentially exhibits a protective function in the development of hepatic steatosis. The study observed that when ATF6α knockout mice were administered tunicamycin, they exhibited prolonged expression of CHOP, reduction of C/EBPα, and the development of hepatic steatosis [22]. Within hepatocytes, the transcription factor ATF6α engages in an interaction with PPARα, thereby augmenting its transcriptional activity and inducing up-regulation of hepatic fatty acid oxidation. The activation of SREBP2 and the consequent production of lipids in hepatocytes are inhibited by ATF6α [23].
Several ERS response markers are activated in obese mice, including increased GRP78 expression, increased phosphorylation of PERK and eIF2α, and enhanced phosphorylation of IRE1-α, especially in the liver and adipose tissue [24]. Under ERS activation, the ER develops the UPR, which activates ATF6 binding to CHOP protein, GRP78 promotes protein folding, develops autophagy and apoptosis, and damages liver cells. A new study has shown that inhibition of ERS can significantly reduce lipid metabolism disorders in hepatocytes, providing novel treatment strategies for NAFLD. Zhao et al. [20] reported that liraglutide can reduce ERS in islet cells. Liu et al. [21] found that liraglutide alleviated cardiovascular disease in diabetic rats by inhibiting ERS. These studies suggest that obesity can cause ERS in adipose tissue, and liraglutide can alleviate ER stress. Hence, there is speculation regarding the potential significance of liraglutide in the therapeutic management of FL through its inhibitory effects on ERS. Liraglutide inhibits hepatocyte apoptosis by decreasing cleaved caspase-3/9/12 and Bax and ultimately has a therapeutic effect on FL.
Apoptosis is a dynamic and autoregulatory process of cellular demise triggered by alterations in both the internal and external milieu. It plays a vital role in the pathophysiological mechanism of regulating the relative stability of body structure and function and the disorder of glucose and lipid metabolism. Mammalian cell apoptosis occurs through two pathways: the external caspase-8 route, which is involved in tumor necrosis factor receptor family members, and the endogenous caspase-9 pathway, which is involved in cytochrome (CytC). Mitochondria are the common targets of many pro-apoptotic pathways [25]. The regulation of cell apoptosis involves various genes, with the Bcl-2 gene family being a significant regulatory component of this mechanism. The Bcl-2 gene family exerts diverse biological effects on cell apoptosis, depending on the specific Bcl-2 homology (BH) involved. The Bax gene holds significant importance as an apoptosis-inducing gene within the Bcl-2 family. The process involves the release of CytC into the cytoplasm via the mitochondrial permeability transition pore (MPTP) protein. This leads to formation of the CytC-Apaf-Pro caspase-9 apoptosome, which triggers the cascade reaction responsible for inducing apoptosis. Additionally, it counteracts the anti-apoptotic effect of Bcl-2, ultimately promoting apoptosis. Through activation of the upstream promoter, caspase-9, the downstream caspase factors are further activated to lead to cell apoptosis [26].
The presence and progression of FL are significantly influenced by hepatocyte apoptosis [27]. The pathway of apoptosis is significantly influenced by the caspase system and the Bcl-2 family. Among the representative members of the Bcl-2 family, Bcl-2 and Bax are inhibitory and promoting factors of apoptosis, respectively. In the case of oxidative stress, caspase-9, as the most important upstream promoter, is activated and activates downstream caspase factors, causing a cascading amplification effect and thus leading to cell apoptosis [28, 29].
Liraglutide (LRG), a long-acting human GLP-1 analog, has been extensively used in clinical therapy. Homology and pluripotency of human GLP-1 in the liver were confirmed, and the effect of GLP-1 accelerated the removal of lipid deposition in the liver and inhibited hepatocyte apoptosis [30]. The experimental results of different doses of liraglutide in the C57 mouse model of NAFLD revealed that high-fat-induced mice’s liver cell alignment was gradually restored, lipid cavitation degeneration was significantly reduced, serum glutathione and superoxide dismutase levels were substantially reduced, and malondialdehyde levels were substantially improved. At the same time, the number of liver cell apoptosis events was significantly reduced, the mRNA expression of caspase-9 and Bax in liver cells was down-regulated, and the mRNA expression of Bcl-2 was up-regulated. In conclusion, liraglutide may reduce the oxidative stress of FL cells, inhibit liver apoptosis, and alleviate liver injury caused by non-alcoholic FLD [31]. The GLP-1 receptor agonist liraglutide ameliorates nonalcoholic FL lipid deposition, possibly by reducing oxidative stress and regulating apoptotic genes. Hence, there is speculation regarding the potential significance of liraglutide in the treatment of FL through its ability to inhibit apoptosis. The literature review mentioned above corresponds to the findings of our study. Liraglutide inhibited ERS of hepatocytes by reducing p-PERK/pIRE1α/ATF6 and then reducing the expression of CHOP, which finally had a therapeutic effect on FL. Liraglutide inhibits hepatocyte apoptosis by decreasing cleaved caspase-3/9/12 and Bax and ultimately has a therapeutic effect on FL.
Notwithstanding the meticulous bioinformatics analysis conducted in this study, there remain certain limitations. This study did not involve any animal experimentation to provide additional validation of gene overexpression or knockout and their respective functions. Also, the investigation of the safety and efficacy of liraglutide in the treatment of FLD did not include any multicenter controlled clinical trials. Hence, it is recommended that future research should be performed to undertake a comprehensive investigation in this particular domain.
In conclusion, the genes that demonstrate differential expression in connection to Friedreich’s ataxia primarily group together within the pathways involved with ERS and programmed cell death (apoptosis). The therapeutic effect of liraglutide on fatty liver is achieved by the suppression of ERS and death of hepatic cells.