Introduction
According to International Diabetes Federation (IDF), the global population with diabetes mellitus (DM) reached 451 million in the year 2017 (age 18–99 years), and it is estimated that by the year 2045 this number will increase to 693 million people around the world [1]. We divide complications of DM into macro- and micro-vascular related, e.g. macro-vascular – coronary heart disease (CHD), myocardial infarction, peripheral arterial disease (PAD), and stroke; micro-vascular – diabetic retinopathy (DR), and nephropathy [2–4]. There are also diabetes-induced syndromes like diabetic foot syndrome, which has recently been associated with adverse effects on brain function [5, 6]. The incidence of DR is falling, probably due to better management of glucose levels, lipid abnormalities, and hypertension. Nonetheless, DR is still the most vision-threatening complication, and the crude prevalence (at all ages) of visual impairment and blindness caused by DR increased significantly between the years 1990 and 2015 with respect to the global population [7–9]. There is a great number of articles concerning the prevalence, developing factors, and current treatment strategies of DR, and geographical analysis with advanced statistical methods could result in interesting new conclusions in terms of the origin of the disease and the organization of healthcare systems. However, the number of studies showing the geographical analysis of the prevalence of DR and co-existing social and demographic factors is limited [10–12].
The logic behind using geography to study disease or health care comes from the realization of factors resulting in non-uniformity of disease distribution [13–15]. These factors include social, economic, environmental, and genetic ones. All these factors may have spatial distributions influencing the incidence of a disease. Geographic information systems with spatial analytical methods are helpful in the study of health status and health care delivery [16]. That approach is extremely useful in the case of analysing outbreaks of contagious diseases like malaria or mumps [17, 18]. However, the literature review covers the large use of such methods in case of non-contiguous diseases, e.g. leukaemia [19]. This approach allows us to statistically verify the regions of either extremely high or low prevalence of diseases. In addition, the knowledge of spatial properties and disease patterns allows the planning of a health care service in a rational manner and meets the needs of patients.
The aim of our study was to analyse the regional differences in diabetic retinopathy prevalence and its co-existing social and demographic factors in the overall population of Poland in the year 2017.
Material and methods
The present study was co-financed by the European Union funds through the European Social Fund under the Operational Program of Knowledge Education and Development and was a part of the Polish Ministry of Health project “Maps of Healthcare Needs – Database of Systemic and Implementation Analyses” [20, 21]. The study design was a nation-wide survey. The Republic of Poland is the largest Central European country, with a population of 38,422,346 people (in the year 2017), mostly of middle socio-economic status [22]. The area of Poland is 312,679 km2, and Poland is divided into 16 voivodships and 380 counties in terms of administrative division. The population data and socio-demographic information of the counties for the year 2017 were obtained from the Central Statistical Office of Poland [22]. For the purpose of this study, the Polish National Health Fund (NHF) database, the only public insurer in Poland, was retrospectively analysed [23]. The NHF database records data from all levels of healthcare services at public and private institutions in Poland and compiles both medical and personal data including age, sex, place of residence, and identification number (PESEL) of each individual patient. The medical data include diagnoses coded according to the International Classification of Diseases, 10th Revision (ICD10) and unique NHF codes. The NHF database also contains the records of all medications purchased by the Polish patients in pharmacies, which were reimbursed by NHF. In the first part of the study, for each patient in the years 2013–2017, DM type 1 and type 2 was identified with ICD-10 codes E10 and E11, respectively. All diagnoses were then confirmed if the patient purchased antidiabetic drugs (and/or insulin) during the study period. Following that, DR was identified in DM patients using the ICD-10 codes H36.0, H36.8, and H35.8 during 2013–2017. The overall prevalence of DR and DM in Poland in 2017 was the total number of individuals who were alive on 31 December 2017 and occurred in the NHF database during 2013-2017 with DR and DM, respectively.
Statistical analysis
For statistical analysis, the socio-demographic data of all patients including age, sex, and place of residence were anonymously recorded. In the first part of the statistical analysis, the spatial analysis was conducted, which provides opportunities to understand the spatial distribution of diseases and the possible association between its environmental and demographic exposures [13, 17–19]. There are numerous methods for testing clustering in data. The method that is widely used by epidemiologists is the one developed by Patrick Alfred Pierce Moran [11]. Moran’s Index is a weighted correlation coefficient that is used to measure deviation from spatial randomness and has the form as below:
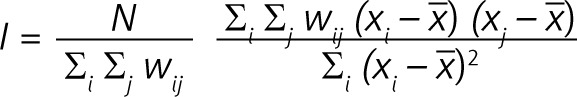
where N is the number of spatial units, in this study denotes a number of counties (380): xi and xj are values of a variable of interest (retinopathy prevalence per 10 k population) for i, j = 1,..., 380, x is the mean of variable of interest, wij denotes an element of spatial weights matrix, wij is zero either when i = j or 2 counties i, j are totally separated in terms of the common border (queen neighbourhood). When 2 counties share a border, the weight is equal to 1. The values of I range from –1 (perfect dispersion) to +1 (perfect clustering) [24–26].
The next part of the statistical analysis was to identify the variables explaining the differences in retinopathy prevalence values among counties. It was important to consider a spatial approach because the assumption of the observation’s independence is no longer valid. Due to this argument the Spatial Autoregressive (SAR) model was used. The SAR model is an OLS (ordinary least squares) method with correction related to autocorrelation defined by the spatial-weights matrix [19]. The factors used to explain the differences in the prevalence in diabetic retinopathy in the counties of Poland were grouped into 3 categories: epidemiological, sociodemographic, and accessibility/quality. All details of the factors used to explain the differences in the prevalence of diabetic retinopathy in the counties of Poland are presented in Table I. To build the model, each variable was transformed, i.e. divided by the median value of the variable, which enables us to interpret the results of the model in terms of median values, which is especially useful, in particular when the factors are in different scales. Before building the model the normality of the dependent variable was verified. Box-Cox transformation and Shapiro-Wilk test (p = 0.08) revealed that the logarithmic transformation met the assumptions of normality. In addition, the collinearity of explanatory variables was verified. The value of the variance inflation factor (VIF) was up to 3 for each variable that indicated a lack of collinearity. The adjusted R2 was used to validate the goodness of the model. R statistical software V. 3.5.2, including the ‘spdep’ package [19], was used for all analyses. The study adhered to the tenets of the Declaration of Helsinki for research involving human subjects, and the study protocol was approved by the Polish Ministry of Health, which is entitled by the law of the Republic of Poland to process the National Health Fund data.
Table I
The factors used to explain the differences of the prevalence of diabetic retinopathy in the counties of Poland
Results
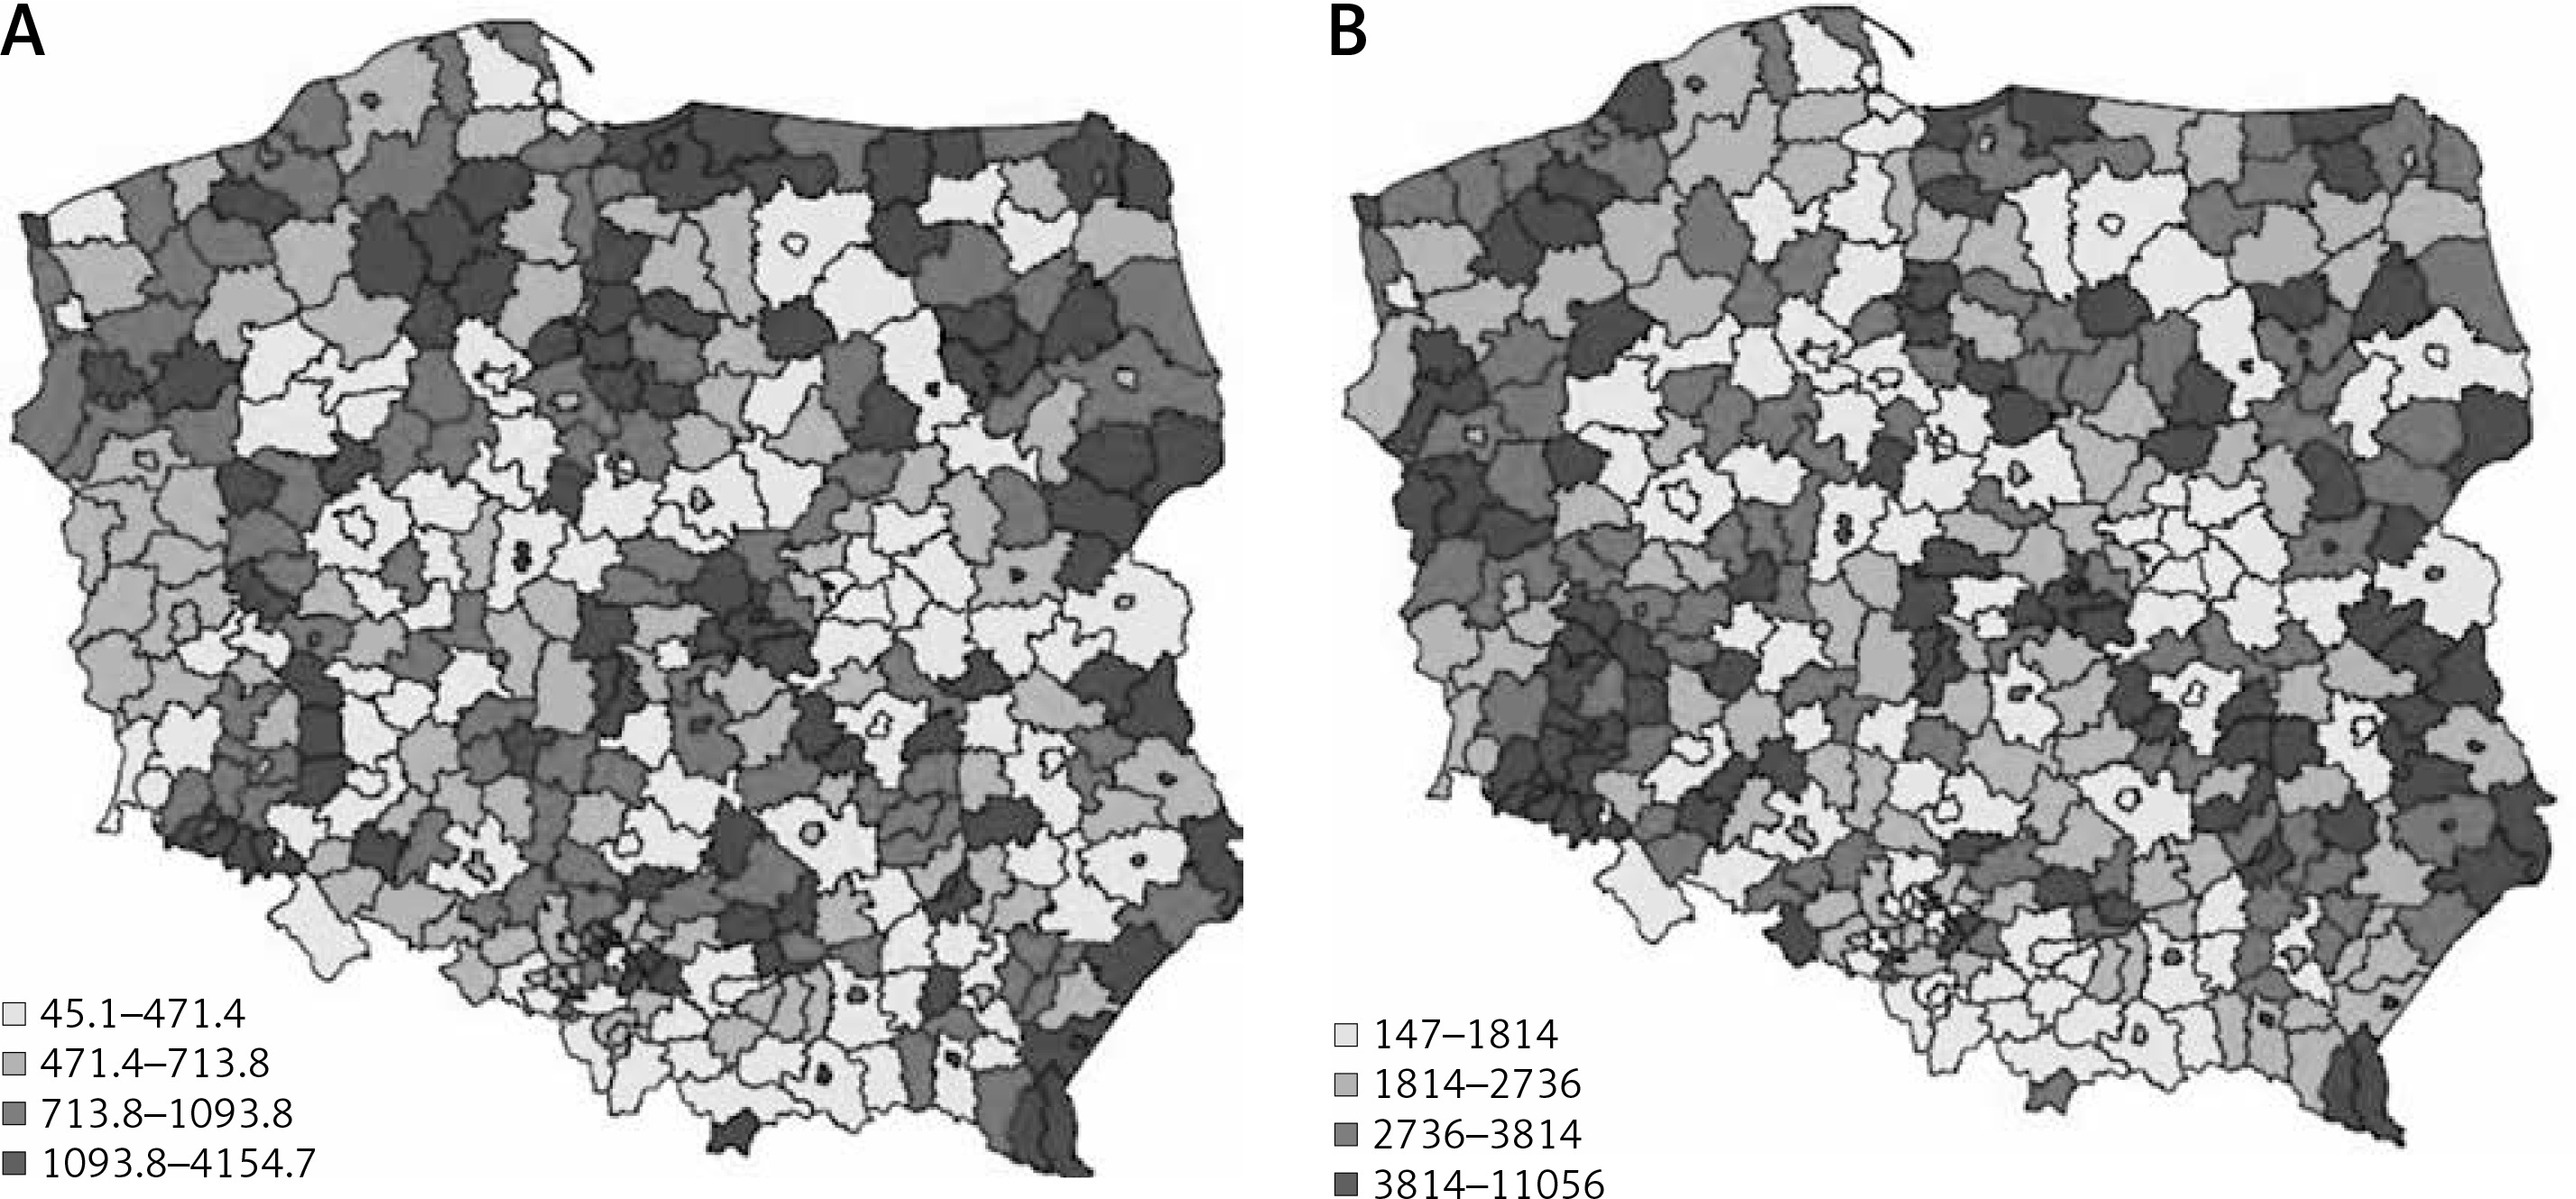
In total, 310,815 individuals with DR were diagnosed in the year 2017 in Poland. Of them, 174,384 (56.11%) were women, 221,144 (71.15%) lived or had lived in urban areas, and 40,231 (12.94%) and 270,584 (87.06%) had type 1 and type 2 DM, respectively. Because 99.8% of the individuals in the DM population were adults, all the presented statistics were calculated per adult population in Poland. Figure 1 shows the DR prevalence per 10,000 population in the counties of Poland in the year 2017.
Figure 1
The prevalence of diabetic retinopathy (A) and diabetes mellitus (B) per 10,000 population in the counties in Poland in 2017
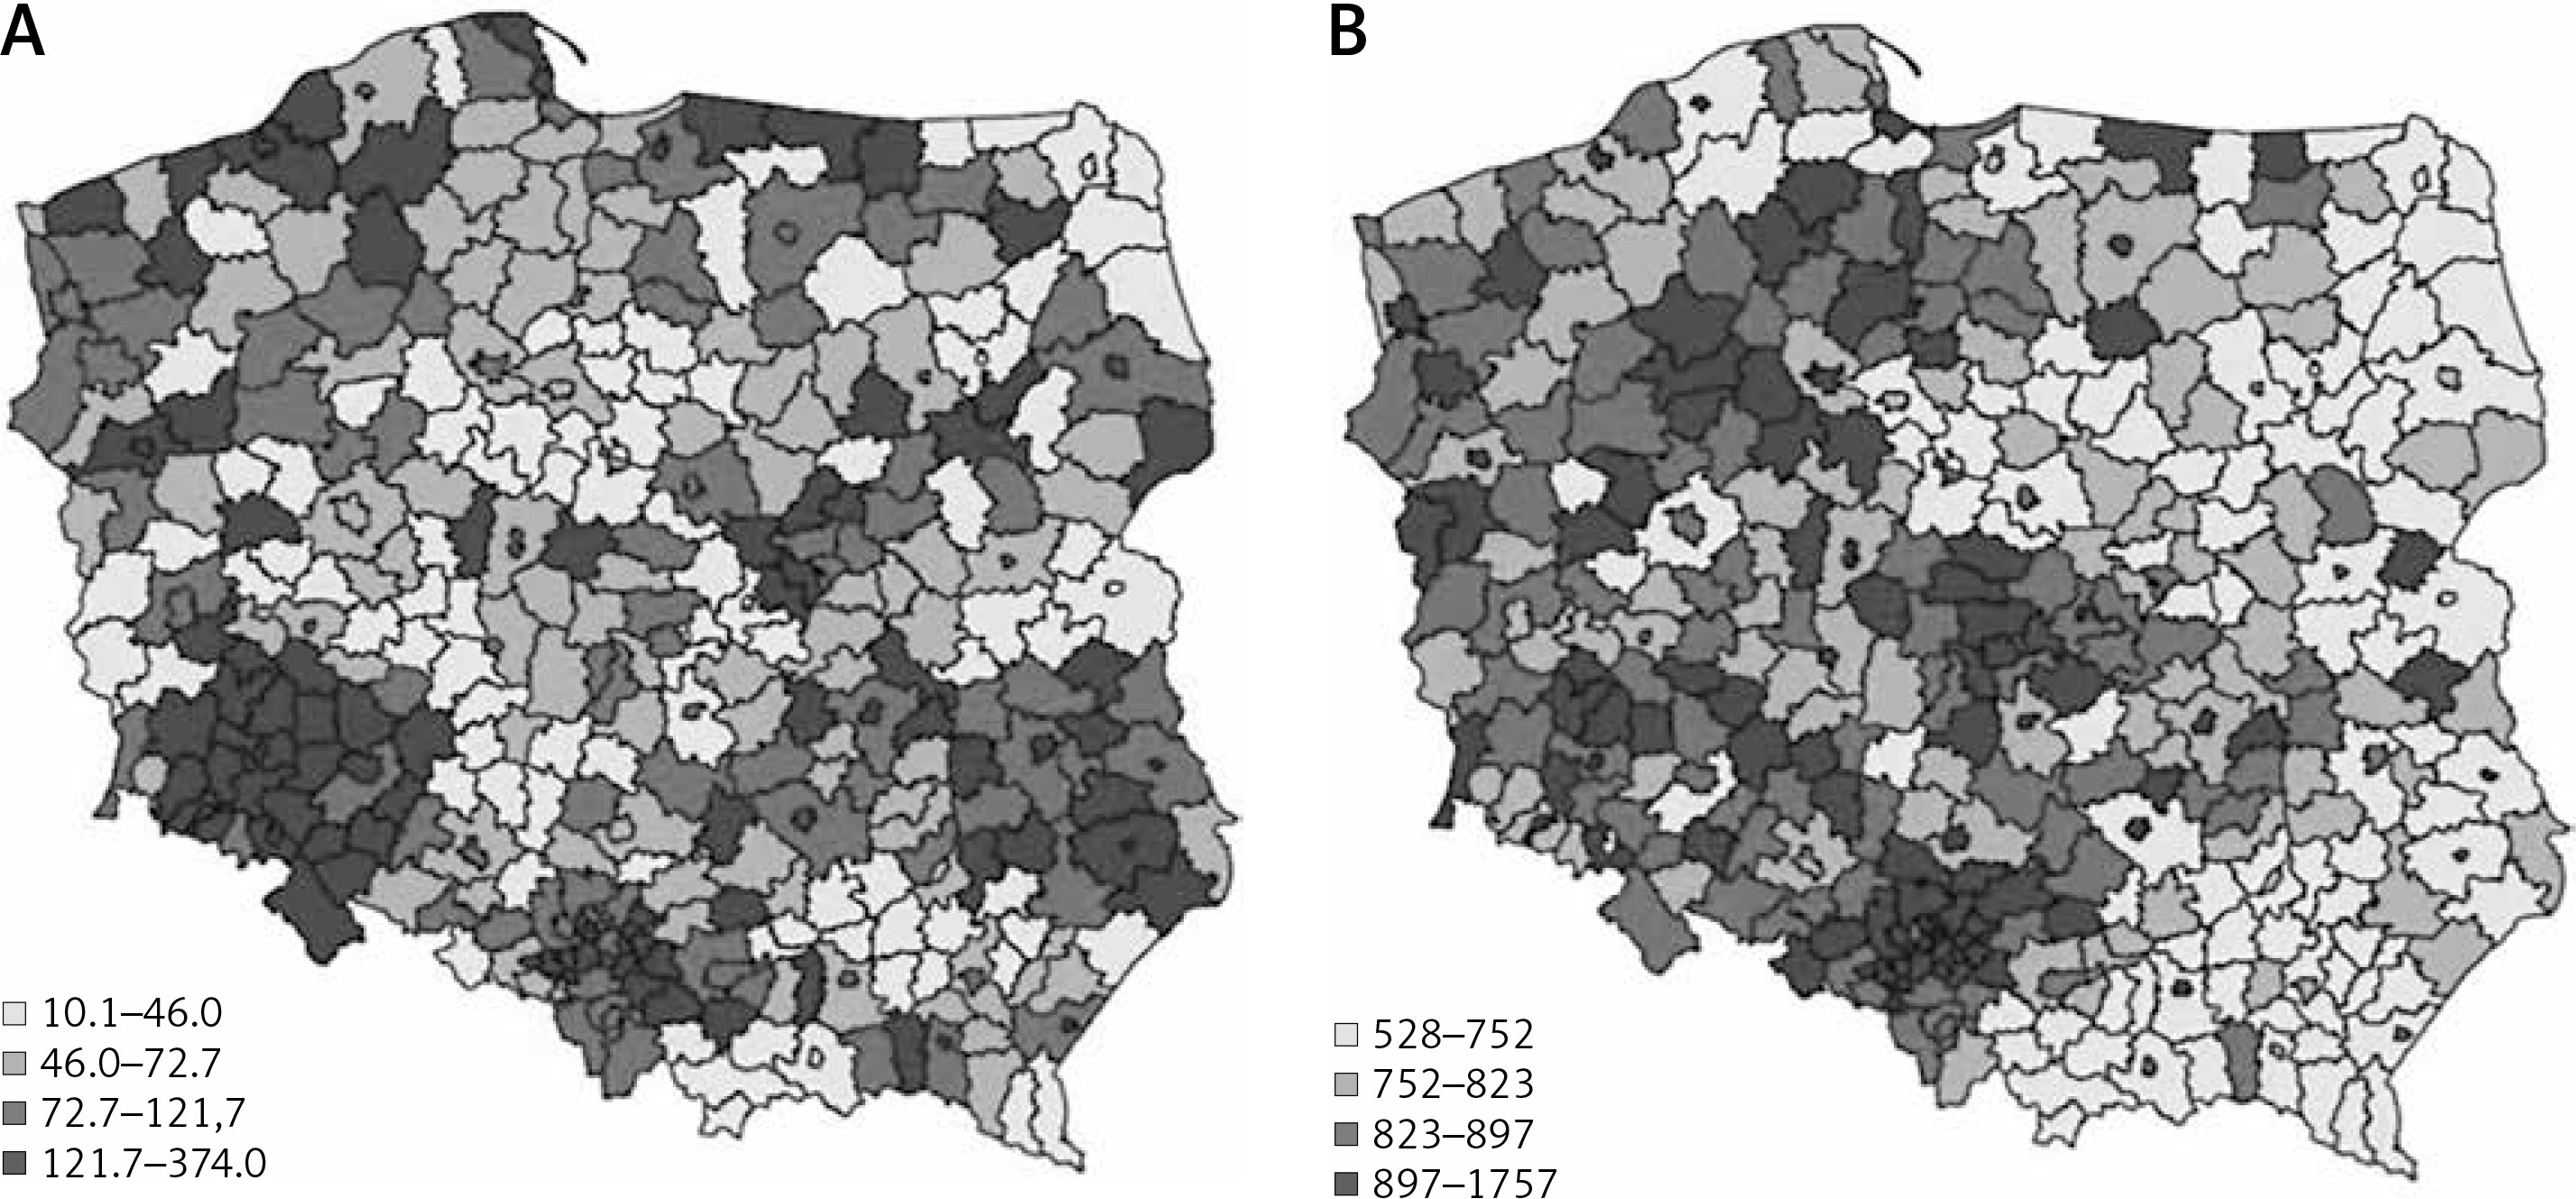
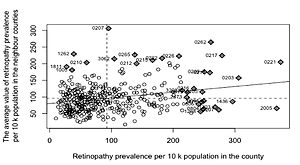
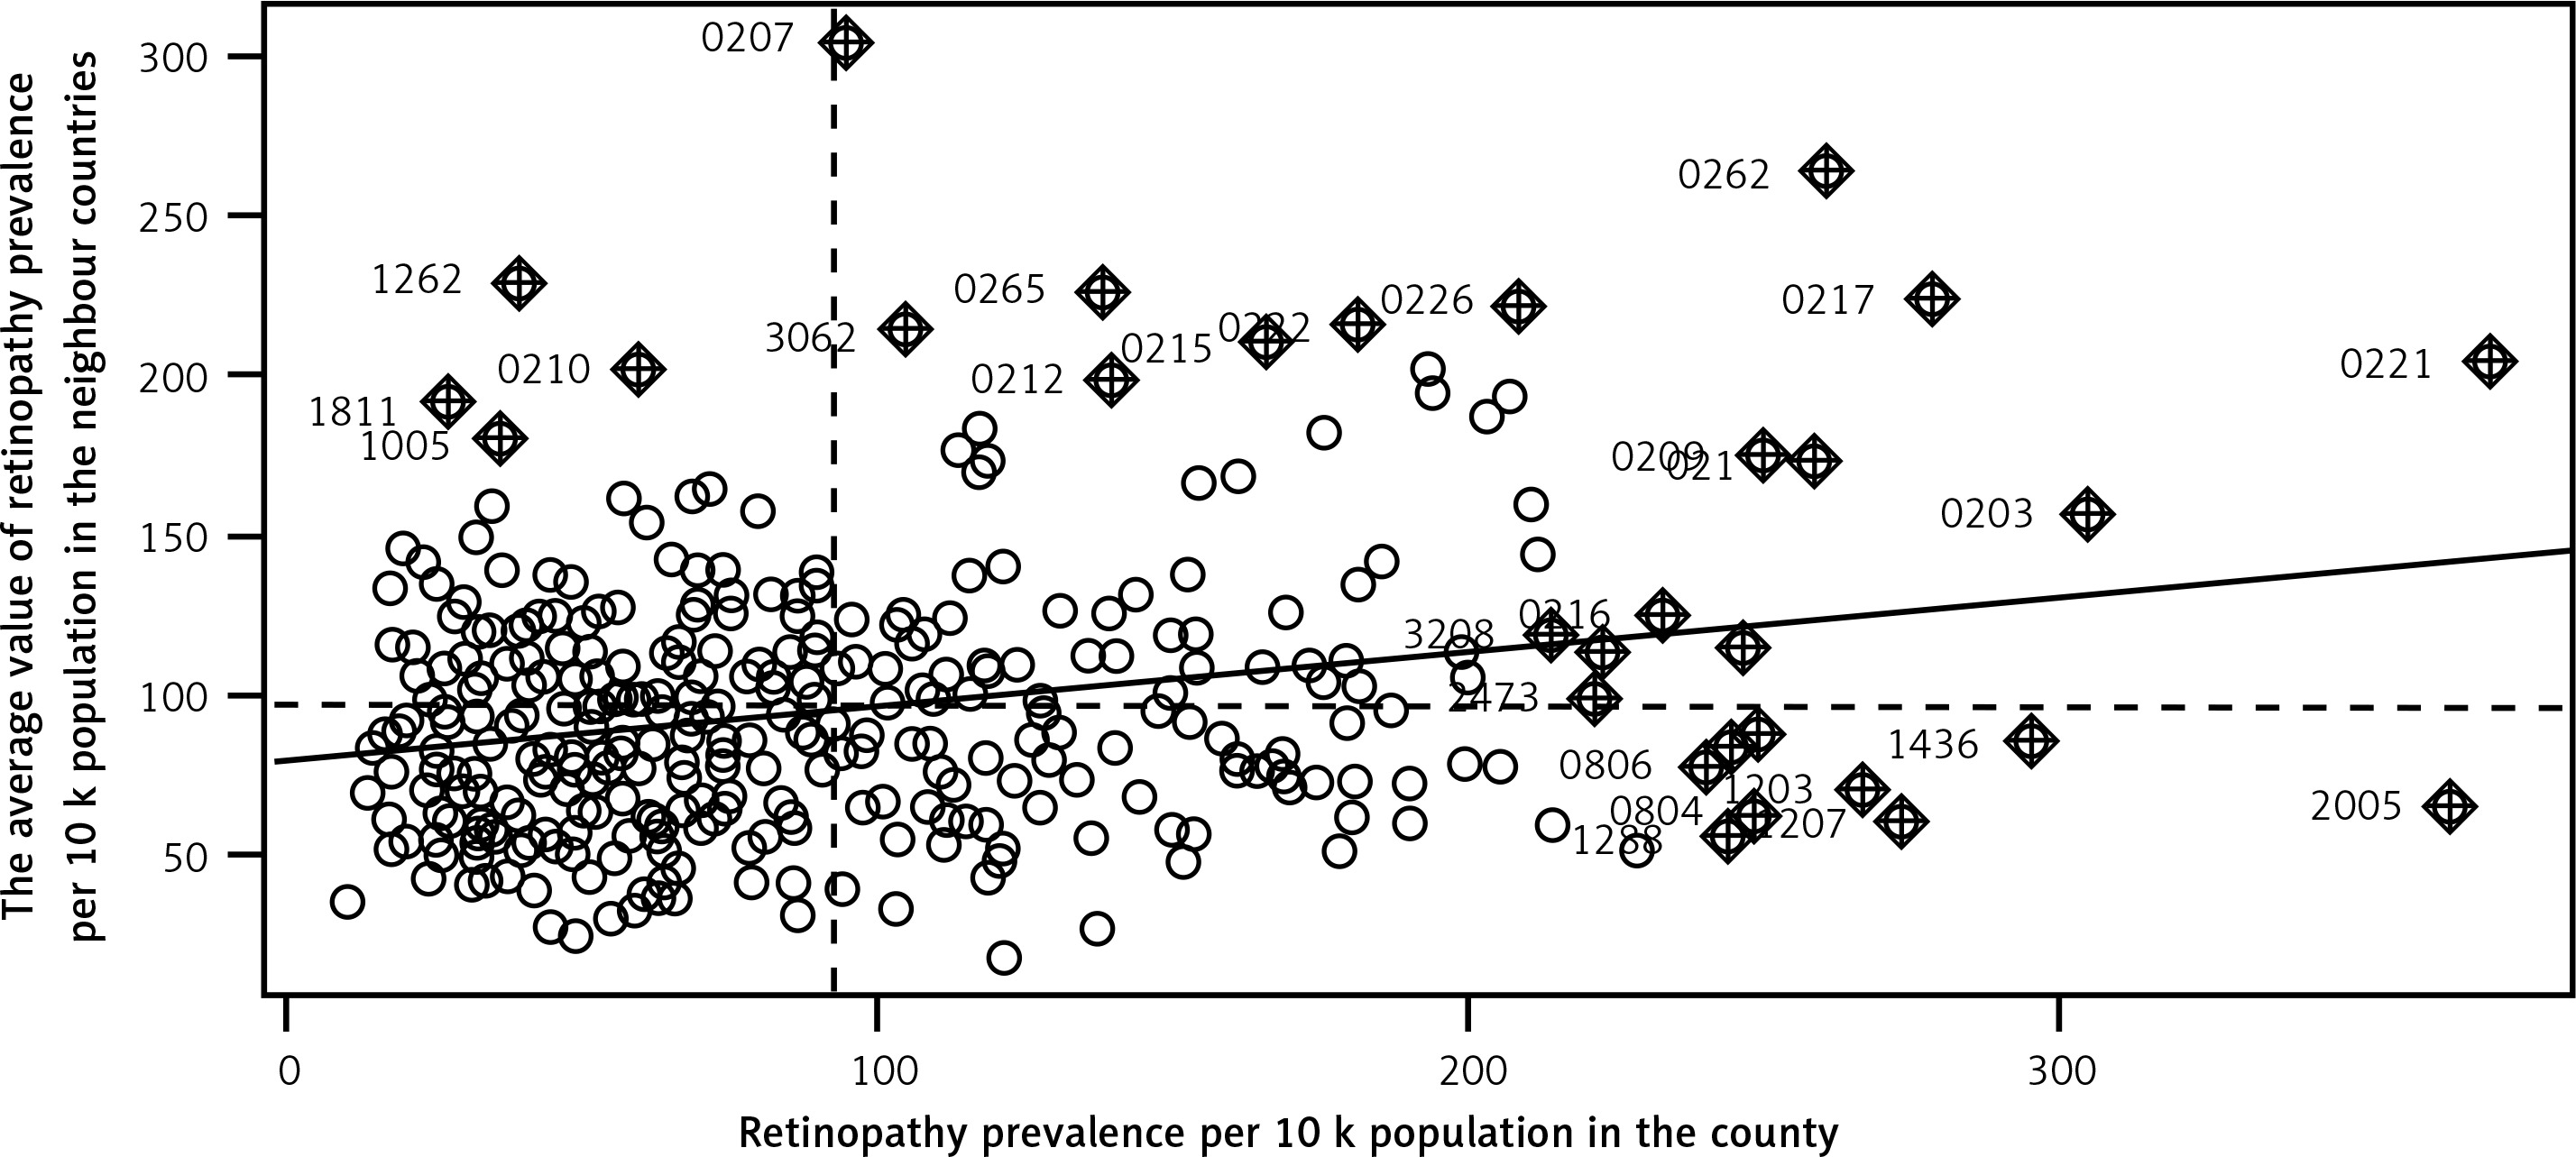
There are groups of counties with either high or low values of retinopathy prevalence in Poland in terms of quantiles values. The spatial dependence between the counties was statistically verified with Moran Index I (Figure 2). The I value equalled 0.18 and is statistically significant (p < 0.001). The ‘hot spots’ (the counties of high retinopathy prevalence are surrounded by counties of high retinopathy prevalence) and ‘low spots’ (groups of counties of low retinopathy prevalence) indicate that the distribution of DR is not random in Poland. The highest DR prevalence occurred in the south-west part of Poland and in many counties of the north and east of Poland. The lowest DR prevalence occurred mainly in the centre of Poland. DM prevalence in Poland also is demonstrated on the map in Figure 1.
Relatively low values of DM prevalence were found in the eastern part of the country in comparison to the western part. To evaluate the factors of retinopathy occurrence in the counties the SAR model was built. The descriptive statistics of each variable used in the model are presented in Table II and indicate the differentiation among counties’ values.
Table II
The primary statistics of variables used in the SAR model
The median number of subjects with DM and DR per county was 823.39 and 72.67, respectively. The median of average earnings among counties was about 3146.48 PLN (804.27 USD), whereas the difference between the richest and the poorest county was shown to be of value about 3825.64 PLN (977.86 USD). The median of the number of diabetic and ophthalmologic consultations per 10,000 adults was 2736.09 and 713.85, respectively. In addition, access to ophthalmologic and diabetic specialists (measured as the number of consultations per adult population) varied among counties (Figure 3). The analysis of the SAR model showed that average earnings were a significant factor for the occurrence of DR in the counties (Table III). A 10% increment of income in relation to the income median increased the retinopathy prevalence by 10.9%. In terms of absolute values, an increase in income of about 300 PLN (76.73 USD) in counties caused a increase of DR prevalence of 8 per 10,000 adults. The DR prevalence in the county was also highly influenced by the DM prevalence 82 per 10,000 adult people higher DM prevalence in the county causes 7 per 10,000 adult people higher DR retinopathy. Furthermore, the accessibility to medical services proved to be statistically significant. The increase in the number of ophthalmologic consultations according to the NHF database per 10,000 adults in a county of 10% of median (273) resulted in an increase of 2.2% of the DR prevalence median (1.6 per 10,000 adults). On the other hand, limited access to the diabetic service had the effect of decreased occurrence of DR in the counties. The goodness of the model was verified with R 2, which was equal to 0.21.
Table III
SAR model results for diabetic retinopathy social and demographic risk factors in the counties of Poland
| Variable | Coefficient estimate | 2.5% CI | 97.5% CI | P-value |
|---|---|---|---|---|
| (Intercept) | 0.812 | 0.745 | 0.886 | < 0.001* |
| Earnings | 1.109 | 1.041 | 1.182 | 0.001* |
| Age 65+ | 1.019 | 0.963 | 1.080 | 0.51 |
| Urban living | 1.000 | 0.983 | 1.017 | 0.995 |
| DM prevalence | 1.110 | 1.047 | 1.176 | < 0.001* |
| DIAB consultations | 0.988 | 0.977 | 1.000 | 0.041* |
| OPT consultations | 1.022 | 1.006 | 1.038 | 0.007* |
| DIAB consultations GP | 1.005 | 0.986 | 1.023 | 0.619 |
| OPT distance | 0.993 | 0.975 | 1.011 | 0.428 |
| DIAB distance | 0.991 | 0.980 | 1.002 | 0.098 |
Discussion
The vascular (micro- and macroangiopathy) complications of DM are the main cause of morbidity and mortality among the DM population. These complications, such as blindness, chronic renal insufficiency, and amputation of the lower limb, lead to increased mortality rates. In addition, DM is an important risk factor for the onset of Alzheimer’s disease, cognitive functional decline, and reduced health-related quality of life [5, 6]. The application of spatial analytical methods is common among studies concerning the distribution of occurrence of both contiguous and non-contiguous diseases [13, 17–19]. However, the authors did not find any study focusing on spatial analysis of diabetic retinopathy on the national level. This study is based on the overall population of Poland in the year 2017 and presents the geographical characteristics of the prevalence of diabetic retinopathy and co-existing social, demographic, and systemic factors on the county level. The given score of the Moran Index (0.18, p < 0.01) indicates that the null hypothesis of complete randomness of the distribution of DR prevalence in Poland is rejected, and it suggests the presence of cluster patterns. The high DR prevalence occurred in the south-west part of Poland, where hotspot counties have been noted. The low DR prevalence occurred mainly in the centre of Poland. The SAR model analyses revealed that the most influential factor on DR prevalence in the counties was DM prevalence, which in Poland is also not random (I = 0.21, p < 0.01). In addition, in 2017, relatively lower values of DM prevalence were seen in the eastern part of the country in comparison to the western part. The analysis of the SAR model also showed that average income was the most significant socioeconomic factor for the occurrence of DR in the counties. A higher level of average income resulted in a higher prevalence of DR in the counties of Poland. In contrast, the results of a study from the United Kingdom showed that socioeconomic deprivation was associated with increased DR prevalence in patients with type 1 DM. However, this association was not confirmed in patients with type 2 DM [27]. The results of another showed that in Spain socioeconomic status was not significantly associated with DR [28]. However, the multicentre EURODIAB IDDM Complications study showed a higher prevalence of proliferative DR in men with lower educational qualifications compared with those with a higher level of education [29]. The analysis of the socioeconomic status and global diabetes prevalence showed that diabetes prevalence rises with increasing socioeconomic status in developing countries, and this is reversed in developed countries [30]. Although Poland is a middle-income country [31], the Polish pattern of DR and DM prevalence is similar to that found in developing countries. In our study, DR prevalence in the counties was not significantly associated with place of residence, which was in agreement with the results of the study from the United Kingdom, which showed that distance to medical services was not associated with attendance of DR screening [32]. When it comes to the variables describing access to the medical service, a higher number of ophthalmological consultations has the effect of increased occurrence of DR in the counties. The regions with a greater number of ophthalmologic consultations per population are characterized by a greater number of ophthalmologists. This, in turn, indicates that the DR diagnoses are made less often in counties with limited access to ophthalmologists, which agrees with the results of previous studies from the United Kingdom [27]. However, the higher number of consultations in diabetes specialists influences the decreased DR prevalence, the number of diabetic consultations in General Practitioners (GPs) does not affect the DR occurrence in the counties. It shows the differences in the effectiveness of diabetic care in GPs and in diabetic specialists. In Poland, there are counties where the number of diabetic consultations is exceptionally low and high, which indicates great inequalities in diabetic healthcare in the country. Knowing the hotspot and low-spot locations of DR prevalence could influence the prevention program of DR. One of the possible actions that can improve the access of DM patients to ophthalmologists is the introduction of telemedicine. In the aspect of DR, telemedicine-based screening of DM patients incorporating artificial intelligence technology has the potential to facilitate more widespread and cost-effective screening, particularly in low- and middle-income countries. Early results showed high diagnostic sensitivity and specificity of such systems in DR screening programs in many countries [33–35].
The limitations of the study concern mostly the data used. NHF data include information provided for all insured people in Poland (in 2017 approx. 89% of the whole population). The data does not include information about medical services and drugs purchased by non-insured people and out-of-pocket finances. However, such mistakes probably had only a minor impact on the study findings, because non-insured people are rather poor and do not purchase a lot of medical services in Poland. The population size and national recruitment are the most important strengths of the present study.
In conclusion, geographic information systems with spatial analytical methods are helpful in the study of health status and health care delivery. All social, economic, environmental, and genetic factors may have spatial distributions influencing the prevalence of a particular disease. Our study showed statistically significant differences in the prevalence of DR and DM in the overall population of Poland in the years 2013–2017 on the regional level. This is the first nationwide study of DR in Central Europe on such a low administrative level. The presented results indicate that high DR prevalence occurred in the south-west part of Poland and low DR prevalence occurred mainly in the centre of Poland. The analyses of co-existing social, demographic, and systemic factors revealed that the level of income and access to ophthalmologic and diabetic services are crucial in DR prevalence.