Introduction
While the primary goal of diabetes management is to extend life and prevent both early and late complications, another important goal is to avoid deterioration in quality of life. The patient’s perspective is becoming increasingly important in assessing treatment results. Patient-reported outcomes (PROs), including health-related quality of life (HRQoL), are frequently used as a supplement to traditional endpoints [1].
HRQoL can be measured using generic or disease-specific instruments. The latter are designed to assess narrowly defined groups of patients and measure aspects that are particularly salient to a specific disease. They are characterised by high sensitivity and responsiveness to clinical changes over time [2, 3]. Examples of frequently used diabetes-specific questionnaires are: the Audit of Diabetes Dependent Quality of Life (ADDQoL) [4], the Diabetes Quality of Life measure (DQOL) [5] and the Diabetes Care Profile (DCP) [6].
In turn, generic HRQoL instruments are designed to be applicable across all conditions and diseases, across different medical treatments and a wide range of populations [7]. This group includes health profiles and health utility measures. The former are based on psychometry and assess HRQoL as a multidimensional construct. The latter use econometric methods to summarise HRQoL as a single value and allow quality-adjusted life years (QALYs) to be calculated. The most well-known representatives of both groups are Short Form-36 (SF-36) [8] and EQ-5D [9], respectively.
Even the relatively short SF-36 questionnaire was judged to be too long for large-scale surveys. In response to this issue, the Short Form-12 (SF-12) Health Survey was developed as a single-page, 2-minute questionnaire. It offers satisfactory psychometric properties and reproduces two SF-36 summary measures with high accuracy [10]. Despite being much shorter, it nonetheless represents a vital alternative to SF-36. The SF-12 questionnaire has been successfully validated in patients with diabetes [11].
Many clinical trials in diabetes include generic HRQoL instruments [12]. Most studies use samples of out-patients or in-patients. However, investigating general populations enables the burden of diabetes to be estimated from a societal perspective and on a macro scale. In Poland, the SF-12 questionnaire has not yet been used in population surveys, nor in patients with diabetes.
The primary purpose of this study was to compare population values of HRQoL measured with SF-12 in respondents with and without self-declared diabetes in a nationally representative survey. The secondary goal was to identify the main sociodemographic factors related to HRQoL in people with diabetes.
Material and methods
Sample recruitment
To obtain a nationally representative sample of Polish adults, multi-stage stratified random sampling was used. The Polish adult population was divided into 65 strata, taking into account the country’s administrative division (16 provinces or ‘voivodships’) and the type and size of localities in each province. The pre-determined study sample was allocated into layers, so as to reflect the general population structure. Sampling was performed in three steps: first – localities (towns/cities or villages); second – small areas (one or several adjacent streets); third – 8 people living in separate households from each of the selected areas were selected, based on their personal identification number (PESEL). Sample recruitment was carried out by a market research company – the Public Opinion Research Centre (CBOS).
The SF-12 questionnaire
We assessed HRQoL using the second version of the Short Form-12 Health Survey – SF-12v2. The questionnaire contains 12 items, covering eight domains: physical functioning (PF), role physical (RP), bodily pain (BP), general health (GH), vitality (VT), social functioning (SF), role emotional (RE) and mental health (MH). Based on the domains, two summary measures may be estimated – the Physical and Mental Component Summary scores (PCS-12 and MCS-12, respectively). Both domains and summaries are rated from 0 to 100, where 0 represents the lowest level of health and 100 the highest. The PCS and MCS were intentionally calibrated in such a way that 50 represents the average rating for the US general population and a difference of 10 points is equal to one standard deviation in this population (2009 year data) [13]. Based on the SF-12 responses, we also estimated SF-6D – a measure of overall health status weighted by societal health preferences. SF-6D is rated from 0.0 (worst recorded health state) to 1.0 (best recorded health state) [14, 15]. The official Polish translation of SF-12 in a paper-and-pencil version was used.
Survey
We classified respondents as having self-reported diabetes if, in response to the question ‘Have you ever been diagnosed with diabetes?’, they chose one of the following answers: (1) ‘Yes, but I don’t take any medication’, (2) ‘Yes, I take anti-diabetic medication (other than insulin)’ or (3) ‘Yes, I take insulin’. Respondents with combination treatment were allowed to choose both answers (2) and (3).
Sociodemographic questions covered the following characteristics: age, sex, type and size of locality, administrative region, educational level, occupational status, religious beliefs and smoking status. Data were collected during face-to-face interviews led by professional CBOS interviewers using the computer-assisted personal interviewing (CAPI) system.
Analysis
Results were presented for the whole sample, as well as for the predefined comparisons: (1) diabetes versus no diabetes, (2) treated for diabetes versus no medication, (3) treated with insulin versus other drugs versus combined treatment. For continuous variables, such as PCS-12, MCS-12 and SF-6D, the mean values with standard deviation, 95% confidence interval, median, interquartile range and range were estimated.
Statistical analysis
Confidence intervals for proportions (i.e. the prevalence of diabetes or a specific treatment) were calculated using the Clopper-Pearson method. Differences between the analysed groups were determined with z, χ2, Fisher exact or Mann-Whitney tests as appropriate. We used multiple linear regression to examine the associations of sociodemographic characteristics with the PCS-12, MCS-12 and SF-6D scores. All variables, including age, were entered into the models as categorical variables. We presented all regression coefficients, together with information about the level of statistical significance. The analysis was conducted using StatsDirect 3.1.22 (StatsDirect Ltd, Altrincham, England) statistical software. The study was accepted by the Bioethical Commission of the Medical University of Warsaw (AKBE/95/2019). Oral informed consent was obtained from all individual participants included in the study.
Results
Study population
Respondents’ characteristics are shown in Table I. From April to June 2014, 2986 interviews were conducted. The representativeness of the study population was confirmed and discussed in our previous publication [16]. Data from 2938 (98.4%) subjects (53.3% females, age range 18–87 years, 63.3% urban residents) contained full SF-12 data and were used in the further analysis.
Table I
Characteristics of respondents by diabetes and treatment status
| Parameter | All | Diabetes | Treatment of diabetes | Type of treatment | ||||||
|---|---|---|---|---|---|---|---|---|---|---|
| No | Yes | P-value* | No | Yes | P-value** | Oral drugs | Insulin | Combined treatment | ||
| N | 2938 | 2688 | 250 | 60 | 190 | 121 | 56 | 13 | ||
| Age, mean (SD) | 48.5 (17.9) | 47.0 (17.6) | 64.8 (11.9) | < 0.0001 | 57.5 (16.1) | 67.0 (9.1) | < 0.0001 | 67.0 (9.0) | 67.6 (9.3) | 65.2 (9.9) |
| Gender, n (%): | ||||||||||
| Female | 1565 (53.3) | 1430 (53.2) | 135 (54.0) | N.S. | 31 (52.2) | 104 (54.7) | N.S. | 65 (53.7) | 30 (53.6) | 9 (69.2) |
| Male | 1373 (46.7) | 1258 (46.8) | 115 (46.0) | 29 (48.3) | 86 (45.3) | 56 (46.3) | 26 (46.4) | 4 (30.8) | ||
| Place of residence, n (%): | ||||||||||
| Country | 1077 (36.7) | 998 (37.1) | 79 (31.6) | 0.09 | 17 (28.3) | 62 (32.6) | N.S. | 37 (30.6) | 18 (32.1) | 7 (53.8) |
| Town up to 20,000 | 499 (17.0) | 451 (16.8) | 48 (19.2) | 13 (21.1) | 35 (18.4) | 28 (23.1) | 7 (12.5) | 0 (0) | ||
| Town 20,000–49,999 | 329 (11.2) | 295 (11.0) | 34 (13.6) | 12 (20.0) | 22 (11.6) | 15 (12.4) | 5 (8.9) | 2 (15.4) | ||
| Town 50,000–99,999 | 232 (7.9) | 216 (8.0) | 16 (6.4) | 0 (0) | 16 (8.4) | 9 (7.4) | 5 (8.9) | 2 (15.4) | ||
| Town 100,000–499,999 | 503 (17.1) | 455 (17.0) | 48 (19.2) | 12 (20.0) | 36 (19.0) | 24 (19.8) | 11 (19.6) | 1 (7.7) | ||
| Town ≥ 500,000 | 298 (10.1) | 273 (10.2) | 25 (10.0) | 6 (10.0) | 19 (10.0) | 8 (6.6) | 10 (17.9) | 1 (7.7) | ||
| Region, n (%): | ||||||||||
| Lower Silesia Province | 259 (8.8) | 237 (8.8) | 22 (8.8) | N.S. | 6 (10.0) | 16 (8.4) | N.S. | 10 (8.3) | 6 (10.7) | 0 (0) |
| Kujawy-Pomerania Province | 148 (5.0) | 136 (5.1) | 12 (4.8) | 2 (3.3) | 10 (5.3) | 9 (7.4) | 1 (1.9) | 0 (0) | ||
| Lublin Province | 148 (5.0) | 138 (5.1) | 10 (4.0) | 4 (6.7) | 6 (3.1) | 5 (4.1) | 1 (1.8) | 0 (0) | ||
| Lubuskie Province | 76 (2.6) | 64 (2.4) | 12 (4.8) | 1 (1.7) | 11 (5.8) | 7 (5.8) | 4 (7.1) | 0 (0) | ||
| Łódź Province | 209 (7.1) | 198 (7.4) | 11 (4.4) | 2 (3.3) | 9 (4.7) | 5 (6.0) | 3 (5.4) | 0 (0) | ||
| Małopolska Province | 275 (9.4) | 250 (9.3) | 25 (10.0) | 5 (8.3) | 20 (10.5) | 11 (9.1) | 9 (16.1) | 0 (0) | ||
| Mazovia Province | 372 (12.7) | 342 (12.7) | 30 (12.0) | 9 (15.0) | 21 (11.1) | 13 (10.7) | 7 (12.5) | 1 (7.7) | ||
| Opole Province | 77 (2.6) | 69 (2.6) | 8 (3.2) | 4 (6.7) | 4 (2.1) | 3 (2.5) | 1 (1.8) | 0 (0) | ||
| Podkarpackie Province | 168 (5.7) | 149 (5.4) | 19 (7.6) | 4 (6.7) | 15 (7.9) | 12 (9.9) | 3 (5.4) | 0 (0) | ||
| Podlasie Province | 103 (3.5) | 94 (3.5) | 9 (3.6) | 2 (3.3) | 7 (3.7) | 4 (3.3) | 2 (3.6) | 1 (7.7) | ||
| Pomerania Province | 149 (5.1) | 133 (4.9) | 16 (6.4) | 1 (1.7) | 15 (7.9) | 9 (7.4) | 5 (8.9) | 1 (7.7) | ||
| Silesia Province | 386 (13.1) | 358 (13.3) | 28 (11.2) | 7 (11.7) | 21 (11.) | 11 (9.1) | 7 (12.5) | 3 (23.1) | ||
| Świętokrzyskie Province | 93 (3.2) | 89 (3.3) | 4 (1.6) | 1 (1.7) | 3 (1.6) | 1 (0.8) | 2 (3.6) | 0 (0) | ||
| Warmia-Masuria Province | 100 (3.4) | 91 (3.4) | 9 (3.6) | 3 (5.0) | 6 (3.1) | 5 (4.1) | 1 (1.8) | 0 (0) | ||
| Wielkopolska Province | 245 (8.3) | 223 (8.3) | 22 (8.8) | 5 (8.3) | 17 (8.9) | 9 (7.4) | 4 (7.1) | 4 (30.8) | ||
| West-Pomerania Province | 130 (4.4) | 117 (4.4) | 13 (5.2) | 4 (6.7) | 9 (4.7) | 6 (5.0) | 0 (0) | 3 (23.1) | ||
| Education level, n (%): | ||||||||||
| Low | 508 (17.3) | 447 (16.6) | 61 (24.4) | < 0.01 | 13 (21.7) | 48 (25.3) | N.S. | 25 (20.7) | 19 (33.9) | 4 (30.8) |
| Medium | 1728 (58.8) | 1582 (58.9) | 146 (58.4) | 31 (51.7) | 115 (60.5) | 77 (63.6) | 32 (57.1) | 6 (46.2) | ||
| High | 702 (23.9) | 659 (24.5) | 43 (17.2) | 16 (26.7) | 27 (14.2) | 19 (15.7) | 5 (8.9) | 3 (23.1) | ||
| Occupational status, n (%): | ||||||||||
| Employed | 1439 (49.0) | 1388 (51.6) | 51 (20.4) | < 0.0001 | 24 (40.0) | 27 (14.2) | < 0.0001 | 18 (14.9) | 8 (14.3) | 1 (7.7) |
| Unemployed | 197 (6.7) | 190 (7.1) | 7 (2.8) | 3 (5.0) | 4 (2.1) | 2 (1.7) | 1 (1.8) | 1 (7.7) | ||
| Retired | 932 (31.7) | 751 (27.9) | 181 (72.4) | 29 (48.3) | 152 (80.0) | 95 (78.5) | 46 (82.1) | 11 (84.6) | ||
| Student | 208 (7.1) | 207 (7.7) | 1 (0.4) | 1 (1.7) | 0 (0) | 0 (0) | 0 (0) | 0 (0) | ||
| Domestic | 106 (3.6) | 100 (3.7) | 6 (2.4) | 2 (3.3) | 4 (2.1) | 4 (3.3) | 0 (0) | 0 (0) | ||
| Other | 56 (1.9) | 52 (1.9) | 4 (1.6) | 1 (1.7) | 3 (1.6) | 2 (1.7) | 1 (1.8) | 0 (0) | ||
| Smoking status, n (%): | ||||||||||
| Yes | 766 (26.2) | 711 (26.6) | 55 (22.0) | < 0.0001 | 13 (21.7) | 42 (22.0) | N.S. | 21 (17.4) | 17 (30.4) | 4 (30.8) |
| No | 1668 (57.1) | 1547 (57.9) | 121 (48.4) | 31 (51.7) | 90 (47.4) | 62 (51.2) | 24 (42.9) | 4 (30.8) | ||
| In the past | 489 (16.7) | 415 (15.5) | 74 (29.6) | 16 (26.7) | 58 (30.5) | 38 (31.4) | 15 (26.8) | 5 (38.5) | ||
The prevalence of self-reported diabetes in the sample from the general population was 8.5% (95% CI: 7.5–9.6). Among 250 respondents with diabetes, 48.4% (95% CI: 42.1–54.8) were treated with oral anti-diabetic drugs, 22.4% (95% CI: 17.4–28.1) with insulin and 5.2% (95% CI: 2.8–8.7) with combined treatment. A high percentage of patients declared no medication usage – 24.0% (95% CI: 18.8–29.8).
Respondents with self-declared diabetes, compared to healthy ones, were older (64.8 ±11.9 vs. 47.0 ±17.6 years, p < 0.0001), worse educated, more often retired (72.4% vs. 27.9%) and had smoked in the past (29.6% vs. 15.5%).
SF-12 domains
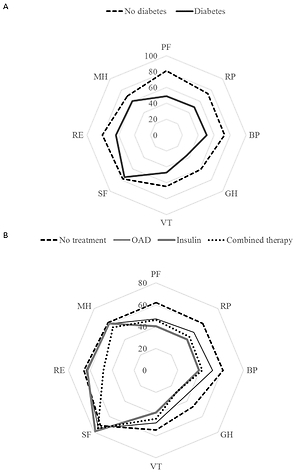
Data on SF-12 domain ratings, according to diabetes and treatment status, are shown in Figure 1 and Table II. Respondents with diabetes differed statistically significantly from non-diabetic subjects across all SF-12 questionnaire dimensions. The most substantial differences concerned physical domains: PF, GH, RP and BP (difference of means: 31.9, 24.9, 24.1 and 22.3 points, respectively; p < 0.0001 in all cases).
Table II
SF-12 domains by diabetes and treatment status, mean (SD)
| SF-12 domains | All (n = 2938) | Diabetes | Treatment of diabetes | Type of treatment | |||||||
|---|---|---|---|---|---|---|---|---|---|---|---|
| No (n = 2688) | Yes (n = 250) | P-value | No (n = 60) | Yes (n = 190) | P-value | Oral drugs (n = 121) | Insulin (n = 56) | Combined treatment (n = 13) | P-value* | ||
| Physical Functioning (PF) | 78.3 (31.2) | 81.0 (29.5) | 49.1 (34.7) | < 0.0001 | 61.9 (34.1) | 45.1 (33.9) | 0.001 | 47.1 (33.4) | 40.5 (37.1) | 46.2 (22.5) | N.S. |
| Role Physical (RP) | 71.5 (27.3) | 73.6 (26.3) | 49.5 (29.0) | < 0.0001 | 60.6 (28.4) | 46.0 (28.4) | < 0.001 | 49.0 (28.0) | 40.2 (29.2) | 43.3 (25.8) | N.S. |
| Bodily Pain (BP) | 71.2 (28.6) | 73.1 (27.7) | 50.8 (30.4) | < 0.0001 | 61.3 (29.3) | 47.5 (30.1) | < 0.01 | 51.9 (29.3) | 39.3 (29.7) | 42.3 (32.9) | < 0.05 |
| General Health (GH) | 59.0 (25.4) | 61.1 (24.4) | 36.2 (24.7) | < 0.0001 | 47.5 (26.8) | 32.6 (22.9) | 0.0001 | 35.5 (22.9) | 27.4 (22.7) | 27.3 (21.4) | < 0.05 |
| Vitality (VT) | 63.2 (25.5) | 64.6 (24.9) | 47.3 (26.0) | < 0.0001 | 54.6 (27.0) | 45.0 (25.4) | < 0.05 | 48.1 (25.0) | 38.4 (26.5) | 44.2 (18.1) | < 0.05 |
| Social Functioning (SF) | 77.4 (21.3) | 77.7 (21.6) | 74.8 (18.3) | < 0.01 | 71.7 (20.8) | 75.8 (17.4) | N.S. | 74.6 (18.3) | 78.6 (15.4) | 75.0 (17.7) | N.S. |
| Role Emotional (RE) | 79.1 (24.4) | 80.6 (23.3) | 63.4 (29.7) | < 0.0001 | 65.8 (28.3) | 62.6 (30.2) | N.S. | 64.0 (30.1) | 62.9 (31.0) | 48.1 (25.4) | N.S. |
| Mental Health (MH) | 68.8 (19.5) | 69.6 (19.2) | 60.5 (20.5) | < 0.0001 | 61.7 (18.5) | 60.1 (21.1) | N.S. | 60.3 (20.7) | 60.7 (22.8) | 55.8 (17.4) | N.S. |
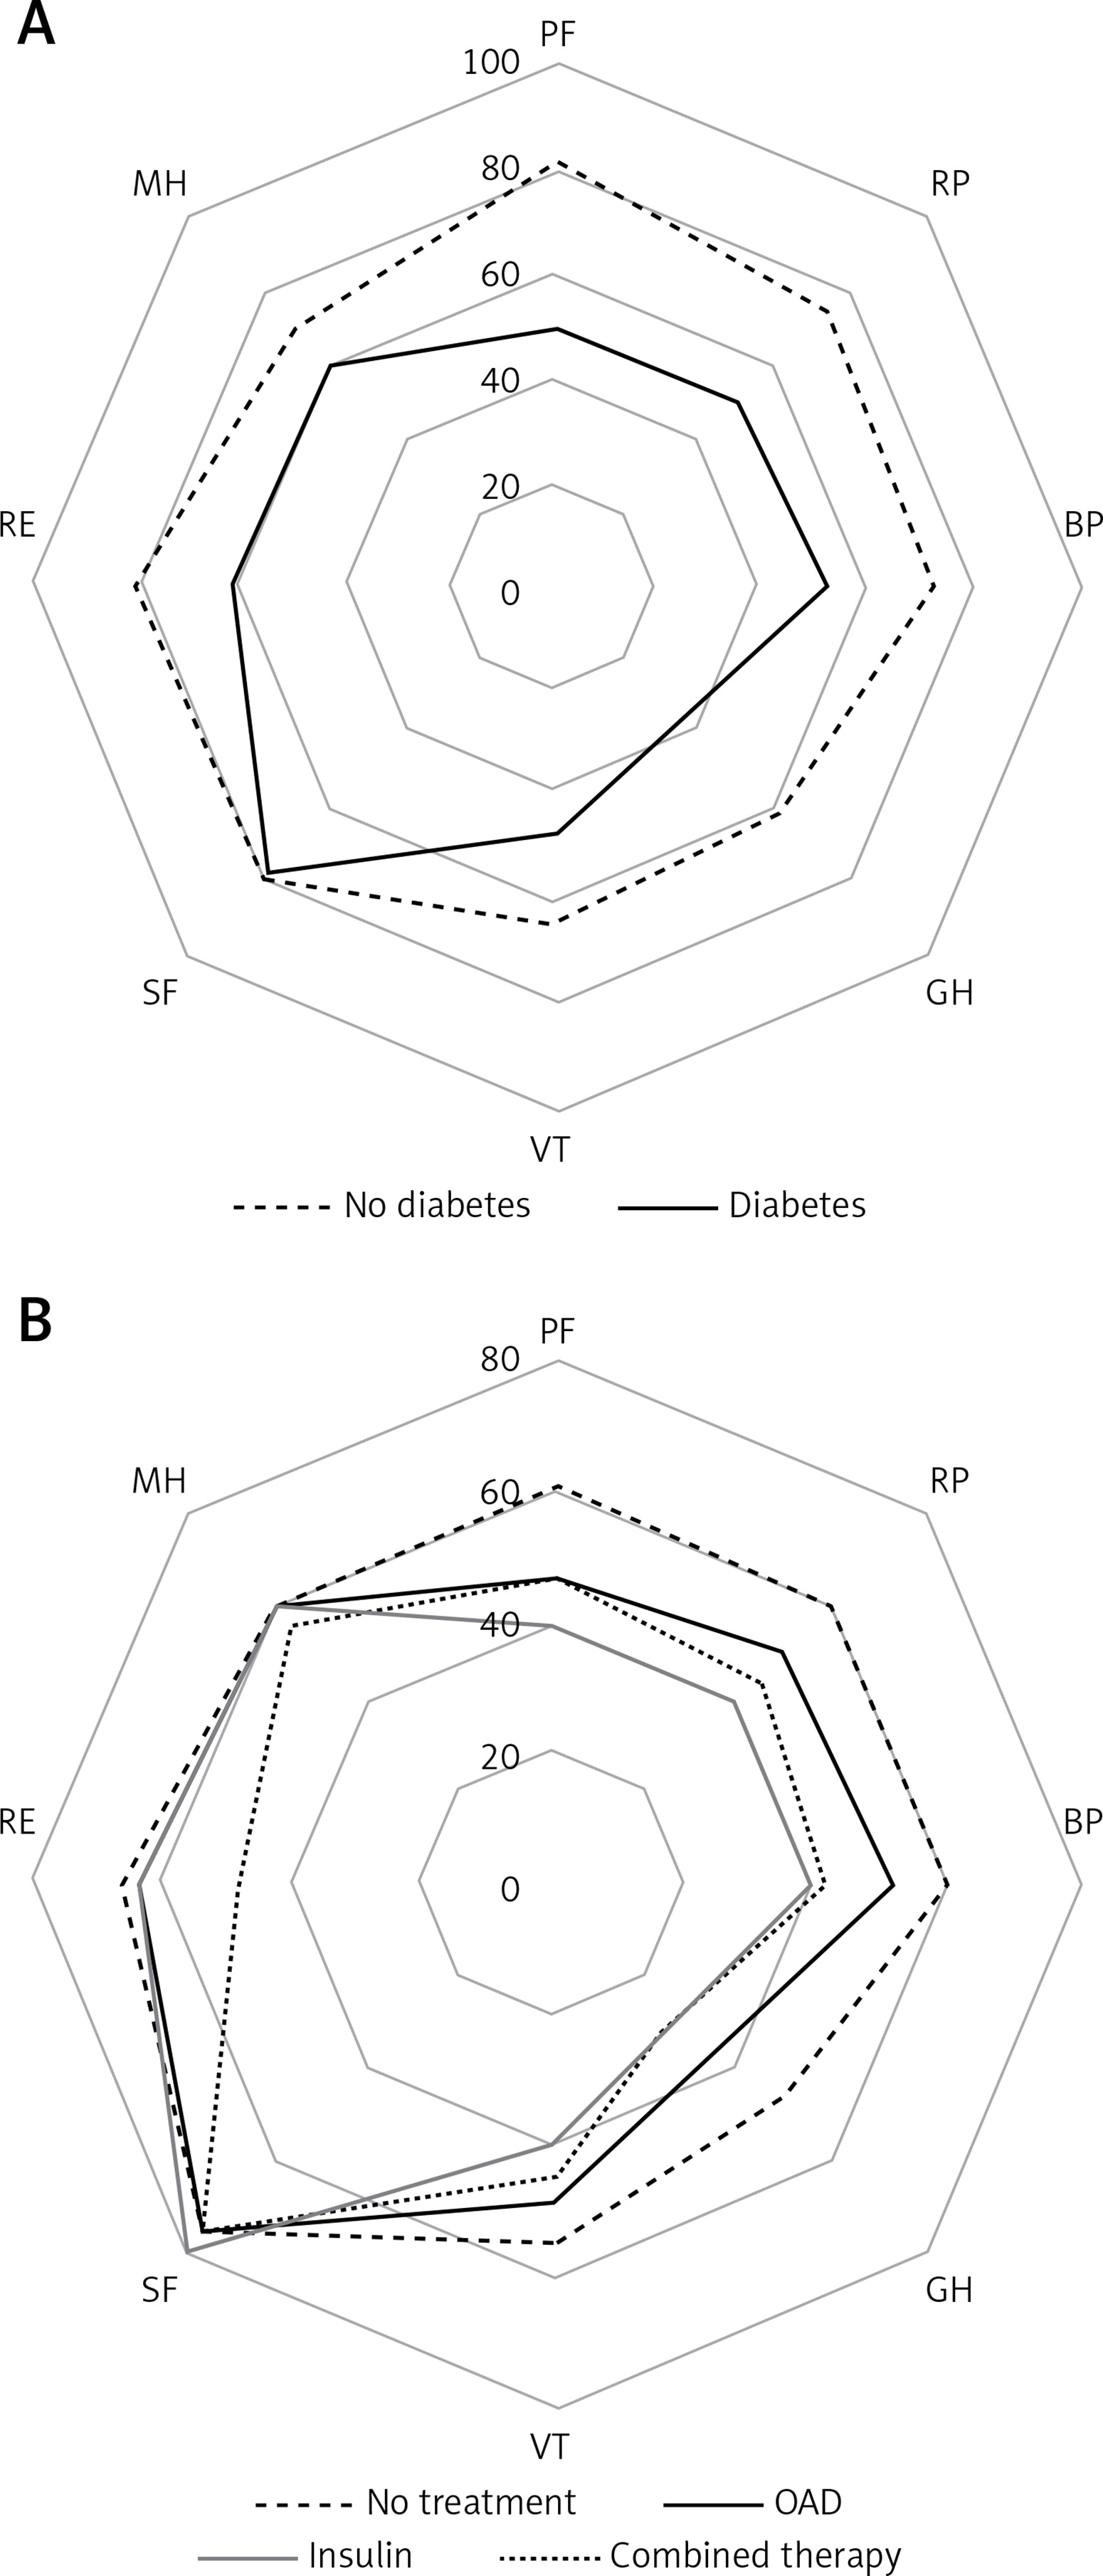
Patients with diabetes and no medication, in comparison to treated patients, had a better quality of life in five domains: PF, GH, RP, BP and VT (difference of means 16.8, 14.9, 14.6, 13.8 and 9.6 points, respectively). Subjects treated with oral drugs, compared to those taking insulin, reported better BP, VT and GH scores (12.6, 9.7 and 8.1 points, respectively).
SF-12 summary indices
SF-12 summary indices – PCS-12, MCS-12 and SF-6D scores – are shown in Figure 2 and Table III.
Table III
SF-12 summary indices – PCS, MCS, SF-6D by diabetes and treatment status
| Endpoint | All (n = 2938) | Diabetes | Treatment of diabetes | Type of treatment | |||||||
|---|---|---|---|---|---|---|---|---|---|---|---|
| No (n = 2688) | Yes (n = 250) | P-value | No (n = 60) | Yes (n = 190) | P-value | Oral drugs (n = 121) | Insulin (n = 56) | Combined treatment (n = 13) | P-value* | ||
| Physical Component Summary (PCS-12): | |||||||||||
| Mean (SD) | 48.4 (9.8) | 49.3 (9.2) | 39.3 (10.4) | < 0.0001 | 44.4 (10.2) | 37.6 (10.0) | < 0.0001 | 39.0 (9.4) | 34.7 (10.9) | 37.9 (8.3) | < 0.05 |
| Median (Q1–Q3) | 51.8 (42.0–56.1) | 52.2 (43.6–56.1) | 39.4 (31.5–45.7) | 44.4 (36.8–52.5) | 38.8 (30.1–43.9) | 39.5 (32.5–44.2) | 34.7 (26.3–42.5) | 38.8 (35.7–39.4) | |||
| Min./max. | 14.0/64.25 | 13.9/64.3 | 16.3/61.6 | 20.9/61.6 | 16.3/60.1 | 16.3/60.1 | 16.4/59.0 | 22.2/56.2 | |||
| Mental Component Summary (MCS–12): | |||||||||||
| Mean (SD) | 50.1 (8.0) | 50.4 (8.0) | 47.6 (7.9) | < 0.0001 | 46.8 (7.0) | 47.8 (8.1) | N.S. | 47.9 (8.1) | 48.6 (8.5) | 44.3 (5.5) | N.S. |
| Median (Q1–Q3) | 50.5 (44.3–56.0) | 51.0 (44.7–56.4) | 47.7 (42.0–52.9) | 46.2 (41.5–51.4) | 47.9 (42.1–54.0) | 47.8 (41.8–54.0) | 48.7 (42.8–54.5) | 43.1 (40.6–49.4) | |||
| Min./max. | 15.4/71.2 | 15.0/71.2 | 28.3/69.0 | 33.2/62.5 | 28.3/69.0 | 31.1/69.0 | 28.3/68.5 | 36.4/51.4 | |||
| SF–6D Index: | |||||||||||
| Mean (SD) | 0.732 (0.142) | 0.741 (0.140) | 0.631 (0.133) | < 0.0001 | 0.667 (0.135) | 0.620 (0.131) | < 0.05 | 0.633 (0.135) | 0.598 (0.127) | 0.592 (0.097) | N.S. |
| Median (Q1–Q3) | 0.720 (0.620–0.860) | 0.720 (0.640–0.860) | 0.620 (0.540–0.720) | 0.660 (0.600–0.750) | 0.620 (0.530–0.680) | 0.620 (0.550–0.720) | 0.600 (0.520–0.660) | 0.620 (0.530–0.620) | |||
| Min./max. | 0.35/1.00 | 0.35/1.00 | 0.35/1.00 | 0.37/1.00 | 0.35/1.00 | 0.35/1.00 | 0.35/0.86 | 0.44/0.80 | |||
Figure 2
SF-12 summary indices PCS-12 (A), MCS-12 (B) and SF-6D (C) by diabetes and treatment status (mean, 95% CI interval)
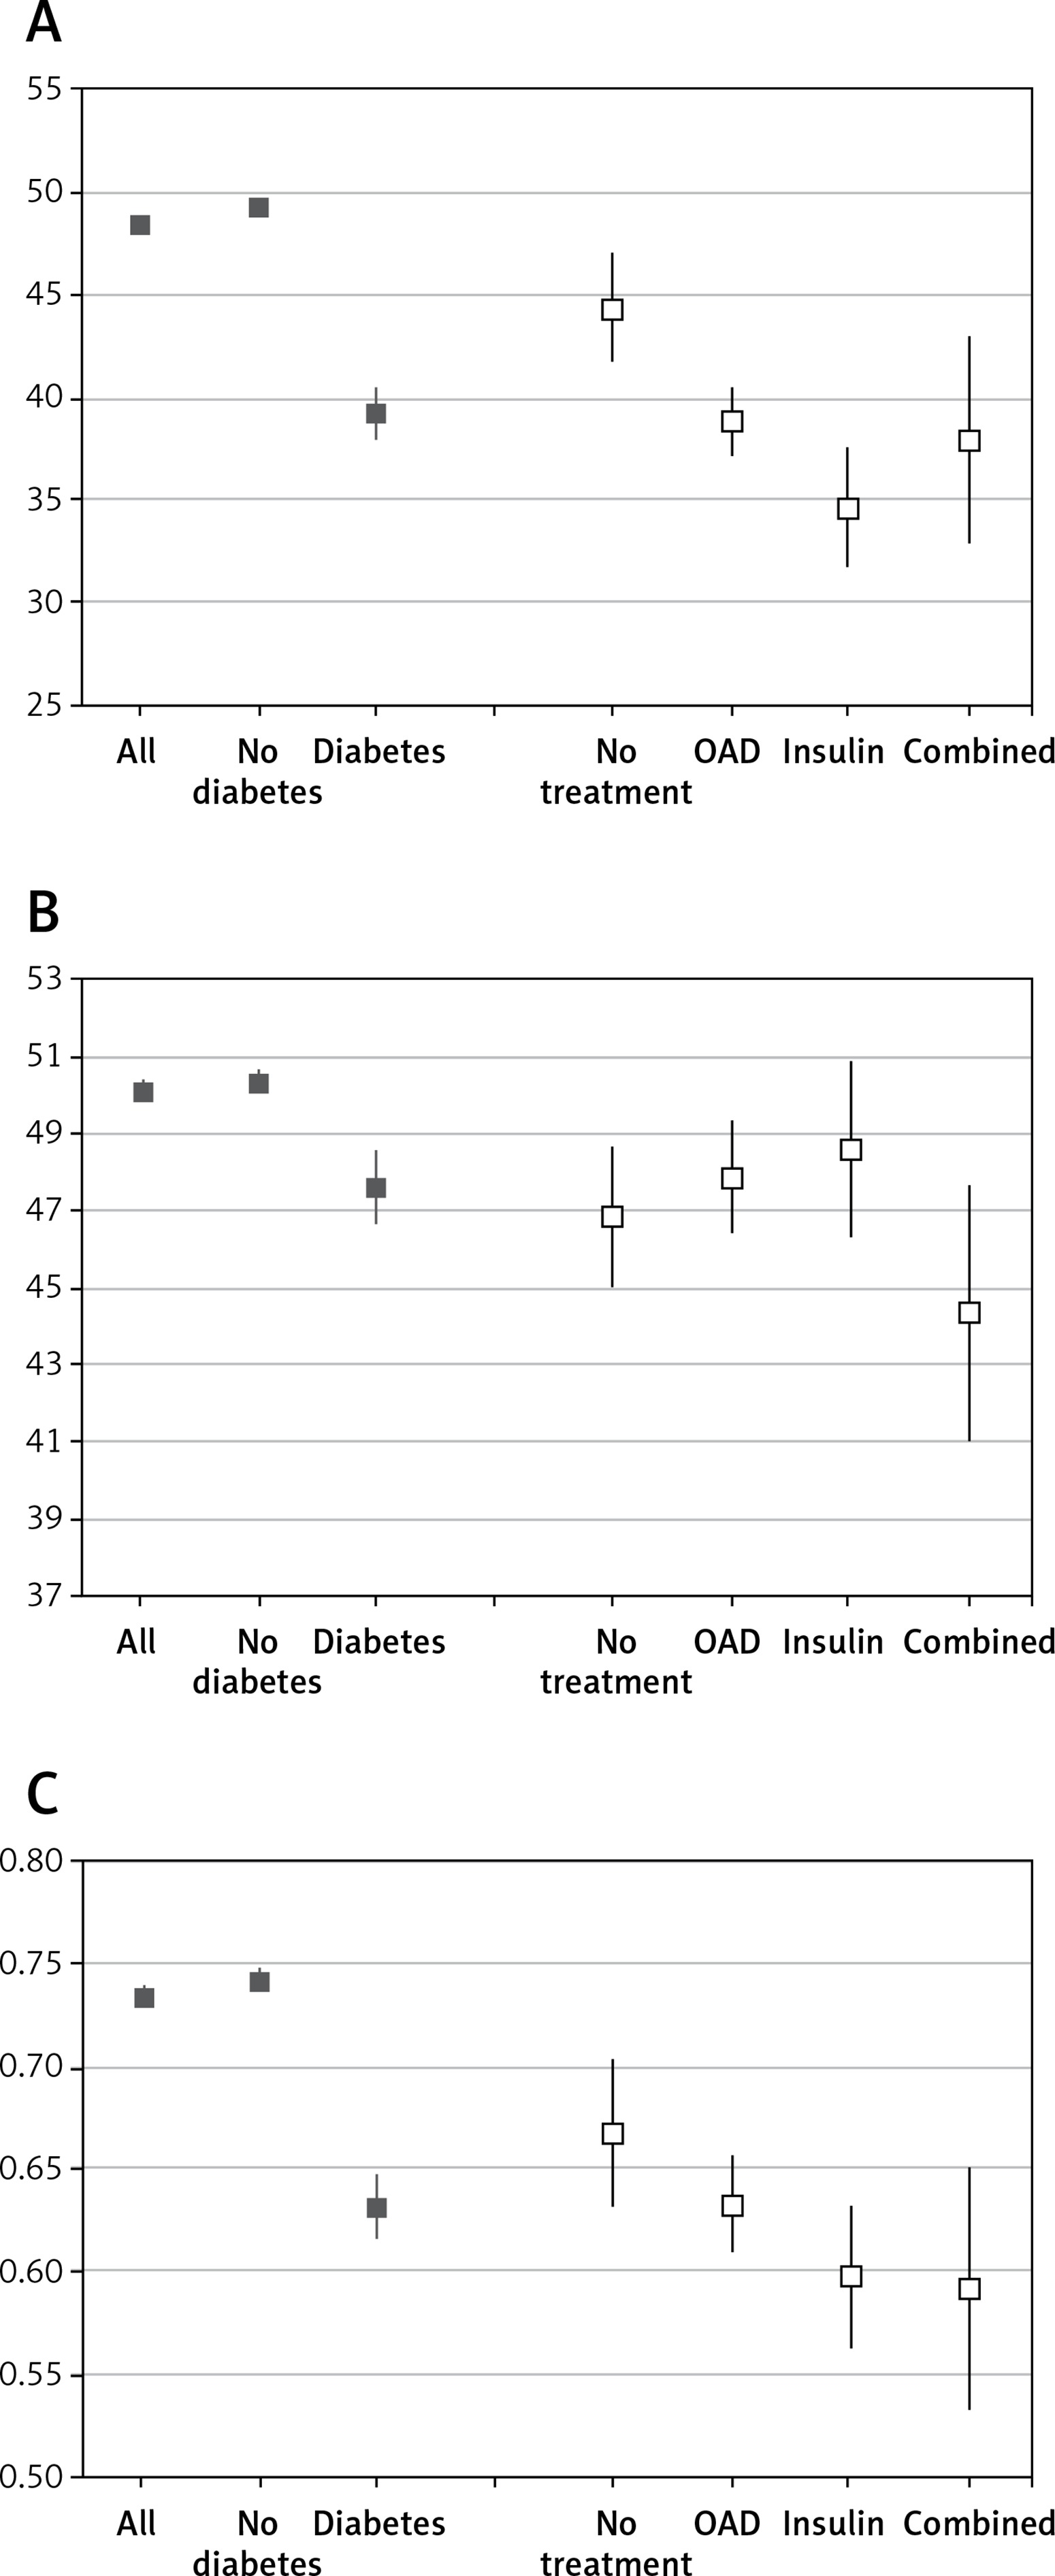
Respondents with self-declared diabetes, in comparison to those without diabetes, had lower ratings in all three indices: PCS-12 (39.3 ±10.4 vs. 49.3 ±9.2), MCS-12 (47.6 ±7.9 vs. 50.4 ±8.0) and SF-6D (0.631 ±0.133 vs. 0.741 ±0.140). A difference of 10 points observed in PCS-12, by definition of this measure, responds to 1 standard deviation observed in a population. Treated patients with diabetes, in comparison to non-treated patients, were characterised by lower PCS-12 and SF-6D scores – by 6.8 and 0.047, respectively. Patients taking insulin, in contrast to those treated with oral drugs, had lower PCS-12 measures – by 4.3 points (p < 0.05).
Demographic factors and HRQoL
Those sociodemographic characteristics which significantly predicted the SF-12 summary scores of respondents with diabetes are reported in Table IV and Figure 3. Multiple linear regression showed that worse physical functioning (PCS-12) was found in patients with diabetes treated with insulin, women, and age groups over 50 years; better physical functioning was noted in respondents with medium or higher levels of education.
Table IV
The association between HRQoL outcomes and demographic factors in diabetes patients (n = 250)
| Variable | PCS-12 | MCS-12 | SF-6D Index | ||||
|---|---|---|---|---|---|---|---|
| N (%) | Mean (SD) | Multiple linear regression coefficients | Mean (SD) | Multiple linear regression coefficients | Mean (SD) | Multiple linear regression coefficients | |
| Intercept | 54.5 | 48.8 | 0.711 | ||||
| Diabetes treatment: | |||||||
| No treatment | 60 (24.0) | 44.4 (10.2) | Reference | 46.8 (7.0) | Reference | 0.667 (0.135) | Reference |
| Oral drugs | 121 (48.4) | 39.0 (9.5) | –2.5 | 47.9 (8.1) | 2.8** | 0.633 (0.135) | 0.008 |
| Insulin | 56 (22.4) | 34.7 (10.9) | –6.1** | 48.6 (8.5) | 3.7** | 0.598 (0.127) | –0.019 |
| Combined treatment | 13 (5.2) | 37.9 (8.3) | –2.2 | 44.3 (5.5) | –1.3 | 0.592 (0.097) | –0.028 |
| Gender: | |||||||
| Male | 115 (46.0) | 40.7 (10.5) | Reference | 48.6 (7.8) | Reference | 0.651 (0.132) | Reference |
| Female | 135 (54.0) | 38.0 (10.2) | –2.1* | 46.8 (7.8) | –2.1* | 0.615 (0.133) | –0.033* |
| Age group: | |||||||
| 18–39 years | 10 (4.0) | 52.8 (9.8) | Reference | 49.7 (7.0) | Reference | 0.752 (0.131) | Reference |
| 40–49 years | 14 (5.6) | 46.1 (8.8) | –6.1 | 50.5 (7.8) | –0.1 | 0.740 (0.152) | –0.019 |
| 50–59 years | 37 (14.8) | 42.6 (10.7) | –8.0** | 47.6 (7.2) | –4.8 | 0.643 (0.121) | –0.117** |
| 60–69 years | 107 (42.8) | 39.5 (9.0) | –9.5** | 47.1 (9.0) | –5.8** | 0.631 (0.121) | –0.116** |
| 70–79 years | 63 (25.2) | 36.1 (10.1) | –11.5** | 48.0 (8.0) | –5.0 | 0.612 (0.134) | –0.123** |
| ≥ 80 years | 19 (7.6) | 29.6 (6.8) | –16.6** | 46.1 (8.5) | –7.2** | 0.529 (0.112) | –0.195** |
| Place of residence: | |||||||
| City | 171 (68.4) | 38.9 (10.1) | Reference | 47.7 (7.7) | Reference | 0.629 (0.132) | Reference |
| Country | 79 (31.6) | 40.0 (11.1) | 1.7 | 47.4 (8.2) | 0.3 | 0.636 (0.137) | 0.021 |
| Geographical region: | |||||||
| Central | 41 (16.4) | 40.0 (10.1) | Reference | 47.8 (7.4) | Reference | 0.624 (0.134) | Reference |
| East | 42 (16.8) | 38.9 (10.5) | –2.1 | 44.4 (6.7) | –3.1* | 0.593 (0.129) | –0.040 |
| North | 37 (14.8) | 38.2 (10.5) | –0.7 | 48.0 (6.5) | 0.7 | 0.636 (0.133) | 0.022 |
| North-West | 47 (18.8) | 37.0 (10.7) | –2.8 | 48.1 (8.7) | 1.2 | 0.613 (0.146) | –0.006 |
| South | 53 (21.2) | 40.6 (10.7) | 0.6 | 47.9 (8.4) | 0.3 | 0.647 (0.119) | 0.022 |
| South-West | 30 (12.0) | 41.2 (9.7) | 0.9 | 50.1 (8.4) | 3.0 | 0.688 (0.128) | 0.060* |
| Education level: | |||||||
| Low | 61 (24.4) | 33.9 (9.0) | Reference | 46.1 (7.8) | Reference | 0.569 (0.123) | Reference |
| Medium | 146 (58.4) | 40.2 (10.4) | 3.4** | 48.3 (8.0) | 1.5 | 0.645 (0.133) | 0.044** |
| High | 43 (17.2) | 43.6 (9.4) | 5.1** | 47.4 (7.3) | 0.7 | 0.674 (0.121) | 0.059** |
| Internet usage: | |||||||
| At least once a week | 66 (26.4) | 43.2 (9.0) | Reference | 48.0 (8.3) | Reference | 0.674 (0.135) | Reference |
| Less than once a week | 97 (38.8) | 35.9 (10.2) | –2.8 | 47.3 (8.0) | 0.8 | 0.597 (0.130) | –0.029 |
| Refuse to answer | 87 (34.8) | 40.0 (10.6) | –1.8 | 47.6 (7.4) | 0.9 | 0.636 (0.126) | –0.012 |
| Smoking status: | |||||||
| No | 121 (48.4) | 38.8 (11.0) | Reference | 47.3 (7.8) | Reference | 0.621 (0.142) | Reference |
| Yes | 55 (22.0) | 40.7 (9.9) | –0.5 | 46.4 (7.0) | –1.7 | 0.627 (0.120) | –0.014 |
| In the past | 74 (29.6) | 38.9 (9.9) | –1.6 | 49.0 (8.4) | 0.5 | 0.650 (0.128) | 0.002 |
| Religion: | () | ||||||
| Don’t believe | 14 (5.6) | 41.3 (9.0) | Reference | 44.5 (5.3) | Reference | 0.603 (0.092) | Reference |
| Believes | 236 (94.4) | 39.1 (10.5) | 0.1 | 47.8 (8.0) | 3.5 | 0.633 (0.135) | 0.059 |
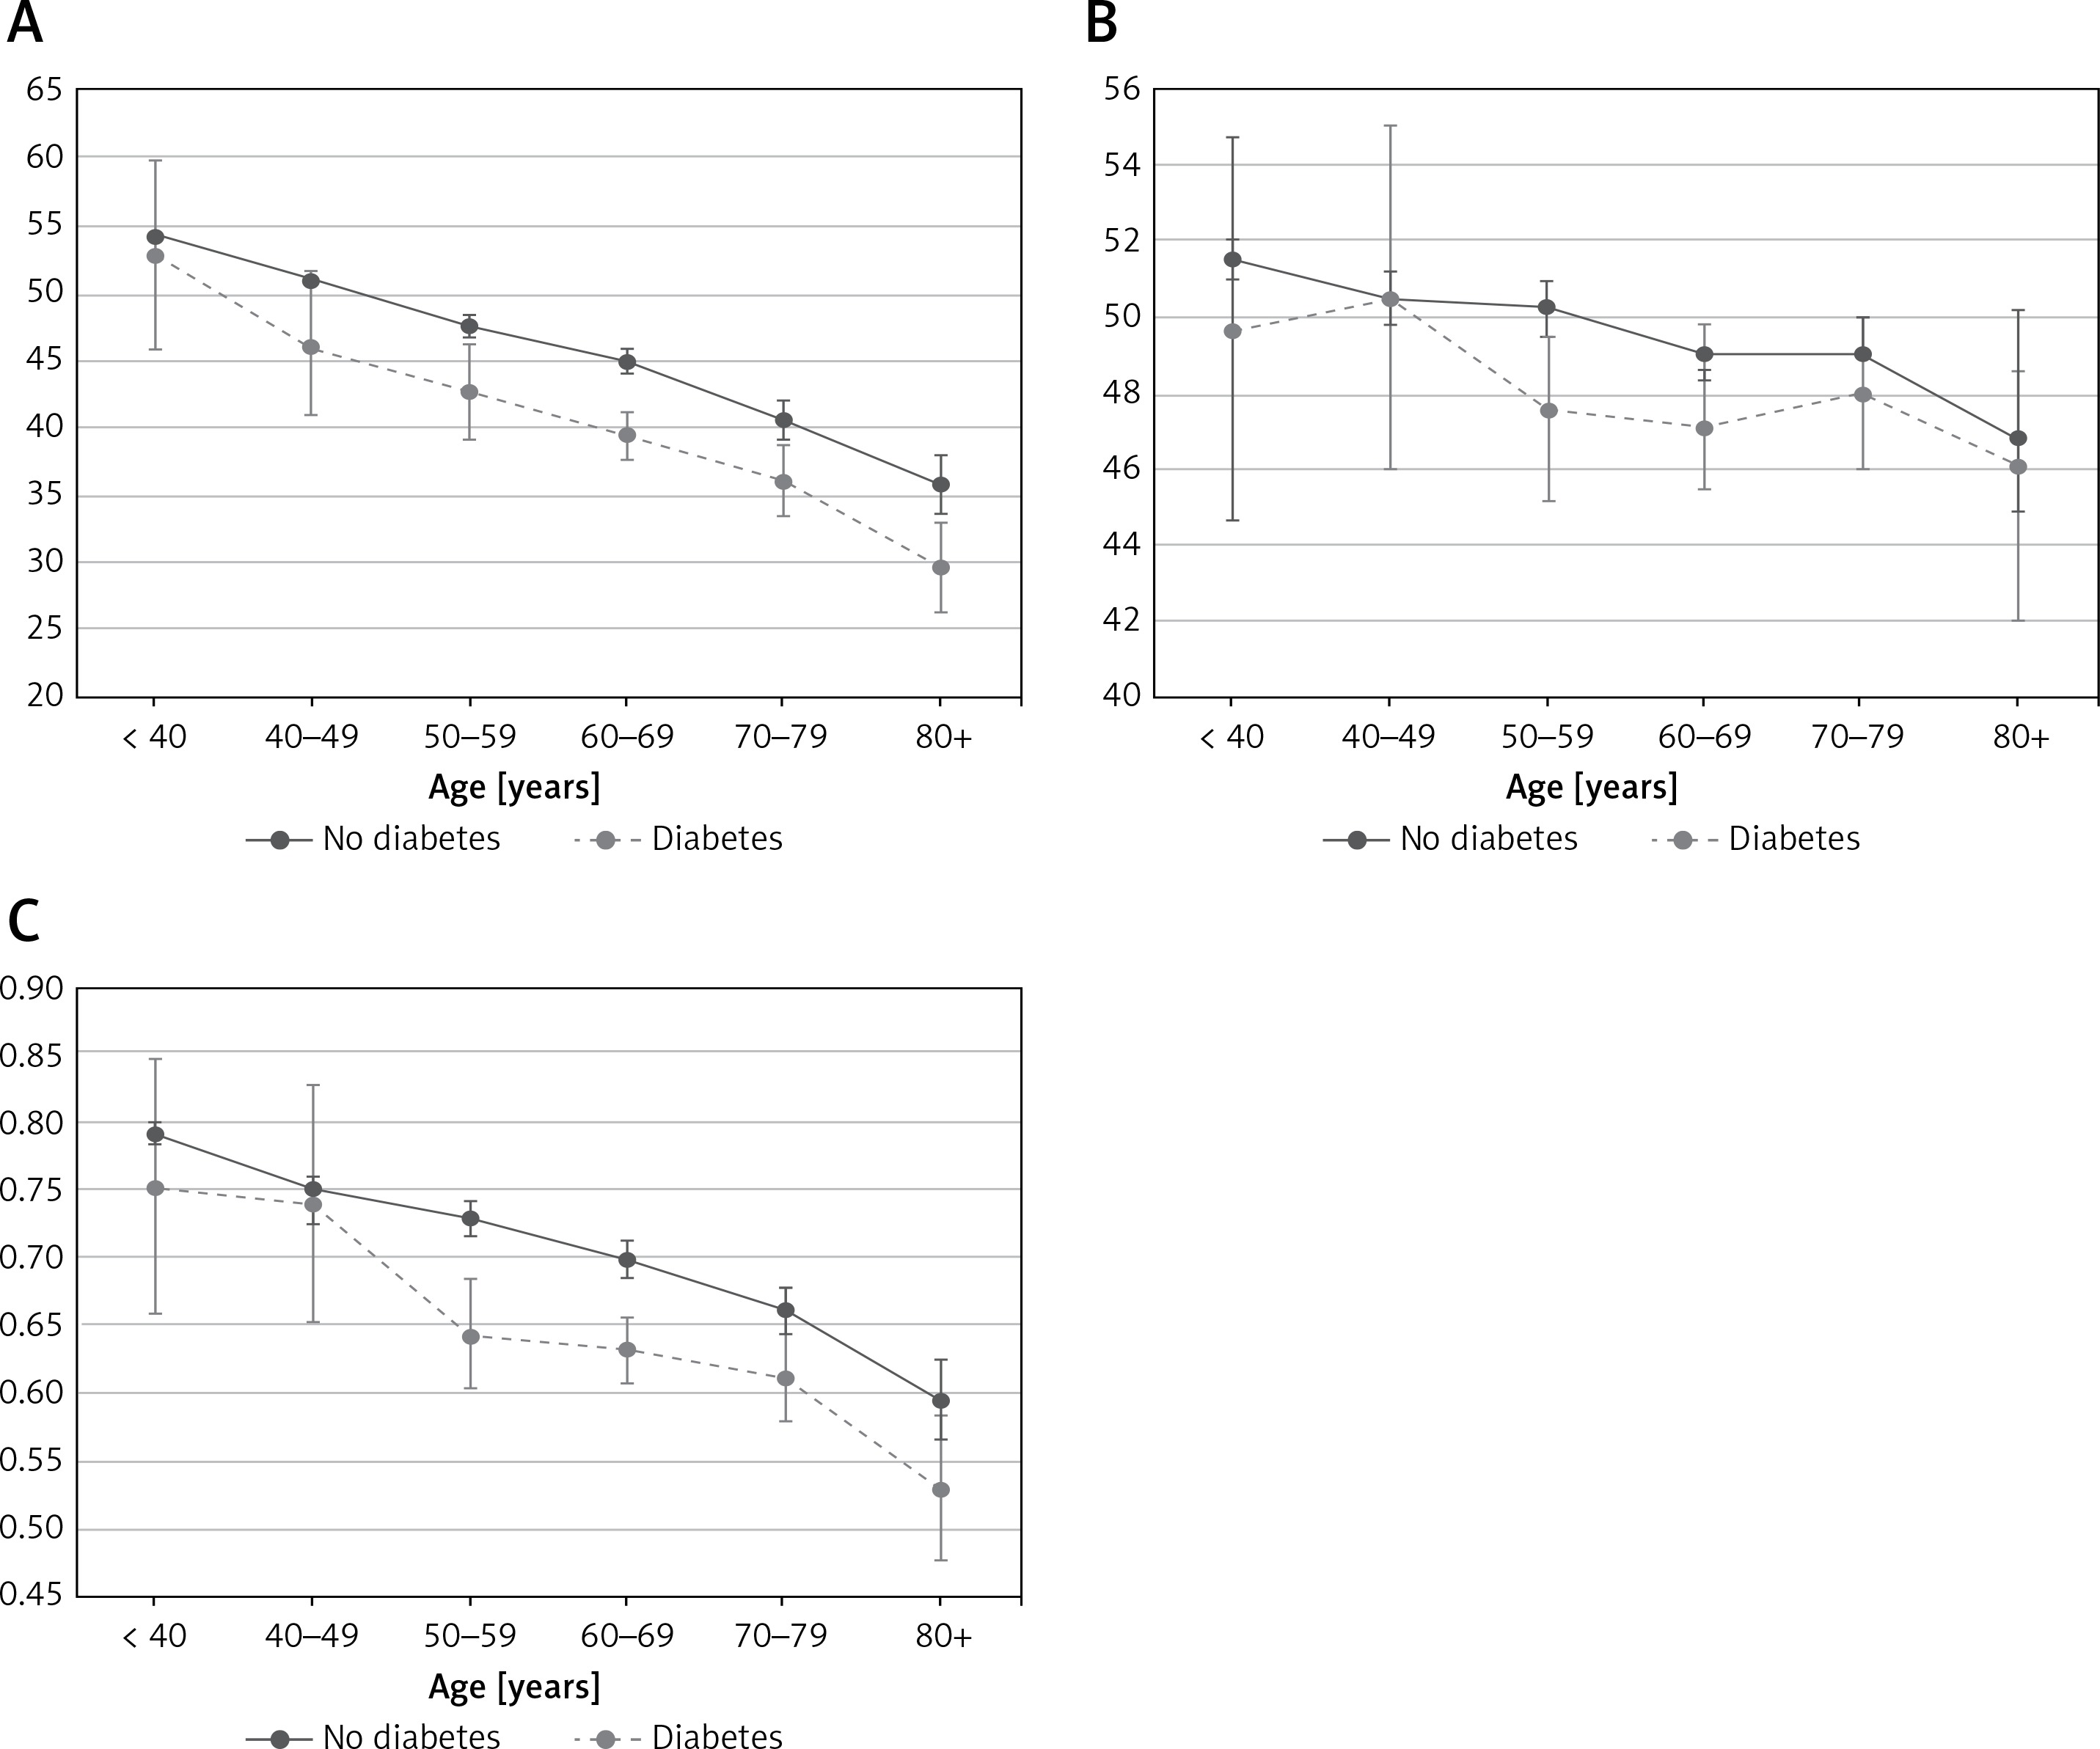
Figure 3
SF-12 summary indices PCS-12 (A), MCS-12 (B) and SF-6D (C) by age group (mean, 95% CI interval)
Mental functioning (MCS-12) of respondents with diabetes was found to be worse in females, selected age groups (60–69, 80+ years) and inhabitants of Eastern Poland. Unlike in the case of PCS-12, treatment with insulin increased MCS-12 scores. Similarly, treatment with oral anti-diabetic drugs did likewise.
The overall health index (SF-6D) of patients with diabetes was lower in women and respondents over 50 years old, whereas it was higher in inhabitants of South-West Poland and respondents with medium or higher levels of education.
Discussion
We present a consistent and comparative description of HRQoL as measured by the SF-12 questionnaire, in subjects with self-reported diabetes and respondents without diabetes in a nationally representative sample of Polish adults. Female sex, advanced age, low education levels and treatment with insulin were independently associated with the impaired physical health of people with diabetes. Mental health was higher in those treated with insulin or oral drugs, compared to patients receiving no medication.
The strength of our analysis comes from the method of study group selection – multi-stage, stratified random sampling, which resulted in a sample representative of the adult population of Poland with regard to multiple demographic characteristics, including presence of diabetes. The prevalence of self-reported diabetes observed in our study (8.5%) was not only similar to that cited by the International Diabetes Federation (8.8%) [17], but also in accordance with previous Polish epidemiological studies – NATPOL PLUS from 2002 (6.4%) [18], the NATPOL 2011 study (6.7%) [19] or the Polish-Norwegian Study (PONS; 8.4%) [20]. The structure of diabetes treatment strategies in our study was also similar to that noted in the general population in a neighbouring country, Germany, which further validates our results and confirms an appropriate sample selection [21]. Oral antidiabetic drugs, insulin-based regimens and no medication were used in 48.4%, 27.6% and 24.0% of respondents and 49.2%, 28.4% and 22.4% in Poland and Germany, respectively.
The other strength of our study resides in the use of a validated HRQoL measure. The family of Medical Outcomes Study Short-Form General Health Surveys (SF-36, SF-20, SF-12) is the most widely used generic measure of the quality of life in studies of diabetes [2]. The shortest version (SF-12) proved to give virtually identical summary scores (PCS, MCS) as SF-36 [21]. SF-12 was successfully used in population-based studies and cross-sectional studies of diabetes [22–28].
Our study has several limitations. According to the protocol, we based our analysis on records with complete SF-12 data. This resulted in the need to reject 48 (1.6%) entries having incomplete answers. Firstly, this percentage appears to be rather low. Some authors report missing SF-12 data at the level of about 30% [29]. Secondly, although methods of imputing missing scores exist, most of them may lead to bias, since they ignore the variation within an item and the difference from patient to patient.
Another limitation arises from the fact the respondents in our study self-reported the diagnosis of diabetes. We did not verify the diagnosis with fasting plasma glucose level, blood HbA1c level, or using data from medical records or National Health Fund registries. However, such an approach is widely used in epidemiological studies. Self-reported diabetes may be characterised by moderate sensitivity (55–80%), but the specificity is high (84–97%), positive predictive values are reasonably good, and it is reliable (> 92%) over time [30–32]. Next, we did not ask about the duration and type of diabetes, which could constitute useful explanatory variables.
Further limitations worth mentioning result from the fact that there is no Polish algorithm to estimate norm-based scores for SF-12. We used the calculation method based on the United States population’s data – recommended officially for countries without their country-specific scoring method. Second, there is also no Polish country-specific value set for SF-6D. To estimate this index, we used the tariff for the United Kingdom.
Our results concerning the influence of diabetes on HRQoL, measured according to SF-12 summary indices, are in concordance with other published studies. Analysis across age groups (Figure 3 A) showed that diabetes was associated with a mean decrease of physical functioning (PCS) by 4.6 points. This is close to half of the standard deviation, equals the 10-years mean decline of PCS in the general population of Poland and may be interpreted as a difference of moderate to large magnitude. Other studies showed similar, though slightly lower, reductions (by 3.5–4.1 points) [21, 33]. Furthermore, the mean decrease of mental functioning (MCS) in patients with diabetes in our study (Figure 3 B) was 1.4 points, which lies comfortably between the values noted by other authors (1.0–2.5) [21, 31]. In general, mental health is far less affected by diabetes than physical health.
In our study, the advancing age of diabetics was associated with worse physical functioning, poorer overall health status and, to some extent, inferior mental health. This is generally in line with previously published studies, although it is worth noting that some publications report improved mental health in older age groups [20]. Even closer agreement may be seen in the assessment of the impact of sex on the HRQoL of patients with diabetes. In the present study, women are characterised in all three SF-12 indices by having lower scores than men. The relationship between female sex and diminished HRQoL has been confirmed by numerous authors [2, 20, 21, 26, 34] and opposing studies are scarce [25]. Some population-based studies have shown that people with diabetes have a lower educational level and lower income than other patients [35, 36]. Furthermore, our findings indicate that a lower level of education negatively influences physical functioning and the overall health status of respondents with diabetes. The effect concerning the type of diabetes, duration of disease and treatment regimen is variable and uncertain [2]. Insulin use was reported to be significantly associated with poorer scores across all SF-12 measures [23]. In our study, patients on insulin therapy suffered worse physical health but were characterised by better mental health status. Other demographic factors influencing HRQoL in diabetes include obesity [22, 23], symptoms of depression [22], level of income [25] and, above all, the presence of medical complications [37–39].
We noted some geographical differences in the HRQoL of patients with diabetes. Mental functioning (MCS-12) of respondents with diabetes was worse in Eastern Poland inhabitants, and the SF-6D index was higher in inhabitants of South-West Poland. These differences are not straightforward to explain. Unfortunately, we were not able to find any Polish publication on this topic. Future studies on geographical differences of HRQoL in patients with diabetes in Poland should also use other instruments (e.g. EQ-5D) and consider differences in HRQoL of the general population.
In conclusion, this study provides information concerning the quality of life of patients with self-reported diabetes in Poland, in comparison to the general population and those without this disease. The presented HRQoL values for self-reported diabetes may serve as a reference in future studies. The identification of factors independently associated with worse health status within the group of respondents with diabetes may help healthcare providers to target intervention programmes more effectively.