Introduction
The rapid spread of coronavirus disease 2019 (COVID-19) since December 2019 has caused detrimental effects globally. More than 50 million people had been infected with COVID-19, causing more than 1.2 million deaths worldwide [1]. SARS-CoV-2 was identified as the culprit and utilizes the angiotensin-converting enzyme 2 (ACE2) receptor for host entry. The ACE2 receptor is widely expressed in the lungs, heart, vascular, and intestine. Hence, COVID-19 is not limited to lung disease but is a multi-organ disease. A post-mortem study of 32 patients revealed that COVID-19 caused thromboembolic injuries in the lung, heart, liver, kidney, and hematopoietic system [2].
Since ACE2 is closely related to the cardiovascular system, the impact of COVID-19 on this system is inevitable. Pre-existing cardiovascular disease comorbidity was associated with a higher case fatality rate and poor prognosis [3]. A previous study provided evidence that severe cardiac dysfunction, injury, and elevation of cardiac markers were found in COVID-19 cases [4]. On the other hand, one meta-analysis demonstrated that cardiac injury in COVID-19 is associated with a higher risk of severe disease (13.81-fold), ICU admission (7.94-fold), and mortality (7.95-fold), respectively [5]. Taken together, bidirectional interaction between COVID-19 and cardiac conditions that impair cardiac and lung functions was inevitable, especially the involvement of right ventricular dysfunction and pulmonary hypertension [6, 7].
The mechanisms behind this interaction are not yet established. Release of systemic cytokine, systemic inflammation, and a pro-thrombotic state may be responsible. Furthermore, hypoxic vasoconstriction of the pulmonary vasculature in COVID-19 patients could alter pulmonary hemodynamics, damaging lung tissue, which leads to pulmonary hypertension (PH) and right ventricular dysfunction (RVD) [8, 9]. One case series described 5 cases of acute cor-pulmonale in critically ill COVID-19 patients [10]. Acute respiratory distress syndrome (ARDS) has been frequently reported among critically ill COVID-19 patients, and elevated RV afterload could also lead to RV function impairment [11].
Preliminary pathological findings indicate alveolar septal thickening, lung edema, inflammatory infiltrates, and vascular congestion in the early stages of the disease. PH and secondary RVD may be determined by lung parenchymal disruption and altered pulmonary hemodynamics in patients with COVID-19, even in the non-advanced stage of the disease [7].
Interestingly, early echocardiographic studies regarding RVD and PH parameters in COVID-19 revealed their potential as novel risk-stratification markers in COVID-19 patients since they outperformed others risk factors [12, 13]. Despite their potential in COVID-19 risk stratification, to the best of our knowledge, no meta-analysis has evaluated clinical outcomes regarding RVD and PH in COVID-19.
Therefore, this study aims to analyze the prevalence of RVD and PH along with their association with COVID-19 clinical outcomes.
Material and methods
Study design and search strategy
This systematic review and meta-analysis were performed based on Preferred Reporting Items for Systematic Reviews and Meta-Analyses (PRISMA) guidelines. Initial title and abstract screening was performed in 5 online databases (PubMed, medRxiv, ProQuest, ScienceDirect, and Scopus) using “COVID-19”, “right ventricular dysfunction”, “cardiac function”, “pulmonary hypertension”, “echocardiography”, “severity”, “death”, “mechanical ventilation”, and their synonyms as searching keywords. The search period was in November 2020. We included all studies that reported adult COVID-19 patients with any data regarding right ventricular dysfunction or pulmonary hypertension and clinical outcome. All types of criteria and definitions of RVD and PH were included in this study. Additionally, any transthoracic echocardiographic parameters for RV function and PH were also included. Studies with incomplete data and not written in English were excluded.
Data extraction
Three authors independently screened the relevance of titles and abstracts after removing duplicates. Studies that met inclusion criteria were then assessed for the full article and further reviewed before data extraction. Subsequently, the authors extracted the data, consisting of authors, year of publication, study design, location, peer-reviewed publication status, sample size, male percentage, mean age, comorbidities, RVD and PH definitions, echocardiography profile, and severity criteria in each comparison group. All extracted data were collected in a dedicated Excel spreadsheet.
Outcome
The primary outcome in our meta-analysis was the association of RVD and PH with in-hospital mortality from COVID-19. The secondary outcome was disease severity, ICU admission, or the need for mechanical ventilation. We defined disease severity criteria based on the World Health Organization (WHO) and the National Health Commission of the People’s Republic of China [14]. If the study categorized severity into 3 or 4 groups, we combined the data between mild and moderate groups into one group as non-severe; and severe and critical groups into one group as severe. These outcomes were classified as RVD and non-RVD or PH and non-PH. Additionally, echocardiographic parameters were also compared and classified based on each outcome, namely survivors and non-survivors; severe and non-severe, admitted and not admitted to ICU; use and non-use of mechanical ventilation.
Quality assessment and publication bias
Two authors independently assessed study methodological quality using the Newcastle-Ottawa Scale (NOS) for non-randomized studies. Grading of Recommendations Assessment, Development, and Evaluation (GRADE) methodology was used to assess the quality of the body of retrieved evidence (GRADEpro Guideline Development Tool [Software]. McMaster University, 2020). Egger’s and Harbord’s regression test was used to assess publication bias for continuous and binary endpoints, respectively. In addition, funnel plots were used to determine the symmetrical distribution of the effect size outcomes.
Data analysis
All analyses were performed using RevMan version 5.4 and Stata v.16. We used the Mantel-Haenszel formula for dichotomous variables to calculate the pooled odds ratios (ORs). A random-effect model was performed if there was heterogeneity (I2 > 50%). Otherwise, the fixed-effects Mantel-Haenszel model was used. The cause of heterogeneity was assessed using sensitivity analysis with the leave-one-out method. We also performed a meta-analysis using the mean difference (MD) for echocardiographic parameters of RV function and PH. Mean and standard deviation were extrapolated from sample size, median, and interquartile range (IQR), according to Wan et al. [15] The average of mean and standard deviation between two groups was calculated using the formula in Table 7.7.a of the Cochrane Handbook [16]. Restricted maximum likelihood random-effects meta-regression was performed for age, sex, cardiovascular disease (CVD), hypertension (HTN), diabetes mellitus (DM), chronic kidney disease (CKD), chronic obstructive pulmonary disease (COPD), venous thromboembolism (VTE), and smoking. Statistical significance was defined by a p-value less than 0.05, except for heterogeneity (p < 0.10).
Results
Baseline characteristics and study selection
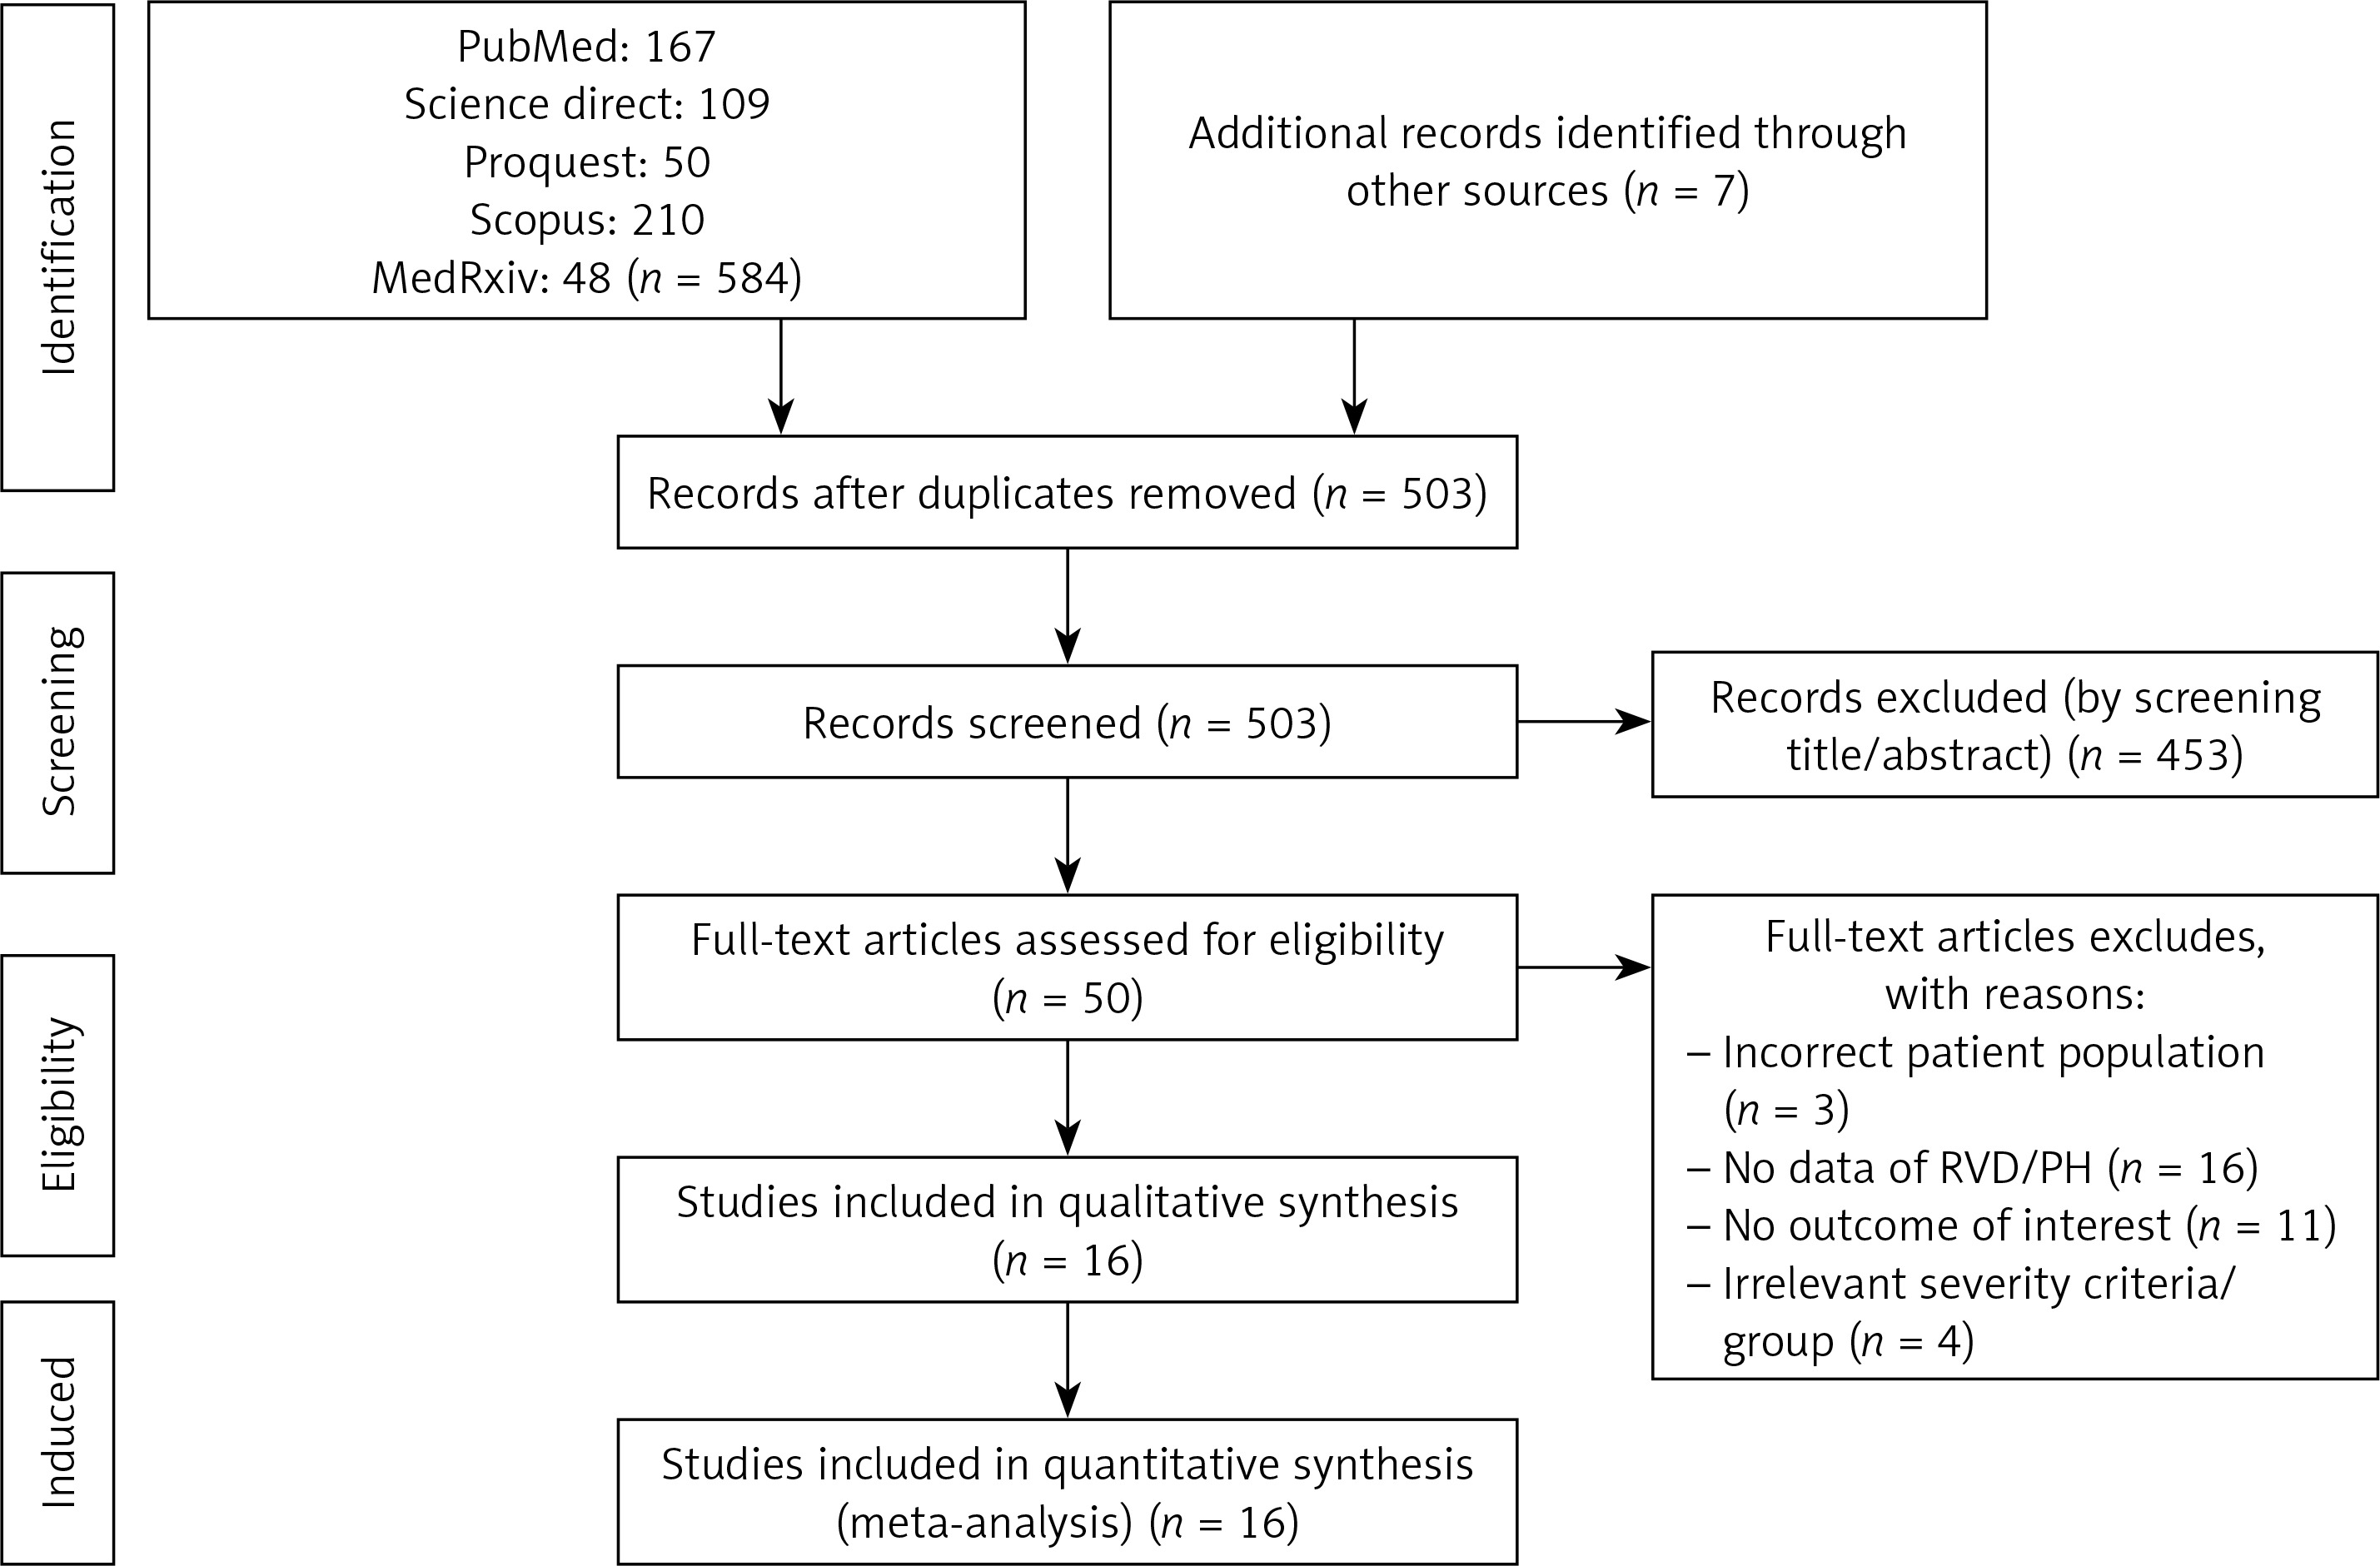
We found 584 records from the PubMed, Science Direct, ProQuest, Scopus, and medRxiv databases, as shown in Figure 1. Seven additional records were acquired from other sources, and 503 records remained after duplicate removal. A sum of 453 records was removed after title and abstracts screening. Fifty full texts were then assessed for eligibility, and 34 articles were excluded because of an incorrect patient population (n = 3); no data of RVD/PH (n = 13); no outcome of interest (n = 11); and irrelevant severity criteria/ group (n = 4). As a result, we included 16 eligible studies (1,728 patients) for analysis.
Baseline characteristics of the included studies are presented in Table I [17–28] and Supplementary Table SI. Echocardiographic parameters of included studies are described in Supplementary Table SII. Eleven studies were retrospective, and five studies were prospective observational. One study was published in the preprint server [17]. Most studies were conducted in China. Tricuspid annular plane systolic excursion (TAPSE) and pulmonary artery systolic pressure (PASP) were used to define RVD and PH, respectively, in most of the included studies.
Table I
Baseline characteristics of included studies
| No. | Author | Study design | Town, country | Period | Total samples (n) | Male (%) | Age [years] | HTN (%) | CVD (%) | DM (%) | CKD (%) | COPD (%) | Smoking (%) |
|---|---|---|---|---|---|---|---|---|---|---|---|---|---|
| 1 | Rivinius R, 2020 [18] | Prospective observational | Germany | n/a | 21 (8 vs. 13)) | 81 (n/a) | 58.6 ±12.3 (n/a) | 71.4 (n/a) | n/a | 33.3 (n/a) | 28.6 (n/a) | 19.0 (n/a) | n/a |
| 2 | Rath D, 2020 [19] | Prospective observational | Germany | Feb–Mar, 2020 | 123 (16 vs. 107) | 62.6 (75.0 vs. 60.7) | 68 ±15 (73 ±16 vs. 67 ±15) | 69.9 (75 vs. 69.2) | CAD: 22.8 (37.5 vs. 20.6); AFib: 22.8 (25 vs. 22.4) | 24.4 (31.3 vs. 23.4) | 11.4 (12.5 vs. 11.2) | n/a | 0.8 (0.0 vs. 0.9) |
| 3 | Pagnesi M, 2020 [7] | Retrospective observational | Milan, Italy | Mar 24– Apr 29, 2020 | 200 (Mor: 19 vs. 181; ICU: 7 vs. 193; MV: 7 vs. 193; comp 25 vs. 175) | 65.5 (n/a) | 63.67 ±14.19 (n/a) | 42.0 (n/a) | MI: 8.5 (n/a); HF: 3.5 (n/a) | 18.5 (n/a) | 7.5 (n/a) | 5.5 (n/a) | 20.5 (n/a) |
| 4 | Mahmoud-Elsayed HM, 2020 [20] | Retrospective observational | UK | Mar 22– Apr 17, 2020 | 74 (Mor 28 vs. 46; MV 61 vs. 13) | 78 (n/a) | 59 ±13 (n/a) | 42.0 (n/a) | 9 (n/a) | 36 (n/a) | 11 (n/a) | 14 (n/a) | 7 (n/a) |
| 5 | Li Y, 2020 [11] | Prospective observational | Tongji, China | Feb 12– Mar 15, 2020 | 150 (18 vs. 132) | 48 (n/a) | 61 ±14 (n/a) | 40 (n/a) | 9.2 (n/a) | 11.7 (n/a) | 14.2 (n/a) | 5.0 (n/a) | 5.0 (n/a) |
| 6 | Moody WE, 2020 [12] | Retrospective observational | UK | Mar 16– May 9, 2020 | 164 (66 vs. 98) | 78 (n/a) | 61 ±13 (n/a) | 41 (n/a) | 13 (n/a) | 32 (n/a) | 12 (n/a) | 12 (n/a) | 13 (n/a) |
| 7 | Krishnamoorthy P, 2020 [21] | Retrospective observational | New York, USA | n/a | 12 (5 vs. 7) | 41.7 (60 vs. 28.6) | 48.67 ±25.99 (59.67 ±6.03 vs. 45.67 ±29.39) | 58.3 (60 vs. 57.1) | 16.7 (40 vs. 0) | 33.3 (40 vs. 28.6) | 16.7 (0 vs. 28.6) | 8.3 (0 vs. 14.3) | n/a |
| 8 | Kim M, 2020 [22] | Prospective-retrospective observational | South Korea | Feb–Apr 2020 | 40 (13 vs. 27) | 50 (53.8 vs. 48.1) | 57.55 ±15.88 (67.67 ±8.31 vs. 52.67 ±16.44) | 37.5 (61.5 vs. 25.9) | 0 vs. 0 | 17.5 (30.8 vs. 11.1) | 2.5 (0 vs. 3.7) | 2.5 (0 vs. 3.7) | n/a |
| 9 | Zeng JH, 2020 [23] | Retrospective observational | Shen zhen, China | Jan 11, 2020– Apr 1, 2020 | 416 (35 vs. 381); sample with ECHO: 57 (31 vs. 26) | 47.6 (65.71 vs. 45.93) | 46.58 ±17.97 (63.83 ±6.57 vs. 45 ±17.86) | 14.42 (37.14 vs. 12.34) | CAD: 3.13 (5.71 vs. 2.89); Arrhythmia: 0.96 (5.71 vs. 0.52); VHD: 0.48 (2.86 vs. 0.26) | 5.53 (28.57 vs. 3.41) | 0.48 (0 vs. 0.52) | 1.2 (2.86 vs. 1.05) | n/a |
| 10 | Ge H, 2020 [17] | Prospective observational | Shang Hai, China | Jan 21, 2020–Apr 8 2020 | 51 (12 vs. 39) | 72.55 (71.8 vs. 75) | 69 ±16.02 (71.08 ±19.08 vs. 67.67 ±15.39) | 43.1 (50 vs. 41) | 64.7 (50 vs. 69.2) | 13.4 (16.7 vs. 35.9) | 23.5 (8.3 vs. 28.2) | 13.7 (16.7 vs. 12.8) | 13.7 (8.3 vs. 15.4) |
| 11 | Giustino G, 2020 [24] | Retrospective observational | New York, USA | Mar–May 2020 | 305 (190 vs. 115), sample with echo/myocardial injury: 190 (50 vs. 140) | 67.2 (69.5 vs. 63.5) | 63 ±14.9 (65.33 ±13.45 vs. 58.33 ±17.27) | 59.3 (68.4 vs. 44.4) | MI: 7.4 (8.6 vs. 5.4); HF: 7.9 (10 vs. 4.4); Afib: 10.2 (11.6 vs. 7.9) | 37.4 (42.1 vs. 29.6) | 19.3 (25.8 vs. 8.7) | 5.9 (5.3 vs. 7) | n/a |
| 12 | Stöbe S, 2020 [25] | Retrospective observational | Germany | Apr 2020 | 18 (14 vs. 4) | 78 (79 vs. 25) | 64 ±19.1 (71 ±15.2 vs. 41 ±11.8) | 72 (86 vs. 25) | CAD: 11 (14 vs. 0); Afib: 22 (29 vs. 0); VHD: 0 | 28 (29 vs. 25) | 39 (50 vs. 0) | 5 (7 vs. 0) | 10.1 (21.8 vs. 7.9) |
| 13 | Barman HA, 2020 [26] | Retrospective observational | Istanbul, Turkey | Mar 25– Apr 15 2020 | 90 (44 vs. 46) | 51.1 (54 vs. 47) | 56.35 ±19.91 (63.3 ±15.7 vs. 49.7 ±21.4) | 35.6 (52 vs. 19) | n/a | 15.6 (22 vs. 8) | n/a | n/a | 56.7 (59 vs. 55) |
| 14 | Kim J, 2020 [13] | Retrospective observational | New York, USA | Mar 12, 2020, and May 17, 2020 | 268 (41 vs. 227) | 66 (73 vs. 60) | 66 ±14.13 (66 ±15 vs. 65 ± 14) | 63 (71 vs. 64) | 20 (22 vs. 20) | 41 (39 vs. 39) | n/a | 6 (5 vs. 8) | 24 (24 vs. 22) |
| 15 | Deng Q, 2020 [27] | Retrospective observational | Wuhan, China | Jan 6–Feb 20 2020 | 112 (67 vs. 45) | Sev: 50.9 (56.7 vs. 42.2), Comp (61.3 vs. 46.9) | 61.6 ±16.37 (67.33 ±15.15 vs. 54 ±21.44) | Sev: 32.1 (35.8 vs. 26.7); Comp: 38.7 vs. 29.6 | Sev CHD: 13.4 (16.4 vs. 8.9); AFib: 3.6 (3 vs. 4.4); Comp: CHD (19.4 vs. 11.1), AF (3.2 vs. 3.7) | Sev: 17 (20.9 vs. 11.1); Comp: (22.6 vs. 14.8) | n/a | n/a | n/a |
| 16 | Liu Y, 2020 [28] | Retrospective observational | Peking, China | Jan 26– Apr 15 2020 | 43 (22 vs. 21) | 51.2 (68.2 vs. 33.3) | 64.5 ±10 (64.9 ±10.4 vs. 64.1 ±9.8) | 44.2 (40.9 vs. 47.6) | CAD: 11.63 (18.2 vs. 4.8); HF: 7 (9.1 vs. 4.8) | 27.9 (22.7 vs. 33.3) | n/a | n/a | 37.2 (40.9 vs. 33.3) |
[i] Data were presented as poor vs.. good outcome. AFib – atrial fibrillation, CAD – coronary artery disease, CHD – congenital heart disease, Comp – composite, HF – heart failure, ICU – intensive care unit, MI – myocardial infarction, Mor – mortality, MV – mechanical ventilation, n/a – not available, Sev – severity, VHD – valvular heart disease.
Quality assessment and publication bias
Quality of the total included studies showed good and fair methodology based on NOS assessment (Supplementary Table SI). However, most studies did not assess exposure before outcome measures and might not have adequate time-frames for outcome due to their cross-sectional design.
Grading of Recommendations Assessment, Development, and Evaluation (GRADE) showed a very low certainty of evidence for the effect of RVD on mortality and MV usage; and low certainty of evidence on severity and ICU admission, while the effect of PH on mortality demonstrated high certainty of evidence and moderate certainty on severity, ICU admission, and MV usage, respectively (Supplementary Table SIII).
Funnel plots of RVD and outcome of mortality, severity, and MV showed a qualitatively asymmetrical appearance indicating publication bias, but not for ICU outcome (Supplementary Figure S1). Funnel plots of PH and outcome of severity and ICU admission also showed a qualitatively asymmetrical appearance indicating publication bias, but not for mortality outcome (Supplementary Figure S2). Regression-based Harbord’s or Egger’s test was not conducted due to the small number of included studies (< 10 studies) in each outcome.
Right ventricular dysfunction in COVID-19
RVD and RV function echocardiography parameter data were reported in 16 studies. Most studies defined RVD by TAPSE < 16–17 mm. The studies by Rath et al. (2020) [19], Li et al. (2020) [11], and Krishnamoorthy et al. (2020) [21] define RVD by TAPSE < 20 mm, RV free wall longitudinal strain (RVFWS) ≤ 20.5%, and RV global longitudinal strain (RVGLS) – RVFWS criteria in the American Society of Echocardiography (ASE) guideline, respectively. Two studies specifically enrolled COVID-19 patients with heart transplant [18] and myocardial injury [24].
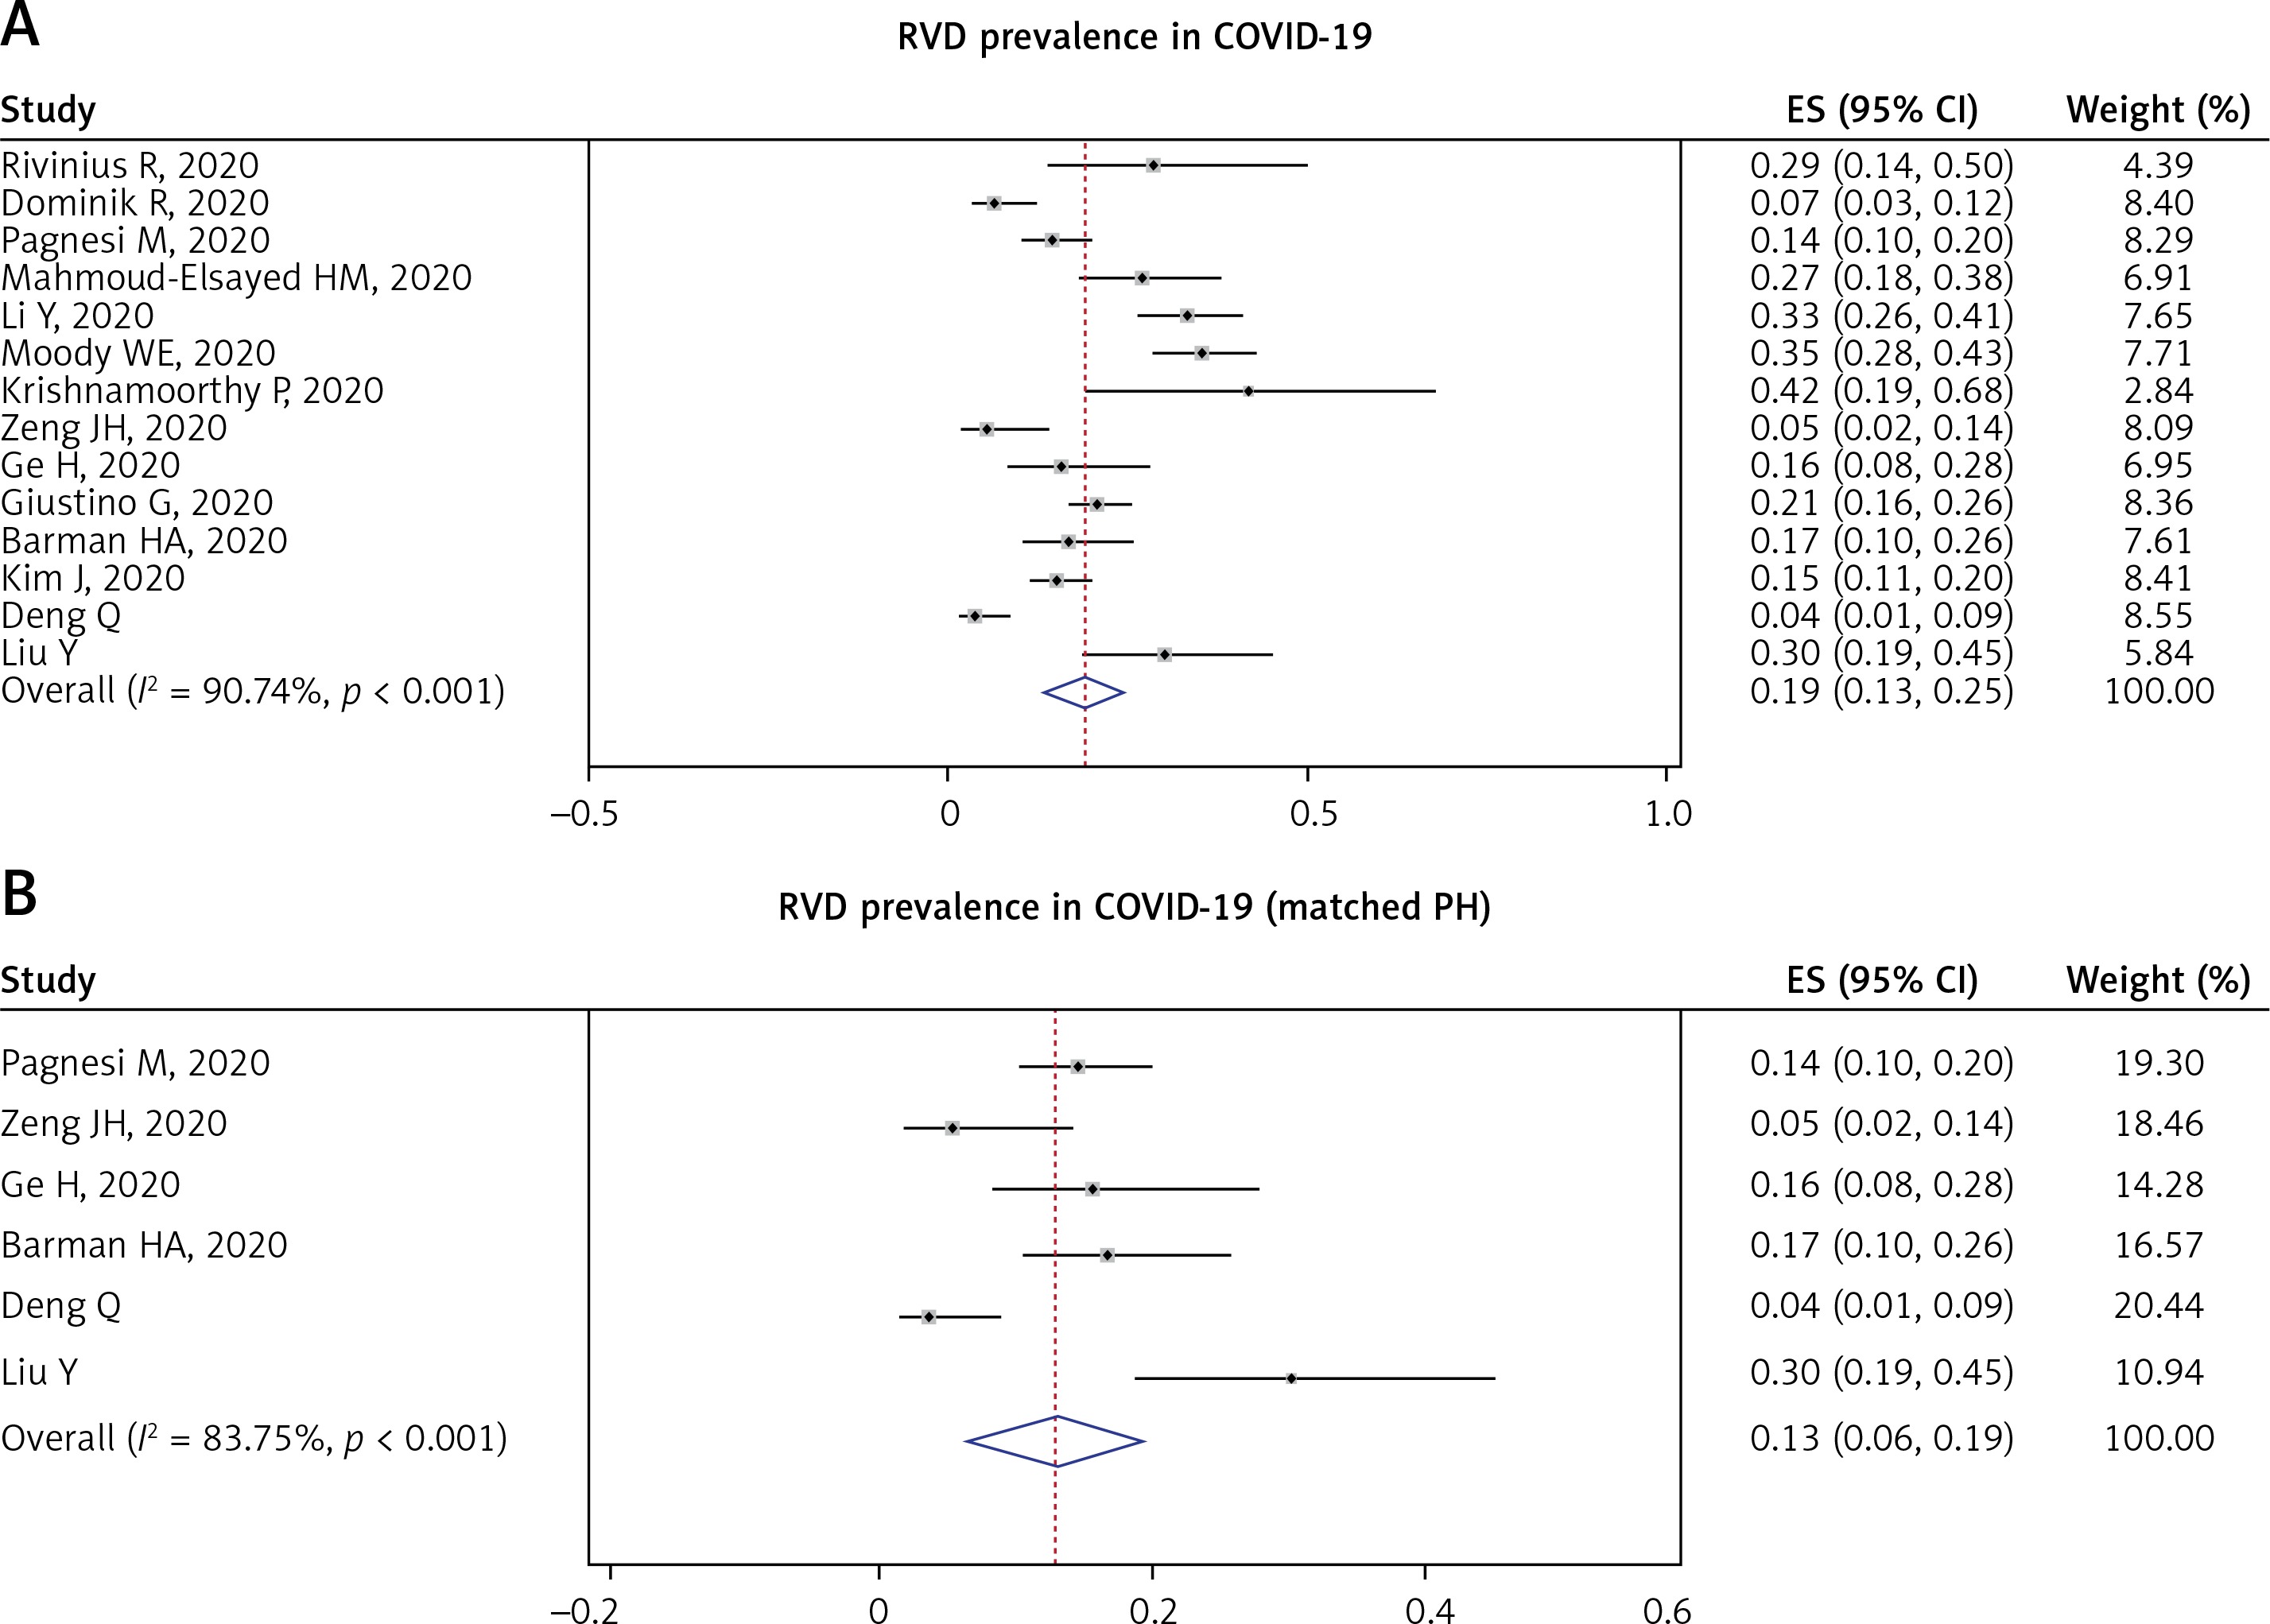
Pooled prevalence of RVD from 14 studies was 19% (95% CI: 13–25%; I2 = 90.74%, p < 0.001) (Figure 2 A). However, analysis for PH-matched studies (6 studies) showed that prevalence of RVD was 13% (95% CI: 6–19%; I2 = 83.75%, p < 0.001) (Figure 2 B).
Figure 2
RVD prevalence in COVID-19 patients: total included studies (A) and PH-matched studies (B)
PH – pulmonary hypertension, RVD – right ventricular dysfunction.
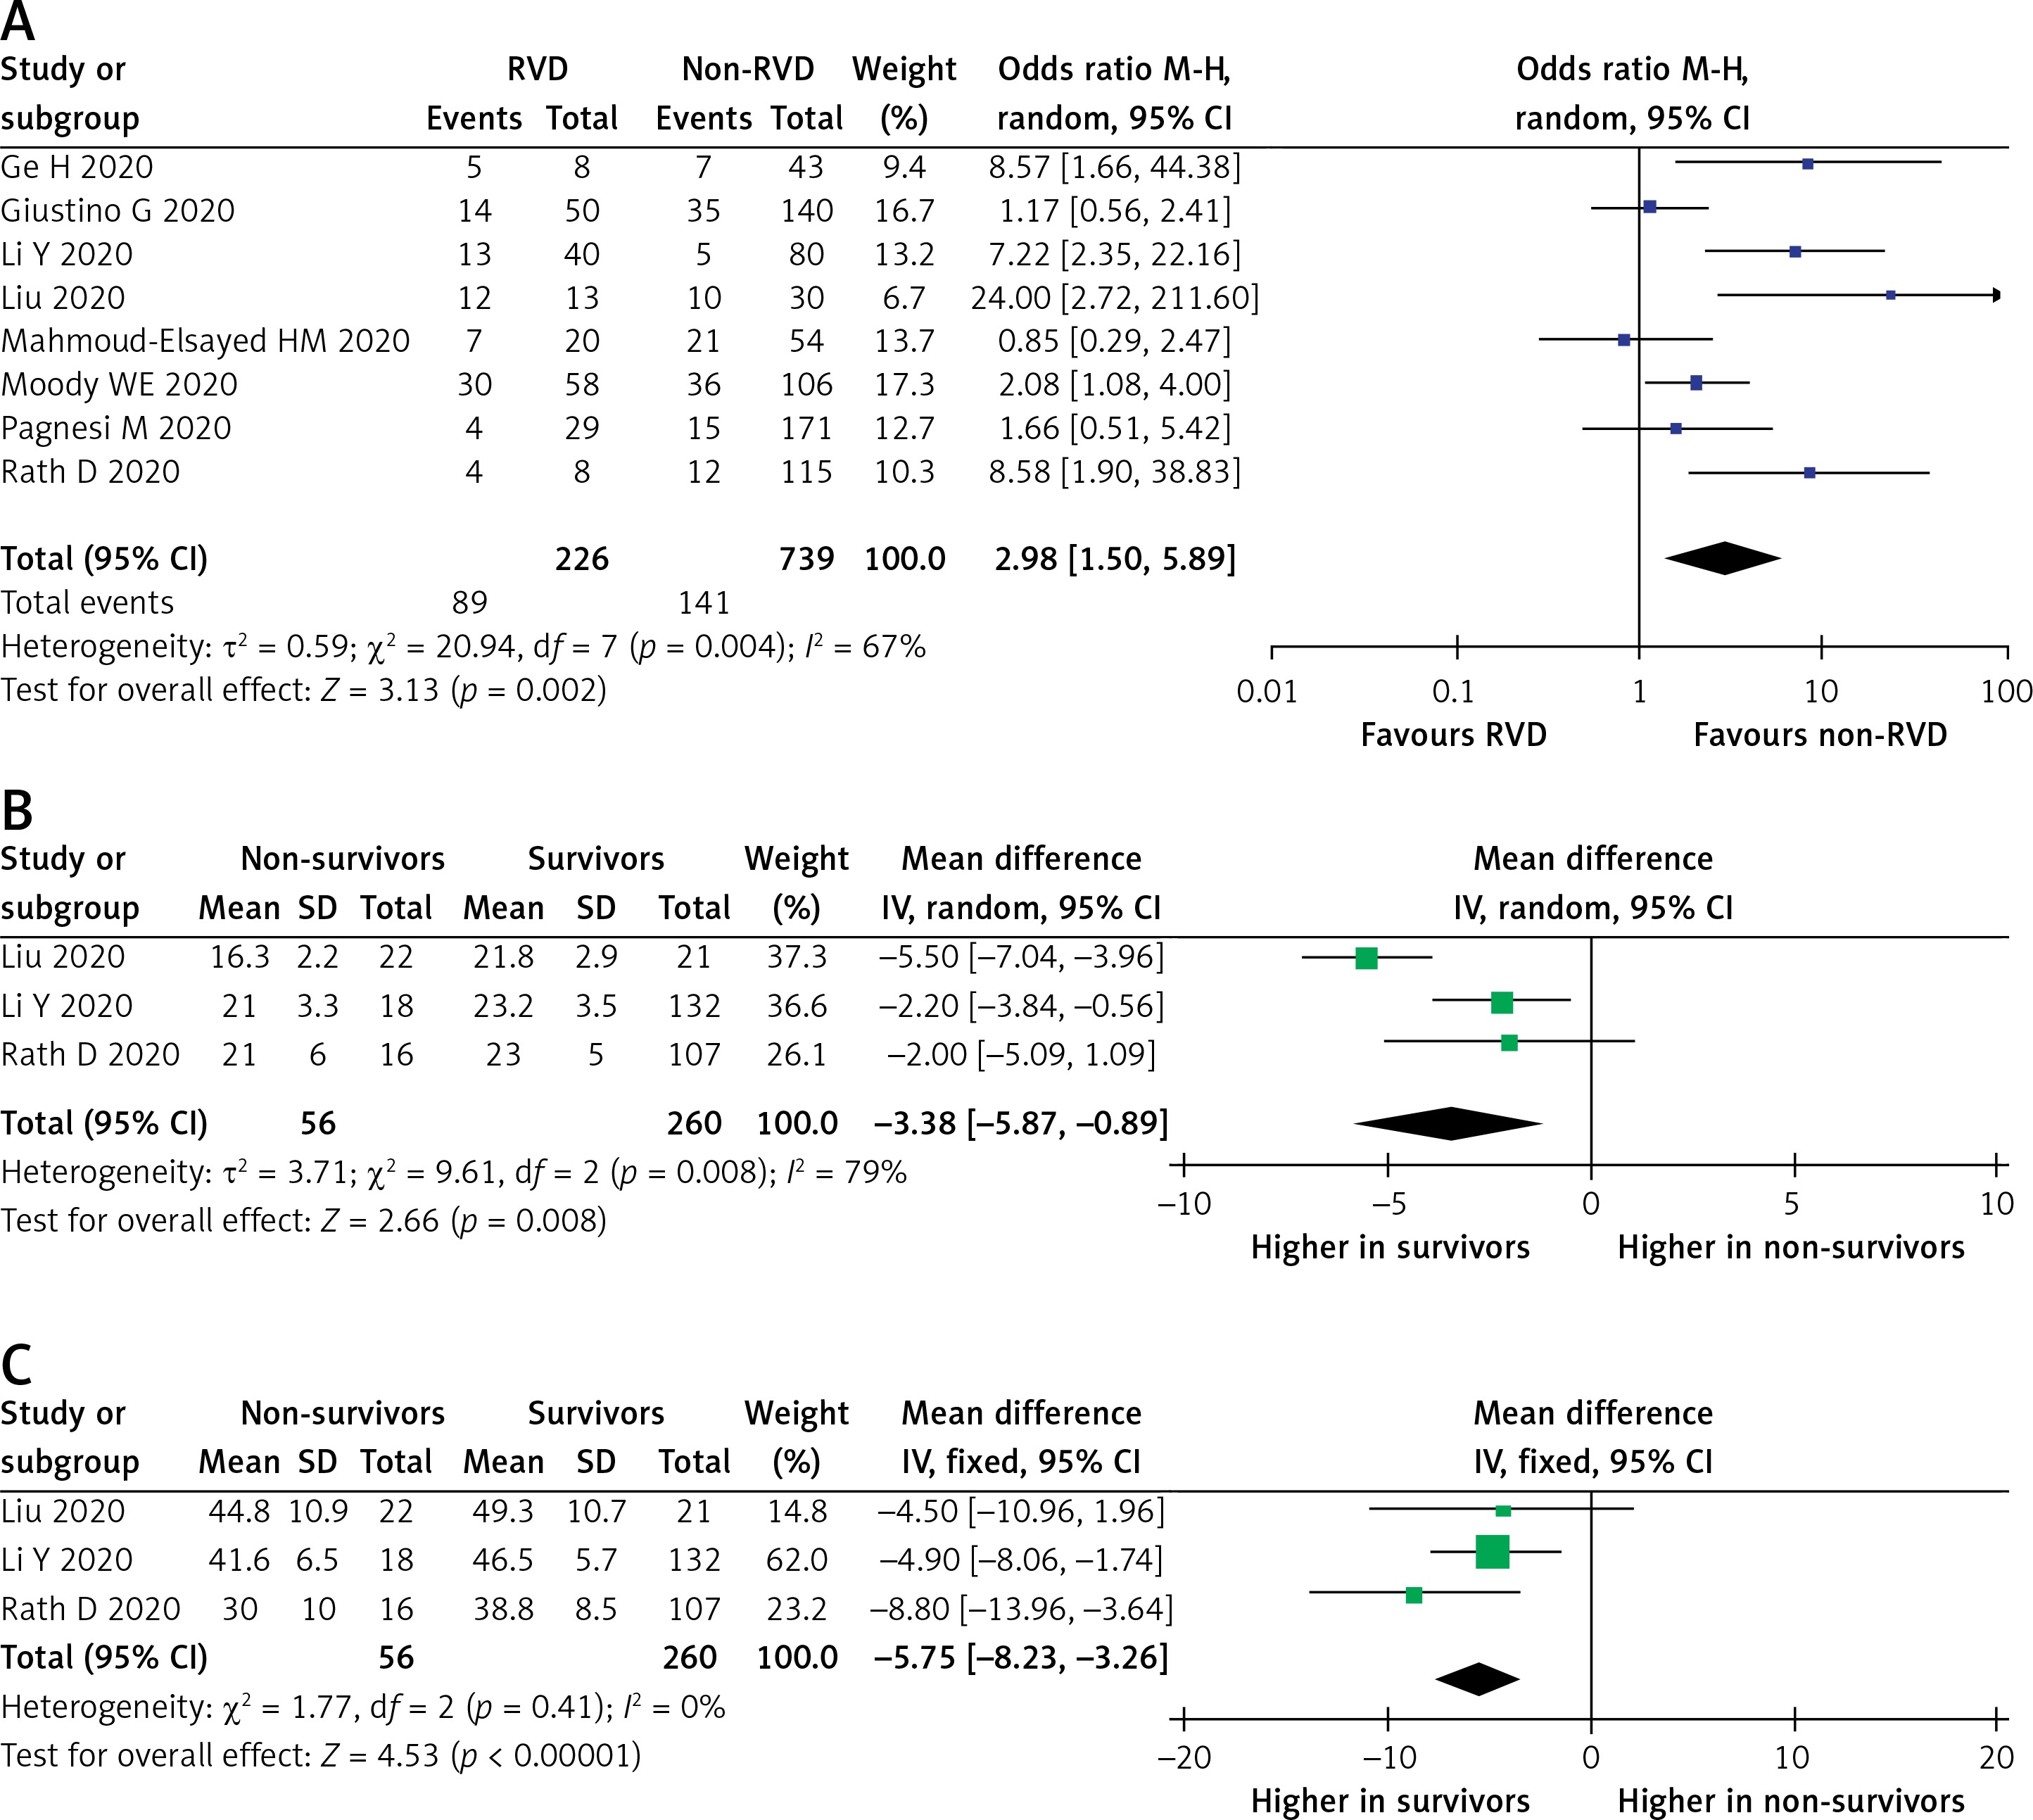
Mortality outcome was analyzed from 8 studies and 965 participants. Pooled analysis with random effects showed that the RVD group had a higher mortality rate compared to the non-RVD group (OR = 2.98 (95% CI: 1.50–5.89), p = 0.002; I2 = 67%, p = 0.004) (Figure 3 A). A sensitivity analysis by removing the study by Li et al. (2020) [11] or Liu et al. (2020) [28] exhibited a consistent result with lower heterogeneity (OR = 2.55 (95% CI: 1.27–5.13), p = 0.009; I2 = 63%, p = 0.01; and (OR = 2.51 (95% CI: 1.31–4.81), p = 0.005; I2 = 63%, p = 0.01, respectively). Subsequently, when a pre-printed study was removed by sensitivity analysis, the overall outcomes still showed a significant result with lower OR (OR = 2.65 (95% CI: 1.31–5.36), p = 0.007; I2 = 67%, p = 0.006).
Figure 3
A – Mortality rate in COVID-19 patients with RVD. Comparison of RV function echocardiographic parameters: TAPSE (B) and RVFAC (C) in survivors vs. non-survivors
RV – right ventricle, RVD – RV dysfunction, RVFAC – RV fractional area change, TAPSE – tricuspid annular plane systolic excursion.
Random-effects meta-regression analysis demonstrated that the association between RVD and increased mortality was not significantly affected by age (p = 0.065), HTN (p = 0.865), CVD (p = 0.206), CKD (p = 0.552), COPD (p = 0.839) comorbidities, and smoking (p = 0.561), but was significantly affected by male sex (p = 0.036), VTE (p = 0.044), and DM (p = 0.001) (Supplementary Figure S3).
RV function echocardiographic parameters, TAPSE and RV fractional area change (RVFAC), were evaluated in 3 studies. TAPSE were significantly lower in the non-survivor group using random-effects analysis (MD = –3.38 (95% CI: –5.87 to –0.89) p = 0.008; I2 = 79%, p = 0.008) (Figure 3 B). Removing the study by Liu et al. [28] gave the same result with reduced heterogeneity (MD = –2.16 (95% CI: –3.60 to –0.71) p = 0.003; I2 = 0%, p = 0.91). Similarly, RVFAC were lower in the non-survivor group with low heterogeneity (MD = –5.75% (95% CI: –8.23 to –3.26) p = 0.001; I2 = 0%, p = 0.41) (Figure 3 C).
Pooled analysis of 4 studies showed that a more severe clinical presentation was observed in the RVD group using fixed-effect analysis (OR = 3.61 (95% CI: 2.05–6.35), p < 0.001; I2 = 0%, p = 0.53) (Supplementary Figure S4 A). Random-effects meta-regression analysis demonstrated that the association between RVD and increased severity was not significantly affected by male sex (p = 0.595), age (p = 0.699), HTN (p = 0.741), CVD (p = 0.179), and DM (p = 0.925) comorbidities.
Additionally, various echocardiographic parameters were analyzed. Evaluation of TAPSE was performed in 3 studies with a total of 220 patients and values were significantly lower in a severe condition (MD = –1.30 (95% CI: –2.03 to –0.57), p = 0.0005; I2 = 0%, p = 0.68) (Supplementary Figure 4 B). RVGLS was evaluated in 2 studies and was significantly higher in severe disease (MD = 3.33 (95% CI: 0.85–5.82), p = 0.009; I2 = 0%, p = 0.39) (Supplementary Figure S4 C). Both RVFAC and RV S’ were not statistically different in both groups (MD = –1.48% (95% CI: –4.33% to 1.36%), p = 0.31; I2 = 0%, p = 0.82; and MD = –0.51 (95% CI: –1.16 to 0.14), p = 0.12; I2 = 0%, p = 0.73, respectively) (Supplementary Figures S4 D, E).
ICU admission was analyzed from a total of 311 patients from 5 studies. Overall, COVID-19 patients with RVD had higher ICU admission (OR = 1.70 (95% CI: 1.12–2.56), p = 0.01; I2 = 0%, p = 0.69) (Supplementary Figure S5). However, removing the study by Giustino et al. [24] demonstrated no difference between groups (OR = 1.49 (95% CI: 0.88–2.535), p = 0.14; I2 = 0%, p = 0.65). Analysis of echocardiographic parameters was not performed due to limited study data.
Random-effects meta-regression analysis demonstrated that the association between RVD and ICU admission was not significantly affected by male sex (p = 0.631), age (p = 0.196), HTN (p = 0.455), CVD (p = 0.970), DM (p = 0.567), CKD (p = 0.938), COPD (p = 0.346), or smoking (p = 0.450).
Seven studies evaluated RVD and MV use. Pooled analysis using a random-effects model revealed higher mechanical ventilation use in RVD groups (OR = 1.60 (95% CI: 1.14–2.25), p = 0.007; I2 = 51%, p = 0.06) (Supplementary Figure S6). However, after excluding the study by Li et al. [11], there was no difference between groups (OR = 1.40 (95% CI: 0.97–2.01), p = 0.07; I2 = 34%, p = 0.18), indicating a lack of statistical robustness. Moreover, removing participants with heart transplant [18] and current myocardial injury [24] also showed no difference (OR = 1.33 (95% CI: 0.89–2.00), p = 0.17; I2 = 42%, p = 0.14). Analysis of echocardiographic parameters was not performed due to limited study data.
Random-effects meta-regression analysis demonstrated that the association between RVD and need for MV was not significantly affected by male sex (p = 0.089), age (p = 0.422), HTN (p = 0.519), CVD (p = 0.077), DM (p = 0.114), COPD (p = 0.913), or smoking (p = 0.303), but was affected by CKD (p = 0.048) and VTE (p = 0.011) comorbidities.
Pulmonary hypertension in COVID-19
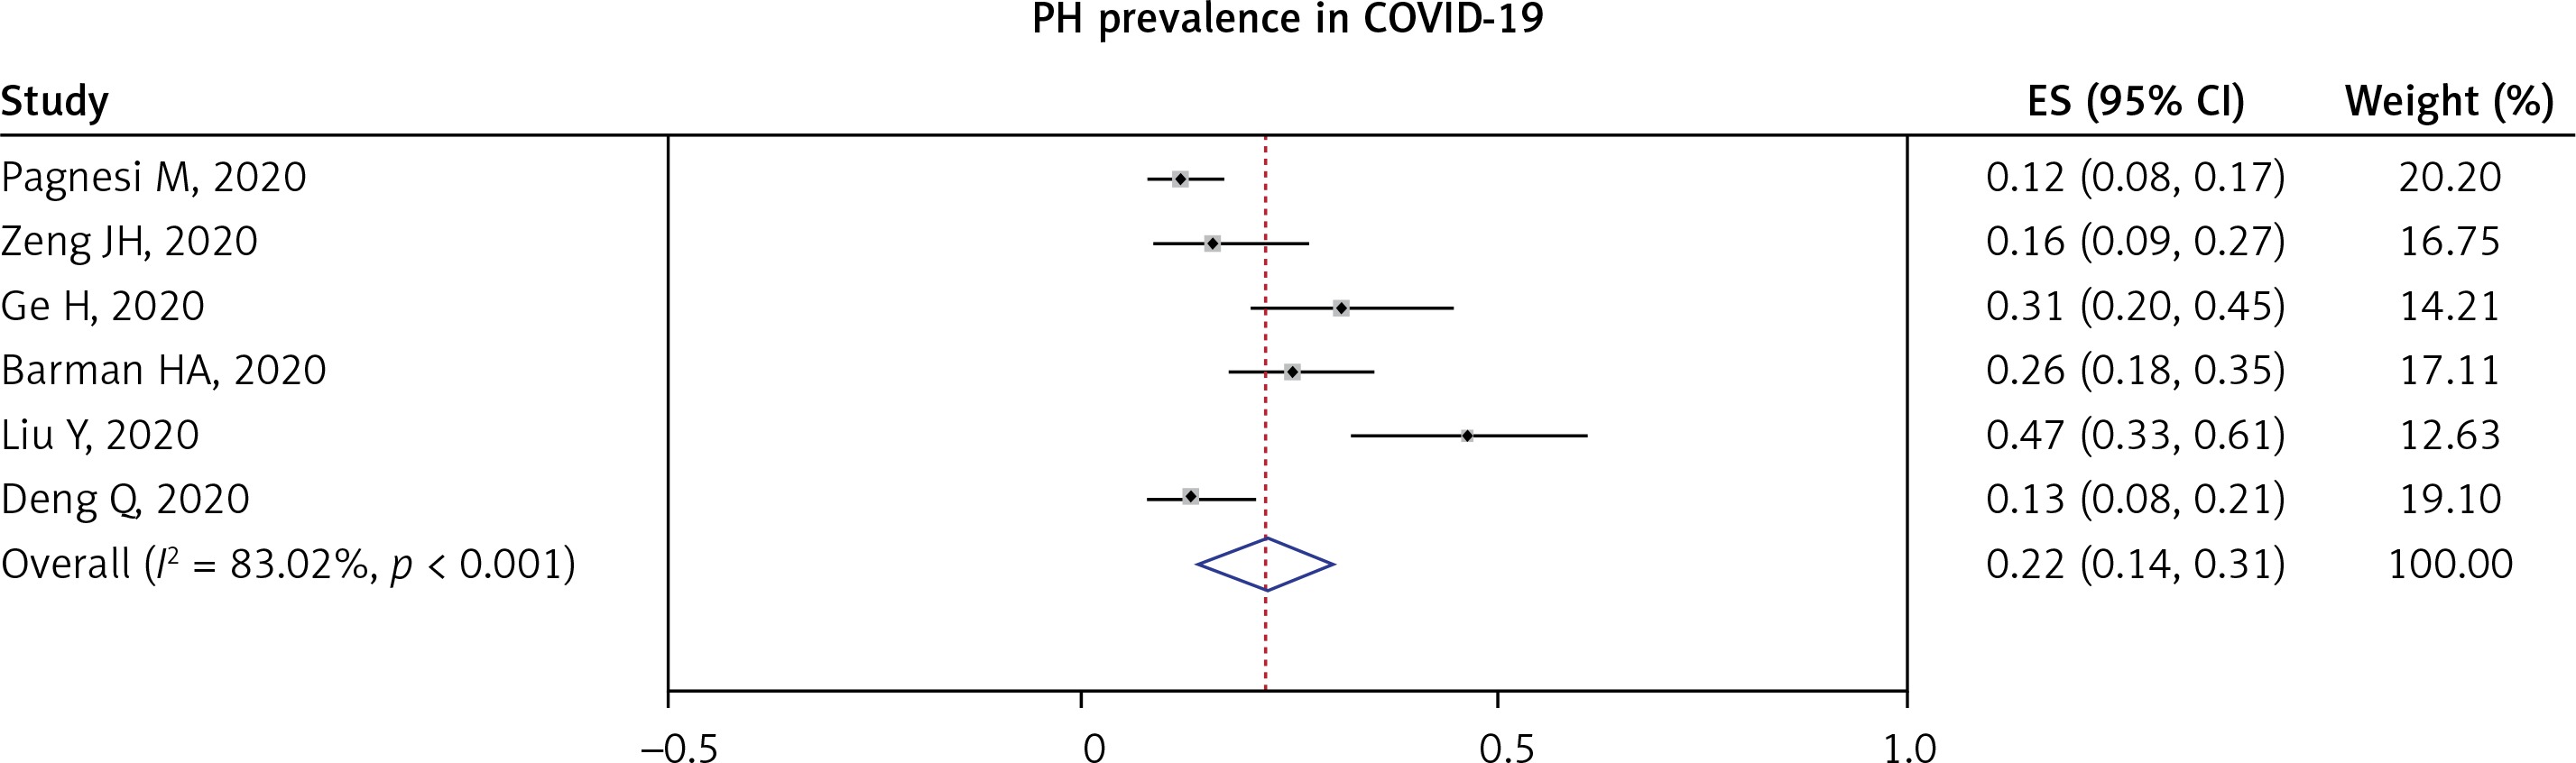
Pulmonary hypertension (PH) in COVID-19 patients was reported in nine studies. Most of the studies defined PH as PASP > 35–40 mm Hg. A pooled analysis from six studies showed that the prevalence of PH in COVID-19 was 22% (95% CI: 14–31%; I2 = 83.02%, p < 0.001), as shown in Figure 4.
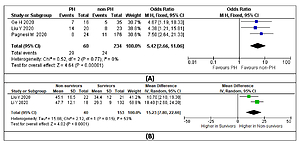
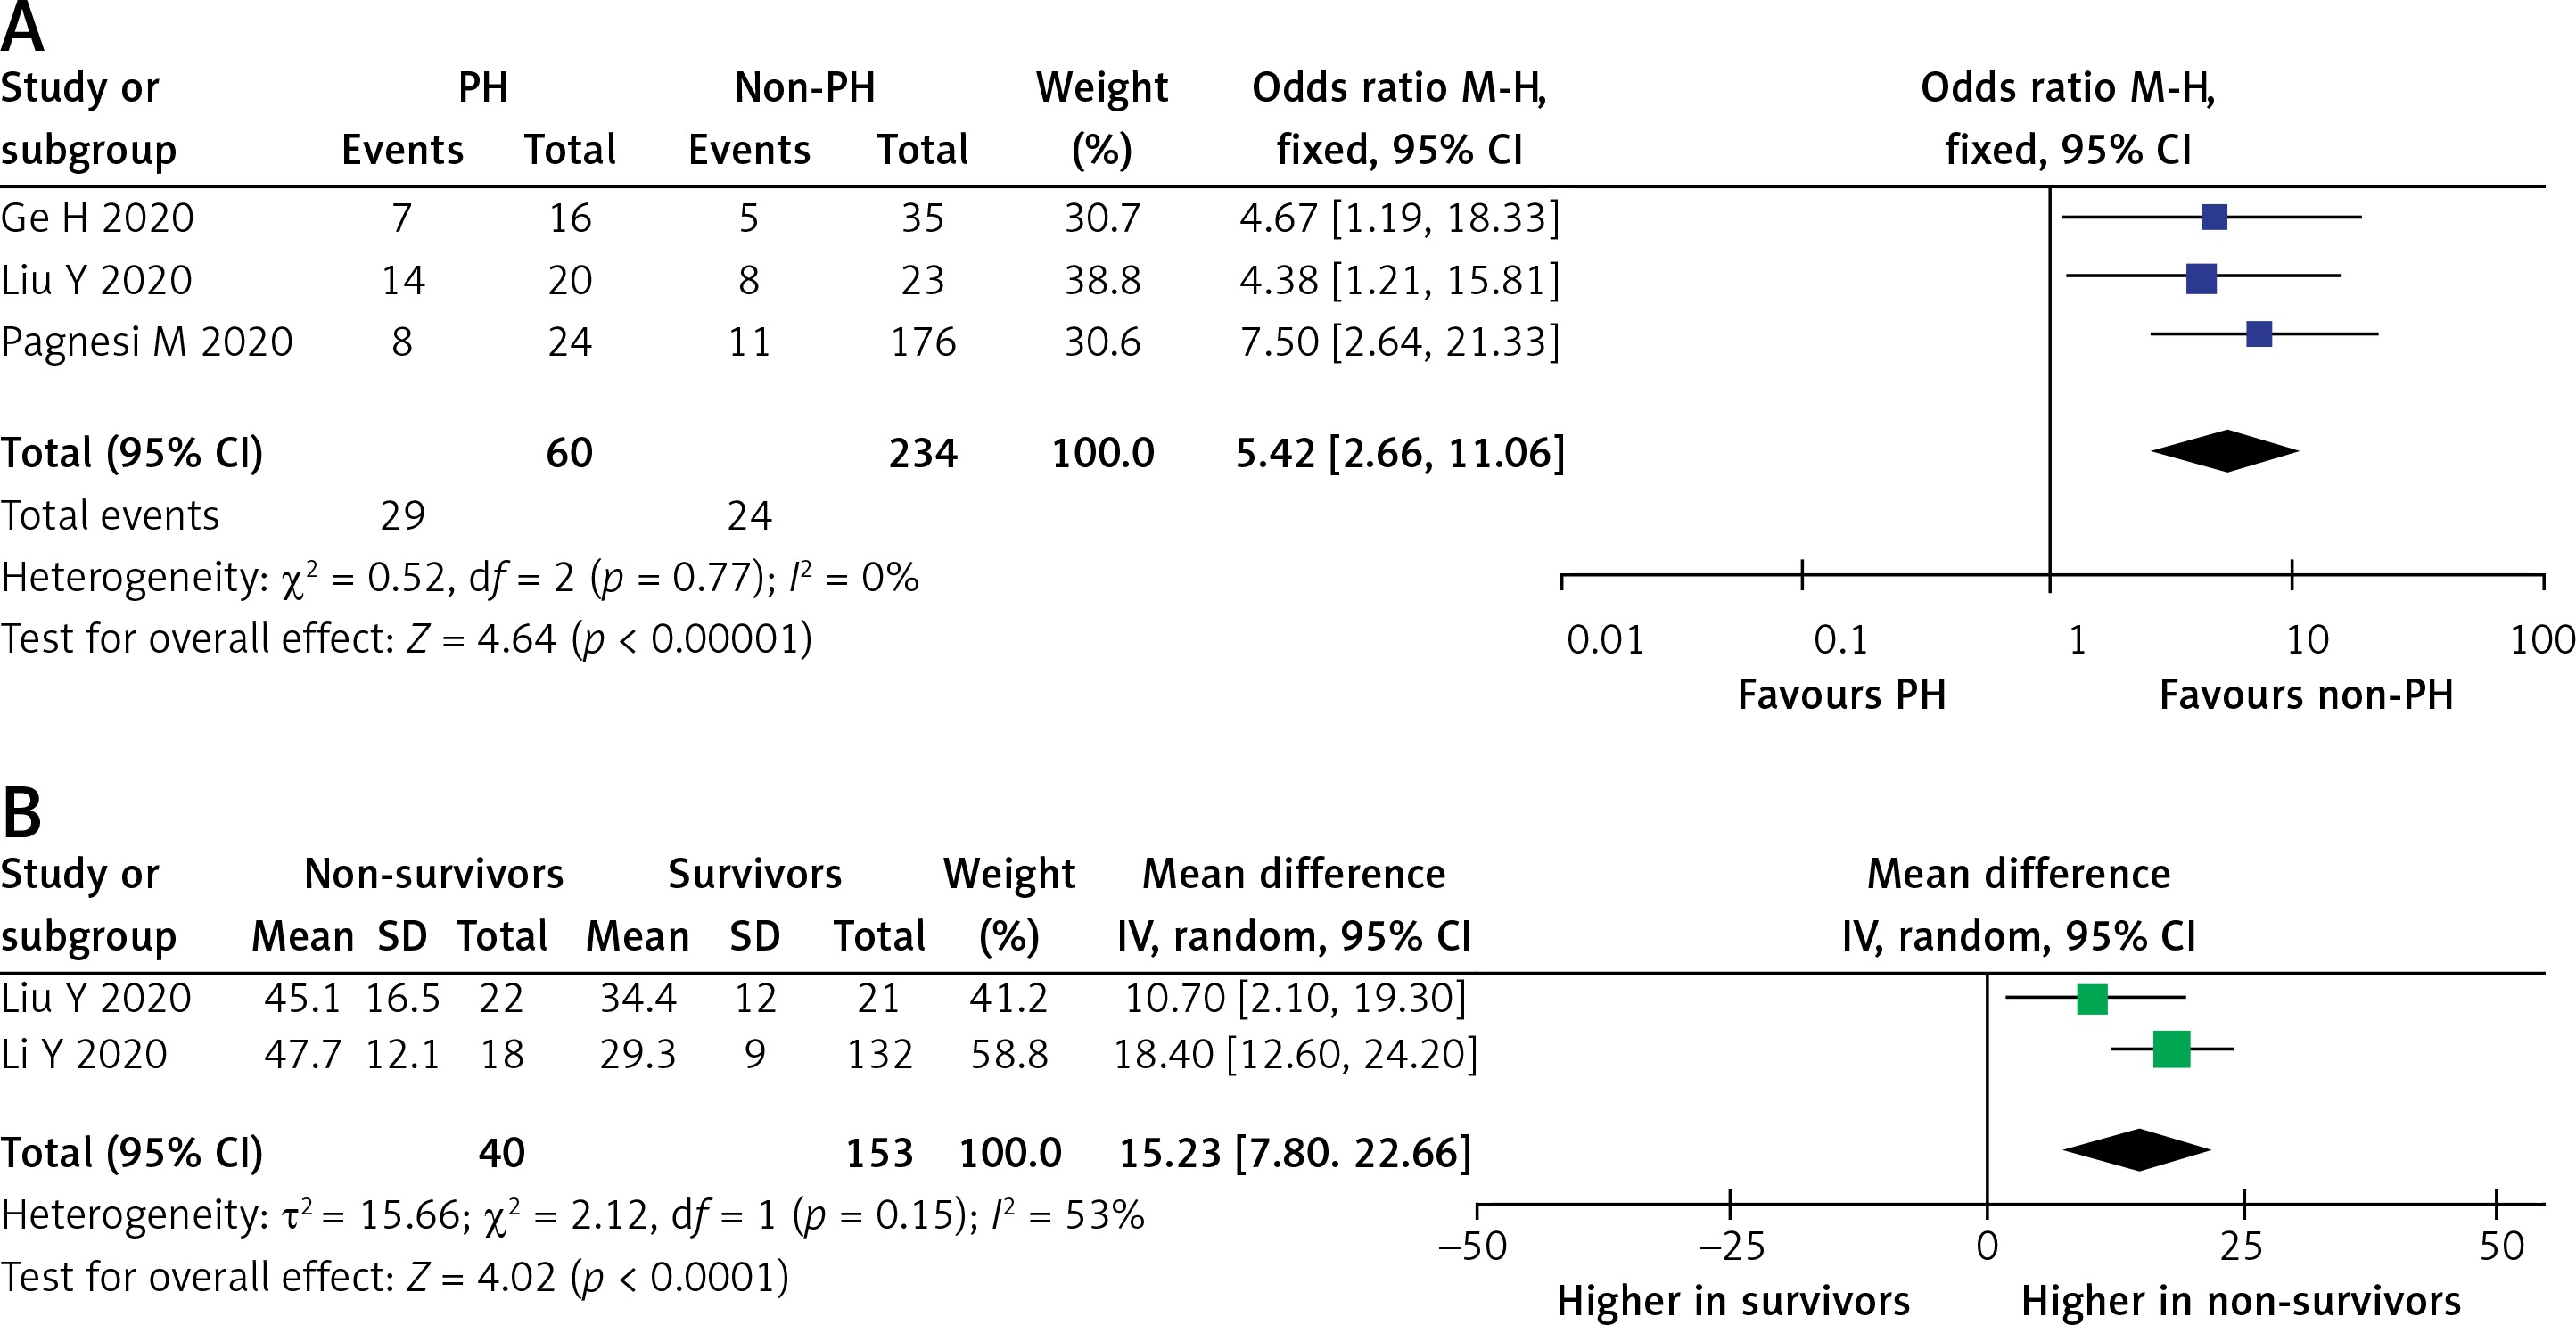
A total of 294 COVID-19 patients with PH in three studies demonstrated the mortality outcome. A pooled analysis using a fixed-effect model showed that PH was significantly associated with increased risk of mortality (OR = 5.42 (95% CI: 2.66–11.06), p < 0.001; I2 = 0%, p = 0.77), as shown in Figure 5 A. Sensitivity analysis using the leave-one-out method showed no difference in heterogeneity; likewise, when the pre-printed study by Ge et al. [17] was removed, the overall result showed increase mortality (OR = 5.75 (95% CI: 2.49–13.27), p < 0.0001; I2 = 0%, p = 0.52). Furthermore, a random-effect meta-analysis of PH echocardiographic parameters found that pulmonary artery systolic pressure (PASP) was significantly higher in the PH group (MD = 15.23 (95% CI: 7.80–22.66), p < 0.0001; I2 = 53%, p = 0.15) (Figure 5 B).
Figure 5
A – Mortality rate in COVID-19 patients with PH. B – Comparison of PASP in survivors vs. non-survivors
PASP – pulmonary artery systolic pressure, PH – pulmonary hypertension.
Random-effects meta-regression analysis demonstrated that the association between PH and mortality was not significantly affected by male sex (p = 0.803), age (p = 0.677), HTN (p = 0.504), CVD (p = 0.691), DM (p = 0.817), CKD (p = 0.589), COPD (p = 0.589), or smoking (p = 0.777).
202 patients pooled from two studies [26, 27] were included to be analyzed. As shown in Supplementary Figure S7, the fixed-effect model showed that the PH group presented with more severe outcomes in COVID-19 patients (OR = 5.74 (95% CI: 2.28–14.49), p < 0.001; I2 = 0%, p = 0.37). Interestingly, random-effect analysis revealed that the PASP between the two groups was not significantly different (MD = 3.24 (95% CI: –1.60–8.07), p = 0.19; I2 = 73%, p = 0.02). Sensitivity analysis demonstrated reduced heterogeneity when the Barman et al. study [26] was removed from the pooled analysis (MD = 0.90 (95% CI: –1.96–3.760, p = 0.54; I2 = 0%, p = 0.84).
ICU admission data were reported in two studies. The incidence of ICU admission is presented in Supplementary Figure S8. The fixed-effect model showed that PH was associated with increased incidence of ICU admission (OR = 12.83 (95% CI: 3.55–46.41), p < 0.001; I2 = 0%, p = 0.52).
Discussion
The results of our meta-analysis showed that both RVD and PH in COVID-19 patients were associated with increased mortality, severity, ICU admission, and MV usage. Meta-regression revealed that only male sex significantly affected mortality in RVD, but not in PH. Other comorbidities such as HTN, CVD, DM, CKD, COPD, and smoking did not affect the aforementioned outcomes. It is worth noting that the heterogeneity of our analysis for the effect estimates was moderate, and the certainty of the evidence was moderate to high in PH outcomes. Nevertheless, due to serious risk of bias in RVD outcomes, the certainty of the evidence remains low. To the best of our knowledge, our findings represent the most recent evidence of RVD and PH in COVID-19 patients along with their association with various clinical outcomes in one study.
Cardiac involvement in COVID-19 is well recognized. Interestingly, earlier studies demonstrated that RV abnormalities were more common compared to LV. A study from Wuhan in early 2020 reported that decreased RVFWS was found in 55.8%, while decreased left ventricle (LV) global longitudinal strain (GLS) was found in 34.9%. Additionally, patients with TAPSE < 17 mm were slightly more frequent than decreased LV ejection fraction (LVEF) findings [28]. Another study in Tel-Aviv reported that 39% of hospitalized COVID-19 patients had RV dilatation or dysfunction, while only 10% and 16% of patients had LV systolic and diastolic dysfunction, respectively [29].
Mechanisms related to RVD in COVID-19 are unclear [30]. Numerous mechanisms are hypothetically possible in development of RV abnormalities. First, a possible mechanism is increased RV afterload. The hypercoagulability state in COVID-19 increases the occurrence of pulmonary thromboembolism and acutely increases RV afterload due to pulmonary hypoxic vasoconstriction. Modulation of ACE2 by SARS-CoV-2 is also predicted to alter pulmonary hemodynamics, raising pulmonary vascular resistance [30]. Respiratory distress and MV usage in COVID-19 might also increase RV afterload, therefore contributing to RVD development [31]. Another possible mechanism is cardiac injury. Cardiac injury in COVID-19 often affects the RV and spares the LV [29]. Injury in RV logically explains high-sensitive troponin elevation, despite normal LV function [12]. Finally, the ischemic condition from the LV or vascular dysfunction possibly influences RV performance [30].
Despite its unclear mechanism, RVD is often associated with poor clinical outcomes in COVID-19. One study claimed that RV echocardiographic findings provide better risk stratification than conventional risk factors. A univariable Cox model showed that RV dysfunction and RV dilatation were better in predicting all-cause mortality compared to other risk factors, including LV echocardiographic findings (HR = 2.57 (95% CI: 1.49–4.43), p = 0.001; and HR = 1.43 (95% CI: 1.05–1.96), p = 0.02, respectively). Additionally, combining either RV dysfunction or dilatation provides a comparable hazard ratio to RV dysfunction alone (HR = 2.76 (95% CI: 1.73–4.39), p < 0.001) [13]. Similarly, a study in England demonstrated RVD outperforming conventional risk factors, namely sex, HTN, or diabetes, in predicting all-cause of mortality (HR = 1.80 (95% CI: 1.05–3.09), p = 0.032). Furthermore, the same study confirmed that RVD could be used universally in all races, including Black, Asian, and other minority patients [12].
Contrary to our result, a study by Pagnesi et al. demonstrated that RVD was not associated with in-hospital all-cause mortality or ICU admission (log-rank p-value = 0.464) [7]. That study explained that PH is better in evaluating COVID-19 related hemodynamic changes, specifically in non-critically ill populations, which moderate changes in pulmonary artery pressure and are inadequate to cause secondary RV dysfunction. Further, RVD might be more related to MV usage.
Our results showed that RV parameters such as TAPSE, RVFAC, and RVGLS were significantly different in patients with poor clinical outcomes. This analysis confirms the study by Li et al. showing decreased TAPSE, RVFAC, and RVLS in the non-survivor group [11]. Moreover, analysis of the receiver-operating characteristic curve showed that RVLS had the highest performance for poor clinical outcome, followed by RVFAC and TAPSE. Yet, the optimal cut-off values were higher than the current guideline.
SARS-CoV-2 binds to ACE2 receptors, which are highly distributed in the lung and alters its function, leading to lung dysfunction, including PH. The exact pathomechanism and association of PH with poor outcomes in COVID-19 patients need to be elucidated. Of the different investigated pathways, there are several potential mechanisms of PH in COVID-19. In response to lung injury, especially due to SARS CoV-2 infection, there is an abundance of evidence showing that the ACE2 receptor, as the main port of entry by the virus, is known to be down-regulated in PH [32]. As a consequence, the concentration of angiotensin II, which contributes to lung inflammation and injury, tends to be elevated, and the protective role of ACE2 by converting angiotensin II to angiotensin (1-7) is diminished [32, 33]. At the same time, elevated endothelin-1 in PH also down-regulated ACE2, inducing further vasoconstriction [34]. Intriguingly, the hypercoagulability and inflammatory state in COVID-19 promote the development of VTE and microthrombi that obstruct the pulmonary vessel, leading to PH [35]. In the current cases, microvascular injury plays a key role in the development of PH in COVID-19 patients [36].
It is well known that COVID-19 causes multi-organ damage, and the presence of cardiac and lung injury may worsen the outcomes. Esposito et al. [37] reported that non-survivor groups in COVID-19 patients displayed elevated PASP compared to survivor groups. This study also revealed that PH, as diagnosed by enlarged main pulmonary artery diameter, was a predictor of mortality (HR (95% CI): 1.741 (1.253–2.418), p < 0.001). Likewise, our mortality was higher in PH groups. Moreover, the prevalence of PH in patients who develop cardiac injury is higher compared to non-cardiac injury [26].
In fact, PH and RV dysfunction in COVID-19 is part of a vicious cycle and associated with worse conditions. An increase in pulmonary artery pressure resulted in an increase in RV afterload that may continue to RV dysfunction [26]. In addition, ARDS as a complication in COVID-19 leads to respiratory failure that needs MV application, and such MV further increases PASP and exacerbates RV dysfunction. In line with our findings, a study in Europe showed that 66.67% of patients admitted to the ICU required MV, and the overall mortality rate in PH was 20% [38]. Another retrospective observational study previously reported that 63.6% of the total samples were admitted to the ICU, whereas 28.57% of them underwent MV [39]. This study also reported that the mortality rate among PH patients was 36.36%, directly attributable to COVID-19. The authors revealed that systemic hypertension and diabetes mellitus were associated with severity of the disease; however, our meta-regression proved that these comorbidities were not significantly affected.
Clinical implications and study limitations
This study provides evidence regarding the importance of RVD and PH in COVID-19. RVD and PH parameters could be evaluated easily by bedside transthoracic echocardiography. These parameters could be developed as novel risk-stratification markers in COVID-19 patients since they outperformed conventional risk factors in previous evidence [12, 13]. This study also supports experts’ statements and consensus on the need for point-of-care ultrasound during the pandemic, which involves the measurement of right ventricle size and function, along with pulmonary artery systolic pressure [40–42]. In addition, evaluation in RVD and PH may provide a novel strategy and insights for COVID-19 management.
Nevertheless, our study has several limitations. Publication bias was noted in several outcomes. Most of the included studies in this meta-analysis were retrospective observational, with a relatively small sample size, and were not adequately matched/adjusted for confounders. Thus, the included studies were subject to potential confounders that may weaken or strengthen the effect estimate. The result of the meta-regression has to be interpreted cautiously due to the known limitations of such analysis. Definitions of RVD and PH were slightly different between studies. The definition of RVD was mostly based on TAPSE < 16 mm or TAPSE < 17 mm, while most PH was defined based on PASP > 35 mm Hg or PASP > 40 mm Hg. Yet, other variance in RVD and PH definition should not be neglected. Our study did not evaluate pre-existing RVD or PH, which may cause a biased result. Lastly, despite the fact that RV’s structural feature is not included in our objective, structural findings may reflect chronicity of RVD or PH, and therefore may provide further information regarding its mechanism in COVID-19.
In conclusion, RVD and PH were prevalent in COVID-19 and associated with mortality, severity, ICU admission, and MV usage in COVID-19 patients. Bedside echocardiography examination could be considered as a novel risk stratification tool in COVID-19.