Introduction
Acute pancreatitis (AP) is a clinical condition that currently affects 33.74 out of every 100,000 people per year [1], and it is expected to increase to 81.8 cases per 100,000 people annually by 2030 [2]. Initially, AP is a kind of aseptic inflammation, leading to varying levels of systemic inflammatory response syndrome (SIRS). While most patients (80%) experience mild symptoms, a small number of patients may suffer from severe symptoms [3, 4]. Studies indicate that 10.7% of patients experience recurrent acute pancreatitis (RAP) [5], and 35% suffer from pancreatic exocrine insufficiency (EPI) [6] after being discharged from the hospital following an AP episode. Additionally, 25% of AP patients develop diabetes after discharge, with 70% requiring long-term insulin therapy [7].
Post-acute pancreatitis diabetes mellitus (PPDM-A), also known as pancreatogenic diabetes mellitus type 3c, is a type of diabetes resulting from exocrine pancreas dysfunction. This dysfunction prevents the pancreas from secreting insulin, leading to insulin deficiency [8]. Type 3c diabetes is caused by various exocrine pancreatic diseases, such as acute and chronic pancreatitis, pancreatic ductal adenocarcinoma, pancreatic cysts, pancreatic surgery, and pancreatic trauma [9], among which acute pancreatitis is the most common cause. The mechanism of type 3c diabetes is still unclear and may involve protracted inflammation, β cell compensation, lipolysis, intestinal hormone secretion change, and iron metabolism change [10]. Patients with PPDM-A have reduced insulin secretion but increased insulin sensitivity compared to T2DM, requiring vigilance for hypoglycemia [11]. In addition, PPDM-A confers a higher mortality risk and a greater danger of developing pancreatic cancer than type 2 diabetes mellitus (T2DM) [12].
PPDM is the most common disease in secondary diabetes. Its incidence rate is second only to type 2 diabetes; thus it is increasingly garnering attention. Zhang et al. have established a robust predictive model using nine clinical variables: admission blood glucose levels (GLU), body mass index (BMI), age, non-alcoholic fatty liver disease (NAFLD), uric acid (UA), smoking, cardiovascular disease, alanine aminotransferase (ALT), and high-density lipoprotein (HDL) [13]. The AUC of the model is 0.819. Despite the use of multiple indicators, this model does not include indicators related to pancreatic damage. In this study, we analyzed the characteristics of the patients and the results of laboratory tests. Based on this, we included an indicator of pancreatic necrosis (PN) and established a new predictive model. This model can assist healthcare professionals in identifying the early symptoms of PPDM-A, thus helping to prevent or slow down the progression and onset of diabetes.
Material and methods
Patients
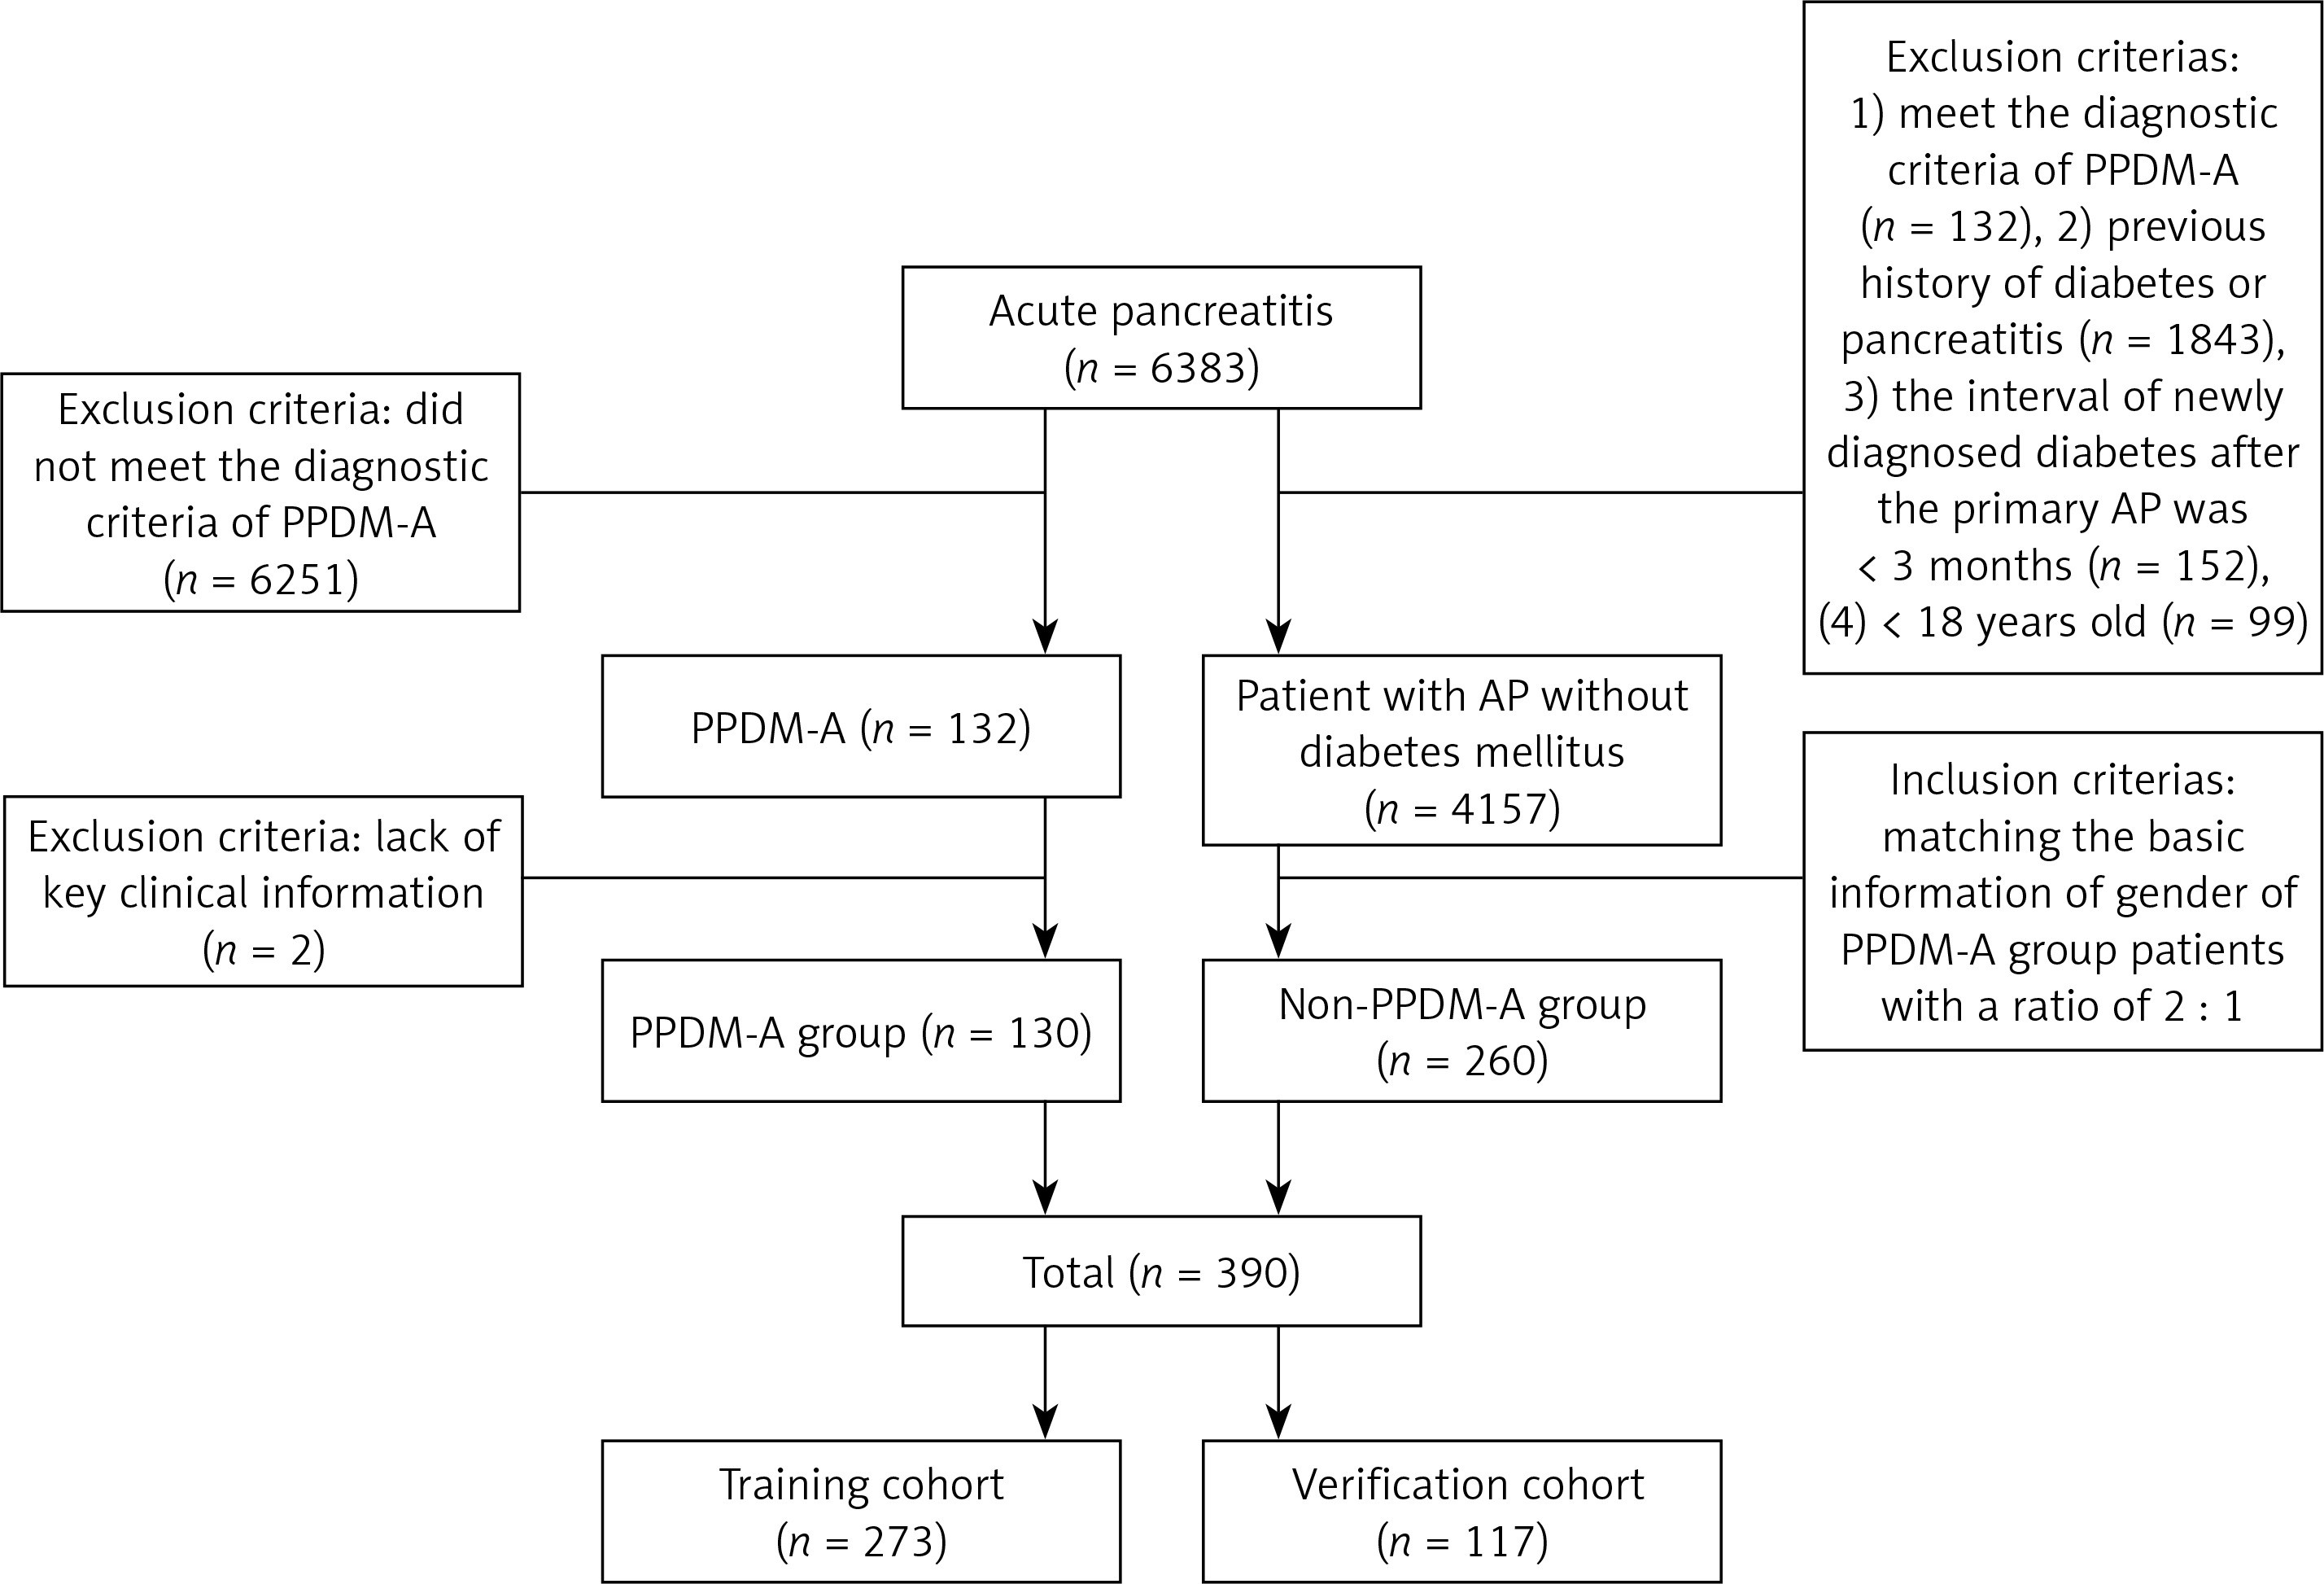
The study focused on patients who were diagnosed with AP for the first time at the Affiliated Hospital of Southwest Medical University between July 2013 and January 2023. Criteria for inclusion in the PPDM-A group are as follows: (1) Meets the diagnostic criteria for AP. Based on the severity of AP, it can be classified into various categories such as moderately acute pancreatitis (MAP), moderately severe acute pancreatitis (MSAP), severe acute pancreatitis (SAP), and critical acute pancreatitis (CAP) [14]; (2) satisfies the diagnostic criteria for diabetes [8]; (3) experiencing newly diagnosed diabetes after the primary AP, with an interval of over 3 months. Exclusion criteria: (1) previous history of diabetes; (2) previous history of pancreatitis; (3) < 18 years old; (4) lack of clinical information. The PPDM-A group consisted of 130 patients, while the non-PPDM-A group consisted of 260 patients with AP but without diabetes mellitus within the same time frame, selected randomly and matched for gender at a ratio of 2 : 1. All 390 patients were divided into two groups: a training cohort consisting of 273 cases and a validation cohort consisting of 117 cases, following a 7 : 3 ratio (Figure 1).
Data collection
General information of hospitalized patients was collected. It included gender, age, history of drinking, body mass index (BMI), fatty liver disease (FLD), white blood cells (WBC), neutrophils (NEUT), uric acid (UA), triglyceride (TG), cholesterol (TC), low-density lipoprotein (LDL), high-density lipoprotein (HDL), admission blood glucose value (GLU), calcium (Ca), blood amylase (AMY), aspartate aminotransferase (ALT), severity of AP, and recurrent acute pancreatitis (RAP). The Chinese visceral fat index (CVAI) was calculated.
Definitions
PPDM-A: no previous diabetic basis; diagnosed with diabetes at least 3 months after discharge from the primary AP.
The patient’s waist circumference (WC) and CVAI were estimated using the following formula:
WC (cm) (male) = Height (cm)/2 – 11, WC (cm) (female) = Height (cm) /2 – 13,
CVAI (male) = –267.93 + 0.68 × age (years) + 0.03 × BMI (kg/m2) + 4.00 × WC (cm) + 22.00 × Log10(TG) (mmol/l) – 16.32 × HDL (mmol/l),
CVAI (female) = –187.32 + 1.71 × age (years) + 4.32 × BMI (kg/m2) + 1.12 × WC (cm) + 39.76 × Log10(TG) (mmol/l) – 11.66 × HDL (mmol/l).
Statistical analysis
Statistical software such as R-4.2.2, R Studio, and SPSS 23 was used for data analysis. SPSS 23 was used to calculate the cut-off of the quantitative data, which was then converted to qualitative data and expressed as a proportion or rate. Multivariate logistic regression analysis was carried out on the risk factors of PPDM-A in the training cohort, and the model and nomogram were created. The model was evaluated using data from the validation cohort. The accuracy, discrimination, and calibration of the prediction model were assessed using receiver operating characteristic (ROC) curves, the Hosmer-Lemeshow test, and calibration plots. The clinical validity of the prediction model was assessed using decision curve analysis (DCA). All statistical tests were bilateral, and a p-value of < 0.05 was considered to indicate statistical significance.
Results
Baseline characteristics of all patients
In this study, a total of 390 patients were divided into a training group of 273 cases and a validation group of 117 cases, following a 7 : 3 ratio. There were no significant differences in baseline characteristics between the two groups (p > 0.05) (Table I).
Table I
Baseline characteristics of all patients
[i] - no, + yes, median comparison p-values are from χ2 test, FLD – fatty liver disease, BMI – body mass index, CVAI – Chinese visceral fat index, WBC – white blood cells, NEUT – neutrophils, UA – uric acid, TC – cholesterol, TG – triglyceride, HLD – high-density lipoprotein, LDL – low-density lipoprotein, GLU – admission blood glucose value, Ca – calcium, AMY – blood amylase, ALT – aspartate aminotransferase, MAP – moderately acute pancreatitis, MSAP – moderately severe acute pancreatitis, SAP – severe acute pancreatitis, CAP – critical acute pancreatitis, RAP – recurrent acute pancreatitis.
Univariate and multivariate logistic regression outcome
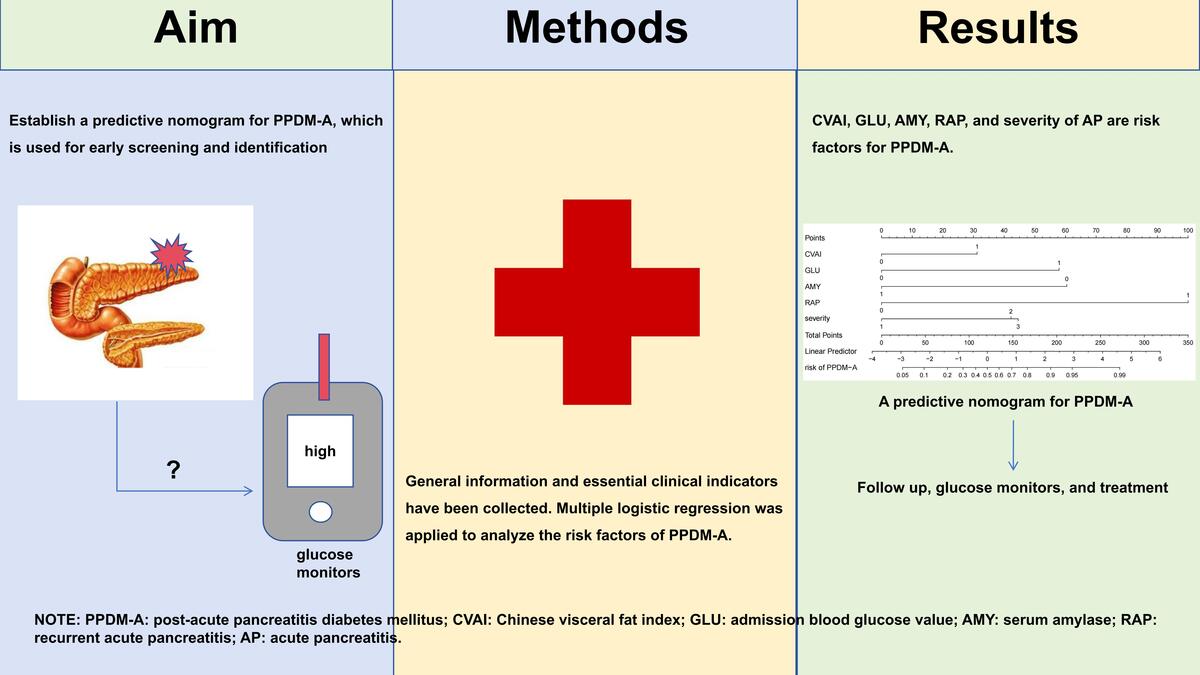
The univariate logistic regression analysis revealed a correlation between the incidence of PPDM-A and factors such as age, FLD, BMI, CVAI, WBC, NEUT, UA, TC, TG, HDL, GLU, Ca, AMY, ALT, RAP, and the severity of AP (p < 0.05). Gender, history of drinking, and LDL had no statistical significance (p > 0.05), as shown in Table II. Next, multivariate logistic regression analysis identified independent factors including CVAI (OR = 2.593, 95% CI: 1.114–6.184, p = 0.028), GLU (OR = 5.592, 95% CI: 2.327–14.186, p < 0.001), AMY (OR = 0.141, 95% CI: 0.040–0.466, p = 0.002), the severity of AP [MSAP (OR = 3.533, 95% CI: 1.400–9.189, p = 0.008), SAP/CAP (OR = 3.752, 95% CI: 1.224–11.827, p = 0.021)] and RAP (OR = 25.313, 95% CI: 8.928–82.850, p < 0.001) (Table II).
Table II
Univariate and multivariate logistic regression results
[i] – no, + yes, FLD – fatty liver disease, BMI – body mass index, CVAI – Chinese visceral fat index, WBC – white blood cells, NEUT – neutrophils, UA – uric acid, TC – cholesterol, TG – triglyceride, HLD – high-density lipoprotein, LDL – low-density lipoprotein, GLU – admission blood glucose value, Ca – calcium, AMY – blood amylase, ALT – aspartate aminotransferase, MAP – moderately acute pancreatitis, MSAP – moderately severe acute pancreatitis, SAP – severe acute pancreatitis, CAP – critical acute pancreatitis, RAP – recurrent acute pancreatitis.
Construction and validation of the nomogram
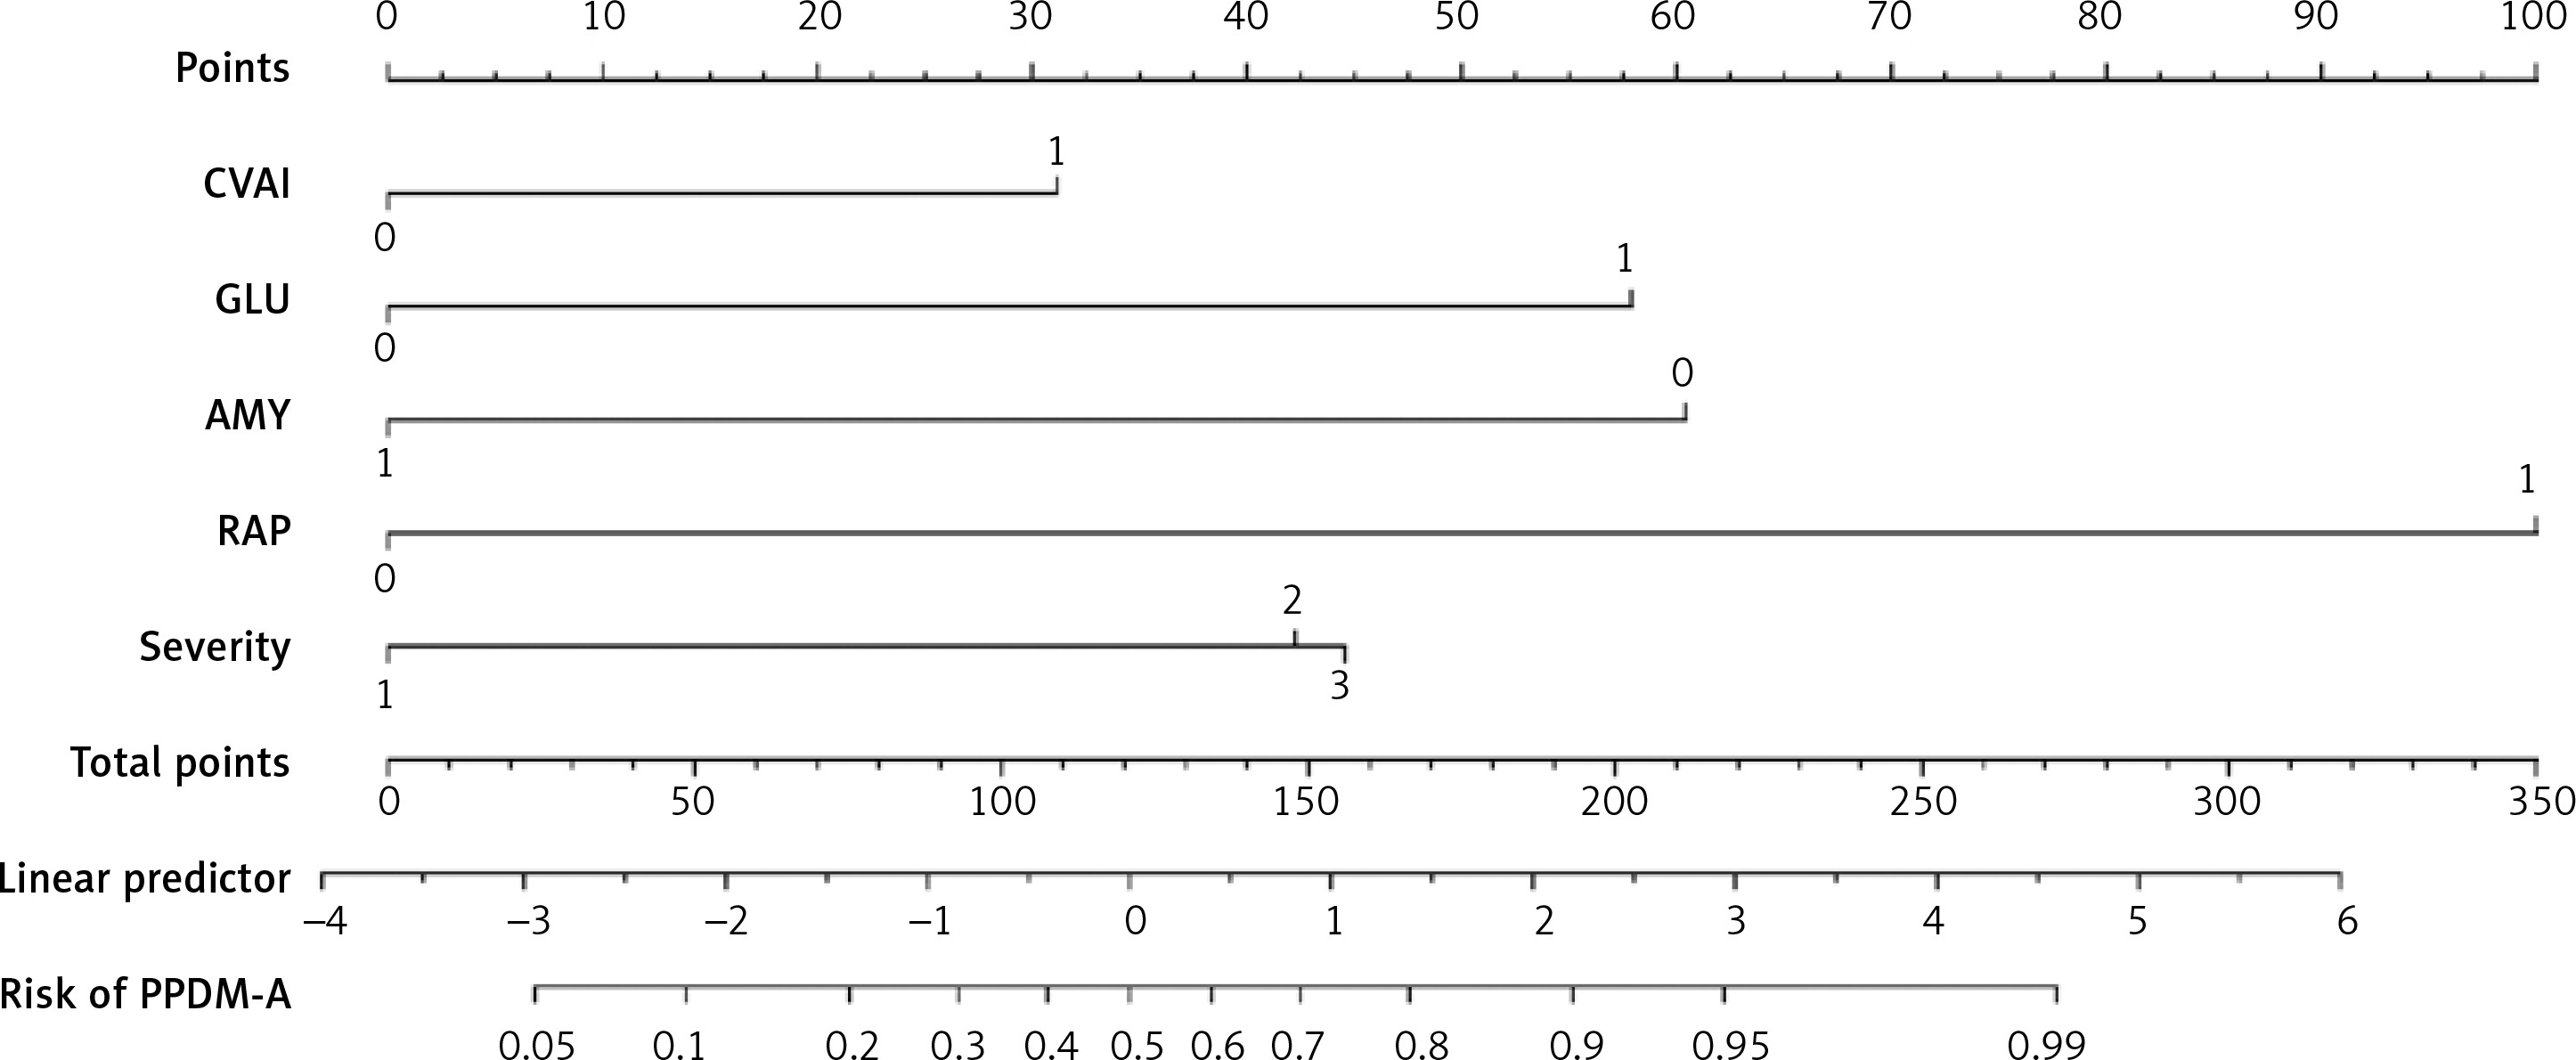
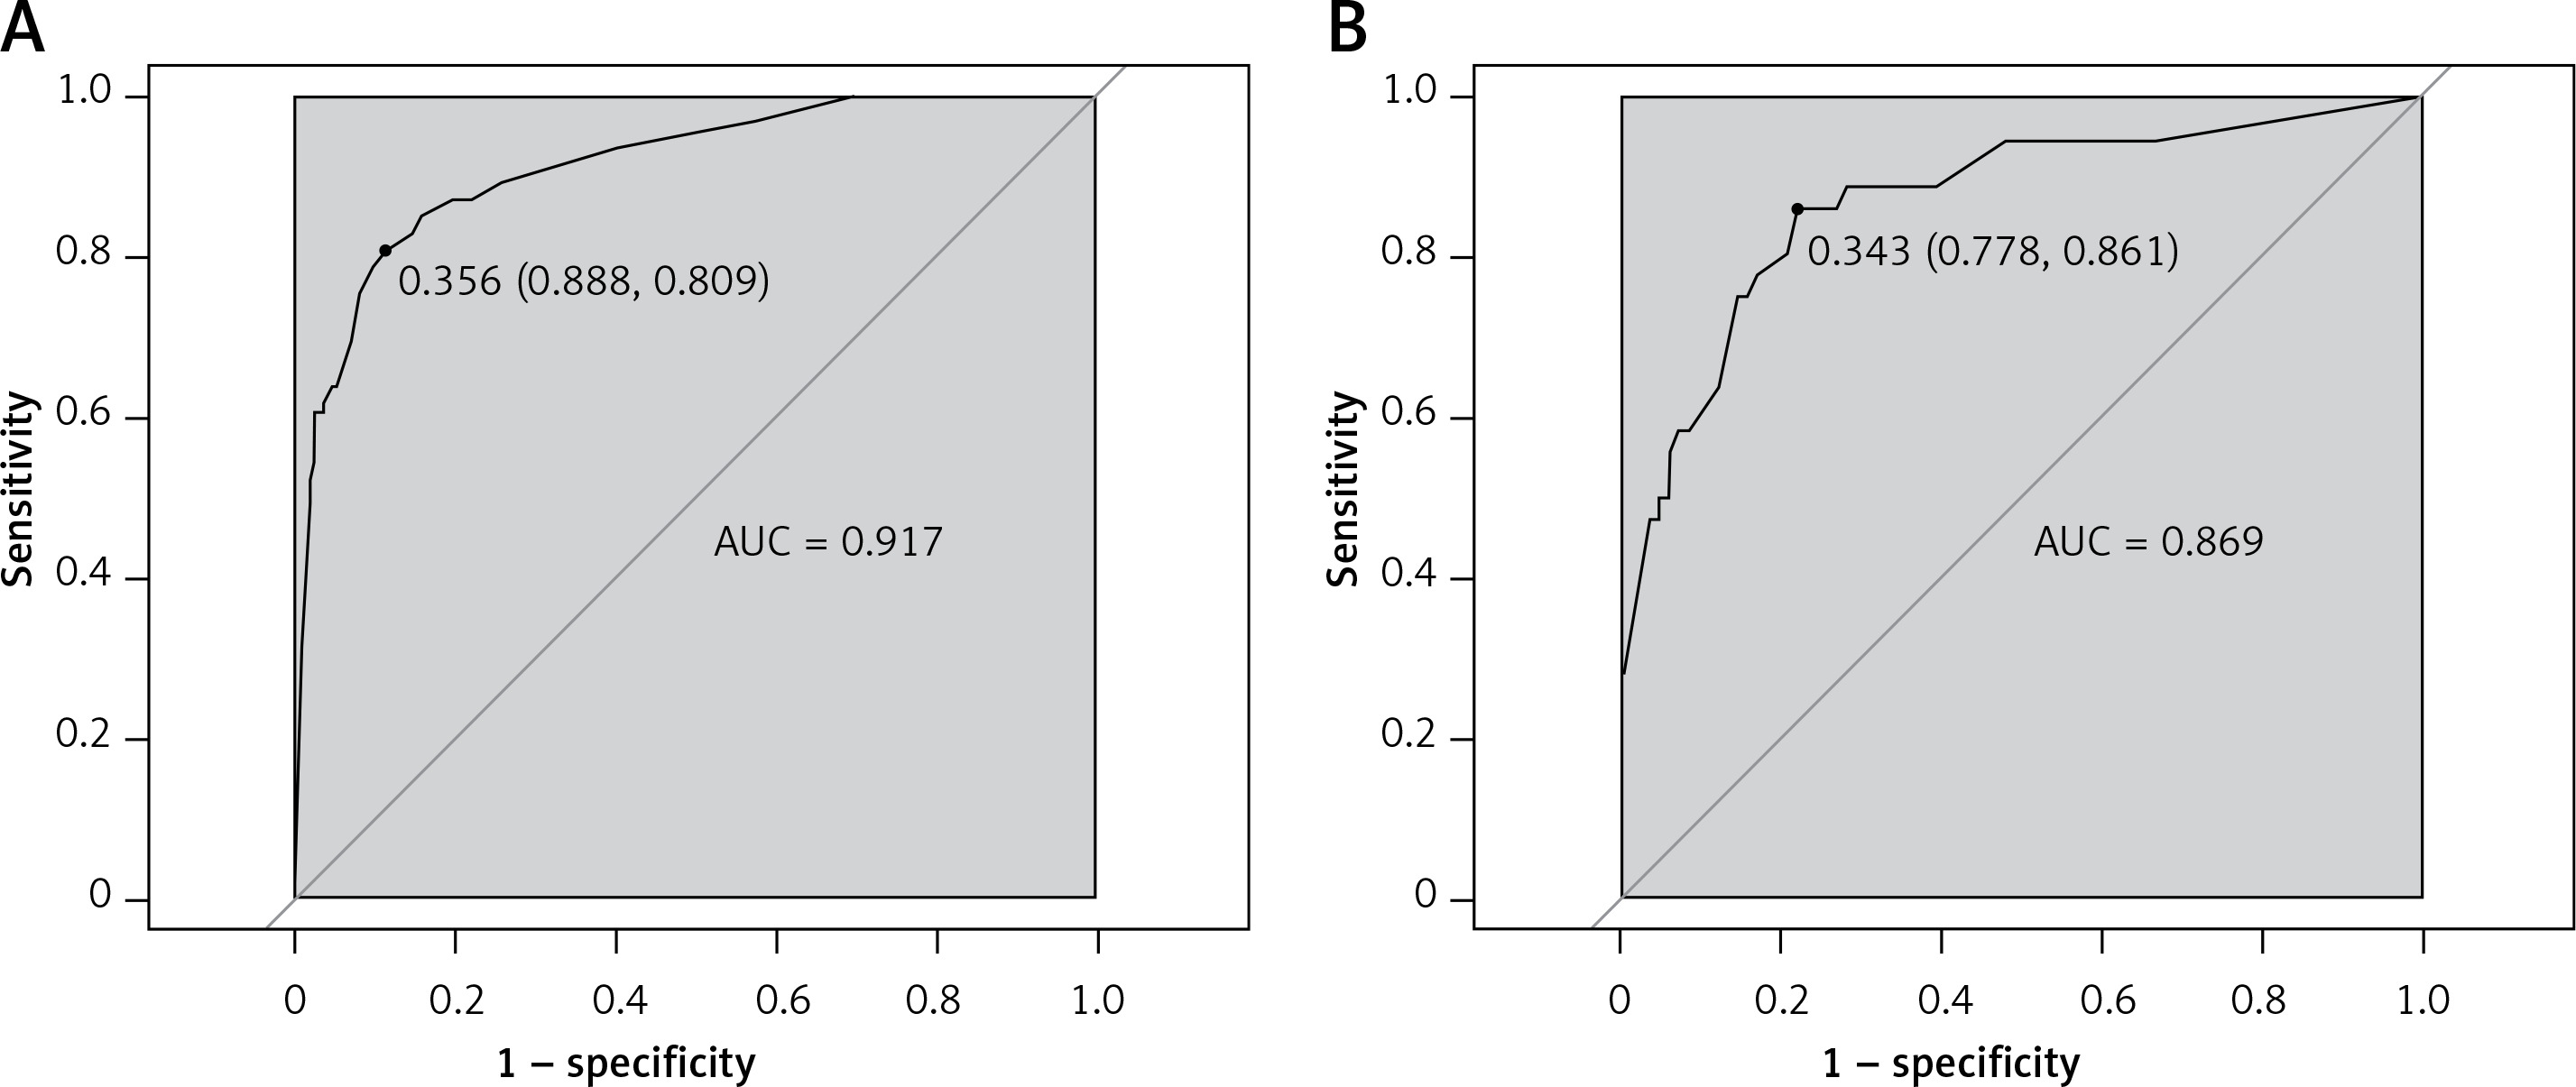
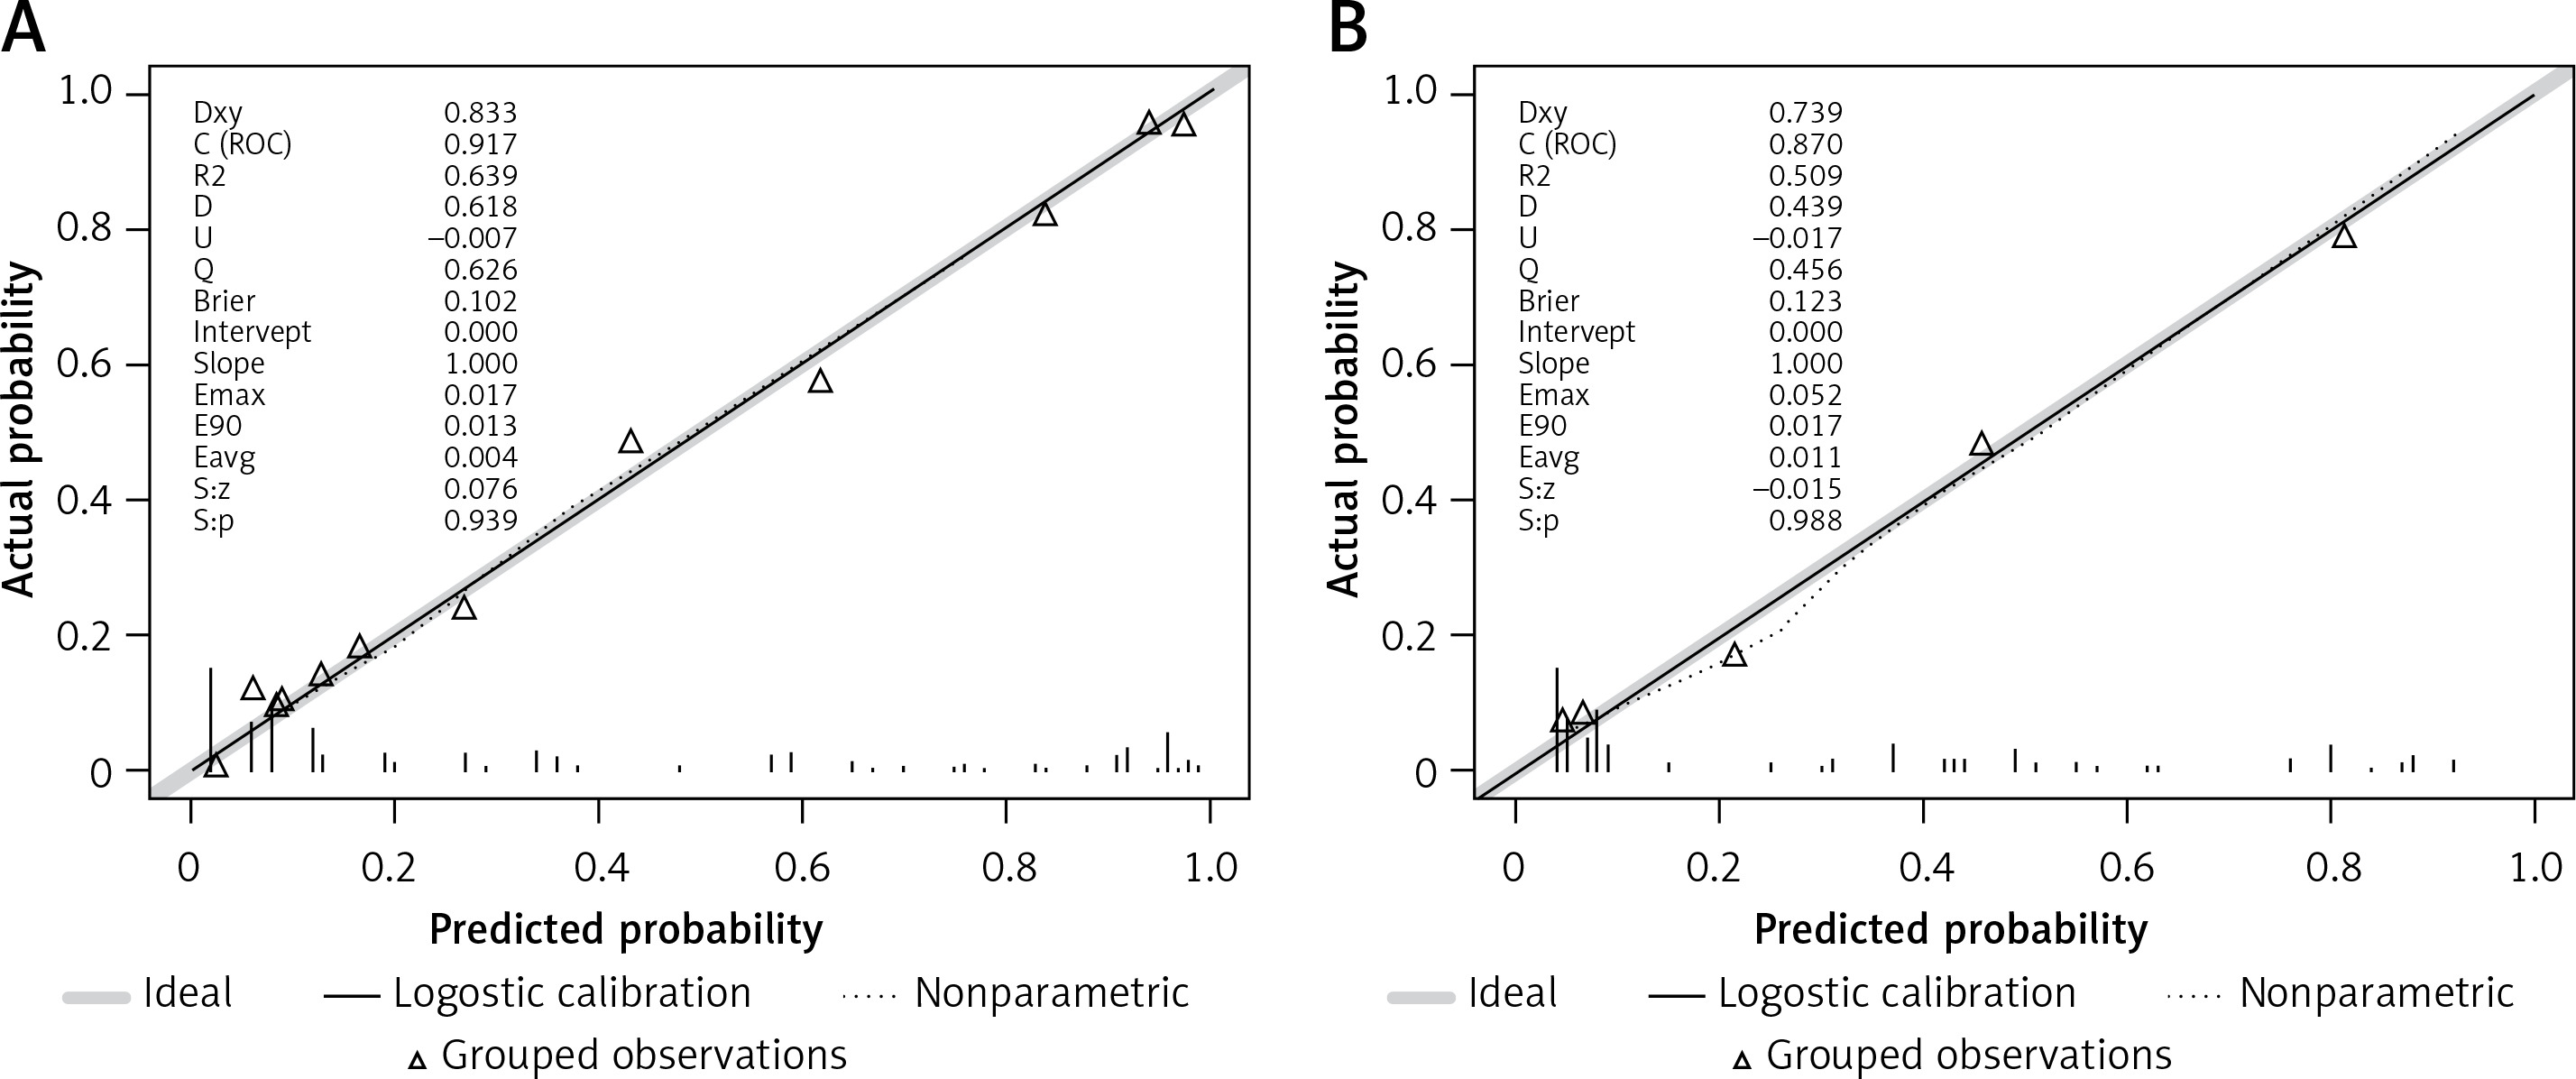
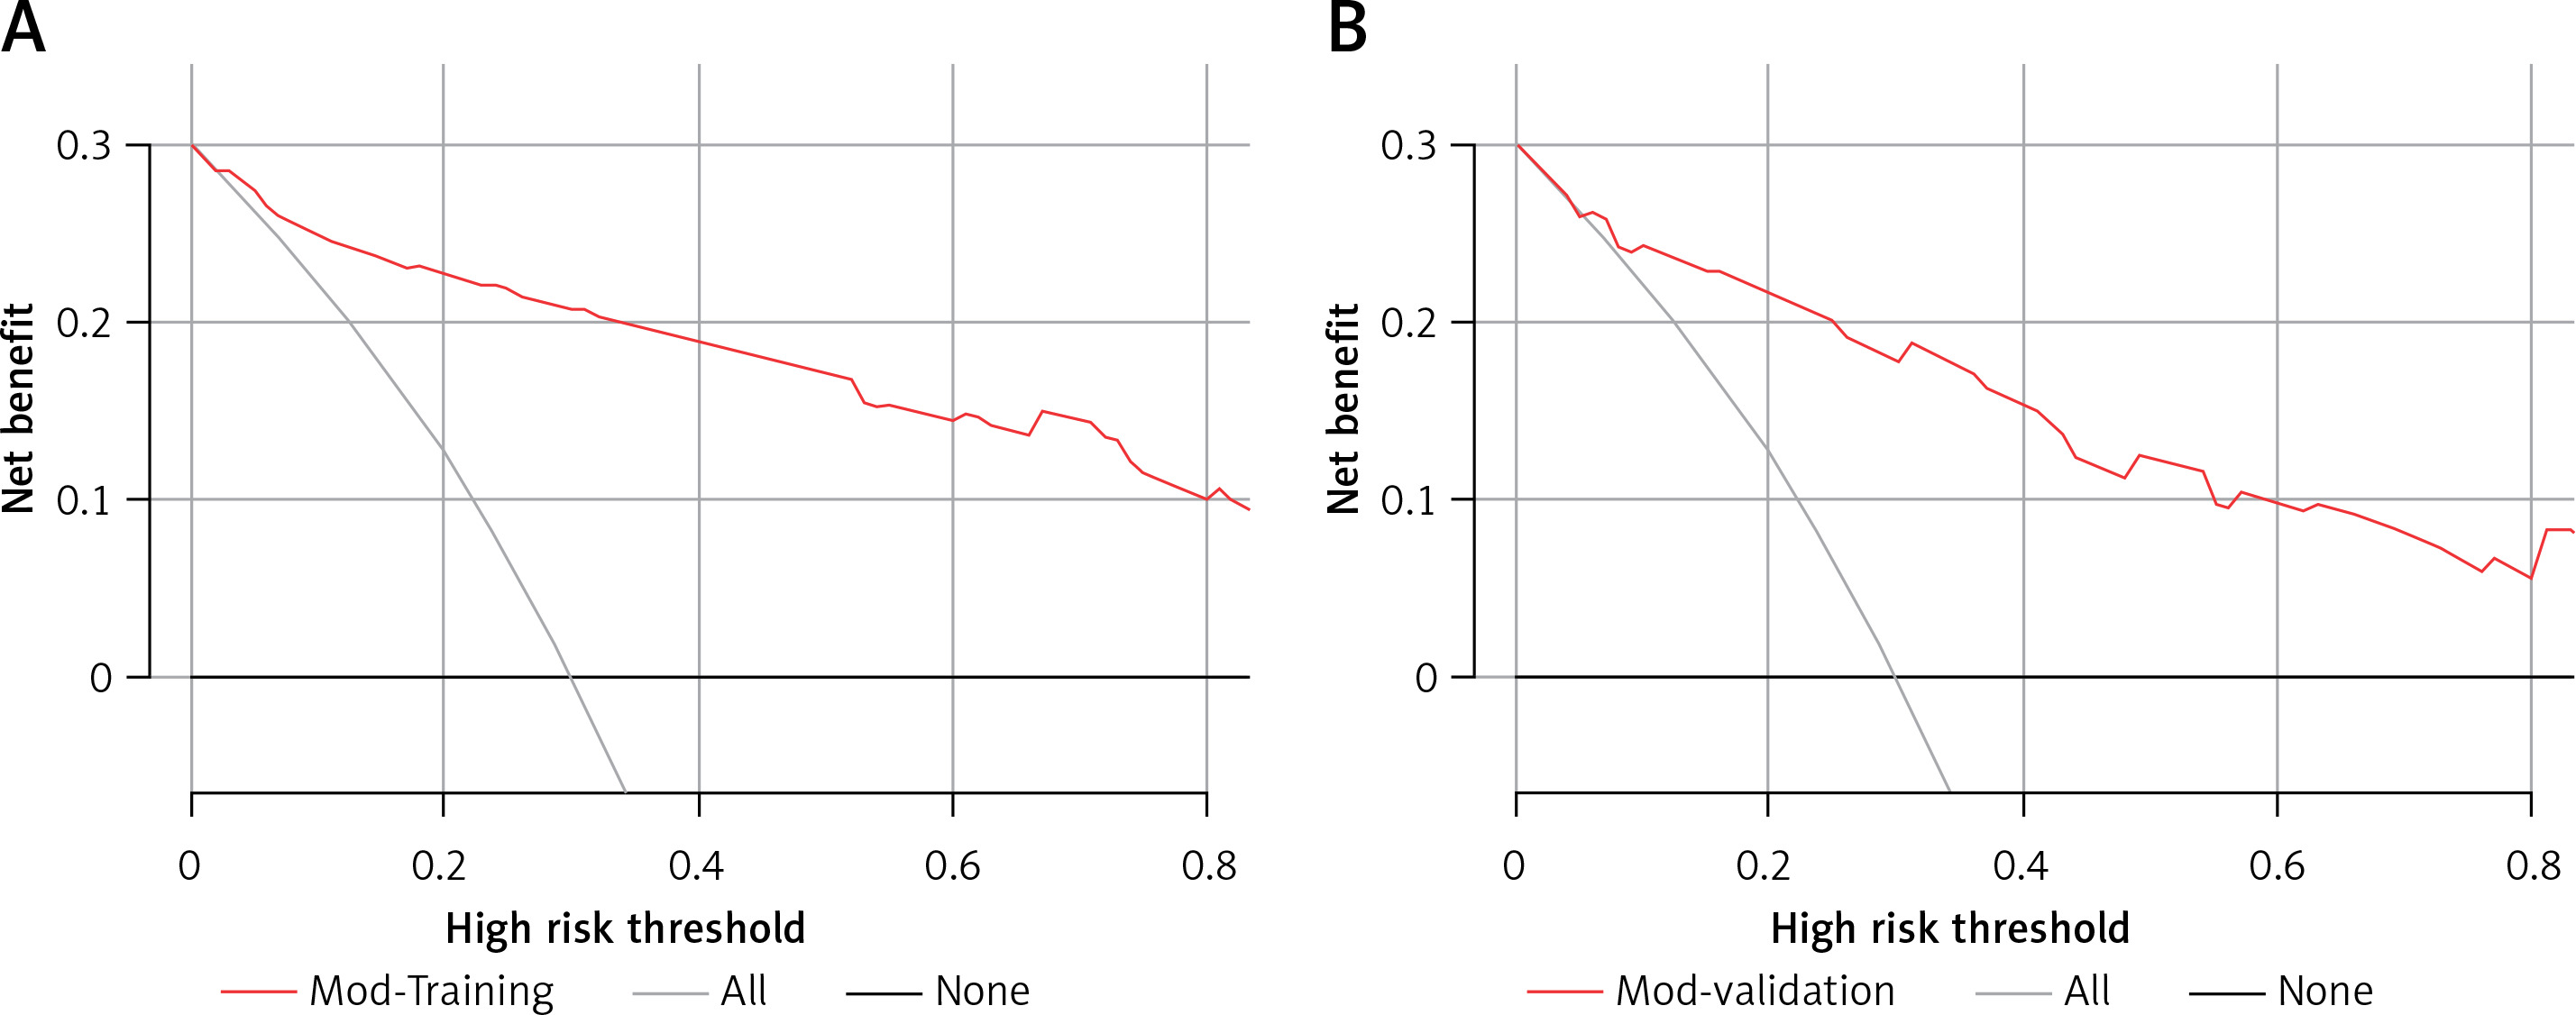
A predictive nomogram for PPDM-A (Figure 2) was constructed based on the above independent risk factors determined by multivariate logistic regression analysis. Simultaneously, a prediction model was built: Logit (P) = -–.837 + 0.947 × CVAI(0/1) + 1.761 × GLU(0/1) – 1.837 × AMY(0/1) + 3.041 × RAP(0/1) + 1.284 × MSAP + 1.355 × SAP/CAP. In the training cohort, the area under the curve (AUC) was assessed at 0.917 (95% CI: 0.882–0.952), as shown in Figure 3 A. With a cut-off value of 0.356, the sensitivity and specificity were identified to be 0.888 and 0.809 respectively, and the 10-fold cross-validation κ was calculated to be 0.679. The calibration curve was on the brink of the ideal diagonal line (Figure 4 A). Moreover, the decision curve analysis (DCA) results indicated a considerably higher net benefit in the predictive model (Figure 5 A). The nomogram was then validated on an internal validation group of 117 patients. This internal validation estimated the AUC to be 0.869 (95% CI: 0.793–0.944), thereby confirming the good accuracy of the nomogram. The model also demonstrated excellent consistency, with the calibration curve of the validation group closely adhering to the ideal diagonal line (Figure 4 B). The DCA also underscored the significant net benefit of the prognostic model (Figure 5 B). The Hosmer-Lemeshow test indicated a good fit for both the training (p = 0.860) and validation cohorts (p = 0.592). Lastly, the variance inflation factor (VIF) confirmed that there was no collinearity between variables in the final model (VIF ≤ 2).
Figure 2
Predictive nomogram for PPDM-A
CVAI – China visceral fat index, 0 – CVAI ≤ 63.11, 1 – CVAI > 63.11. GLU – admission blood glucose value, 0 – GLU ≤ 8.10 (mmol/l), 1 – GLU > 8.10 (mmol/l). AMY – blood amylase, 0 – ≤ 53 (U/l), 1 – > 53 (U/l). RAP – recurrent acute pancreatitis, 0 – no, 1 – yes. Severity – severity of acute pancreatitis, 1 – moderately severe acute pancreatitis (MAP), 2 – moderately severe acute pancreatitis (MSAP), 3 – severe acute pancreatitis/critical acute pancreatitis (SAP/CAP).
Discussion
In this retrospective study, we identified CVAI, GLU, AMY, RAP, and the severity of acute pancreatitis as risk factors for PPDM-A. We developed a predictive model incorporating these five factors, taking into account basic patient characteristics, various laboratory results, the degree of pancreatic necrosis, and other patient indicators. We evaluated our model using the ROC and DCA, both of which indicated that the model has a strong predictive value. Early identification of PPDM-A allows for timely interventions, which can lower the risk of diabetes and enhance patients’ quality of life in the long term.
A commonly used indicator to evaluate visceral fat is the CVAI, which incorporates variables such as WC, BMI, TG, and HDL, with adjustments for gender and age. Compared with BMI and WC, CVAI has a stronger correlation with insulin resistance and serves as a better predictor of metabolic syndrome, hypertension, and diabetes [15]. Multiple studies have investigated the relationship between CVAI and diabetes [16–21], but none have utilized it to predict PPDM-A. However, due to the retrospective design of our study, accurate WC measurements for patients were not available and had to be estimated from a formula. Consequently, the CVAI value obtained was also an estimation. Therefore, in addition to considering patients’ body mass index (BMI) at the time of hospital admission, we should also take into account their estimated WC and CVAI.
Patients suffering from AP who are under stress may develop irregularities in glucose metabolism, leading to a temporary spike in blood glucose levels. While most patients’ blood glucose levels return to normal as their condition improves, some may develop PPDM-A over time. The specific mechanism of this process remains to be standardized. Our study indicates that patients with high blood glucose levels (GLU > 8.10 mmol/l) faced a significantly higher risk of developing PPDM-A; their risk was five times that of patients with lower blood glucose levels (OR = 5.592). This finding aligns with those of a similar study conducted by Zhang et al. [13].
Limited studies have been conducted on the association between amylase and PPDM-A. Our findings suggest that blood amylase levels below 53 U/l could increase the risk of developing PPDM-A. While amylase levels typically increase during acute pancreatitis, the extent of this increase does not necessarily correlate with disease severity. Studies have revealed that individuals with EPI tend to have lower amylase levels compared to those with normal exocrine secretion [22]. This could be linked to the quantity and functionality of acinar cells in the pancreas. However, a more comprehensive understanding of this mechanism would necessitate further research.
This study revealed that the severity levels of AP and RAP were risk factors for PPDM-A, in line with previous studies [23–27]. The severity of AP is largely dependent on the intensity of pancreatic necrosis (PN) [23]. It was suggested in another study that necrosis in the tail of the pancreas poses a higher risk for diabetes development than necrosis in the head or body, given the tail’s higher insulin distribution [28]. Comparatively, patients with AP exhibited a significant increase in total pancreatic volume than those with RAP. Frequent AP attacks can lead to inflammation, causing acinar cell atrophy and a subsequent decrease in pancreatic volume. This shows a certain continuity between a single episode of AP, RAP, and CP with PEI [27]. However, a meta-analysis revealed no significant correlation between RAP and the occurrence of PPDM-A [29]. This could be attributed to the inclusion of only three studies in the analysis, and the fact that most of these studies did not specify whether patients had multiple AP episodes. Hence, future research should focus on conducting more prospective studies to elucidate this relationship.
Our study did have a few limitations that should be taken into consideration. Firstly, our research was only conducted at a single center. Although our model has undergone internal validation, external verification along with data from multiple centers would provide a more robust analysis. Secondly, we did not have access to precise waist circumference measurements for all patients, obliging us to estimate them using a particular formula. Consequently, the CVAI derived based on these estimated waist circumferences may not be entirely accurate. Lastly, given that our study was retrospective, the conclusions drawn should be approached with a degree of caution. We strongly recommend that these findings be further validated through prospective studies.
In conclusion, the study conducted identified CVAI, GLU, RAP, and the severity of AP as independent factors increasing the risk of PPDM-A. The predictive model that we developed using these influential factors demonstrated efficacy in anticipating the risk of PPDM-A. When these factors are detected, it is crucial to act with prudence and initiate early intervention to mitigate the risk of PPDM-A.