Introduction
In 1906, Naunyn defined hepatogenous diabetes (HD) as a type of diabetes secondary to chronic liver disease. Hepatogenous diabetes, which is secondary to liver cirrhosis, is a diverse condition with varying clinical presentations. It is often misdiagnosed and treated as type 2 diabetes. HD is characterized by diabetes resulting from liver function loss, portal hypertension, and pancreatic β-cell dysfunction in patients with liver cirrhosis (LC) [1]. Despite being widely reported in Europe since 1906, HD has not received adequate attention for many years [2, 3]. The subtype of HD is not included in the classification of diabetes proposed by the American Diabetes Association (ADA) [4]. In August 2022, the Chronic Disease Management Branch of the Chinese Medical Biotechnology Association convened experts in the fields of gastroenterology, infectious diseases, endocrinology, and other disciplines to develop an expert consensus on blood glucose management for patients with cirrhosis and diabetes. They divided cirrhosis and diabetes into four types and clearly defined the subtype of HD. HD mainly refers to diabetes mellitus (DM) combined with cirrhosis of etiologies other than nonalcoholic fatty liver disease (NAFLD) [5].
HD has a unique pathogenesis. In LC, the ability to inactivate insulin decreases, and the formation of portal hypertension and collateral circulation leads to some insulin entering the body’s circulation directly through the portal shunt without undergoing inactivation by the liver. Prolonged hyperinsulinemia stimulates insulin receptors in the liver, muscles, and adipose tissue, causing downregulation of insulin receptors. Additionally, in cirrhosis, the liver’s capacity to utilize glucose and synthesize glycogen is reduced, resulting in elevated blood glucose levels. This, in turn, stimulates pancreatic β-cells to secrete excess insulin to compensate for impaired glucose utilization in liver and muscle tissue. The decreased clearance of advanced glycosylation end products (AGEs) and hypoxemia associated with hepatopulmonary syndrome in cirrhosis patients can also induce insulin resistance and islet β-cell insufficiency. In the development of HD, the “toxic” effect of liver dysfunction on islets plays a significant pathophysiological role [6, 7]. It has been demonstrated that HD is usually reversed or improved after successful liver transplantation, further clarifying the direct relationship between HD development and liver function loss [8].
Diabetes significantly impacts the prognosis and regression of patients with cirrhosis. Compared to cirrhotic patients without diabetes, those with HD have an increased risk of liver disease complications, hepatocellular carcinoma, and all-cause mortality [5]. There are no specific treatment guidelines for HD, and it is managed according to the general principles of type 2 diabetes mellitus (T2DM) [9]. HbA1c is a widely used indicator for blood glucose monitoring, mainly reflecting blood glucose control over the past 3 months. HbA1c > 7% is defined as poor glycemic control, while HbA1c ≤ 7% is defined as good glycemic control [10]. When administering hypoglycemic therapy, factors such as the patient’s hepatic function, Child-Pugh classification and the pharmacokinetics of the drug should be taken into account [11]. Consequently, the present study was designed to analyze the risk factors associated with the development of HD and to investigate glycemic control under different glucose-lowering prescription patterns.
Material and methods
Patients and groups
This retrospective case-control study enrolled patients admitted to Qilu Hospital of Shandong University, Shandong Provincial Hospital Affiliated to Shandong First Medical University, and the First Affiliated Hospital of Shandong First Medical University from September 2017 to August 2022. The inclusion criteria for the HD group were as follows: patients aged 18–75 years with a definitive diagnosis of cirrhosis and diabetes, who developed cirrhosis before the onset of diabetes. Patients were excluded if they had DM prior to cirrhosis, showed autoimmune markers associated with type 1 DM, had abnormal glucose metabolism due to thiazide diuretics, glucocorticoids, antihypertensive drugs, contraceptives, etc., had primary DM or secondary DM, caused by adrenal, thyroid, pancreatic, pituitary, or renal disease, had other chronic conditions such as chronic kidney disease, had malignancies, or had a history of previous liver or pancreas transplantation. For the non-HD control group, participants were aged between 18 and 75, had a clear diagnosis of cirrhosis, and no previous history of diabetes. They were excluded if they had other chronic conditions such as chronic kidney disease, had malignant tumors, or had a previous history of liver or pancreas transplantation. Patients in the HD group with HbA1c were screened and categorized into three groups based on their most recent glucose-lowering treatment regimen: treatment group 1 (oral hypoglycemic agents alone), treatment group 2 (insulin injections alone) and treatment group 3 (insulin combined with oral agents).
Data collection
For the grouped cohorts, we gathered basic demographic data such as gender, age, body mass index, smoking habits, alcohol consumption, and medical history related to cirrhosis and diabetes, as well as laboratory test results from both groups. The laboratory parameters included alanine aminotransferase (ALT), aspartate aminotransferase (AST), γ-glutamyl transpeptidase (γ-GT), alkaline phosphatase (ALP), blood cholesterol, blood triglycerides, creatinine, and platelets.
Oral glucose-lowering medications
In this study, patients’ oral glucose-lowering drugs included biguanides, α-glucosidase inhibitors (AGI), sulfonylureas, glinides, thiazolidinediones (TZD), sodium–glucose cotransporter-2 inhibitor (SGLT2i), and dipeptidyl peptidase-4 inhibitors (DPP-4i).
Statistical analysis
Data analysis was performed using IBM SPSS Statistics 26.0 (IBM Corp., USA). To study the clinical characteristics of patients with HD, normally distributed continuous variables were reported as mean ± standard deviation and compared using Student’s t-test. Non-normally distributed continuous variables were presented as median (interquartile range, IQR) and compared using the Mann-Whitney U test. Categorical variables were presented as frequencies (percentages, %), and were compared using the χ2 test or Fisher’s exact test. In the context of binary logistic regression analyses, the outcome variables were dichotomized, with cirrhosis assigned a value of 0 and hepatogenous diabetes assigned a value of 1. Variables with a p-value of less than 0.15 in the univariate logistic regression analyses were included in the model. A multifactor logistic regression model was constructed, incorporating age, sex, body mass index (BMI), history of smoking, duration of cirrhosis, history of vertical transmission of hepatitis B virus (HBV), history of endoscopic treatment, splenomegaly, Child-Pugh classification, ALT, ALP, blood triglyceride, and creatinine. A two-sided test with a p-value of less than 0.05 was considered statistically significant.
Results
Comparison of baseline information between the non-HD group and HD group
After strict screening of inclusion and exclusion criteria, the HD group comprised 327 patients, while the non-HD group included 329 patients. Age (≤ 50 vs. > 50 years old, p = 0.007), BMI (24.64 ±3.27 vs. 23.99 ±3.45 kg/m2, p = 0.014), and the proportion of male patients (73.4% vs. 63.2%, p = 0.005) were significantly higher in the HD group than in the non-HD group. There were no statistically significant differences in smoking history (p = 0.131) and alcohol consumption (p = 0.573) between the two groups. The duration of cirrhosis was significantly longer in the HD group than in the control group [4.00 (1.50, 10.00) vs. 1.50 (0.25, 4.00) years, p < 0.001]. The HD group had a higher proportion of patients with a history of vertical transmission of HBV (17.1% vs. 7.9%, p < 0.001) compared to the non-HD group. There was a statistically significant difference in the Child-Pugh classification of liver function between the HD and non-HD groups (grade A: 39.4% vs. 60.2%, grade B: 40.1% vs. 28.9%, grade C: 20.5% vs. 10.9%, p < 0.001). There were no statistically significant differences in the history of endoscopic treatment (38.5% vs. 45.6%, p = 0.067) and the prevalence of esophageal varices between the two groups (78.6% vs. 82.7%, p = 0.957). The etiological composition ratio differed significantly between the HD group and the non-HD group (p = 0.034). There were no significant differences in the levels of ALT, AST, GGT, ALP, and cholesterol between the two groups. Patients in the HD group had significantly higher triglyceride levels (0.95 ±0.57 vs. 1.75 ±1.53 mmol/l, p < 0.001) and creatinine levels (64.95 ±23.56 vs. 61.60 ±14.24 µmol/l, p = 0.028) than controls. Platelet counts were not significantly different between the two groups (114.06 ±88.83 vs. 109.02 ±83.00 × 10⁹/l, p = 0.450) (Table I).
Table I
Comparison of baseline information between the non-HD group and HD group
Multivariate logistic regression analysis of HD
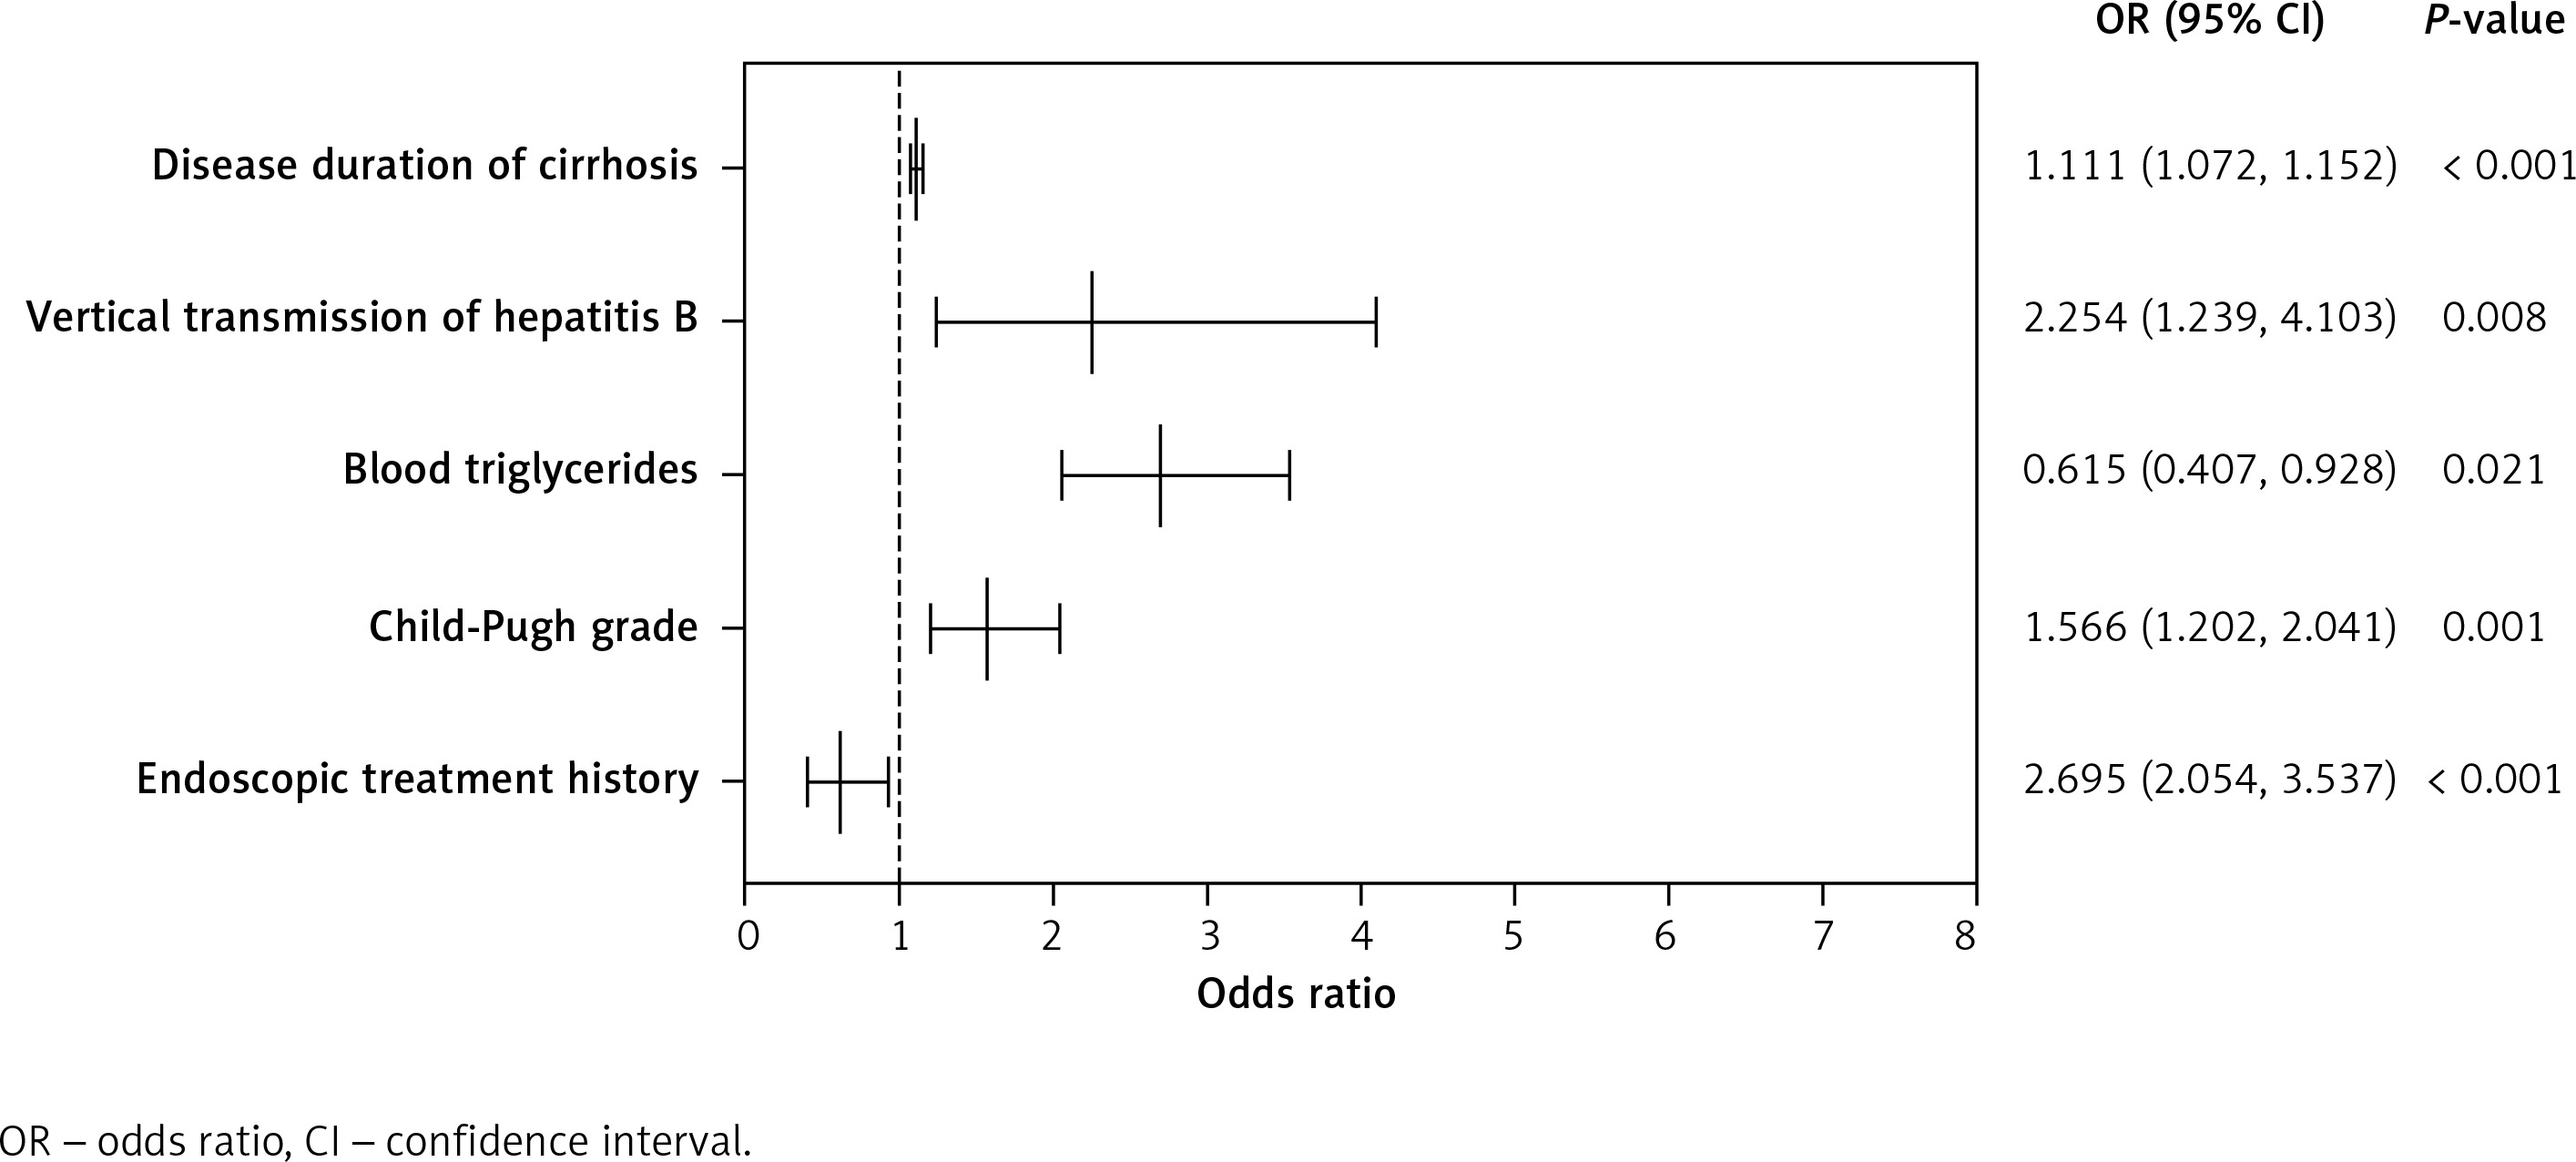
A multifactor logistic regression model was constructed using age, gender, BMI, smoking history, vertical transmission of HBV, duration of LC, endoscopic history, splenomegaly, Child-Pugh grade, ALT, ALP, blood triglycerides, and creatinine. The results (Table II) showed that the longer the duration of cirrhosis was, the higher was the risk of HD, and this difference was statistically significant (OR = 1.111, 95% CI: 1.072–1.152, p < 0.001). Vertical transmission of HBV increased the risk of HD (OR = 2.254, 95% CI: 1.239–4.103, p = 0.008). An increase in Child-Pugh grade was associated with a higher risk of HD, with a statistically significant difference (OR = 1.566, 95% CI: 1.202–2.041, p = 0.001). Higher blood triglyceride levels were associated with a higher risk of HD (OR = 2.695, 95% CI: 2.054–3.537, p < 0.001). A history of endoscopic treatment reduced the risk of developing HD, with a statistically significant difference (OR = 0.615, 95% CI: 0.407–0.928, p = 0.021) (Figure 1).
Table II
Multivariate logistic regression analysis of HD
| Variables | Univariable | Multivariable | ||||
|---|---|---|---|---|---|---|
| OR | 95% CI | P-value | OR | 95% CI | P-value | |
| Age (> 50 years) | 1.580 | (1.134, 2.201) | 0.007 | 1.519 | (1.000, 2.309) | 0.050 |
| Male | 1.605 | (1.151, 2.237) | 0.005 | 1.589 | (0.969, 2.606) | 0.066 |
| BMI [kg/m2] | 1.059 | (1.011, 1.109) | 0.015 | 1.045 | (0.988, 1.105) | 0.122 |
| Smoking history | 1.275 | (0.930, 1.748) | 0.132 | 0.795 | (0.510, 1.238) | 0.310 |
| Drinking history | 0.915 | (0.671, 1.247) | 0.573 | |||
| Age of diagnosis [years] | 0.993 | (0.979, 1.008) | 0.385 | |||
| Cirrhosis staging | 0.867 | (0.311, 2.419) | 0.785 | |||
| Cause* | 0.162 | |||||
| Disease duration of cirrhosis [years] | 1.085 | (1.055, 1.117) | < 0.001 | 1.111 | (1.072, 1.152) | < 0.001 |
| Vertical transmission of hepatitis B | 2.408 | (1.471, 3.943) | < 0.001 | 2.254 | (1.239, 4.103) | 0.008 |
| Endoscopic history | 0.748 | (0.548, 1.021) | 0.067 | 0.615 | (0.407, 0.928) | 0.021 |
| Splenomegaly | 0.719 | (0.478, 1.082) | 0.114 | 1.013 | (0.593, 1.730) | 0.961 |
| Esophageal and gastric varices | 1.010 | (0.696, 1.467) | 0.957 | |||
| Child-Pugh grade | 1.784 | (1.435, 2.220) | < 0.001 | 1.566 | (1.202, 2.041) | 0.001 |
| alanine aminotransferase [U/l] | 1.003 | (1.000, 1.007) | 0.087 | 1.000 | (0.996, 1.004) | 0.956 |
| Aspartate aminotransferase [U/l] | 1.000 | (0.996, 1.033) | 0.821 | |||
| γ-glutamyl transpeptidase [U/l] | 1.001 | (0.999, 1.002) | 0.359 | |||
| Alkaline phosphatase [U/l] | 1.002 | (0.999, 1.004) | 0.144 | 1.001 | (0.998, 1.004) | 0.569 |
| Blood cholesterol [µmol/l] | 1.001 | (0.984, 1.017) | 0.926 | |||
| Blood triglycerides [µmol/l] | 2.179 | (1.736, 2.736) | < 0.001 | 2.695 | (2.054, 3.537) | < 0.001 |
| Creatinine [µmol/l] | 1.009 | (1.001, 1.018) | 0.030 | 1.005 | (0.994, 1.016) | 0.346 |
| Platelets [×109/l] | 0.999 | (0.998, 1.001) | 0.450 | |||
Cohort-specific glucose-lowering treatment regimens
Table III illustrates the hypoglycemic treatment plans for individuals diagnosed with HD. Among the 114 patients in this cohort, 47 (41.23%) were solely administered with oral glucose-lowering agents, known as group 1. Within this group, 30 patients received a single oral hypoglycemic agent, 16 patients were subjected to a combination of two oral hypoglycemic agents, and 1 patient received the prescription of three oral hypoglycemic medicines. Insulin alone (group 2) was administered as a glucose-lowering therapy to 46 (40.35%) patients. Meanwhile, 21 (18.42%) patients received a combination of insulin and oral medications (group 3). Within group 3, insulin was combined with an oral hypoglycemic agent in 16 patients and with two oral hypoglycemic agents in 5 cases.
Table III
Specific glucose-lowering therapy prescription patterns in patients with HD
| Glucose-lowering treatment strategies | Numbers (N = 114) |
|---|---|
| Group 1 (oral drug therapy): | N = 47 (41.23%) |
| Drug monotherapy: | n = 30 (63.83%) |
| Biguanides* | 21 (70.00%) |
| AGI@ | 5 (16.67%) |
| Sulfonylureas# | 2 (6.67%) |
| SGLT2i$ | 1 (3.33%) |
| DPP-IVi& | 1 (3.33%) |
| Combination of two oral drugs: | n = 16 (34.04%) |
| Biguanides and AGI | 6 (37.50%) |
| Biguanides and sulfonylureas | 6 (37.50%) |
| AGI and sulfonylureas | 1 (6.25%) |
| AGI and DPP-IVi | 3 (18.75%) |
| Multiple oral drug combinations | n = 1 (2.13%) |
| Biguanides, AGI and DPP-IVi | 1 (100.00%) |
| Group 2 (insulin injection therapy): | N = 46 (40.35%) |
| Group 3 (combination of insulin and oral medications): | N = 21 (18.42%) |
| Insulin combined with an oral drug | n = 16 (76.19%) |
| Insulin and biguanides | 9 (56.25%) |
| Insulin and AGI | 7 (43.75%) |
| Insulin combined with two oral drugs: | n = 5 (23.81%) |
| Insulin, biguanides and AGI | 4 (80.00%) |
| Insulin, biguanides and sulfonylureas | 1 (20.00%) |
Glycemic control under different prescription modes of hypoglycemic therapy
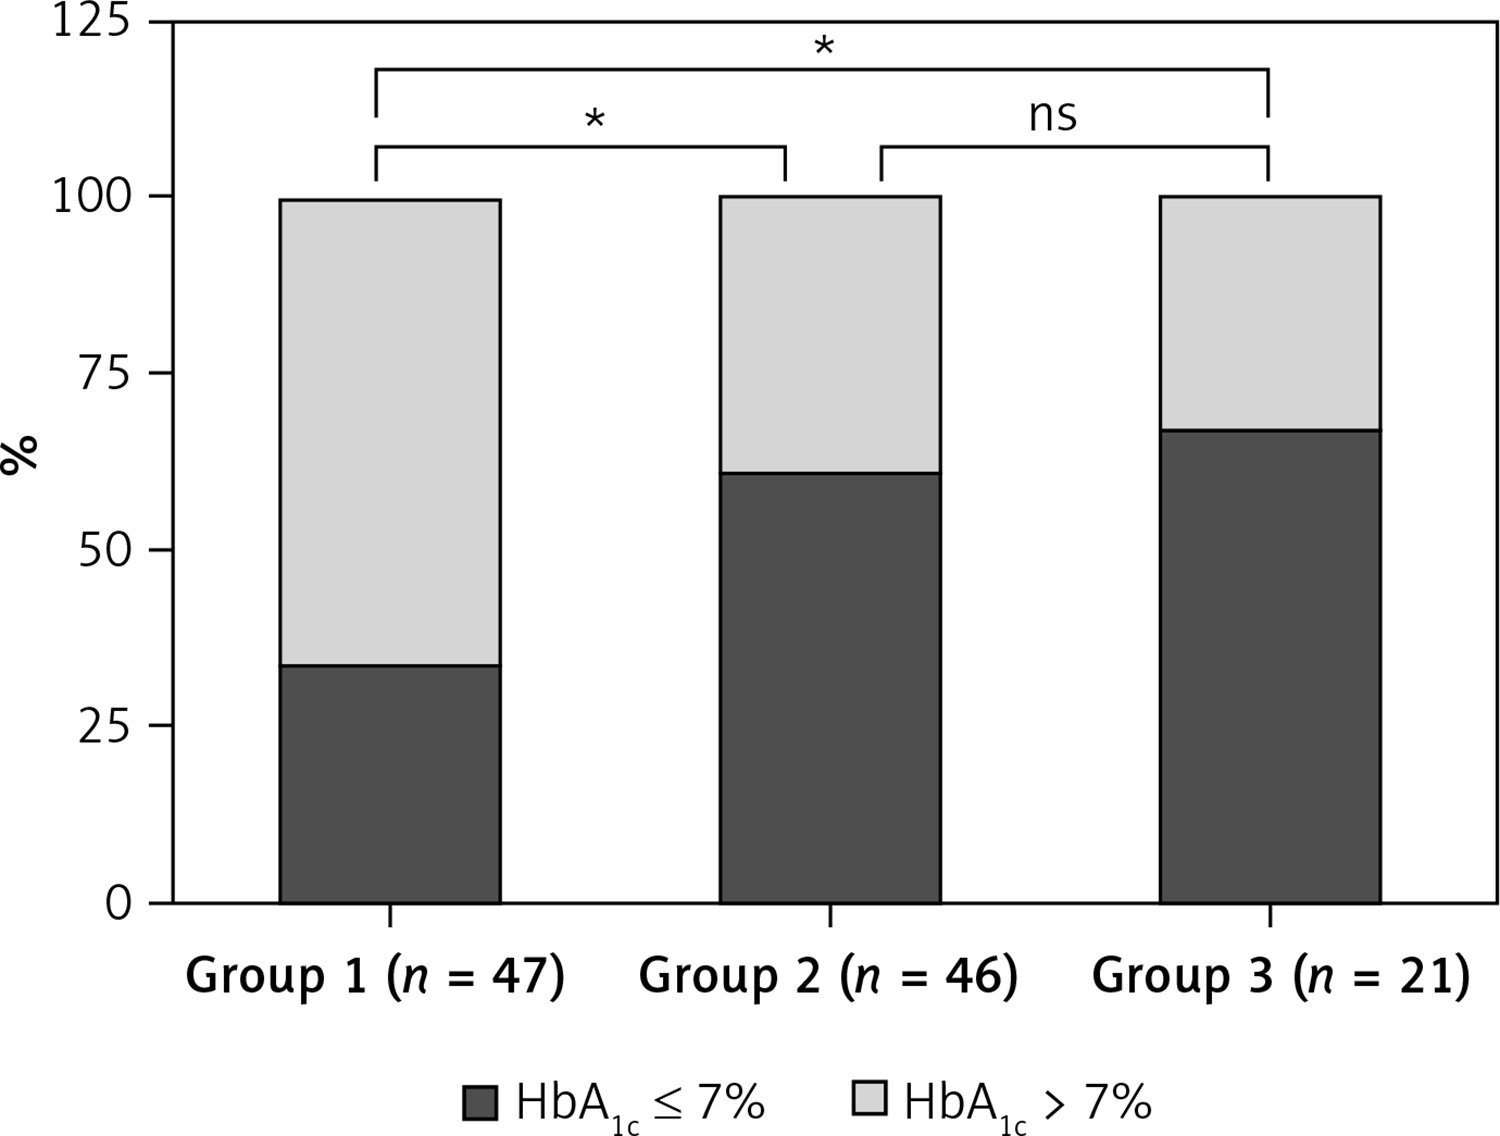
Table IV displays the glycemic control of 114 HD patients under different glucose-lowering therapy prescription patterns. Among the 47 patients in the oral drug therapy group, 16 (34.0%) had good glycemic control (HbA1c ≤ 7%), while 31 (66.0%) had poor glycemic control (HbA1c > 7%). In the insulin injection therapy group, 28 (60.9%) had good glycemic control, and 18 (39.1%) had poor glycemic control. In the combined insulin and oral medication group, 14 (66.7%) had good glycemic control, and 7 (33.3%) had poor glycemic control. A statistically significant difference was observed in glycemic control between the three groups (χ2 = 9.262, p = 0.01). Glycemic control was better in the insulin injection therapy group and combined insulin and oral medication group than in the oral drug therapy group (p1 < 0.05, p2 < 0.05). The difference in glycemic control between patients in the insulin injection therapy group and combined insulin and oral medication group was not statistically significant (p3 > 0.05) (Figure 2).
Table IV
Glycemic control in 114 HD patients with different glucose-lowering treatment prescription patterns
| Group | Total (n) | HbA1c ≤ 7%, n (%) | HbA1c > 7%, n (%) | χ2 test | |
|---|---|---|---|---|---|
| χ2 | P-value | ||||
| Group 1 | 47 | 16 (34.0) | 31 (66.0)*# | ||
| Group 2 | 46 | 28 (60.9) | 18 (39.1)& | 9.262 | 0.01 |
| Group 3 | 21 | 14 (66.7) | 7 (33.3) | ||
Figure 2
Glycemic control in patients with different glucose-lowering treatment prescription patterns. ns: no statistical significance. *P < 0.05. Among the 47 patients in the oral drug therapy group (group 1), 16 (34.0%) exhibited good glycemic control (HbA1c ≤ 7%), while 31 (66.0%) demonstrated poor glycemic control (HbA1c > 7%). In the insulin injection therapy group (group 2), 28 patients (60.9%) exhibited good glycemic control, while 18 (39.1%) patients demonstrated poor glycemic control. In the combined insulin and oral medication group (group 3), 14 (66.7%) patients exhibited good glycemic control, while 7 (33.3%) patients demonstrated poor glycemic control
Discussion
The study identified several key factors contributing to the development of HD in cirrhosis patients. These factors include prolonged duration of cirrhosis, vertical transmission of hepatitis B, higher Child-Pugh classification, and elevated blood triglyceride levels. Additionally, a history of endoscopic treatment emerged as a protective factor against HD. Furthermore, glycemic control was notably improved in patients receiving insulin treatment, either alone or in combination with oral hypoglycemic drugs, compared to those relying solely on oral hypoglycemic agents.
Evidence suggests that HBV infection contributes to the risk of developing diabetes [12], a finding corroborated by our study. Patients with vertical transmission of hepatitis B often experience earlier onset of cirrhosis and prolonged cirrhosis duration, along with severe liver function deterioration. The toxic substances generated during hepatic decompensation impair pancreatic β-cell function, rendering them susceptible to HD. Similarly, HCV infection serves as a risk factor for HD due to its propensity to induce autoimmunity, obstruct insulin receptors with HCV proteins, and exert toxic effects on pancreatic β-cells, culminating in HD development [13]. Notably, alcohol consumption adversely impacts both the liver and pancreas, although our study did not identify it as a risk factor for HD. This discrepancy may be attributed to the predominance of HBV-related cirrhosis cases among our study subjects, with HCV and alcoholic cirrhosis cases representing a minority. Future research employing larger cohorts is imperative to investigate the influence of cirrhosis etiology on HD.
Our research showed that the HD group had a median BMI of 24.64 ±3.27 kg/m2, with many of the patients being overweight. On the other hand, most patients with T2DM were either overweight or obese [14]. The discrepancy in BMI between patients with hepatogenic diabetes mellitus and those with T2DM may be attributed to the fact that most patients with cirrhosis suffer from malnutrition [15, 16]. Energy and protein intake are decreased in patients with cirrhosis, and cirrhotic portal hypertensive gastropathy influences nutrient absorption from the gastrointestinal tract [15]. Patients with cirrhosis are susceptible to small intestinal bacterial overgrowth [17], and these bacteria have the capability of depolymerizing bile acids, which contributes to fat malabsorption [18].
The duration of cirrhosis plays a pivotal role in HD development. As cirrhosis advances, hepatocyte numbers decrease, and their function diminishes. The liver’s capacity to regulate glycogen synthesis and gluconeogenesis wanes and insulin clearance ability is compromised. Furthermore, the development of portal shunts during cirrhosis’s decompensated phase results in insulin entering the circulation without undergoing hepatic inactivation. This cascade ultimately leads to insulin resistance and hyperinsulinemia [19], culminating in HD.
Our study firmly establishes that a higher Child-Pugh grade independently raises the risk of HD in cirrhosis patients. This association is underscored by the increasing prevalence of diabetes across Child-Pugh grades A, B, and C [20]. Notably, patients in the HD group exhibited a higher proportion of Child-Pugh grade B and C, correlating with worse β-cell function but sustained insulin sensitivity. The severity of cirrhosis significantly correlates with HD prevalence, with HD potentially serving as a marker of liver deterioration.
Elevated blood triglyceride levels emerged as a risk factor for HD development. Notably, triglyceride levels exhibit a positive correlation with insulin resistance [21]. Elevated blood triglycerides stimulate increased fat mobilization, raising circulating free fatty acid and metabolite levels. This, in turn, inhibits insulin signaling in the liver, muscles, and pancreatic β-cells, leading to insulin resistance [22]. Furthermore, increased fat mobilization results in increased glyceraldehyde 3-phosphate production, which, via the gluconeogenic pathway, contributes to elevated blood glucose levels. Elevated blood glucose levels exacerbate insulin resistance, ultimately precipitating diabetes.
Patients with LC are at an increased risk of developing esophageal and gastric varices (EGV), with endoscopic treatment proving effective in preventing bleeding from these varices. Our study conclusively established that a history of endoscopic treatment significantly reduces the risk of HD. HD severity closely aligns with liver function. Research indicates that endoscopic treatment notably enhances peripheral blood cell count, albumin concentration, coagulation function, and Child-Pugh scores [23]. Additionally, endoscopic treatment in LC patients with EGV reduces portal vein pressure and mitigates portosystemic shunting [24]. These improvements in liver function and reduced portal shunting enhance insulin clearance by the liver, consequently reducing organism-wide hyperinsulinemia and the incidence of insulin resistance in LC patients.
Nonetheless, no specific guidelines exist for HD treatment, with the current approach following general principles for T2DM [9]. While most HD patients possess a normal BMI, calorie restriction is recommended for those with a BMI ≥ 25 kg/m2. Moderate physical activity enhances insulin sensitivity, and weight loss of 5–10% improves metabolism, while a 10–15% reduction in weight exerts a more pronounced ameliorative effect on diabetes [25–27].
Selection of appropriate hypoglycemic agents hinges on the patient’s hepatic and renal function, as well as the drug’s pharmacokinetics. Metformin is the first line T2DM treatment, with suitability extending to Child-Pugh class A patients and contraindication in cases of renal insufficiency. Moreover, metformin has been shown to reduce mortality risk in cirrhosis patients. In a study involving 7249 individuals with chronic viral hepatitis C, the 5-year cumulative incidence of hepatocellular carcinoma was lower in metformin users compared non-metformin users (2.6% vs. 10.9%) [28].
Close monitoring of liver function is required when employing thiazolidinediones (TZD), sulfonylureas, glargine analogs, glucagon-like peptide-1 receptor agonists (GLP-1RA), DPP-4i, and SGLT-2i [19, 29, 30]. Only 9 patients in the oral hypoglycemic agent alone group in our study used sulfonylureas, 2 used DPP-4i and 1 used SGLT2i. The primary negative consequence of sulfonylureas is hypoglycemia, which mainly occurs by binding to plasma albumin. Hypoglycemia can be more likely to occur in patients with cirrhosis, due to their lower plasma albumin levels and the consequent increased concentration of unbound drugs in the plasma when using these medications [29]. AGI have proved to be relatively safe and are suitable for HD patients with predominantly postprandial hyperglycemia; however, they have a limited impact on reducing glycated hemoglobin. SGLT-2i improves hypertriglyceridemia and obesity, but it is primarily metabolized in the liver via glucuronidation. A positive correlation exists between SGLT-2 accumulation in the body and worsened liver function. The extent of liver impairment in patients must be considered when administering such drugs.
Insulin is considered the safest and most efficacious hypoglycemic treatment for cirrhosis patients with concomitant DM, especially those with moderate to severe hepatic impairment [31]. Insulin analogs, metabolically independent of hepatic insulinase, obviate the need for dose reduction in liver-compromised individuals [9]. The use of insulin is permitted in all stages of cirrhosis, and insulin is the treatment of choice for patients with cirrhosis combined with diabetes. Insulin is permissible at all stages of cirrhosis and is the preferred treatment for patients who have cirrhosis and diabetes. Our study concludes that insulin may be a suitable therapy for HD. Nonetheless, insulin usage should be individualized, with serum insulin concentration monitoring and precautions against hypoglycemic events [5].
Our study is subject to certain limitations. Firstly, some study subjects lacked comprehensive medical history information, and most patients did not undergo HbA1C testing, limiting further exploration of glycemic control. Secondly, anemia is prevalent in cirrhosis patients and may impact HbA1c readings. However, no definitive tool for assessing glycemic control in HD exists, necessitating our use of HbA1c as an indicator. Additionally, most hospitalized patients were in the decompensated phase of cirrhosis, rendering our conclusions more applicable to patients in this state. Future research should include broader, multicenter, large-sample, randomized controlled clinical studies to investigate HD risk factors and management strategies more deeply. Furthermore, a multidisciplinary approach is required for effective treatment protocol implementation.