
Introduction
Nowadays, clinical investigations have spread across various areas of research fields [1, 2]. Recently, clinical research has also considered the interesting topic of evaluating the role of oxidative stress (OS) in the development and progression of autoimmune diseases (ADs). Over 81 disorders are classified as AD and occur when an immune response to self-antigens results in damage or dysfunction to tissues [3]. ADs include a very diverse range of pathophysiological mechanisms and clinical consequences [3]. Regardless of the clinical picture, all ADs go through sequential phases of asymptomatic initiation and propagation, which may be accompanied by the presence of autoantibodies (AAb) [4]. AAb are a serological hallmark of AD and detection of AAb is often used to establish an early diagnosis in patients with clinical symptoms. However, AAb are often found in otherwise healthy individuals, but usually with low titers [5–7]. The etiology of AAb formation is not yet fully understood. There are many suspected factors that increase the risk of developing AAb including sex (more common in women) [6, 8–10], genetic predisposition (most of the polymorphisms are located in regulatory regions of genes whose products are believed to play roles in immune responses) [4, 11, 12], defective removal of apoptotic cells [13–18] and various environmental factors such as infections [19, 20], oxidative stress [21–26], physical and chemical agents [15, 21, 27–29], as well as stressful life events [30]. However, regardless of the initial cause, the development of autoimmunity always occurs when there is breakdown in the regulation of B-cell or T-cell activation threshold and abnormal survival of autoreactive lymphocytes [4, 31–39].
As mentioned above, one of the factors that may play a role in the development and course of AD is oxidative stress. Reactive oxygen species (ROS), present in acute or chronic OS, can lead to changes in the antigenic structure of macromolecules, causing the immune system to treat them as “neo-antigens” [16, 32, 35, 40–45]. Because the antigens are products of oxidation, e.g. lipid peroxidation in the case of oxidized phospholipids (OxPL) and malondialdehyde-modified structures [46–48], or direct oxidative damage of proteins [49–51], we refer to them as oxidation-specific epitopes (OSEs). In recent years it has become increasingly apparent that OSEs are recognized by the pattern recognition receptors (PRR) of the innate immune system [16, 17, 44, 46, 52]. It is thought that the remaining mechanisms of the innate immune system (molecular mimicry, epitope spreading and natural autoantibody (NAAb) production) play a pivotal role in the process of AAb formation [4, 23, 24, 41, 53]. For example Chou et al. have shown that approximately 30% of all natural IgM antibodies, secreted by a subset of B1 cells target OSEs [44]. Epitope spreading (also epitope drift) is the spread of antigenicity from a given epitope to other parts of the protein or other proteins [41, 43]. Thus, altered molecules, with sufficient homology to the native protein antigens, can result in the production of specific autoantibodies and lead to the development of AD [41, 42, 44, 54–64]. Systemic autoimmune rheumatic diseases (SARDs) are an important group of ADs. According to current recommendations, when diagnosis of a SARD is suspected, the indirect immunofluorescence assay (IFA), using human epithelial larynx cancer cell line (HEp-2) as a substrate, is the gold standard screening test [65–70]. This approach determines the concentration of antinuclear antibodies (ANA) and the type of pattern staining. When high autoantibody titers are detected and are accompanied by clinical signs, connective tissue disease is very likely [70, 71].
Previous studies have shown that patients with clinical manifestations of SARD and high titers of ANA also have increased OS [41, 72]. Recent research has demonstrated that several biomarkers of OS (such as malondialdehyde (MDA), a marker of lipid peroxidation) are found at higher levels in the blood of systemic sclerosis (SSc) and rheumatoid arthritis (RA) patients than in controls [49, 73, 74]. Conversely, the concentration of protein thiol groups (PSH) and the activity of superoxide dismutase (SOD) have been shown to be decreased in RA, SSc and systemic lupus erythematosus (SLE) [74–80]. These observations are consistent with enhanced inflammation, initiated by an autoimmune response. However, it is not known whether the presence of autoantibodies, at low titers is associated with changes in OS markers. Nor is it clear whether OS contributes to AAb formation. Therefore, this study was designed to evaluate the relationship between OS markers and the detection of ANA.
Material and methods
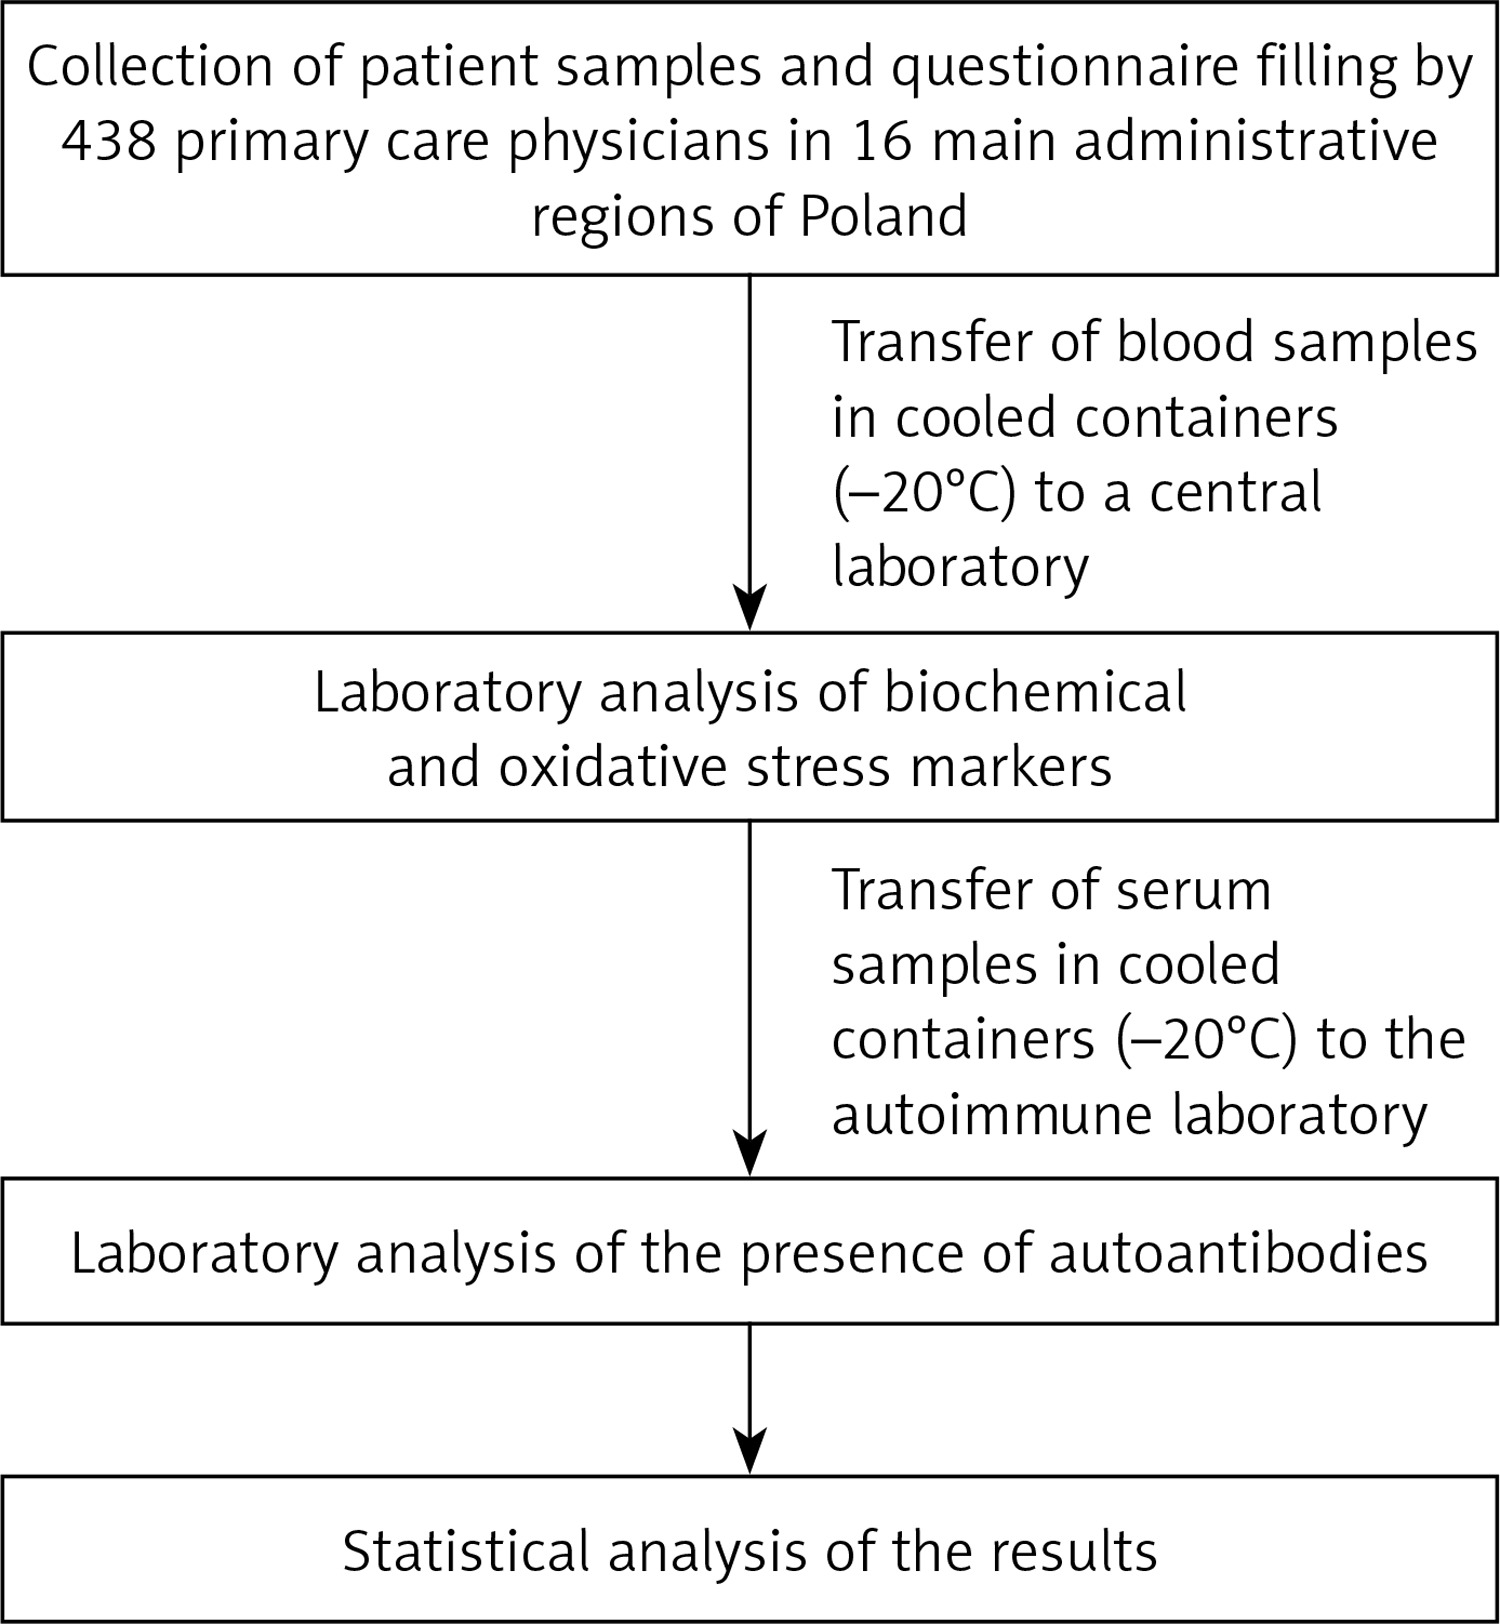
A simplified scheme of the study is shown in Figure 1.
Design
A nationwide observational, cross-sectional study was carried out in Poland in the fourth quarter of 2015 and the first and second quarters of 2016.
Sampling
This study is part of a large research program “Nationwide study of cardiovascular health in primary care in Poland – LIPIDOGRAM2015 and LIPIDOGEN2015”, the design and rationale of which have been described in detail previously by Jóźwiak et al. [81]. Briefly, the recruitment was carried out by 438 primary care physicians in 16 major administrative regions of Poland. Physicians/investigators were randomly selected from the Medical Data Management database. The expected number of patients recruited for LIPIDOGRAM2015 study (consecutive samples) was 13,000–14,000 with a random sample of 13–15% (1,700–2,000) enrolled to the LIPIDOGEN2015 sub-study. The program only covered adult patients over 18 years old. Each patient had to complete a questionnaire concerning their medical and family history, concomitant diseases and pharmacotherapy as well as lifestyle factors like alcohol consumption, tobacco smoking, physical activity and use of diet (i.e. hypolipemic, hypoglycemic, hypotensive diets). The following criteria were used in the question on alcohol consumption: moderate drinkers – persons consuming alcohol at a rate of 1–2 units/day (women) or 1-3 units/day (men), with the following conversion factor applied: 1 unit = 10–15 g ethanol = 250 ml beer (glass) = 150 ml wine (glass) = 30 ml vodka (glass); heavy drinkers – people who consume alcohol in quantities greater than those assumed for moderate drinkers and persons who do not consume alcohol at all, or persons who consume alcohol occasionally in amounts significantly less than those assumed for persons with moderate alcohol consumption. The following criteria were used for the tobacco smoking question: smokers – those who had consistently smoked at least 1 cigarette/week in the period preceding the survey; former smokers – those who had permanently given up smoking in at least the last 3 months preceding the survey; non-smokers – those who had never smoked a cigarette. The following criteria were used in the physical activity question: regular physical effort – increased activity of the musculoskeletal system, regularly for 2–2.5 h/week, defined as exercising, walking, running, swimming, playing team games, dancing, and doing housework or household chores; or no regular physical activity – people who do not meet the criteria of regular physical activity; or others who did not provide detailed information on the level of their physical activity. In the question concerning the use of diet (hypolipemic, hypoglycemic, hypotensive) the following criteria were used: use of an appropriate diet – regular consumption of varied low cholesterol foods, moderate consumption of medium cholesterol foods, reduced consumption of saturated fats – in favor of monounsaturated and polyunsaturated fats, reduced consumption of carbohydrates and sweetened drinks, reduced consumption of table salt, increased consumption of fish, increased consumption of fruit and vegetables and fiber-rich foods or no use of an appropriate diet – those not meeting the criteria for following an appropriate diet. Anthropometric measurements (height, body weight, waist circumference, and hip circumference) were performed at the doctor’s office. For all enrolled patients, serum samples were obtained after ≥ 12 h of fasting. On the same day, measurements of blood pressure, heart rate, and fasting glucose were obtained together with the lipid profile. For the LIPIDOGEN2015 sub-study, saliva samples for DNA isolation and blood samples for measurement of glycated hemoglobin, oxidative stress parameters, autoantibody levels, and inflammatory cytokine and apolipoprotein profiles were collected.
For this study we used 1731 serum samples from the abovementioned LIPIDOGEN2015 sub-study. The tested group included 1043 women and 688 men. The blood samples were transferred in cooled containers (–20°C) to a central laboratory (Silesian Analytical Laboratories – SLA in Katowice, Poland) for biochemical analyses and then to the autoimmune laboratory (Euroimmun Poland Ltd. Customer Training Laboratory in Wroclaw, Poland) for ANA determination.
Laboratory analyses
Measurements of total cholesterol (TC), triglycerides (TG), high-density lipoprotein cholesterol (HDL-C), and low-density lipoprotein cholesterol (LDL-C) (made with direct immunological measurement) were performed and carried out using the same methodology by the Siemens Advia 1800 analyser and Siemens reagents (Munich, Germany), within 12 h of obtaining the blood sample. Fasting glycaemia was measured using Bionime glucometers (Taichung City, Taiwan) and Rightest strip tests (Taichung City, Taiwan). HbA1c was assessed using high-performance liquid chromatography (HPLC) performed by Variant II Turbo (Bio-Rad, Hercules, California, USA).
To quantify the intensity of oxidative stress, indices of free-radical damage to lipids and proteins, and enzymatic and non-enzymatic antioxidant system parameters in serum and erythrocytes were measured. In serum, indices of free-radical damage to lipids and proteins included: total oxidant status (TOS) [82], protein thiol groups (PSH) [83] and the concentration of malondialdehyde (MDA) [84]. The activity of superoxide dismutase (SOD) [85] was determined in serum. In addition, parameters of the non-enzymatic antioxidant system, such as total antioxidant capacity (TAC) [86] and the concentration of uric acid (UA) were also determined. The oxidative stress index (OSI-index) was defined as the ratio of the TOS level to TAS level. Specifically, OSI-index (arbitrary unit) = TOS (µmol H2O2 Eq/l)/TAS (µmol Trolox Eq/l) [82].
ANA were detected using an indirect immunofluorescence assay (IFA) employing human laryngeal carcinoma cells (HEp-2) and commercially available Euroimmun Medizinische Labordiagnostika AG (Lübeck, Germany) test kits Mosaic Basic Profile 3 (catalogue number FC 1800-2010-3). Sample incubation was carried out manually, according to the manufacturer’s instructions, except for the fact that 998 samples were diluted with a threshold cut-off 1 : 160 as recommended by the current guidelines [68] and 733 patient samples were diluted with a threshold cut-off 1 : 100 as recommended by the test kit manufacturer’s instructions. The samples were divided into two groups randomly. The results were evaluated on a EUROstar III fluorescence microscope (Carl Zeiss, Oberkochen, Germany). The test results included a qualitative assessment of the presence of ANA, estimation of antibody titer, and determination of the characteristic pattern according to the (ICAP) nomenclature [67]. The results of IFA were collected and stored as digital images.
Statistical analysis
Statistical analyses were performed using Statistica 13.3 (StatSoft, Tulsa, USA). Data are expressed as mean ± SD (normal distribution) and as median and range (nonparametric distribution) for continuous variables, and as a percentage for categorical variables. Univariate comparison of markers related to autoimmune diseases according to clinical variables was performed using the Mann-Whitney-U test for nonparametric variables or the χ2 test/Fisher exact tests where appropriate. A two-sided p < 0.05 was considered to indicate statistical significance.
Ethical approval
The study was performed in accordance with the principals outlined in the Declaration of Helsinki [87]. Every patient gave written informed consent to participate. The study was approved by the Bioethical Committee of the Chamber of Physicians (No.K.B.Cz.-0018/2015).
Results
The study included 1731 patients attending primary health care practices (1043 women and 688 men). 1098 people were diagnosed with hypertension, coronary artery disease, dyslipidemia, diabetes, atrial fibrillation, kidney disease or stroke. 649 people were apparently healthy individuals. The mean age of participants was 51 ±13 years and 60.25% were female (Table I). The body mass index (BMI) indicated that the participants were on average slightly overweight [88], and the average waist-hip ratio (WHR) was above the normal range for both men and women [89].
Table I
Characteristics of the population
The ANA test was positive in 260 patients (15.0% of the entire study population). A total of 201 patients had antibody titers determined at screening levels of 1 : 100 (n = 116) or 1 : 160 (n = 85). Only 59 patients had ANA titer higher than the cut-off threshold (1 : 100 or 1 : 160).
The study cohort was analyzed to explore associations between lifestyle factors, lifestyle diseases and the occurrence of ANA. It was found that ANA are more frequently detected in women (71.9% vs. 28.1%, p < 0.001) than in men. The results presented in Table II show that the occurrence of ANA in women is associated with lower physical activity (p = 0.036), less frequent smoking (p = 0.007) and low alcohol consumption (p = 0.024). In case of men, none of the lifestyle-related aspects analyzed were associated with the presence of ANA. Lifestyle diseases were not associated with the presence of ANA in either women or men.
Table II
The occurrence of ANA in relation to lifestyle factors
The analysis of the association between oxidative stress markers and the occurrence of ANA by sex of the subjects showed that ANA positive men had a significant 6% decrease in PSH concentration (p = 0.046) and an 11% increase in MDA concentration (p = 0.047) compared with ANA negative men. In the ANA positive women, on the other hand, changes in the activity of SOD isoenzymes were observed (6% increase in MnSOD activity (p = 0.001) and 8% decrease in CuZnSOD activity (p < 0.001)). Moreover, in ANA positive women, the concentration of UA was 10% higher than in women without these AAb. The results for individual parameters are presented in Table III.
Table III
Levels of oxidative stress markers in ANA positive and negative individuals
[i] ANA – anti-nuclear antibody, HbA1c – hemoglobin A1c, HDL – high-density lipoprotein cholesterol, LDL – low-density lipoprotein cholesterol, MDA – malondialdehyde, OSI-index – oxidative stress index, PSH – protein thiol groups, SOD – superoxide dismutase, TAC – total antioxidant capacity, TC – total cholesterol, TG – triglycerides, TOS – total oxidant status, UA – uric acid.
We also investigated whether the specific pattern types in ANA positive patients differ in relation to sociodemographic parameters and markers of oxidative stress. For most ANA patterns, no significant differences were observed. However, several observations warrant further investigation. In particular, AC-2 positive samples showed a 7% lower activity of the CuZnSOD isoenzyme (p = 0.044), a 5% lower concentration of UA (p = 0.035) and a lower TAC (p = 0.007) compared with the other ANA positive samples. Autoantibodies associated with the AC-21 pattern were observed more commonly in individuals with less physical activity (p = 0.005), diagnosed coronary artery disease (p = 0.013), previous myocardial infarction (p = 0.049) or dyslipidemia (p = 0.032) than in other ANA positive patients. In AC-21 samples, a lower concentration of PSH was also observed (p = 0.038). In men, the AC9/AC10 pattern was very common (p < 0.001) and the AC4/AC5 pattern was much less common (p = 0.027) compared to other ANA positive patients. In patients displaying the AC4/AC5 pattern, a lower intensity of oxidative stress (a 32% lower OSI-index) was observed compared with other ANA positive patients (p = 0.023). All the selected parameters for which significant differences were observed, are presented in Tables IV and V.
Table IV
The relationship between selected lifestyle factors and ANA pattern staining
Table V
The relationship between oxidative stress markers and ANA pattern staining
Discussion
The observed relationships between some markers of oxidative stress, and ANAs support the hypothesis that oxidative stress may be associated with an increased likelihood of ANA formation. It is possible that oxidative stress and the associated increase in ROS levels may initiate the formation of some autoantibodies but not others. Some ANA may be remnants of a previous local increase in oxidative stress in cells or tissues which has subsequently resolved. Hence we observed changes indicative of an increase in oxidative stress for only some markers.
The aim of this study was to determine whether there is an association between OS and the presence of ANA. However the data collected from participants additionally allowed us to assess whether the lifestyle factors or the lifestyle diseases affecting patients are associated with the presence of ANA. We detected ANA in 15.02% of the tested samples. This result is similar to the results obtained by others using similar cut-off thresholds [68, 90]. Moreover, ANA were more frequently detected in women (71.9%, p < 0.001), therefore in subsequent analyses we took the influence of sex into account.
In the Polish population, the prevalence of the diseases of civilization, such as cardiovascular diseases (CVD) and often related lipid disorders, is high, and many different risk factors related to patients’ lifestyles are responsible for their development [91, 92]. The data presented in Table II show that the occurrence of lifestyle diseases is not associated with an increased probability of developing ANA, even when sex differences are taken into account. This finding agrees with the lack of association between ANA and selected cardiovascular and metabolic diseases observed in a German population [8]. In addition, studies conducted in Japan found no association between BMI, diabetes, hypertension and the presence of ANA [93]. However, we note that for some autoantibodies, e.g. those resulting in the AC-21 pattern, there may be exceptions to this rule, as will be discussed later. We also observed that individuals who declared regular physical activity were less likely to show positive ANA (p = 0.025). This observation supports the thesis that physical activity is beneficial to the maintenance of health, and that the health benefits of exercise may extend to reducing the risk of autoantibody formation and the subsequent development of autoimmune diseases.
Surprisingly, in our cohort, women who declared cigarette smoking and alcohol drinking were less likely to have ANA (p = 0.007 and p = 0.024, respectively) which stands in contrast to the fact that many studies have shown a linkage between smoking and the increased likelihood of autoimmune diseases, such as rheumatoid arthritis (RA), multiple sclerosis (MS), and systemic lupus erythematosus (SLE) [94–98]. Nevertheless, if we consider that the percentage of smokers is much lower in the group of women than in the group of men, and that women are more likely to have autoantibodies, such a surprising result may be the effect of an unfavorable combination of these two factors.
In the present study, more than three-quarters of ANA positive samples had a low antibody titer, around the cut-off level. Nevertheless, in the group of ANA positive men, a significantly lower PSH concentration and a higher MDA concentration was observed. In the case of ANA positive women, higher UA levels and small differences in the activity of SOD isoenzymes were observed. These phenomena may support the thesis outlined in the introduction that local OS and oxidation-specific epitopes (OSEs) formed under such conditions may play a role in the formation of autoantibodies. Interestingly, no significant changes in global OS markers such as TAC, TOS and OSI-index were observed in the study group, which may indicate the lack of active inflammatory process caused by the presence of ANA. Therefore, we cannot exclude the possibility that the observed differences only seen in some parameters of OS may indicate its local character, or may be remnants of a recently resolved increase in OS. In addition, some researchers have suggested that autoantibodies may be produced as a result of locally increased OS leading to cell death by apoptosis or necrosis [18, 99, 100]. If this is the case, the immune mechanisms involved in the production of autoantibodies might play a role in the removal of protein fragments cleaved from residues formed during cell death and tissue damage [101]. It is important to bear in mind that the development of autoimmune responses is a long-term process. It may take some time from the occurrence of an episode of increased OS and elevated ROS to result in formation of neo-antigens and for immune tolerance to these altered autoantigens to be lost, such that the production of autoantibodies is initiated.
Since mitochondria are one of the main sources of ROS in the body, we were interested to look for associations between antimitochondrial antibodies (AMA) (AC-21 pattern) and the activity of SOD isoenzymes. It is known that the mitochondrial matrix predominantly contains the manganese isoform of superoxide dismutase (MnSOD) [102, 103]. Our hypothesis was not confirmed. Lower PSH levels were observed in patients with the AC-21 pattern, but this was not associated with an increased antioxidant activity of SOD in the mitochondrial matrix, compared with other ANA positive patients. Again, we can interpret this in two ways. First, there is little evidence of a real onset of OS at this time, but the lower PSH concentrations suggest that such an event may have occurred in the recent past. Second, it was noticed that autoantibodies associated with the AC-21 pattern type were much less frequent in the group of physically active people (p = 0.005) and at the same time were more frequently observed in people suffering from coronary artery disease (p = 0.013), myocardial infarction (p = 0.049) and dyslipidemia (p = 0.032). A healthy lifestyle seems to be associated with a lower likelihood of developing these autoantibodies.
Surprising results were obtained for the AC-2 pattern type. These antibodies were more frequent in patients where particular OS markers such as TAC, CuZnSOD activity and UA had lower values than in other ANA positive patients. The lower TAC is most likely due to a decrease in UA concentration. Could it be that OS has no effect on the formation of these autoantibodies? Interestingly, this type of staining pattern was the most frequently detected type in our study (50% of all ANA positive samples). AC-2 is associated with antibodies recognizing the stress oncoprotein – lens epithelium-derived growth factor p75 (LEDGF/p75), also known as dense fine speckled 70kDa (DFS70) autoantigen. Its clinical significance has not yet been established, but it occurs in apparently healthy individuals and is therefore considered a marker to exclude SARD [104]. This finding has inspired our group to perform further research in this direction, in which we intend to investigate the relationship between oxidative stress and anti DFS70 antibodies.
The present study is limited by the lack of data about the clinical symptoms of SARD among the participants. So we could not compare the results obtained with any clinical manifestations. This information would allow a better analysis of the real relationship between the detected autoantibodies, OS and lifestyle factors. It may be that the lifestyle of patients in whom the presence of ANA is accompanied by a clinical manifestation of an autoimmune disease differs significantly from asymptomatic individuals. Moreover, chronic inflammation, often associated with SARD, may cause significant changes in individual oxidative stress markers.
In conclusion, the observed changes in some oxidative stress markers, in particular an increase in MDA concentration and a decrease in PSH concentration supports the hypothesis that local OS may be associated with a higher probability of ANA formation. At the same time, our data indicate that changes in individual OS markers and their association with ANA are sex-dependent and may only involve some antinuclear autoantibodies. In conclusion, we believe that there is an urgent need for further and more precise research in the field of OS as a trigger, modulator and driver of autoimmune processes. It remains to be clarified which specific autoantibodies are affected by OS and which are not. However, it seems likely that physical activity reduces the likelihood of autoantibody formation.