Glaucoma is a neurodegenerative disease characterized by visual field defects, vision loss, and irreversible apoptosis of retinal ganglion cells. As the world’s largest irreversible blinding eye disease, it is estimated that by 2040 the number of global patients will reach 11.8 billion people [1]. To our knowledge, no study has analysed the global burden of glaucoma using data from the Global Burden of Diseases, Injuries, and Risk Factors Study (GBD) 2019 datasets.
The 2019 GBD includes annual data analyses of 369 diseases and 87 risk factors from 204 countries and regions around the world [2]. In this study, we used data on glaucoma in the GBD database from 1990 to 2019 to analyse the age-standardized disability-adjusted life years (DALY) rates of glaucoma and identify high-risk groups by socio-demographic index (SDI), gender, and age stratification.
Methods
Study data
The data on annual DALY and respective age-standardized rates of glaucoma were derived from the GBD 2019 dataset [2]. The socio-demographic index (SDI), a comprehensive index that includes the per capita gross domestic product, average years of education, and fertility rate to reflect social development, is an important covariate for evaluating disease burden and health development in a certain region [3]. The 204 countries and territories included in the GDB were divided into 5 SDI quintiles (high, high-middle, middle, low-middle, and low levels) [3]. The study was approved by Beilun District People’s Hospital.
Estimation framework
DisMod-MR 2.1, a Bayesian meta-regression modelling tool, was applied to calculate the data and determine the 95% uncertainty intervals (UIs). DALYs caused by glaucoma were calculated as the sum of years of life lost (YLLs) and years lived with disability (YLDs). It includes 2 parts, one is the years of life loss caused by early death (YLLs), and the other is the years of life loss caused by disability (YLDs). Years of life lost (YLLs) were calculated by multiplying cause-specific deaths by standard life expectancy at each age. Years lived with disability (YLDs) were calculated by multiplying prevalence estimates by an appropriate disability weight for mutually exclusive sequelae of diseases and injuries [2]. The commonality between disability and early death is that they reduce human healthy life to varying degrees, and human life is measured in years. Therefore, DALY comprehensively considers the 2 health losses of disability and death in a time unit, and it endows them with social value-oriented information, making it more comprehensive and reasonable to express the impact of diseases on a population’s health, providing a more scientific and reliable basis for determining the main health issues in society.
Statistical analysis
The estimated annual percentage changes (EAPCs) of age-standardized rates were calculated to estimate glaucoma DALY rate trends within a specified time interval with the formula Y = α + βX + ε, because it is assumed that the natural logarithm of age-standardized rate is linear over time. Y is ln (age-standardized rate), X represents the calendar year, and ε is the error term. β determines the positive or negative trends of the age-standardized rate. Therefore, EAPC = 100 × (exp(β) – 1), and 95% confidence intervals (CIs) were obtained from the linear model. When the EAPC and the lower boundary of the CI are positive, the age-standardized rate shows an upward trend. Conversely, when the EAPC and the upper boundary of the CI are negative, the age-standardized rate is in a descending trend. In the absence of these changes, the age-standardized rate remains on a stable trend.
Results
The total worldwide DALYs due to glaucoma in 1990 were 442,181.97 in 1990 and increased to 748,307.71 in 2019. However, the age-standardized DALY rate of glaucoma decreased between 1990 and 2019, with an EAPC of –1.00 (Table I, Figure 1, Supplementary Figure S1). The age-standardized DALY rate of glaucoma also decreased between 1990 and 2019 in both sexes (males: EAPC, –1.14; females: EAPC, –0.91) (Table I, Figure 1, Supplementary Figure S1). However, from 1990 to 2019, the age-standardized DALY rate of glaucoma in males was higher than that in females (Table I, Supplementary Figure S1).
Table I
The age-standardized DALY rate of glaucoma in 1990 and 2019 and its temporal trends
Figure 1
The EAPC of glaucoma age-standardized DALY rates from 1990 to 2019, by sex and region
EAPC – estimated annual percentage change, DALY – disability adjusted life-year.
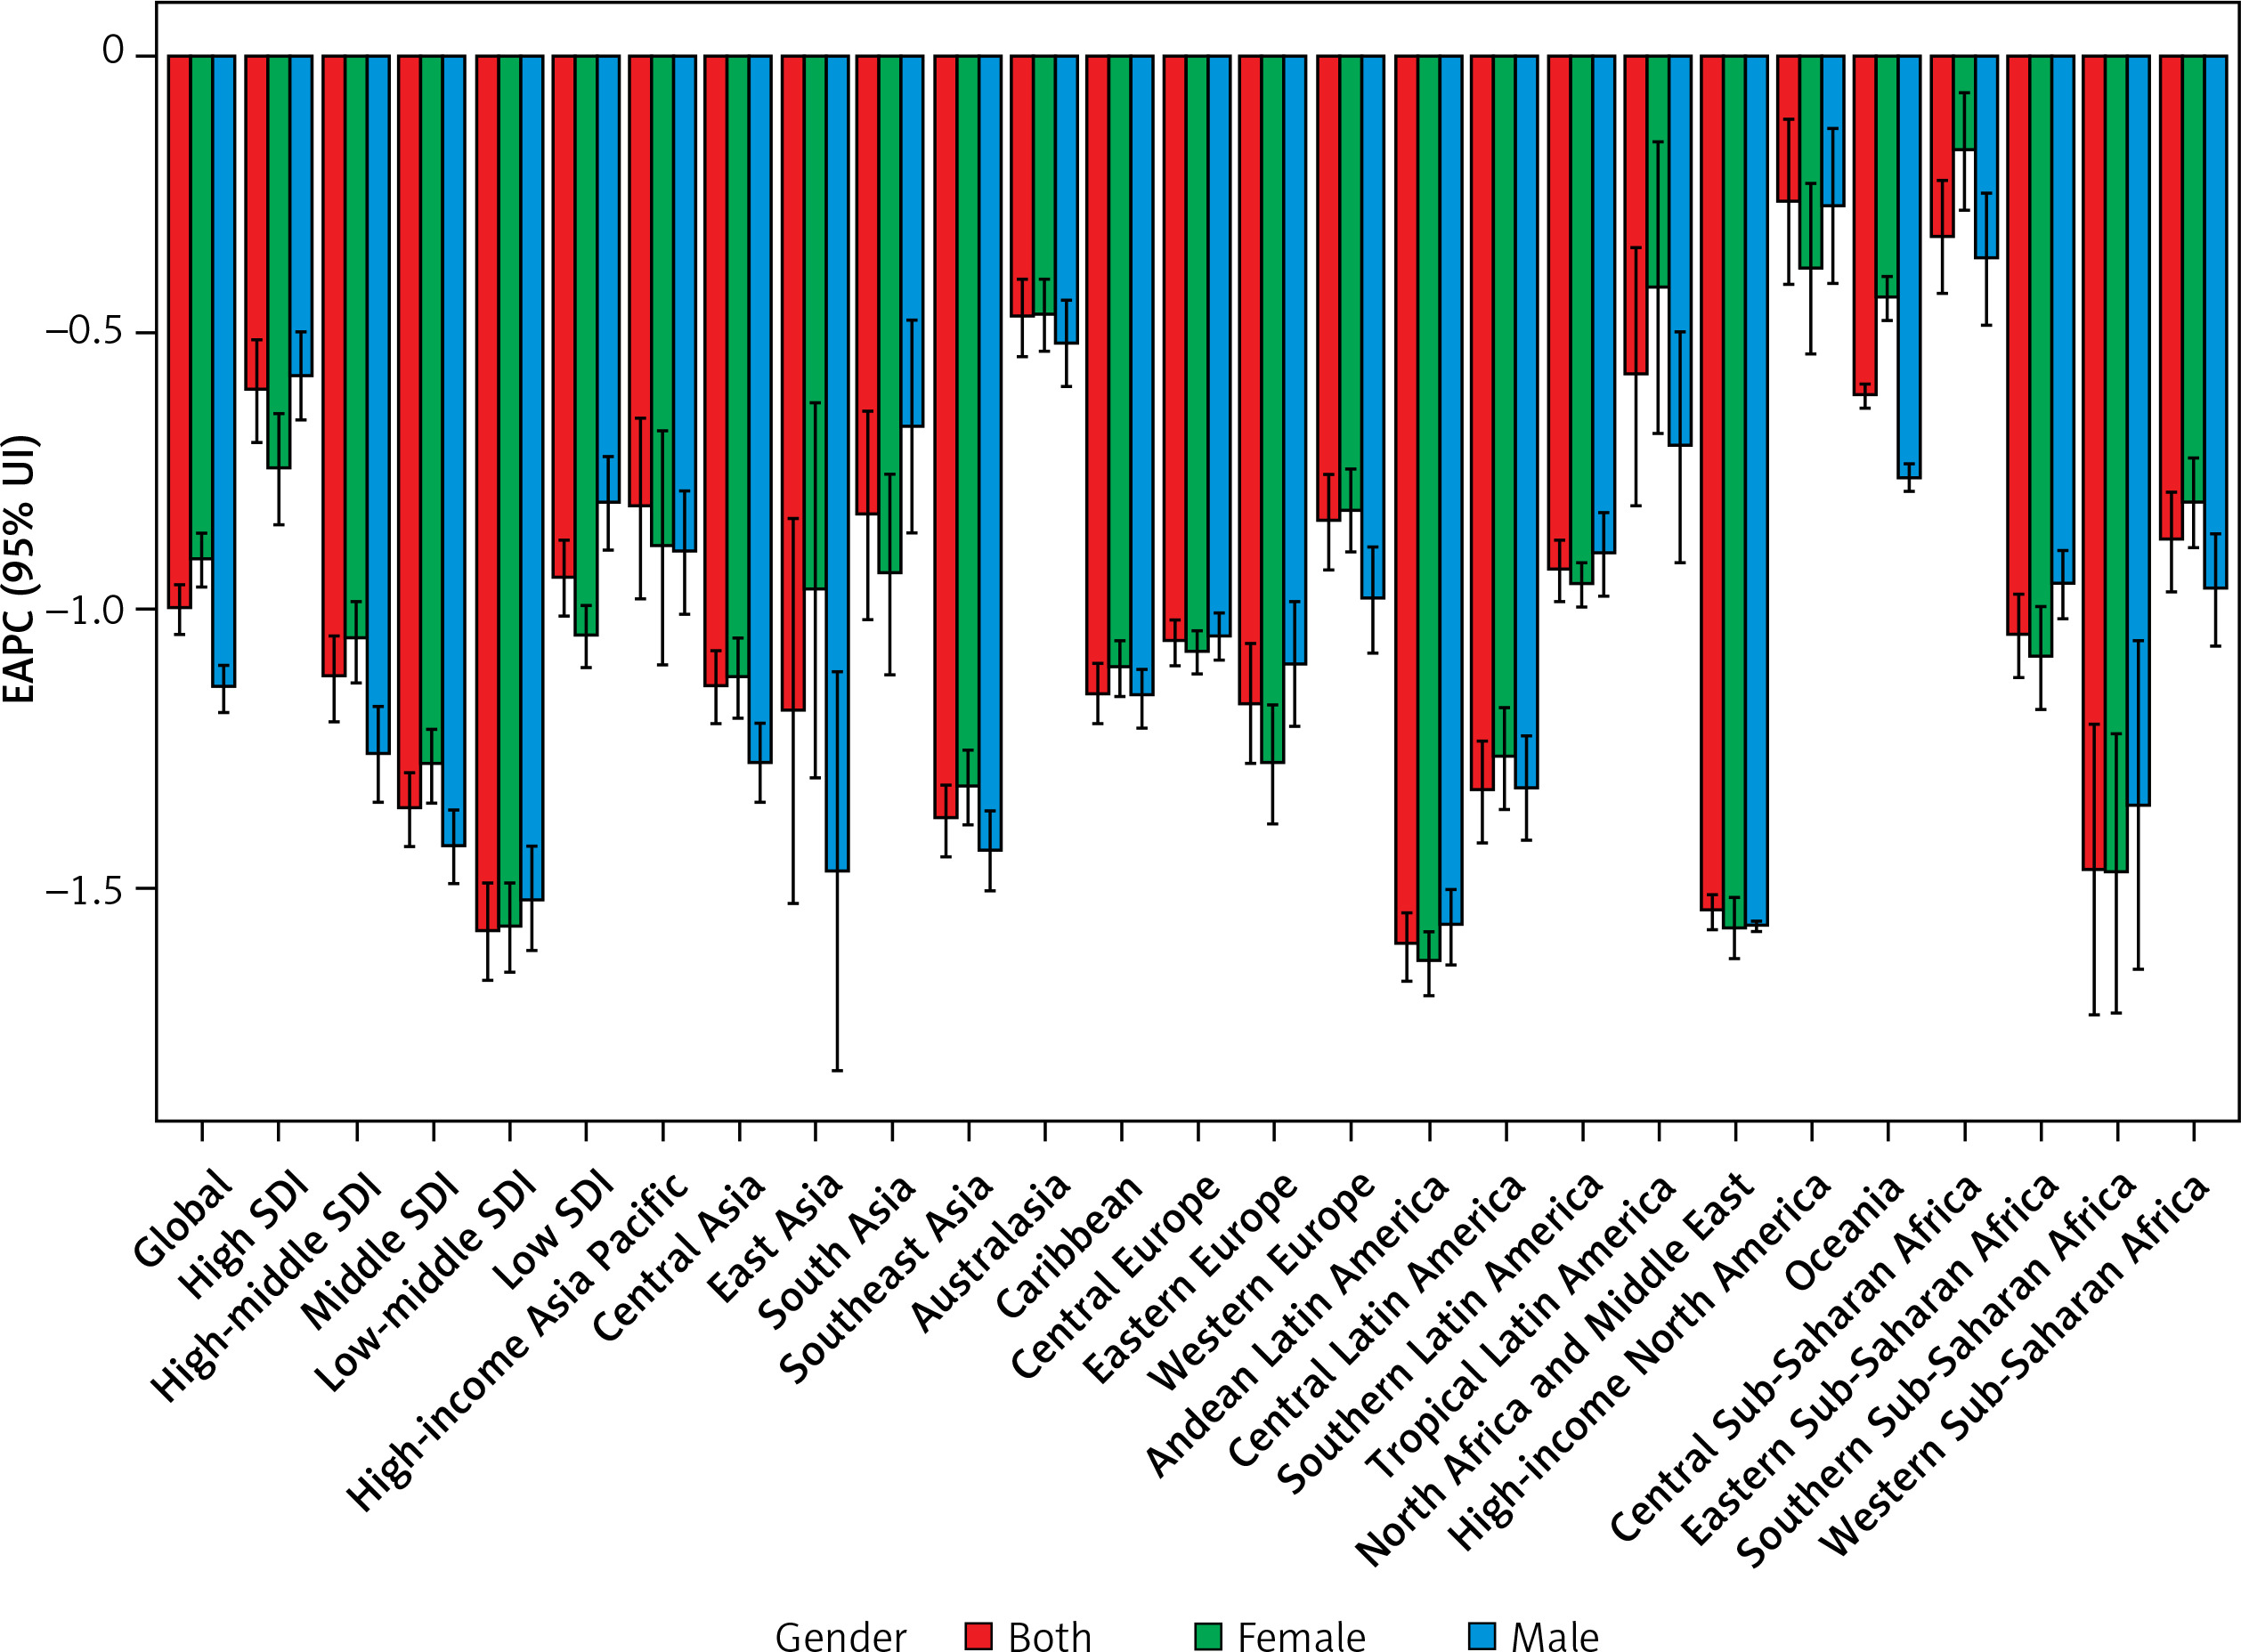
In 2019, the highest number of age-standardized DALYs due to glaucoma was that of the low SDI quintile (21.37), followed by that of the low-middle SDI quintile (11.88) (Table I, Supplementary Figure S1). The number of age-standardized DALYs due to glaucoma decreased in all SDI regions, with the greatest decrease occurring in low-middle SDI regions (–1.58; Table I, Figure 1, Supplementary Figure S1).
In addition, the EAPC of the age-standardized DALY rate due to glaucoma was negatively correlated with the age-standardized DALY rate (ρ = –0.1756, p = 0.0120, Supplementary Figure S2 A) and the SDI (ρ = –0.1761, p = 0.0118, Supplementary Figure S2 B). Regions in which the SDI increased between 1990 and 2019 had similar proportions of glaucoma-related DALYs among different age groups (Supplementary Figure S3). From year to year, the annual proportion of glaucoma-related DALYs increased among older adults (Supplementary Figure S4).
The male-to-female ratio of DALYs peaked in adults aged 90–94 years (Supplementary Figure S5). The difference in the numbers of DALYs due to glaucoma between different age groups increased as their age increased, with a peak in both females and males aged 90–94 years (Supplementary Figure S6 A). In both females and males, the highest numbers of DALYs due to glaucoma were observed in those aged 90–94 years in all SDI regions (Supplementary Figure S6 B–F).
In 2019, the top 3 regions with the highest number of age-standardized DALYs due to glaucoma were Western sub-Saharan Africa (32.52), Eastern Sub-Saharan Africa (30.44), and North Africa and the Middle East (24.04). The regions with the lowest age-standardized DALYs due to glaucoma were Central Europe (3.55), high-income North America (4.38), and Australasia (5.21; Table I and Supplementary Table SII). The number of age-standardized DALYs due to glaucoma decreased in all regions. The number of age-standardized DALYs due to glaucoma decreased most in the Andean Latin America region (EAPC, –1.61), North Africa and the Middle East (EAPC, –1.55), and Southern sub-Saharan Africa (EAPC, –1.47; Table I, Supplementary Table SII and Figure 1).
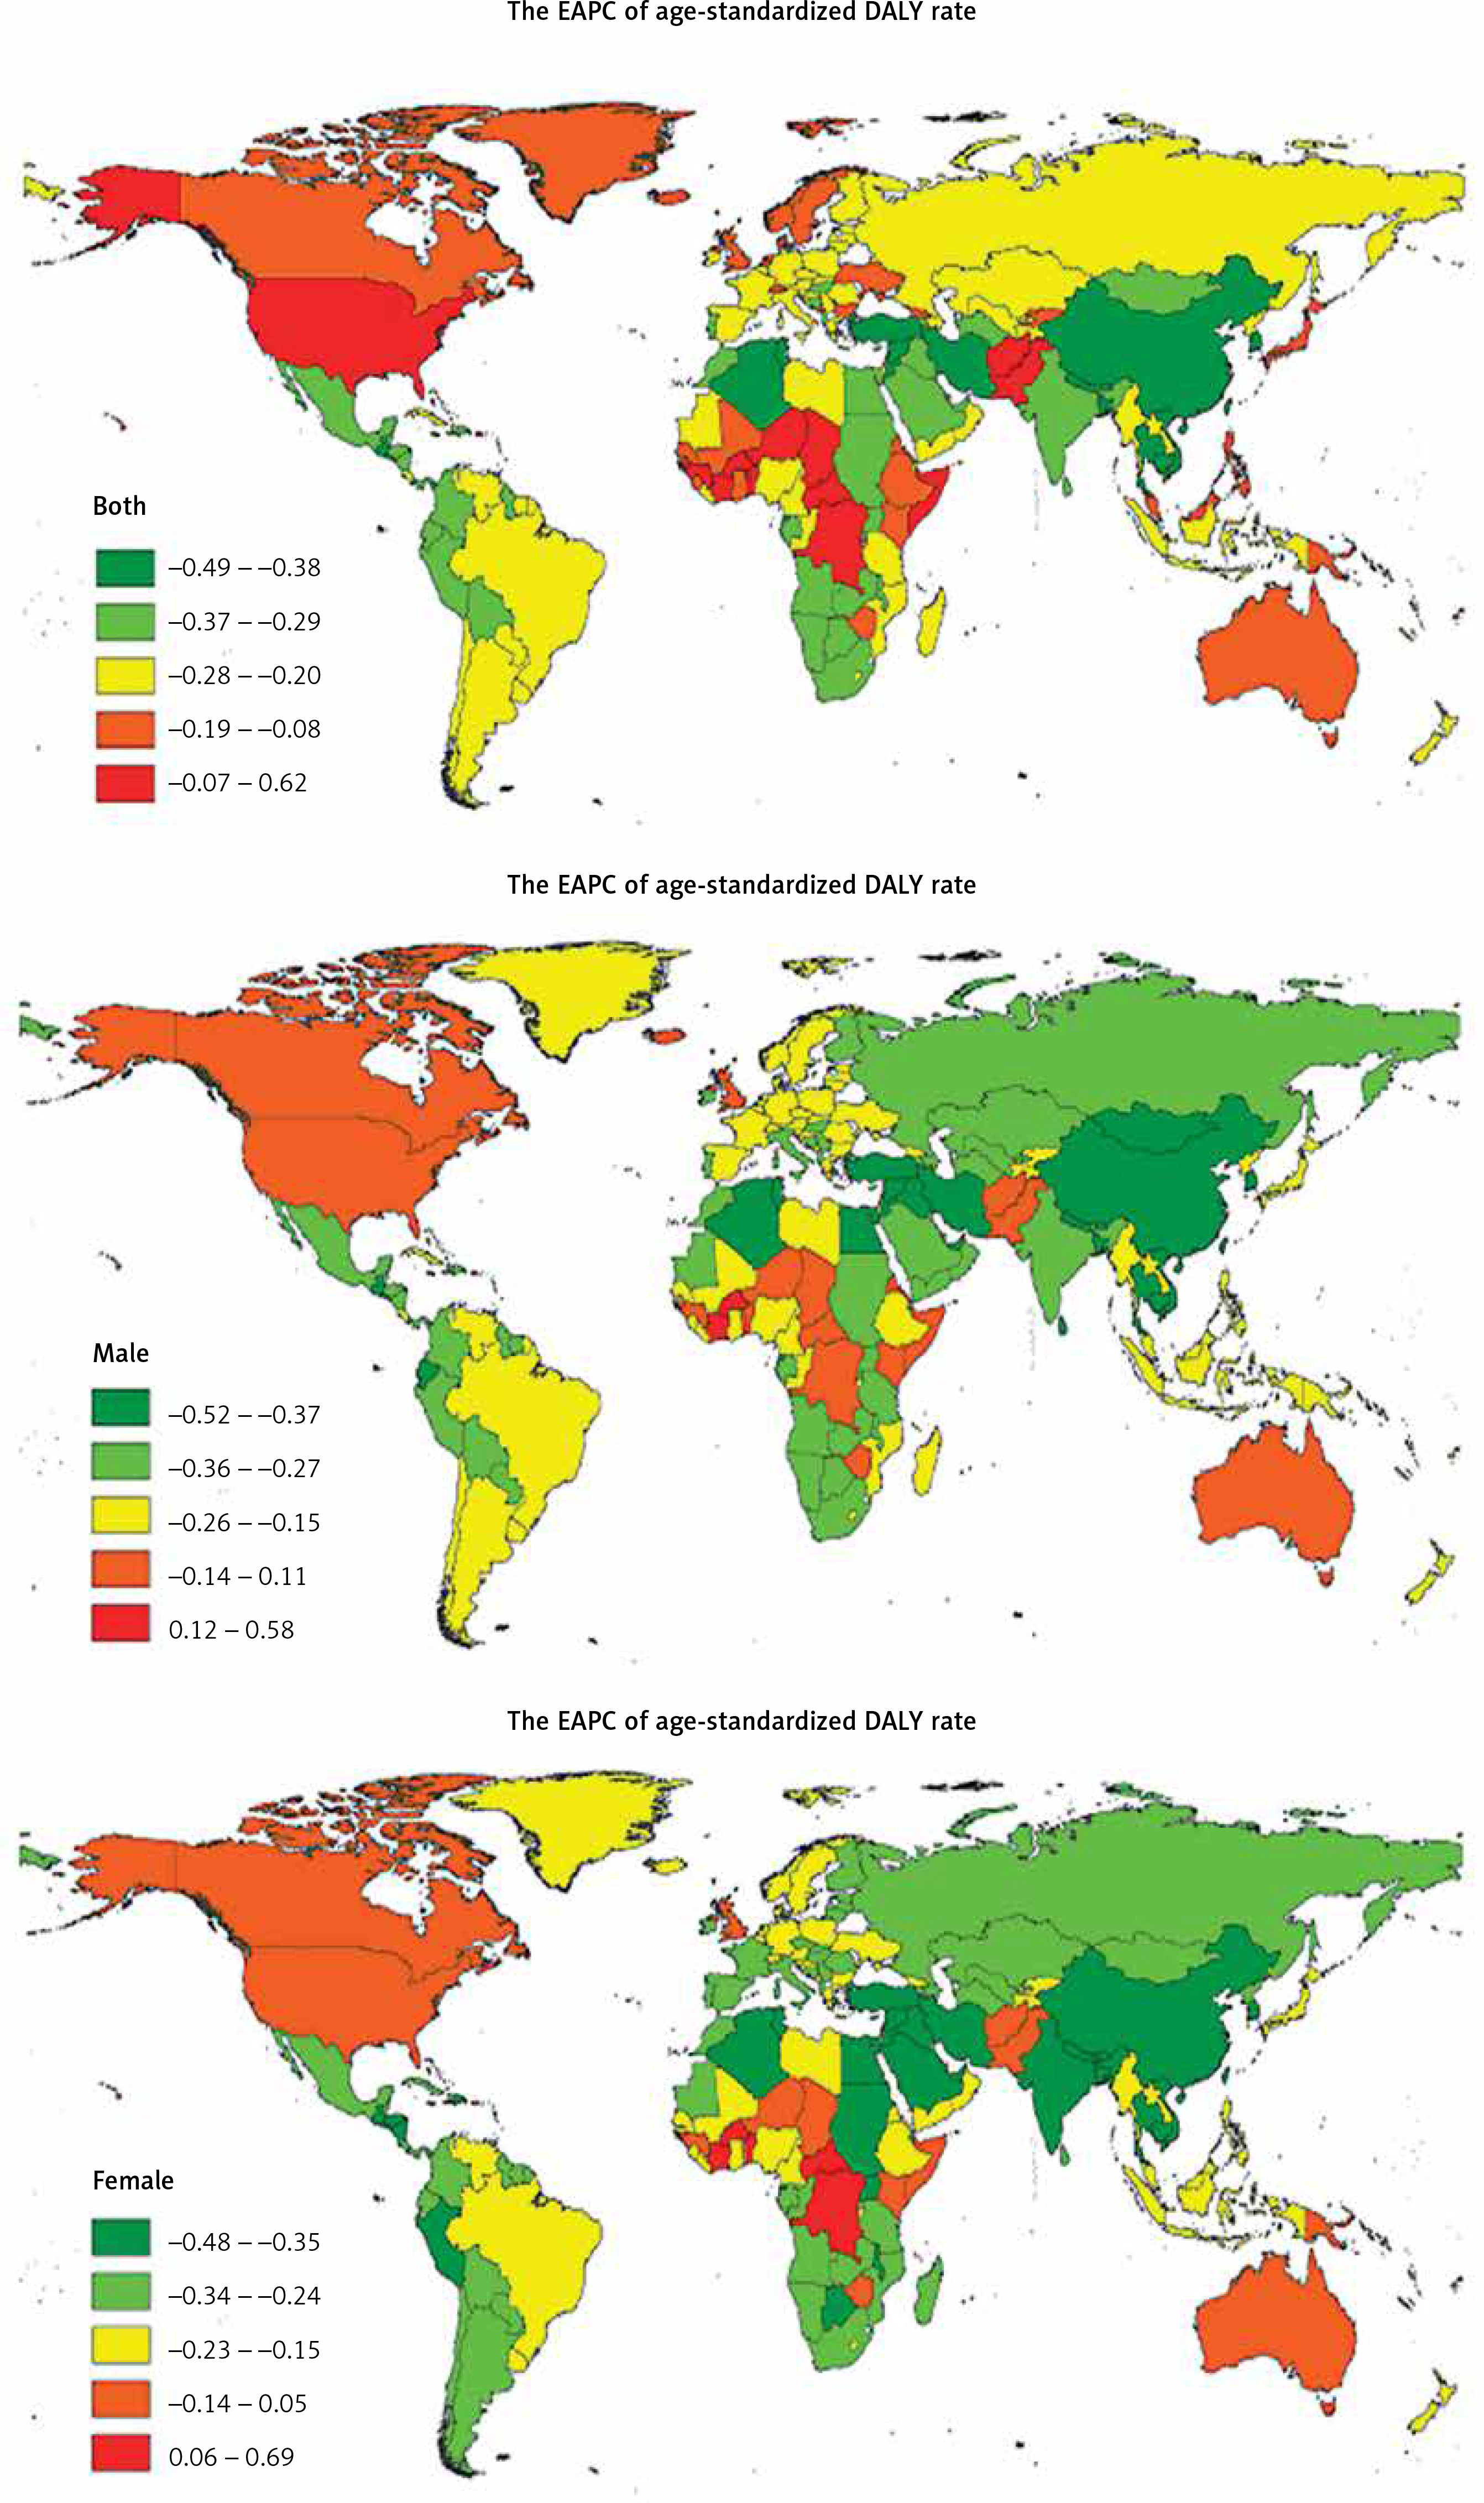
The countries with the highest age-standardized DALY rates of glaucoma in 2019 were Mali (42.50), Ethiopia (39.83), and Botswana (39.28) (Supplementary Table SI and SIII). The countries with the lowest age-standardized DALY rates of glaucoma in 2019 were Taiwan (Province of China) (0.58), the Democratic People’s Republic of Korea (1.69), and Estonia (2.91) (Supplementary Table SI and SIII). The age-standardized DALY rate of glaucoma decreased the most in Bhutan (EAPC, –2.51) and increased the most in Gambia (EAPC, 1.36) (Supplementary Tables SI, SIII and Figure 2). The age-standardized DALY rate decreased most in females (EAPC, –2.42) in Bhutan. The age-standardized DALY rate decreased most in males (EAPC, –2.76) in Bhutan. (Supplementary Table SI, SIII and Figure 2).
Figure 2
The global EAPC of glaucoma age-standardized DALY rate from 1990 to 2019, by country
EAPC – estimated annual percentage change, DALY – disability adjusted life-years.
Age distributions of DALY rates for glaucoma in different countries in 2019 are shown in Supplementary Table SIV.
Discussion
From 1990 to 2019, the global burden of glaucoma was unevenly distributed, and the total number of DALYs caused by glaucoma in the world increased each year. However, the EAPC showed a downward trend in the overall population. Higher age-standardized DALY rates were associated with lower socioeconomic status, because glaucoma incidence was inversely correlated with SDI.
DALYs quantify the gap between actual and ideal fitness levels in a population. A growing and aging population are driving factors for an increase in the overall burden of disease [4]. The rise in the total number of glaucoma DALYs can be attributed to changes in the total population and its age demographics, although the GBD data illustrate that the relative contributions of these 2 factors vary across regions. However, the EAPC for glaucoma showed a downward trend worldwide, and similar results were observed in all regions, suggesting that glaucoma prevention and treatment have achieved positive results worldwide.
Africa remains the region most affected by glaucoma. Specifically, our findings suggest that the top 3 regions with the highest number of age-standardized DALYs due to glaucoma are all located in Africa. Africa currently has the highest prevalence of glaucoma of any region in the world, affecting an estimated 4.8% of the population [1]. The high rate of glaucoma in Africa, particularly in Eastern sub-Saharan Africa, might be due to the unequal quality of eye care services, doctor shortages, fragmented services that are insufficiently integrated into health systems, and gaps in data, particularly in regards to monitoring trends and evaluating progress [5]. Notably, except in regions of the African continent, persons of African descent residing in high-income countries, such as the United States of America also have high rates of glaucoma [6]. It seems that the incidence of glaucoma is also influenced by race. A review indicated that in various ethnicities, people of African ancestry had the highest prevalence of glaucoma and primary open-angle glaucoma [1]. Due to limited resources in many regions of Africa, most people receive low-cost healthcare but experience poor compliance with eye drops [7–9]. Thus, reduction in the burden of glaucoma disease in the African region remains difficult.
Consistent with the findings of previous disease burden studies, there is an inverse relationship between disease burden and socioeconomic level in glaucoma [10–12]. Our results suggested that the age-standardized DALY rates were higher in regions with low SDI quintile; in a word, the burden of glaucoma was greater in underdeveloped regions. In some areas with low SDI, it is very difficult to guarantee that appropriate health services are planned and delivered in accordance with population needs. In fact, some patients identified as having glaucoma have no access to follow-up for further treatment of identified. Furthermore, in areas where education resources are scarce, some people are not conscious that they have glaucoma.
Using data collected from GBD 2004, Ono et al. reported that glaucoma prevalence is unevenly distributed among countries and dependent on income levels [11]. Our findings further confirm substantial health inequalities in glaucoma, suggesting that low socioeconomic areas with high glaucoma burdens should be prioritized targets for international resource allocation. More importantly, unmet needs for patients, unequal quality of eye care services, doctor shortages, fragmented services that are insufficiently integrated into health systems, and gaps in data, particularly in regards to monitoring trends and evaluating progress, still need to be solved.
For the prevention of glaucoma-related visual impairment, tonometry is not a useful screening technique, nor is visual assessment, because visual impairment is a late symptom of glaucomatous optic neuropathy [13]. An aging and growing population will probably increase the glaucoma prevalence, which will disproportionately affect resource-limited areas [1, 14]. Therefore, diagnostic procedures in relevant areas must be improved, which should include highlighting risks within genetically predisposed families and emphasizing the effectiveness of care after the initiation of treatment. Early detection and treatment are still vital for preventing glaucoma. Along with technological advances, new tools for glaucoma detection are being developed and refined, and strides are also being made with public policy on national and global health. Screening of patients with high-risk demographics for glaucoma such as age, race, and family history is a highly cost-effective intervention for eye health care [15].
The strength of this study is the access to multidisciplinary data and analysis on a global scale. Using the strengths of GBD 2019 country-level estimates, we were able to estimate the disease burden of glaucoma by country, world region, and SDI quintile. The limitations of this study should also be emphasized. First, the accuracy of these data needs to be confirmed, especially in low- and very-low-income countries [16]. The GBD uses a hierarchical Bayesian meta-analysis to estimate DALY measures for each country, which is limited by the number and quality of included population-based studies [14].
Taken together, our country- and region-level estimates will allow policymakers and decision-makers to better understand changes in the burden of glaucoma disease and the drivers of these changes in specific geographic settings.
Data availability
The datasets generated and/or analysed during the current study are available at the website of Global Health Data Exchange (https://ghdx.healthdata.org/). All data were collected from the Global Burden of Diseases database. The Global Burden of Diseases database is publicly available.