Introduction
Osteosarcoma is the most common primary malignant bone tumor in humans, especially adolescents. It is frequently accompanied by lung metastasis. Despite aggressive treatment, about a third of affected patients die of their disease. More recently [1], many novel targets have been identified and serve as independent prognostic markers of human osteosarcoma. Neoadjuvant chemotherapy followed by surgical resection and additional adjuvant chemotherapy are routine treatment of osteosarcoma and the 5-year-survival rate of patients is 60–70% [2]. Over the past 30 years, the survival rate has shown little improvement and it is necessary to develop new therapeutic approaches.
Histone deacetylase inhibitors (HDACIs) are a class of compounds that interfere with the function of histone deacetylase. Histone deacetylase inhibitors exert their antitumor activities through the induction of cell cycle arrest, differentiation and apoptosis, including breast cancer [3], ovary cancer [4], colon cancer [5], and lung cancer [6]. Several important HDACIs have been well studied, including suberoylanilide hydroxamic acid (SAHA), trichostatin A (TSA) and depsipeptide. Some of them have already been in clinical trials or approved as cancer therapeutic agents [7]. Class I histone deacetylase (HDAC) (1, 2, 3 and 8) plays a central role in the pathogenesis of osteosarcoma, and HDACIs may thus have promise as new therapeutic agents against osteosarcoma. It has been reported [8, 9] that HDACIs are able to induce osteosarcoma cell apoptosis through the p53 signaling pathway or the intrinsic mitochondrial pathway. This potent apoptotic activity was associated with the greater ability of HDACIs to downregulate survival signaling through AKT (protein kinase B, also known as PKB).
Recent studies [10, 11] have demonstrated that HDACIs, such as SAHA and TSA, are able to induce autophagy in human cancer cells, an effect related to their anticancer property. The contribution of autophagy to cell death by HDACIs remains controversial and, most likely, is context-dependent. Some groups report [10, 12] that autophagy serves as a cell death mechanism in HDACI-caused cancer cell death, whereas other groups [11, 13] have found that autophagy acts as a cell survival mechanism in HDACI-mediated cancer cell death. But the role of autophagy in HDACI-caused osteosarcoma cell death has still not been determined.
In this study, we aimed to study the biological function of autophagy in anti-osteosarcoma activity of HDACIs. Here, results from our study provide strong evidence that TSA induces autophagy through mammalian target of rapamycin (mTOR) suppression and forkhead box O1 (FOXO1) activation. Such autophagy serves as a cell survival mechanism in TSA-caused osteosarcoma cell death. Our findings thus offer new therapeutic approaches against osteosarcoma through the combination of HDACIs and autophagy inhibitors.
Material and methods
Reagents and antibodies
The chemicals used in our experiments were: trichostatin A (Sigma, T8552), bafilomycin A1/BAF (Sigma, B1793), and chloroquine (CQ, Sigma, C6628). The antibodies used in our experiments included: FOXO1 (Cell Signaling Technology, 2880), phospho-FOXO1 (Cell Signaling Technology, 9461), P21 (Cell Signaling Technology, 2947), microtubule-associated protein 1 light chain 3/LC3 (Sigma, L7543), p62 (Sigma, P0067), phospho-AKT (Cell Signaling Technology, 4060), AKT (Cell Signaling Technology, 4691), phospho-S6 (S235/236; Cell Signaling Technology, 2211), S6 (Cell Signaling Technology, 2217), PARP1 (Cell Signaling Technology, 9542), caspase 3 (Cell Signaling Technology, 9662), β-actin (Sigma, A5441), α-tubulin (Sigma, T6199), and lamin AC (Cell Signaling Technology, 2032).
Cell culture
U2OS cells were obtained from American Type Culture Collection (ATCC). Cell lines were maintained in DMEM (Sigma, D1152) containing 10% fetal bovine serum (HyClone, SV30160.03) in a 5% CO2 atmosphere at 37°C.
Immunofluorescence staining and confocal microscopy
U2OS were seeded onto a glass slide. After the designated treatments, cells were examined and recorded using a confocal microscope (Olympus Fluoview FV1000, Olympus America Inc., PA) and representative cells were selected and photographed.
Preparation of cell fractions
U2OS cells were treated with TSA at different time points. After that, nuclear and cytosolic extracts were prepared with NE-PER nuclear and cytoplasmic extraction reagents (Pierce, 78833) according to the manufacturer’s protocol.
Small interfering RNA (siRNA) and transient transfection
The scrambled RNAi oligonucleotides and siRNA targeting FOXO1 (Cell Signaling Technology, 6242) were transfected into U2OS cells using the DharmaFECT 4 Transfection Reagent (Dharmacon, T-2001-02) according to the manufacturer’s protocol. After the designated treatments, cell lysates were prepared for western blotting.
Reverse transcription and quantitative real-time PCR
RNA was extracted with the RNeasy kit (Qiagen, 217004). A reverse transcription reaction was performed using 1 μg of total RNA with the High Capacity cDNA Reverse Transcription kit (Applied Biosystems, 4368814). The mRNA expression levels were determined by real-time PCR using SsoFast EvaGreen Supermix (Bio-Rad, 172-5201) and the CFX96 Touch Real-Time PCR Detection System (Bio Rad). Glyceraldehyde-3-phosphate dehydrogenase (GAPDH) was used as an internal control of RNA integrity. Real-time PCR was performed in triplicate. The primers used were based on previous reports, including human ATG4B, ATG12, PI3Kβ, LC3, ULK2 and GAPDH.
Western blotting
At the end of the designated treatments, cells were lysed in Laemmli SDS buffer (62.5 mM Tris at pH 6.8, 25% glycerol, 2% SDS, phosphatase inhibitor (Pierce, 78428) and proteinase inhibitor cocktail (Roche Applied Science, 11836153001)). An equal amount of protein was resolved by SDS-PAGE and transferred onto PVDF membrane. After blocking with 5% nonfat milk, the membrane was probed with designated primary and secondary antibodies, developed with the enhanced chemiluminescence method and visualized with the Kodak Image Station 4000R (Kodak, Rochester, NY).
Detection of viable and dead cells
Several methods were used to detect cell death quantitatively and qualitatively, which are: (i) propidium iodide (PI) live cell uptake assay coupled with flow cytometry and (ii) western blotting for PARP1 and caspase 3 cleavage. For PI staining, the medium in each well was collected and cells were harvested with trypsin after treatments. Then, cell pellets obtained were resuspended in 1× phosphate-buffered saline containing PI at a final concentration of 5 μg/ml and incubated for 10 min at 37°C. Ten thousand cells from each sample were analyzed with FACSCalibur flow cytometry (BD Bioscience, San Jose, CA) using CellQuest software.
Results
TSA causes osteosarcoma cell death
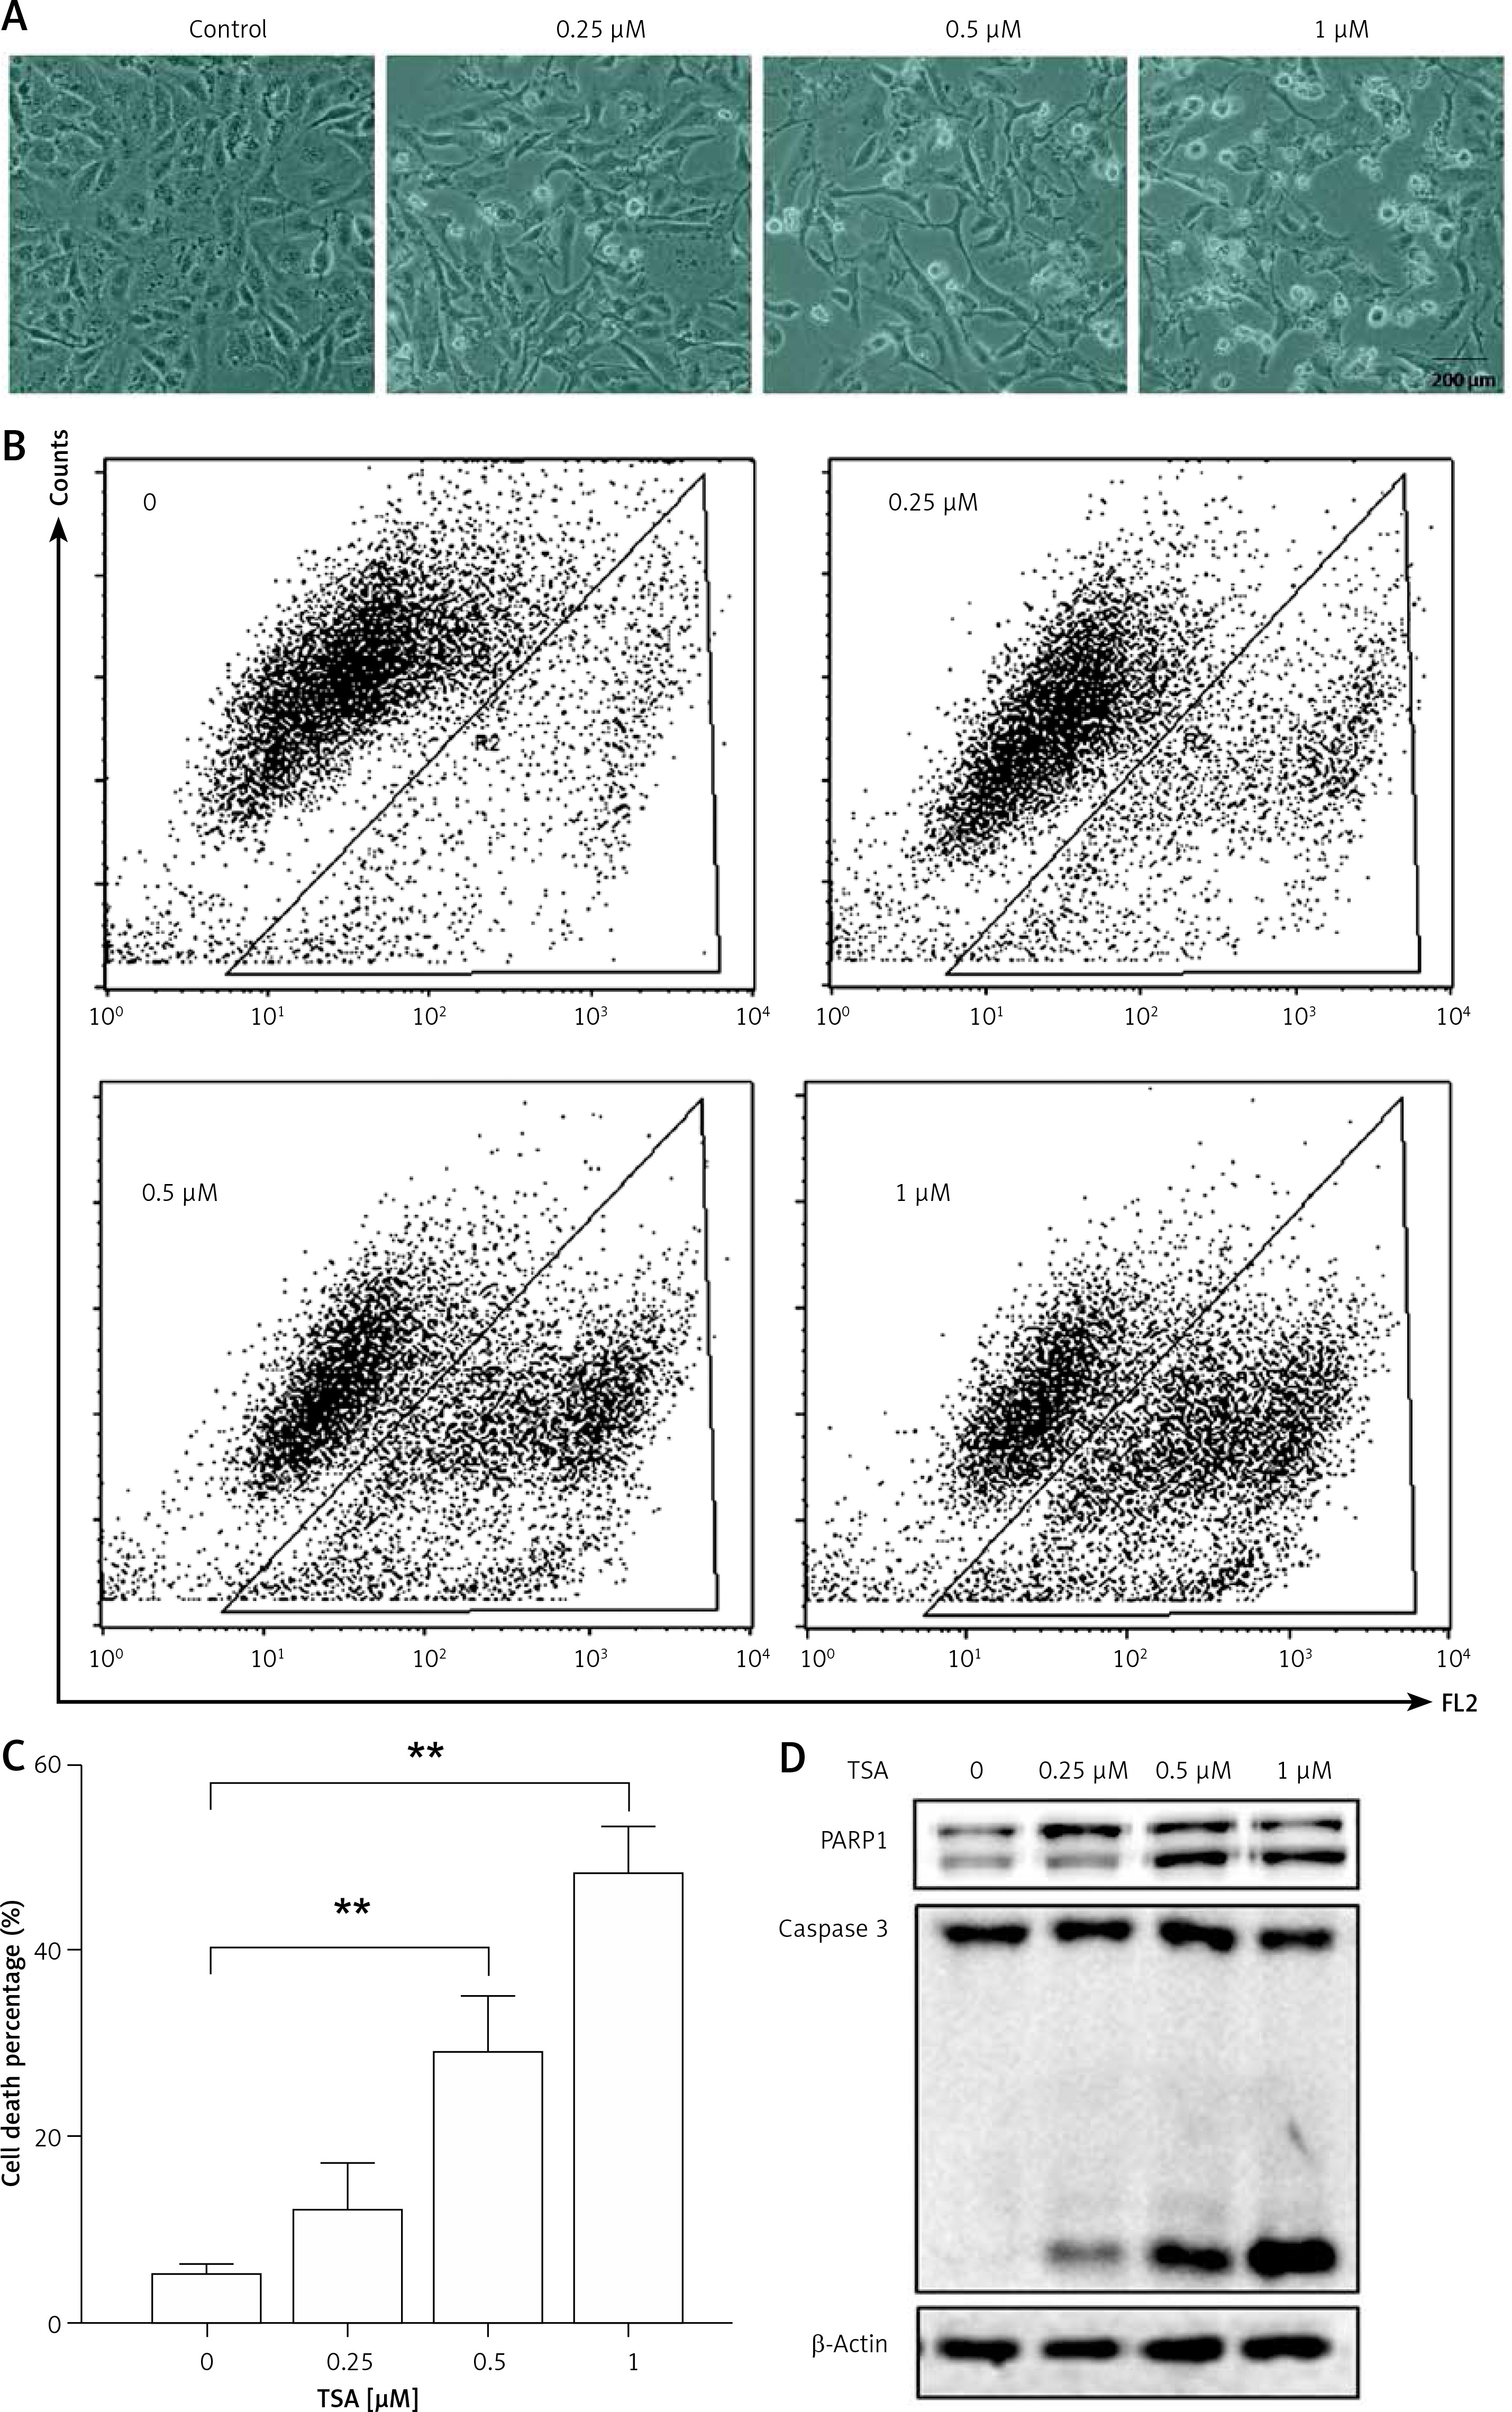
Class I HDAC is reported to have higher levels in the human osteosarcoma tissues [8]. Here, we treated human osteosarcoma U2OS cells with TSA, which is known to effectively inhibit HDAC enzyme activity at nanomolar concentrations and suppress cell growth and induce cell death. As shown in Figure 1 A, morphological changes showed that TSA caused U2OS cell death in a dose-dependent manner. Quantification of cell death using the PI exclusion test coupled with flow cytometry in U2OS cells showed the same results (Figures 1 B, C). Finally, western blotting was performed to determine the type of cell death and the cleavages of PARP1 and caspase 3 were enhanced by TSA (Figure 1 D), indicating the induction of cell apoptosis.
Figure 1
TSA causes osteosarcoma cell death. A – U2OS cells were treated with different dosages of TSA (0.25, 0.5 or 1 μM) for 24 h. Morphological changes of U2OS cells with respective treatments were examined and photographed with an inverted microscope (Scale bar: 200 μm). B, C – Cell pellets were subsequently collected and cell death was quantified using propidium iodide (PI) live exclusion staining. Statistical significance is indicated in the bar chart. The data are representative from 3 independent experiments. **P < 0.01. D as in B, cells were then harvested for western blotting analysis. Cell lysates were resolved in SDS-PAGE and probed with specific antibodies against caspase 3 and PARP1. β-actin was used as a loading control
TSA induces autophagy in U2OS cells
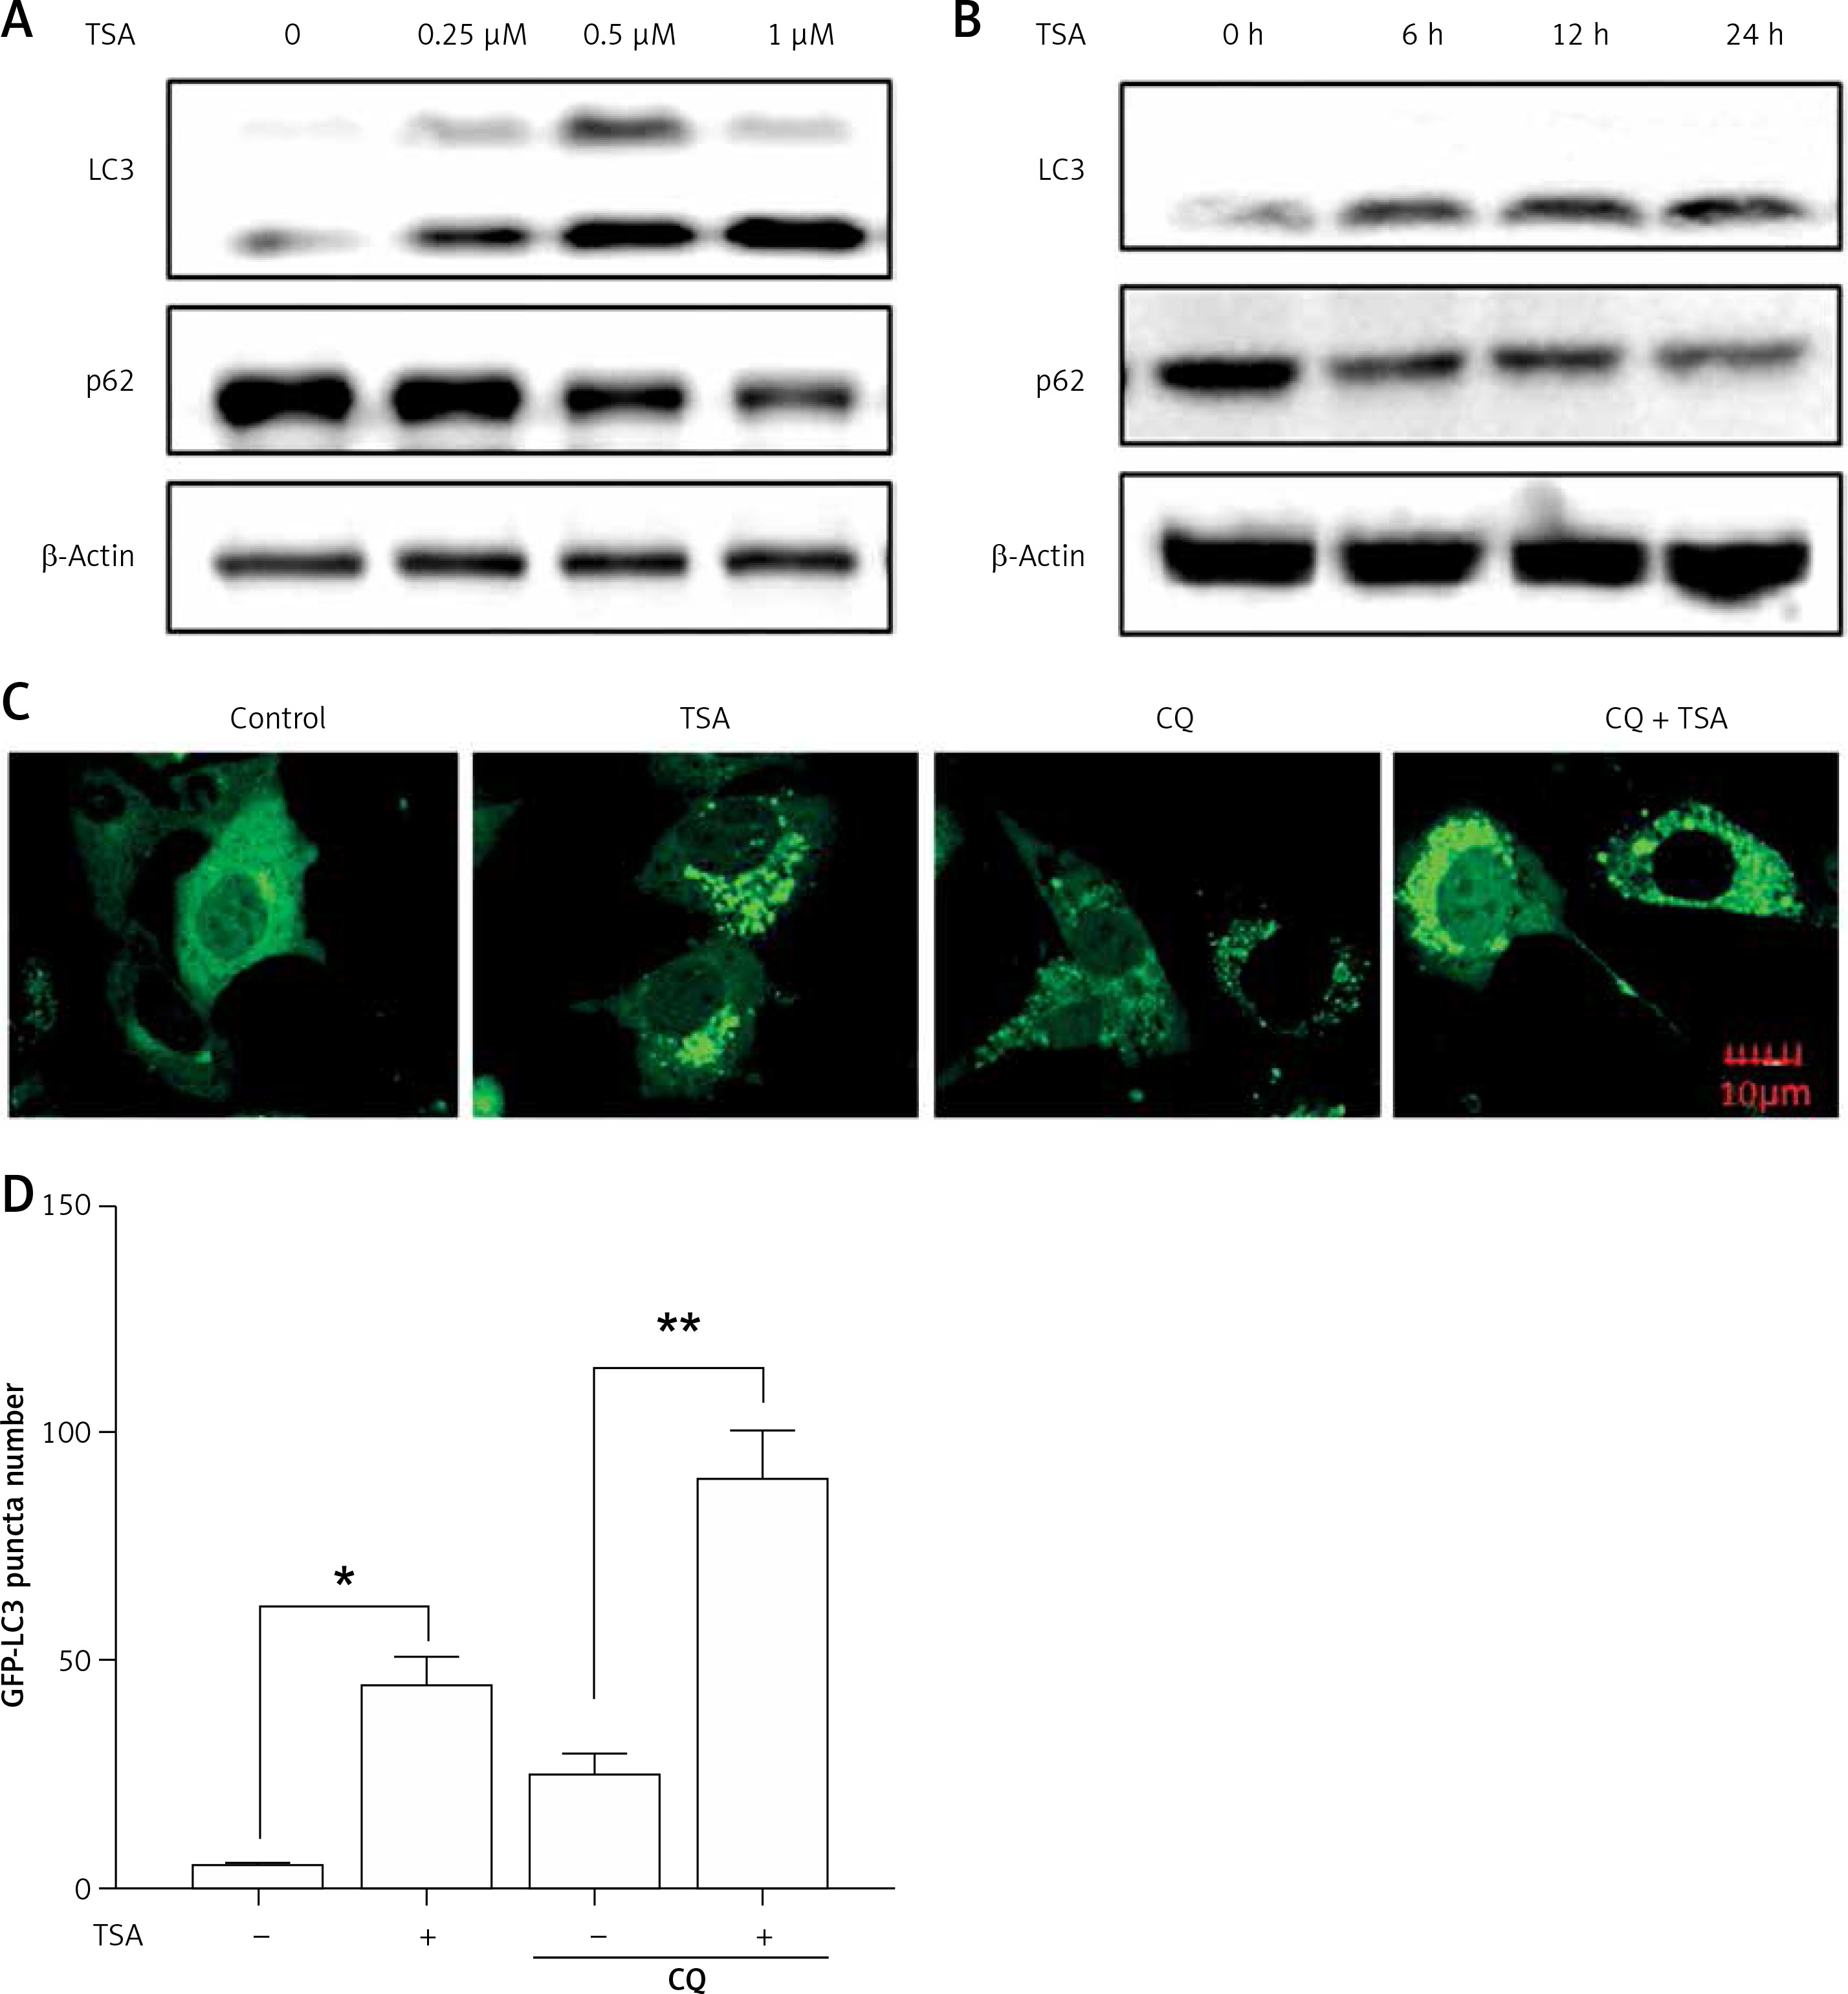
Previously we reported that HDACIs induce autophagy in colon and liver cancer cells [11]. Here, we treated U2OS cells with TSA and investigated the effect of TSA on autophagy. After treatment with TSA, there was an accumulation of LC3-II (microtubule-associated protein 1 light chain 3, an autophagosome marker) in U2OS cells in a dose- and time-dependent manner (Figures 2 A, B), indicating the increased autophagy level. In addition, our confocal microscopy results showed that TSA significantly increased the number of GFP-LC3 puncta in U2OS cells, which represents autophagic vacuoles (Figures 2 C, D). Also more GFP-LC3 puncta were observed by TSA in the presence of chloroquine (CQ), suggesting the increase of autophagy flux. The level of p62 (SQSTM1, a well-established autophagy substrate) was decreased and showed the same results (Figures 2 A, B).
Figure 2
TSA induces autophagy in U2OS cells. A – U2OS cells were treated with different dosages of TSA (0.25, 0.5 or 1 μM) for 12 h. Cells were harvested and lysed. Cell lysates were immunoblotted using western blotting for LC3 and p62. β-Actin was used as a loading control. B as in A – cells were treated with TSA (0.5 μM) for different times (6, 12, 24 h). Western blotting was performed to detect LC3 and p62 levels. C – U2OS cells were first transfected with GFP-LC3. After 48 h, cells were treated with TSA (0.5 μM) for 12 h in the presence or absence of CQ (25 μM). Confocal microscope was performed to examine GFP-LC3 puncta and representative cells were photographed (Scale bar: 10 μm). GFP-LC3 puncta number was also calculated and statistically analyzed in D. *P < 0.05, **p < 0.01
TSA inhibits mTOR signaling pathway and enhances FOXO1 transcriptional activity
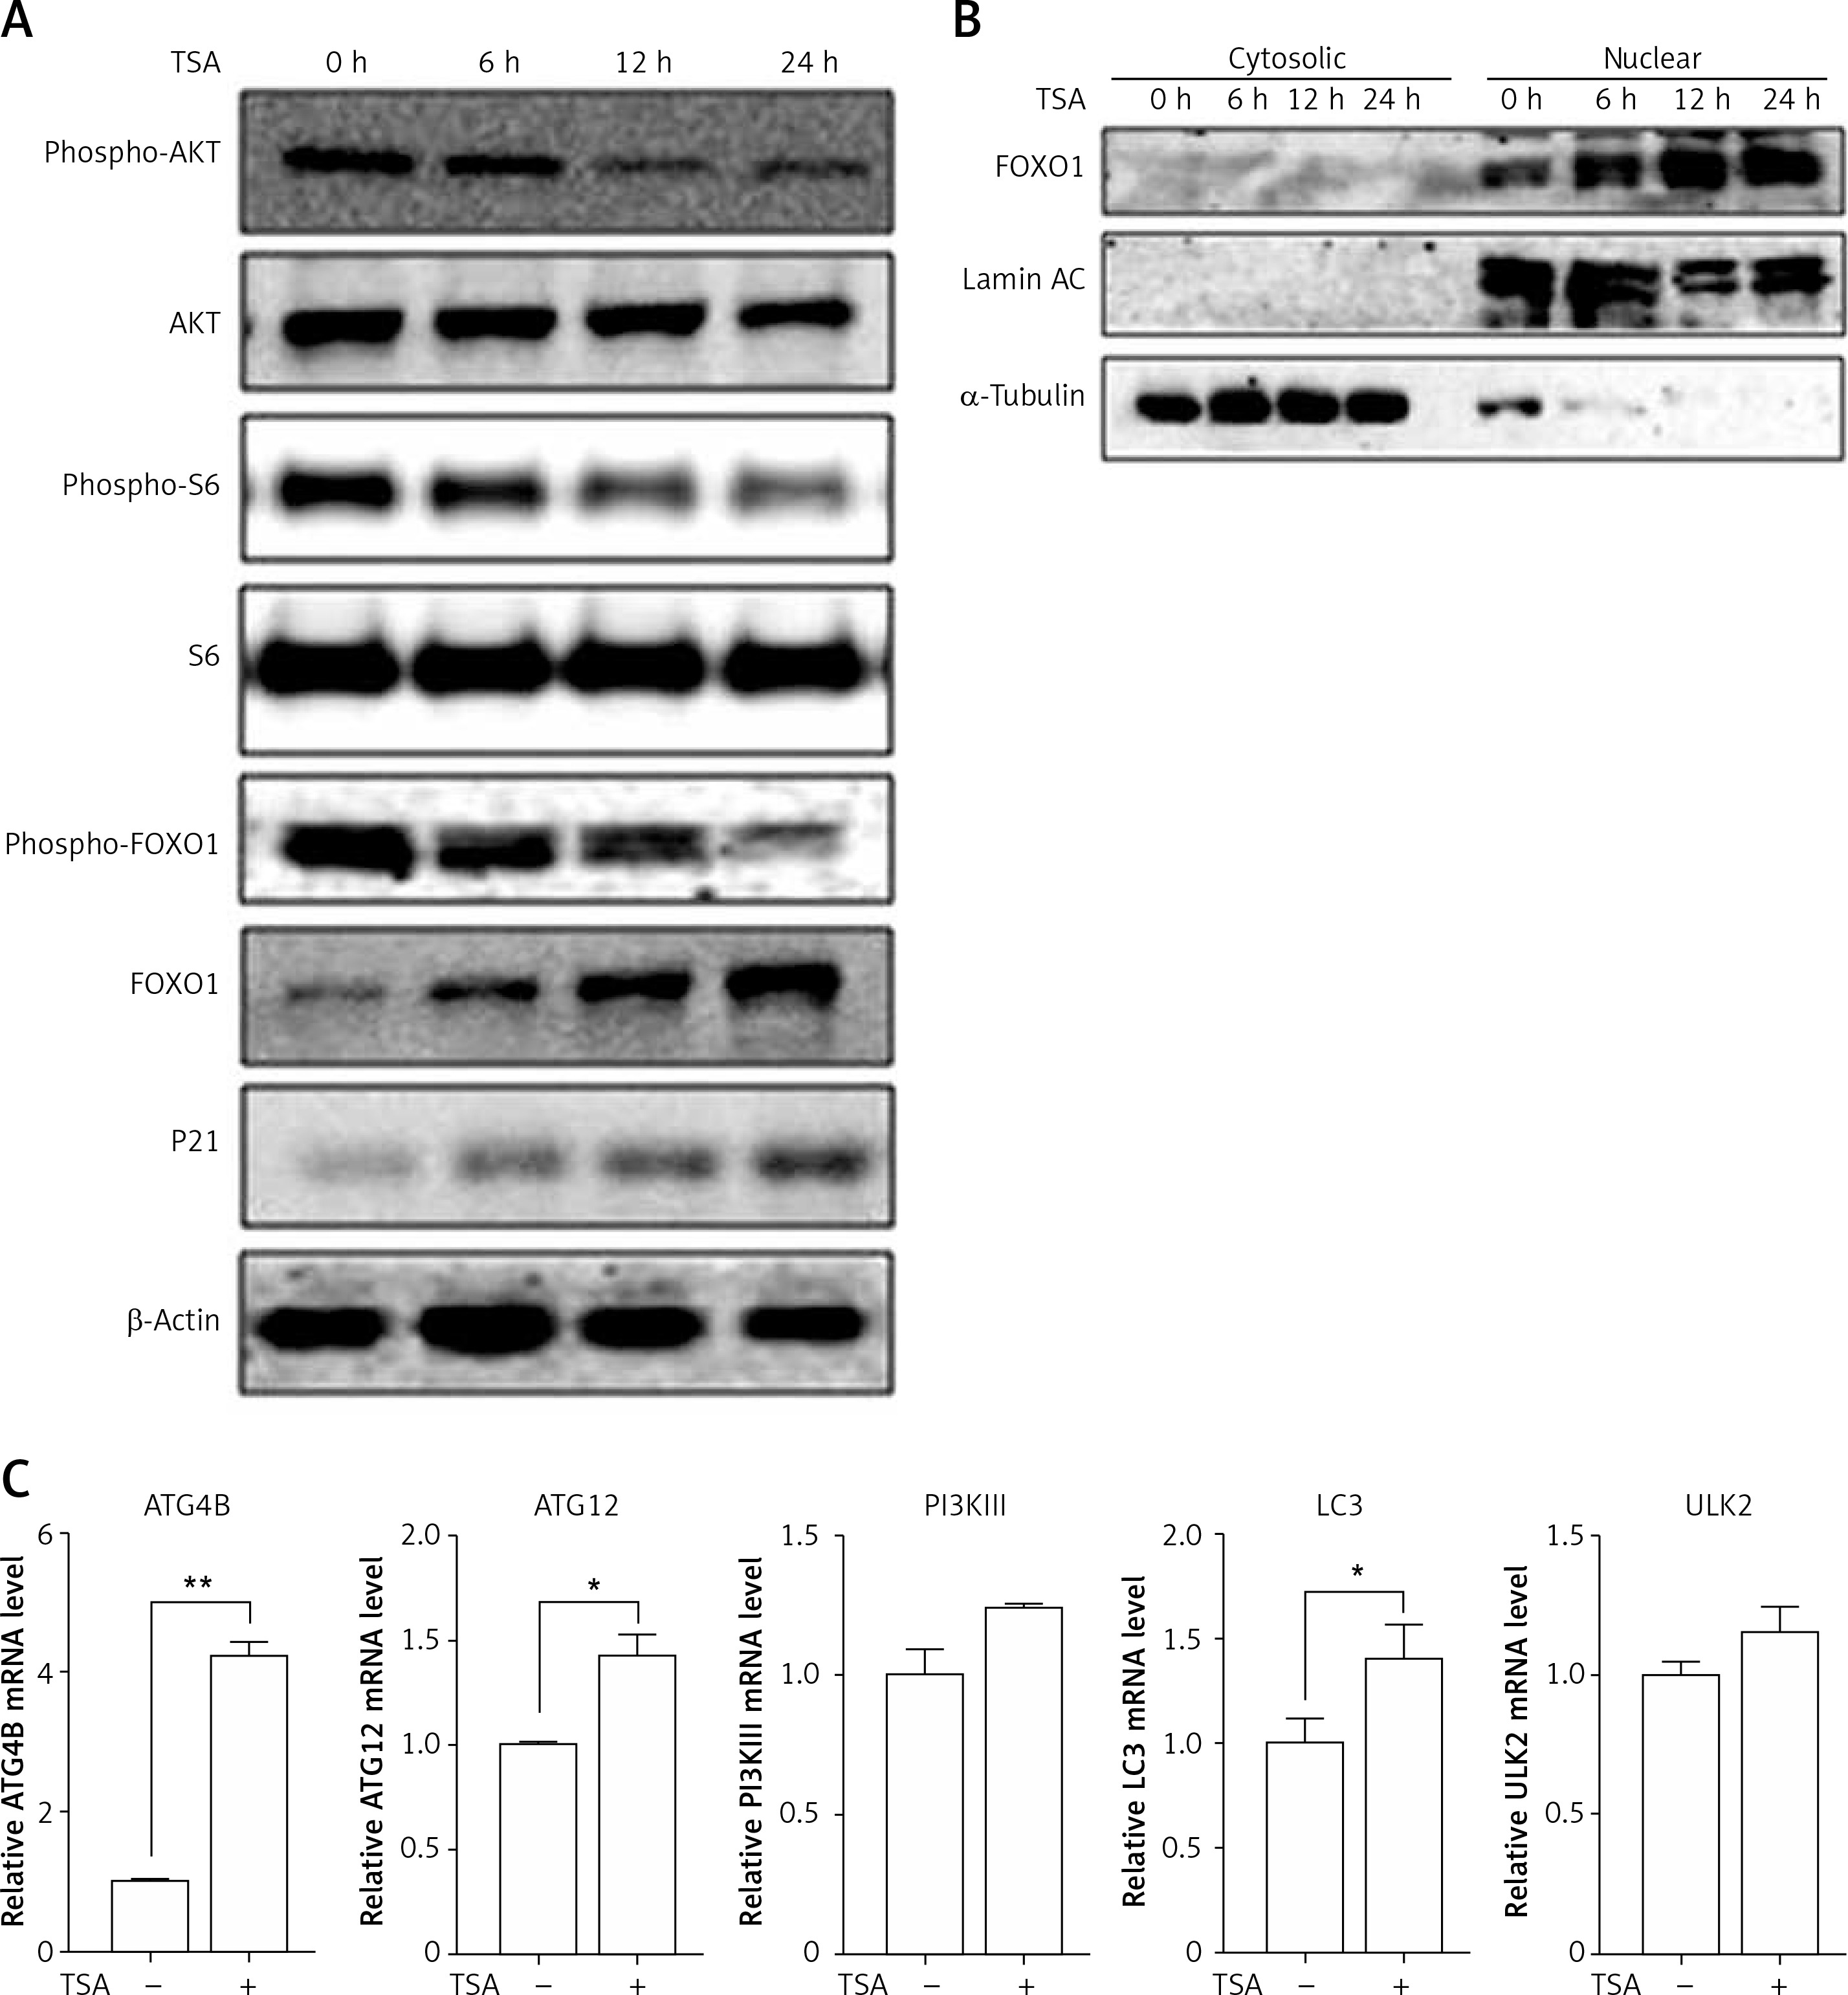
HDACIs are known to block the AKT (also known as protein kinase B, a serine/threonine-specific protein kinase)-mTOR signaling pathway [14, 15], which negatively regulates autophagy in mammalian cells. Here, we treated U2OS cells with TSA and observed that TSA markedly reduced phospho-AKT and phospho-S6 (ribosomal protein S6, downstream of mTOR pathway) levels in U2OS cells, indicating the suppression of AKT-mTOR signaling (Figure 3 A). Moreover, we determined changes of the FOXO1 phosphorylation level, which is regulated by the PI3K (phosphoinositide 3-kinase)-AKT pathway and involved in autophagy induction. As shown in Figure 3 A, TSA reduced the FOXO1 phosphorylation level, which regulates FOXO1 localization in cells. Upon dephosphorylation, FOXO1 translocates into nuclear from cytosolic, leading to transcriptional upregulation of its target genes. Consistently, our results showed that the majority of FOXO1 protein was in the nuclei and there was a time-dependent increase of nuclear FOXO1 in TSA-treated U2OS cells (Figure 3 B). α-Tubulin and lamin AC proteins were detected as markers of cytosolic and nuclear fractions, respectively. It suggests that the transcriptional activity of FOXO1 could be increased. Our results also clearly showed that TSA treatment substantially upregulates the mRNA level of the target genes of FOXO1 in U2OS cells (Figure 3 C), such as autophagy related 4B (ATG4B), autophagy related 12 (ATG12), phosphoinositide 3-kinase class β (PI3Kβ), microtubule associated protein 1 light chain 3 α (LC3) and unc-51-like kinase 2 (ULK2), indicating that TSA activates the transcriptional activity of FOXO1.
Figure 3
TSA inhibits mTOR activity and enhances FOXO1 transcriptional activity. A – U2OS cells were treated with 0.5 μM TSA for different times (6, 12 or 24 h). Total protein was extracted and subjected to immunoblotting for phospho-AKT (Ser473), AKT, phospho-S6 (Ser235/236), S6, phospho-FOXO1 (Ser256), FOXO1 and P21. β-Actin was used as a loading control. B – U2OS cells were treated with TSA (0.5 μM) for different times (6, 12 or 24 h). To track the subcellular localization of FOXO1, cytosolic and nuclear proteins from control and TSA-treated cells were probed for FOXO1. The same membrane was then stripped and reprobed for α-tubulin or lamin AC to ensure equal protein loading. C – U2OS cells were treated with TSA (0.5 μM) for 12 h. Total mRNA was extracted and real-time PCR was performed to evaluate changes in ATG4B, ATG12, PI3Kb, LC3 and ULK2 mRNA levels. GAPDH was used as a loading control for real-time PCR. The data are representative from 3 independent experiments
FOXO1 is required for TSA-induced autophagy
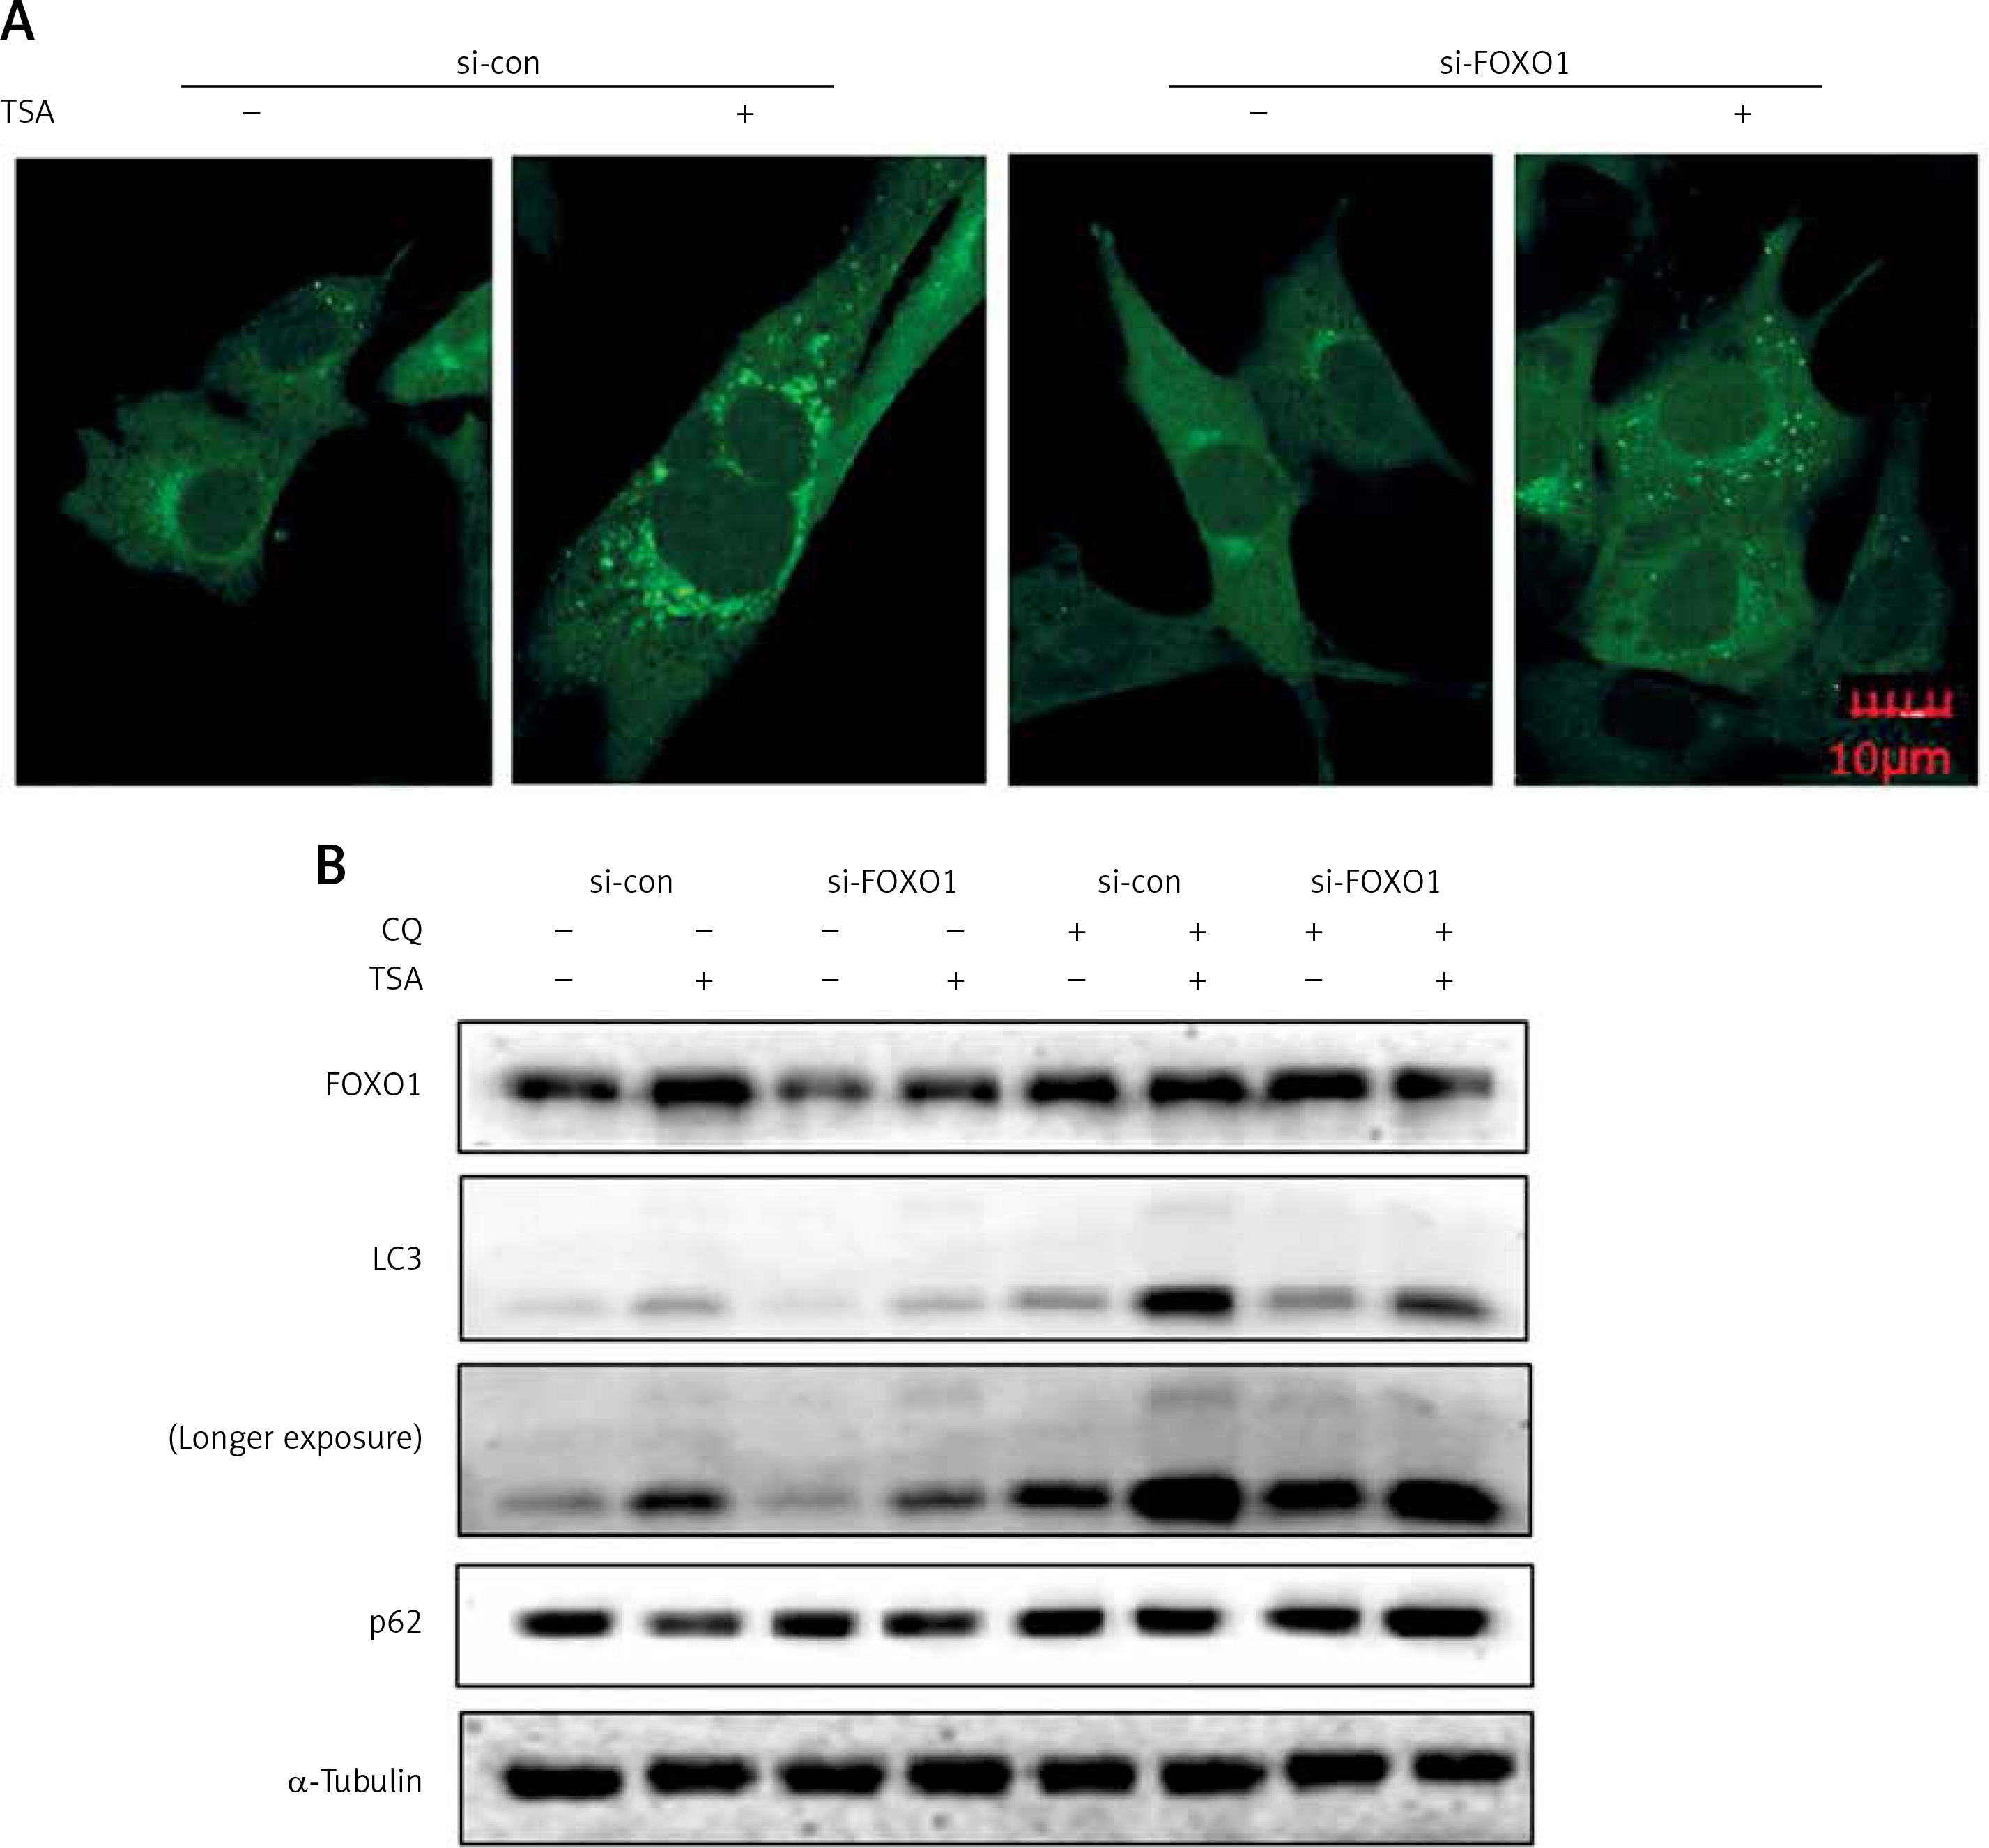
FOXO1 has been reported to induce autophagy via transcriptional upregulation of ATG genes (autophagy related genes) [11, 16]. We thus proceeded to test the possible involvement of FOXO1 in autophagy induction by TSA. As shown in Figure 4 A, FOXO1 knockdown by siRNA led to a significant decrease of GFP-LC3 puncta in TSA-treated U2OS cells, indicating a reduction of the autophagy level. Moreover, the autophagy flux level was also determined, and we observed that TSA treatment led to a further increase of LC3 levels in the presence of CQ while FOXO1 knockdown impaired the increase of autophagy flux (Figure 4 B). Also the degradation of autophagy substrate p62 by TSA was reversed following FOXO1 knockdown.
Figure 4
FOXO1 is required for autophagy induction by TSA in U2OS cells. A – U2OS cells expressing GFP-LC3 were transiently transfected with a nonspecific siRNA or the FOXO1-specific siRNA according to the manufacturer’s protocol. Cells were subsequently treated with TSA (0.5 μM) for 12 h. GFP-CL3 puncta were examined and representative cells were photographed using a confocal microscope (scale bar: 10 μm). B (as in A) – After FOXO1 knockdown, U2OS cells were treated with TSA (0.5 μM) for 12 h in the presence or absence of CQ (25 μM). Cell lysates were prepared and immunoblotted using western blotting for FOXO1, LC3 and p62 levels. α-Tubulin was used as a loading control
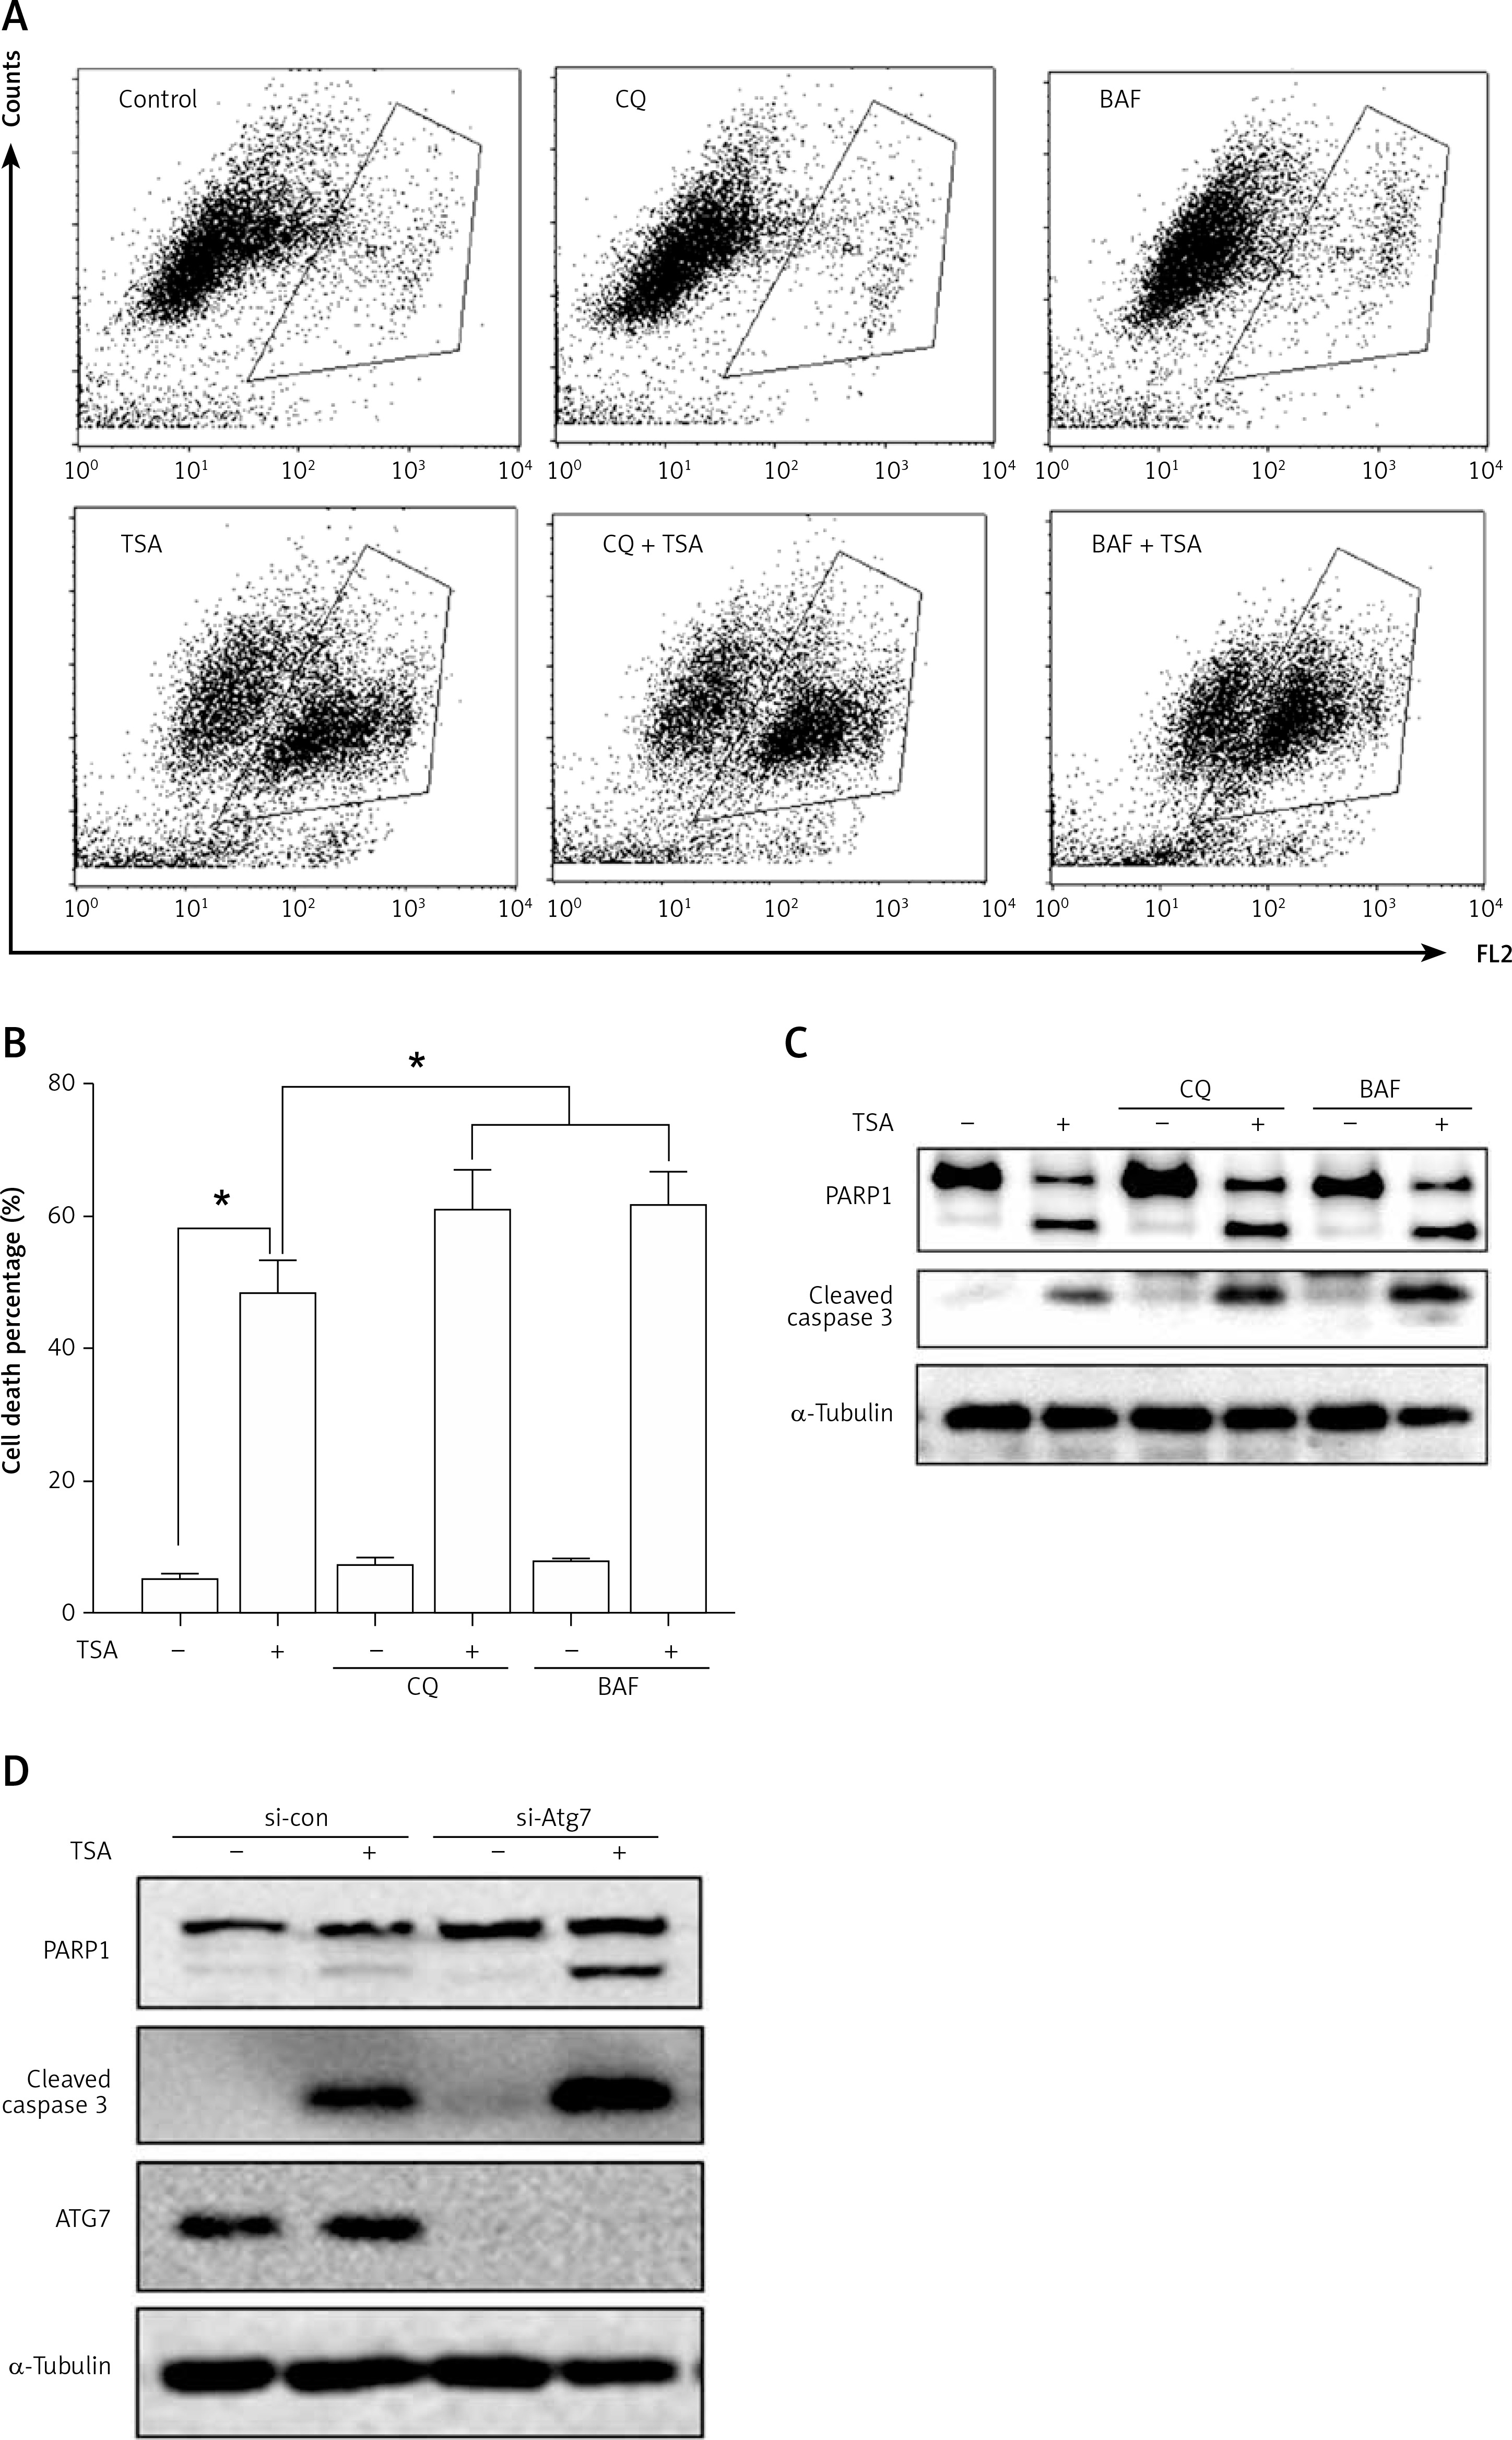
Suppression of autophagy causes more cell death by TSA
Finally, we determined the functional role of autophagy in TSA-caused osteosarcoma cell death. First, we used 2 pharmacological inhibitors of autophagy: CQ, an inhibitor of the lysosomal pH gradient; and bafilomycin A1 (BAF), an inhibitor of vacuolar type H+-ATPase. As shown in Figures 5 A and B, quantification of cell death using the PI exclusion test coupled with flow cytometry in U2OS cells showed that autophagy inhibition significantly increased cell death by TSA. Next, we examined the format of cell death via detection of 2 apoptotic markers, namely, the cleavage of both caspase 3 and poly [ADP-ribose] polymerase 1 (PARP1). As shown in Figure 5 C, there were more cleavages of caspase 3 and PARP1 in TSA-treated cells in the presence of CQ or BAF, indicating that inhibition of autophagy is able to sensitize TSA-mediated apoptotic cell death. Finally, we tried to knock down ATG7 (ubiquitin E1-like enzyme) in U2OS, which causes the conjugation reaction to form an autophagosome, and then determined the cell death caused by TSA. Our western blotting results showed that TSA treatment led to more cleavages of caspase 3 and PARP1 following ATG7 knockdown (Figure 5 D), suggesting that autophagy serves as a cell survival mechanism.
Figure 5
Effect of autophagy inhibition on TSAcaused osteosarcoma cell death. A, B – U2OS cells were treated with TSA (1 μM) with or without CQ (25 μM) or BAF (15 nM) for 24 h. Cell pellets were subsequently collected and cell death was quantified using propidium iodide (PI) live exclusion staining. Statistical significance is indicated in the bar chart. The data are representative from 3 independent experiments. *P < 0.05 C as in A – cells were then harvested and cell lysates were resolved in SDS-PAGE and probed with specific antibodies against caspase 3 and PARP1. α-Tubulin was used as a loading control. D – U2OS cells were transiently transfected with a nonspecific siRNA or the ATG7-specific siRNA according to the manufacturer’s protocol. Cells were subsequently treated with TSA (1 μM) for 24 h and then harvested for western blotting. α-Tubulin was used as a loading control
Discussion
In this study, we revealed the biological function of autophagy in HDACI-caused osteosarcoma cell death: TSA induces autophagy in osteosarcoma cells via mTOR suppression and FOXO1 activation. Moreover, inhibition of autophagy markedly enhances TSA-caused osteosarcoma cell death, indicating that autophagy serves as a cell survival mechanism.
Autophagy is an evolutionarily conserved self-digestive process via which cells adapt to nutrient starvation and other stress conditions [17]. It plays important roles in the pathogenesis of important diseases including cancer, neurodegenerative diseases, and metabolic disorders [17, 18]. Generally, it serves as a cell survival mechanism, and autophagy inhibitors are developed for anti-cancer drugs [19]. However, the involvement of autophagy in anti-osteosarcoma activity of HDACIs is still unknown. In this study, we first observed that TSA is able to induce autophagy in osteosarcoma cells (Figure 2). It implies that the combination of autophagy inhibition could enhance the anti-osteosarcoma activity of HDACIs.
The MTOR signaling pathway is a negative regulator of autophagy [17]. Under stress conditions such as nutrient starvation, mTOR activity is inhibited and autophagy is induced to provide cells with additional internal nutrient supplies. HDACIs are able to block AKT-mTOR signaling and suppress cancer cell viability and migration [14, 15]. In our study, we revealed the underlying mechanism for autophagy induction by TSA in osteosarcoma cells. Our results showed that TSA is able to inhibit the AKT-mTOR signaling pathway (Figure 3 A), which is responsible for the increased autophagy level.
The transcription factor FOXO1 plays important roles in cell cycle arrest, apoptosis, defense against oxidative stress and DNA repair [20–22]. Phosphorylation of FOXO1 is an important mechanism that regulates its ability. Under normal conditions, AKT phosphorylates FOXO1 at multiple sites and drives FOXO1 into the cytoplasm, where it is then ubiquitinated and degraded [23, 24]. In our study, we observed that TSA is able to inhibit AKT activity (Figure 3 A), which leads to FOXO1 dephosphorylation and translocation into the nucleus (Figure 3 B). As a result, FOXO1 transcriptional activity is enhanced and upregulates expression of its target genes (Figure 3 C), which leads to autophagy induction by TSA. The results are also consistent with the previous studies [11, 25].
Taken together, data from our study reveal that the molecular mechanism for TSA-induced autophagy in osteosarcoma. CQ and hydroxychloroquine (HCQ), which inhibit autophagic degradation through their disruption of lysosomal function [26], are FDA-approved drugs to treat malaria, rheumatoid arthritis and lupus. Our results provide clues for developing more effective osteosarcoma therapeutic strategies by the combination of HDACIs and the autophagy inhibitor CQ or HCQ.