Introduction
Type 2 diabetes (T2D) is a growing health problem nationally and worldwide. According to a recent study, between 1980 and 2014, the number of people with diabetes rose from 108 million to 422 million [1]. According to the International Diabetes Federation (IDF), Saudi Arabia has the highest prevalence of diabetes among those aged 20–70 years in the Middle East and North Africa (MENA) region [2]. A recent, large, nationwide Saudi study found that 34.5% of the screened individuals had dysglycemia, which was mainly impaired fasting glucose, with the highest prevalence among those ≥ 45 years old [3].
Magnesium (Mg) is an important mineral that is involved in the regulation of cellular processes and is essential for a wide range of metabolic reaction. Nuts, leafy greens, and whole grains are considered among the foods with the highest Mg amount [4]. It was estimated that around 60% of the population of the United States (US) has lower Mg intake than what is recommended [5]. Also, chronic diseases such as obesity have been shown to increase the incidence of the hypomagnesemia, possibly due to inflammation [5]. According to a recent study, patients with Alzheimer’s dementia are more likely to have hypomagnesemia, which was correlated with worse cognitive and physical scores [6]. A meta-analysis of seven prospective studies found that higher reported Mg intake was associated with a lower risk of ischemic stroke [7]. Hypomagnesaemia correlated with hyperlipidemia and hypertension in patients with metabolic syndrome [8].
Mg plays an important role in glucose and insulin metabolism through multiple mechanisms, including the effect on tyrosine kinase and glucose transporter protein activity [9, 10]. Intracellular Mg regulates insulin secretion and hypomagnesemia resulted in insulin resistance [11]. A recent study showed that Mg supplementation for overweight participants with insulin resistance resulted in an improvement in both fasting glucose and insulin sensitivity [12]. Hypomagnesemia is considered among the most common prevalent electrolyte disorders reported in patients with diabetes [13]. A communities study addressing atherosclerosis risk found that, after controlling for possible confounders, including the body mass index (BMI) and the lifestyle habits, those with lower serum Mg level were twice as likely to develop T2D compared to those with a higher Mg level [14]. A large prospective study detected an inverse relationship between Mg intake and T2D risk for males and females, regardless of their baseline characteristics [15]. More recently, a meta-analysis showed an improvement in an inflammatory marker, namely C-reactive protein, with Mg supplementation [16].
There are limited national and local data in regards to the relationship between T2D and serum Mg level. Here, our primary goal was to determine the prevalence of hypomagnesemia among a random sample of T2D patients. Also, we assess the relationship between serum Mg level and glycemic control, cardiovascular markers, and T2D-related complications.
Material and methods
A cross-sectional study was performed concerning adult patients with T2D who attended the Endocrine and Diabetes Center, Taif, Saudi Arabia, who had a follow-up visit to the center between September 2015 and March 2017. Patients were asked to participate, and verbal consent was taken from the participants. Those with known hypomagnesemia, patients with type 1 diabetes, gestational diabetes, patients with end-stage renal disease, and those on magnesium supplementations were excluded.
The eligible patients were interviewed, and the personal, social, and educational related data were collected. Data about complications, comorbidities, and treatment modalities were collected at the time of the visit. Both hypertension and hyperlipidemia diagnoses were based on the clinical diagnosis code along with having been on medical treatment for that. A patient was considered to have cardiac disease if the patient had a history of myocardial infarction and/or had a history of coronary related interventions. If a patient had a confirmed history of diabetes and his glycated hemoglobin (HbA1c) was controlled (< 7%) without diabetes related medications then the patient was considered to have diet control diabetes. Also, data about the lifestyle habits, which include passive and active smoking as well as physical activities, were collected. If a patient reported no regular physical activity program then the patient was considered to have a sedentary lifestyle. The patients were also asked whether they frequently (weekly) suffered from hypoglycemia events.
Vital signs, height, and weight were measured on the same visit, and BMI was calculated by the nursing staff. Recent laboratory data were collected from the patient’s electronic medical record. Data about glycemic control were assessed using HbA1c. To assess nephropathy, we collected data about urine microalbuminuria and serum creatinine. Patients who had positive albuminuria or a decline in glomerular filtration rate (GFR) were considered to have nephropathy.
We grouped patients according to the serum Mg level. Those with serum magnesium level < 0.7 mmol/l were considered to have hypomagnesemia. Otherwise, patients were considered to have a normal serum Mg level. We also collected data about vitamin D and calcium level. Also, vitamin D and calcium supplementation history was recorded.
Results
A total of 285 patients with T2D were included in the study. The mean age was 59.4 ±12.7 years, and the majority were female, with long-standing T2D, with a mean BMI in the obesity category, and most with comorbid conditions (Table I). Neuropathy was the most common complication, followed by nephropathy, while diabetic foot was the least common complication. Metformin was the most common oral hypoglycemic agent, basal insulin was the most common insulin prescribed, and more than half of the patients were on a statin. The mean HbA1c was 8.2 ±2.2% and mean serum Mg level was 0.75 ±0.1 mmol/l. More than two-thirds of the patients reported sedentary lifestyle modifications and few of the study cohorts were active smokers.
Table I
Baseline characteristics for the whole cohort
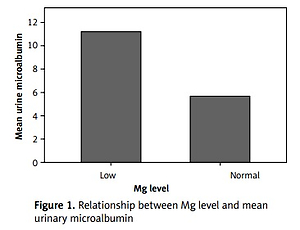
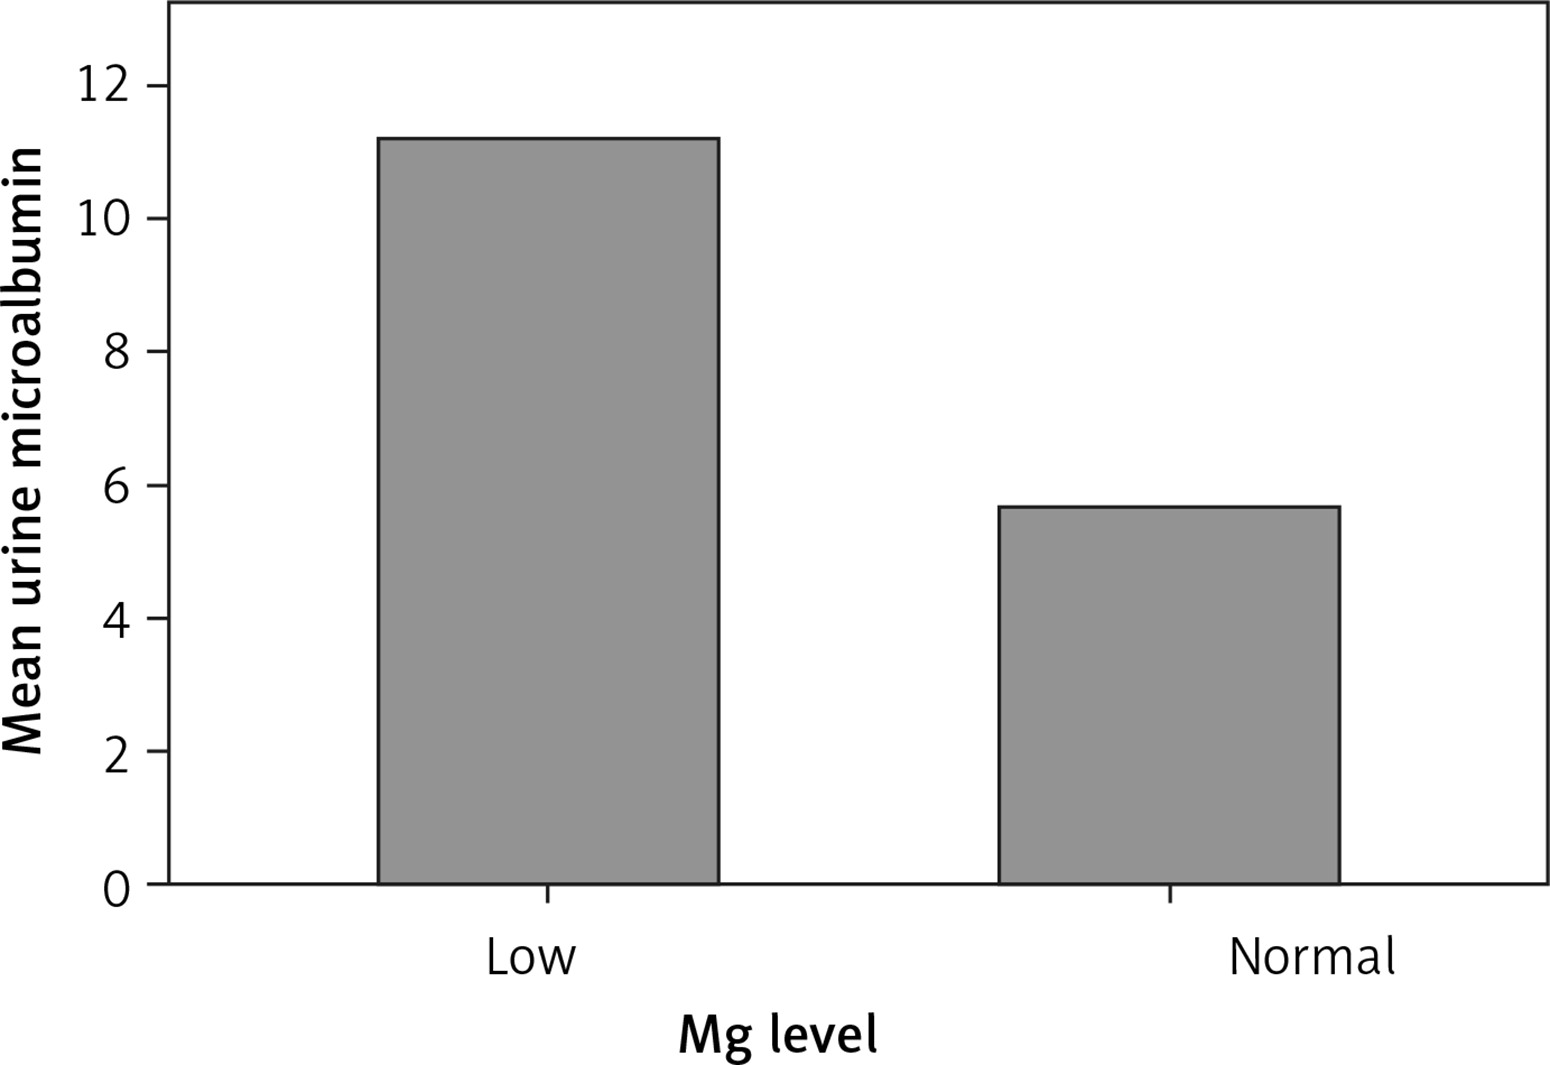
Of the screened T2D patients enrolled, 28.4% had hypomagnesemia. Compared to those with an optimal serum Mg level, those with hypomagnesemia were more likely to be female (p = 0.106), with a longer T2D duration (p = 0.154), to have a bachelor degree (p = 0.034), less likely to be on diet control (p = 0.034), more likely to be on metformin (p = 0.004), more likely to be on glargine insulin (p = 0.045), more likely to be on statin (p = 0.031), to have worse glycemic control (p < 0.05), and with a higher pulse rate (p = 0.039) (Table II). Those with hypomagnesemia were significantly more likely to have a history of diabetic foot (p = 0.010) and, except for retinopathy, all other complications and comorbidities were more common (non-significantly) in those with hypomagnesemia. Those with low hypomagnesemia were more likely to have higher mean urinary microalbumin (Figure 1).
Table II
Baseline characteristics based on magnesium status
Partial correlations adjusting for age, gender, educational level, BMI, systolic blood pressure (SBP), diastolic blood pressure (DBP), duration of DM, active smoking, passive smoking, and exercise showed a significant negative correlation between Mg level and fasting glucose while there was a significant positive correlation between Mg level and both total cholesterol and triglyceride level. No significant correlation was found between vitamin D and any of the laboratory findings or T2D-related complications or treatment modalities (Table III).
Table III
Partial correlation done adjusting for age, gender, educational level, BMI, SBP, DBP, duration of DM, active smoking, passive smoking and exercise (*p-value < 0.05)
Discussion
Here we found that about 28.4% of the screened patients had hypomagnesemia. A previous small study reported a prevalence of 11% [17], whereas a more recent larger study reported a prevalence of 9.7% [18]. Another smaller study reported that 58.6% of the screened patients had hypomagnesemia [19]. The difference observed in the prevalence of the above-cited studies and ours might be related to the patients’ dietary habits, glycemic control, and ethnicity. Also, our study participants have long-standing T2D, which might explain the observed high prevalence of hypomagnesemia compared to other studies.
A previous study showed that glucose level is one the major determinant for the Mg level [20]. Our study showed a significant negative correlation between serum Mg level and fasting glucose, and we observed that our T2D patients with hypomagnesemia had a higher HbA1c level. This concurs with a previous study that also detected a negative correlation between serum Mg and fasting glucose [21]. This relationship is consistent with the findings of a previous intervention study in which oral Mg intake showed an improvement in the glycemic control when compared to placebo [22]. Although our study showed a positive correlation between the Mg level and the fasting triglyceride and total cholesterol level in the adjusted modules, a previous study showed improvement in those parameters with Mg supplementations in individuals with metabolic syndrome [23].
In our study, we found that T2D patients who were taking metformin, glargine insulin or statin were significantly more likely to have hypomagnesemia. A recent study showed that T2D patients who are on metformin alone or combined with another drug are more likely to have hypomagnesemia when compared to diet control [24]. However, adjusted models in our study and the above-cited study showed non-significant correlations. Therefore this association may not indicate causality, as it might be explained by the patients’ profile, specifically the worse glycemic control and the comorbidities, rather than treatment modalities.
Our study shows that those with hypomagnesemia are more likely to have diabetic foot or a history of limb amputation. Previous studies have shown a negative correlation between serum Mg level and macrovascular complications [25]. Another study showed that T2D patients with macrovascular complications had a lower serum Mg level [21]. Also, our study showed that those with a normal Mg level were more likely to have lower mean urine microalbumin level. This concurs with a previous study’s finding that those with proteinuria were more likely to have hypomagnesemia due to renal Mg loss [26].
Weaknesses of our study include it being limited to a single center, its small sample size, and the study design. Strengths of our study include the comprehensive clinical and laboratory data. Future larger studies with an intervention design are now needed.
In conclusion, almost one-third of the screened T2D patients in our study had hypomagnesemia. Hypomagnesemia was associated with the treatment modalities, worse glycemic control, and with peripheral artery disease. In future work, larger national studies are needed to confirm our findings and to plan an intervention study.