Introduction
Osteoarthritis (OA) is one of the most common joint diseases, profoundly impacting the quality of life of millions of individuals worldwide. It primarily arises from cartilage damage but eventually involves the entire joint [1, 2]. The incidence of OA increases significantly with age, making it a major public health concern in aging populations [3–5]. In 2021, it was estimated that more than 22% of adults over 40 years old suffered from knee OA, impacting over 500 million individuals worldwide and placing a substantial burden on healthcare systems [6].
Various risk factors, including age, gender, obesity, genetics, and joint injuries, have been associated with OA progression [7–9]. Pathologically, OA is characterized by joint cartilage degeneration and secondary osteophyte formation, accompanied by primary symptoms such as joint pain, swelling, and restricted mobility. These symptoms not only limit daily activities but also contribute to psychological distress, further exacerbating the overall burden of the disease [7, 10–12].
Recent advances in OA research have highlighted the critical roles of various molecular players, including cytokines, non-coding RNAs (ncRNAs), signaling pathways, and metalloproteinases [13–16]. Inflammatory cells and their associated mediators, including IL-6 and TNF-α, have been implicated in OA pathogenesis, inducing the expression of metalloproteinases (MMPs) and contributing to disease progression. Additionally, dysfunction of macrophages plays a pivotal role in OA pathogenesis. Despite advances in treatment, OA remains incurable due to gaps in understanding the intricate pathogenic mechanisms underlying its onset and progression [17, 18]. Therefore, elucidating the pathological signaling pathways and key molecules involved in OA pathogenesis is imperative for identifying treatment targets and developing pharmaceutical interventions.
Long non-coding RNA (lncRNA), characterized by its sequence length exceeding 200 nucleotides, has emerged as a pivotal player in diverse biological processes, including epigenetic regulation, immune modulation, and signal transduction [19, 20]. In OA, several lncRNAs have been implicated in disease pathogenesis, highlighting their diverse roles in disease modulation [18, 21]. For instance, the m6A-mediated upregulation of AC008 has been found to promote OA progression through the miR-328-3p-AQP1/ANKH axis [22]. Conversely, exosomes derived from bone marrow mesenchymal stem cells, facilitated by the lncRNA LYRM4-AS1-GRPR-miR-6515-5p pathway, exhibit a protective influence on OA [23]. Additionally, DANCR and lncRNA KLF3-AS1 have been recognized as molecular sponges for miRNAs, regulating the expression of their target genes and impacting OA pathogenesis [24–26].
The concept of competitive endogenous RNA (ceRNA) has further expanded our understanding of the complex regulatory networks in OA. ceRNA networks involve interactions among lncRNAs, miRNAs, and mRNAs, which regulate gene expression and contribute to disease pathogenesis [27, 28]. Investigating these networks offers novel insights into the molecular underpinnings of OA, potentially identifying new therapeutic targets and diagnostic biomarkers.
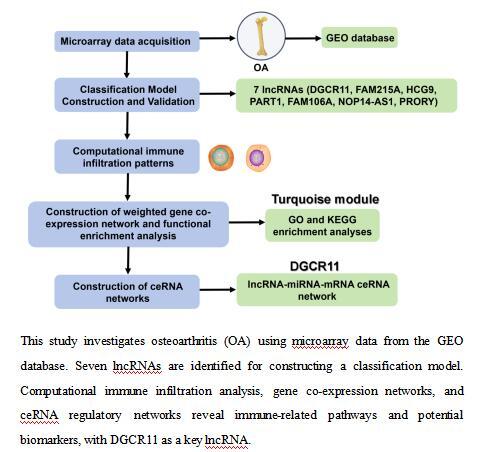
In this study, we aimed to explore the immune-related ceRNA network in OA through systematic analysis of transcriptome data from OA tissues and healthy controls. We identified differentially expressed lncRNAs and constructed a classification model incorporating key lncRNA features associated with OA. To further elucidate the functional relevance of these lncRNAs, we performed weighted gene co-expression network analysis (WGCNA) and built a ceRNA network to elucidate the regulatory interactions among lncRNAs, miRNAs, and mRNAs involved in OA pathogenesis. By integrating multi-omics data and bioinformatics analysis, our goal was to discover potential diagnostic biomarkers and therapeutic targets for OA, which could significantly impact the development of personalized medical approaches for individual patients. In summary, our study provided a comprehensive framework for understanding the immune-related ceRNA network in OA, offering new insights into the molecular mechanisms driving disease progression, and highlighting potential avenues for therapeutic interventions.
Material and methods
Microarray data acquisition
Microarray data of synovial tissue in OA were obtained from the GEO database. The training set included the GPL96 datasets GSE55584, GSE55457, and GSE55235, with 26 OA samples and 17 normal tissue samples. The testing set comprised the GPL96 dataset GSE12021, with 8 OA samples and 10 normal tissue samples. For the training set, data integration, background correction, and normalization were performed using the “affy” package [29].
Classification model construction and validation
The Least Absolute Shrinkage and Selection Operator (LASSO) method was used as a regularization technique to construct a refined model by applying penalties. Based on the differentially expressed lncRNAs, we used the “glmnet” package to perform LASSO regression and logistic regression analysis, followed by a 10-fold cross-validation model for building [30]. Principal component analysis (PCA) was performed using the “pcaMethods” package in R [31]. Test sets were used to validate the above results.
Computational immune infiltration patterns
CIBERSORT, a robust deconvolution method, was used to quantify the infiltration of immune cell populations [32]. We calculated the proportions of 22 immune cell subsets in the pooled samples. The comparison between normal tissue and the OA group was tested using the Wilcoxon test. The correlation between 24 lnRNAs and immune cell subsets was compared by Pearson correlation analysis. P-values < 0.05 were considered significant.
Construction of weighted gene co-expression network and functional enrichment analysis
All mRNAs in the training set were used to construct a gene co expression network, which was implemented using the R software “WGCNA” package [33]. Subsequently, an appropriate soft threshold of 16 was selected, and the Dynamic Tree Cut method was used to generate modules, with minModuleSize set to 100 and height cutoff set to 0.2. For each module, Gene Ontology (GO) and Kyoto Encyclopedia of Genes and Genomes (KEGG) enrichment analyses were performed using the “clusterProfiler” package [34]. P < 0.05 was considered significant.
Construction of ceRNA networks
According to the ceRNA theory, the steps for constructing the lncRNA-miRNA-mRNA ceRNA network were as follows: (1) Differential miRNAs were screened from GSE143514, with the screening criteria set at |logFC| > 1 and p < 0.05; (2) interactions between GUSBP11 and miRNAs were predicted using miRcode (http://www.mircode.org); (3) interactions between miRNAs and miRNAs were predicted using starBase (https://starbase.sysu.edu.cn/) and miRDB (http://mirdb.org/); (4) intersection genes between the hub genes and the predicted mRNA in the pink module were selected, along with miRNAs interacting with GUSBP11, to construct a ceRNA network. Networks were visualized using Cytoscape software [35].
Results
Identification of differentially expressed lncRNAs and construction of a classification model
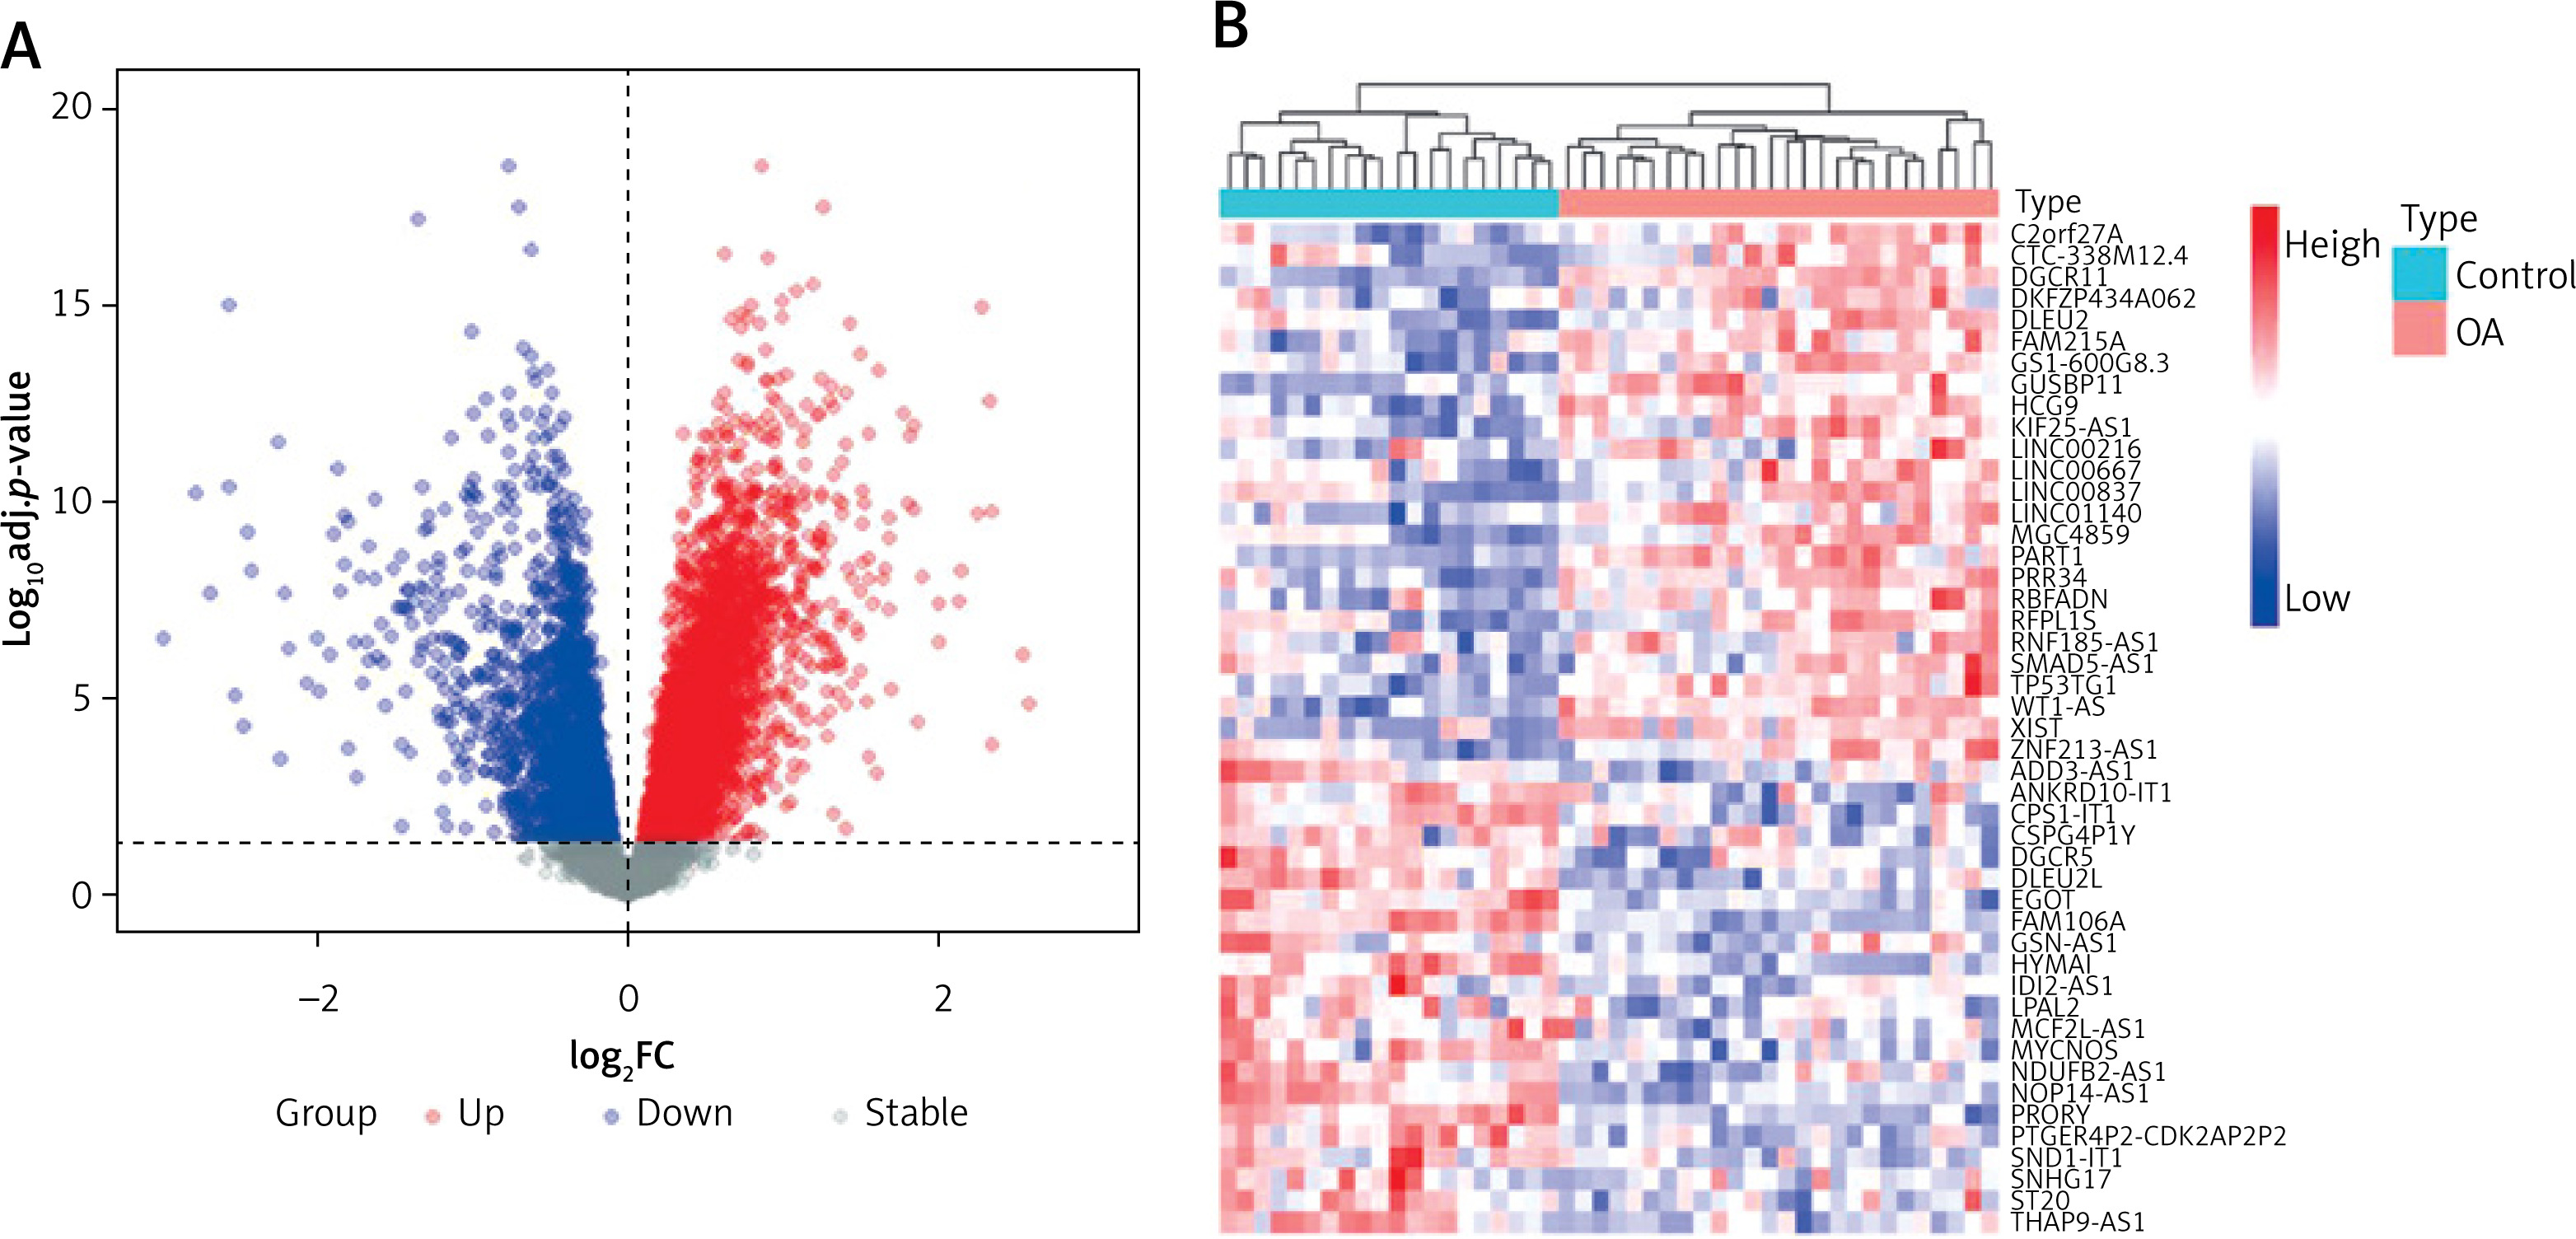
We selected the training set for analysis and identification of differentially expressed genes (DEGs). A total of 5927 DEGs were identified at p.adj < 0.05 (Figure 1 A). Among them, 47 differentially expressed lncRNAs (DELs) were identified in OA samples compared to lncRNAs in normal tissues, including 22 downregulated genes and 25 upregulated genes (Figure 1 B).
Figure 1
Transcriptional expression profiles in control and osteoarthritis (OA) samples. A – Volcano plot showing the differentially expressed genes between control and OA samples. B – Dendrogram showing the hierarchical clustering of control and OA samples based on differentially expressed lncRNAs (DELs), respectively
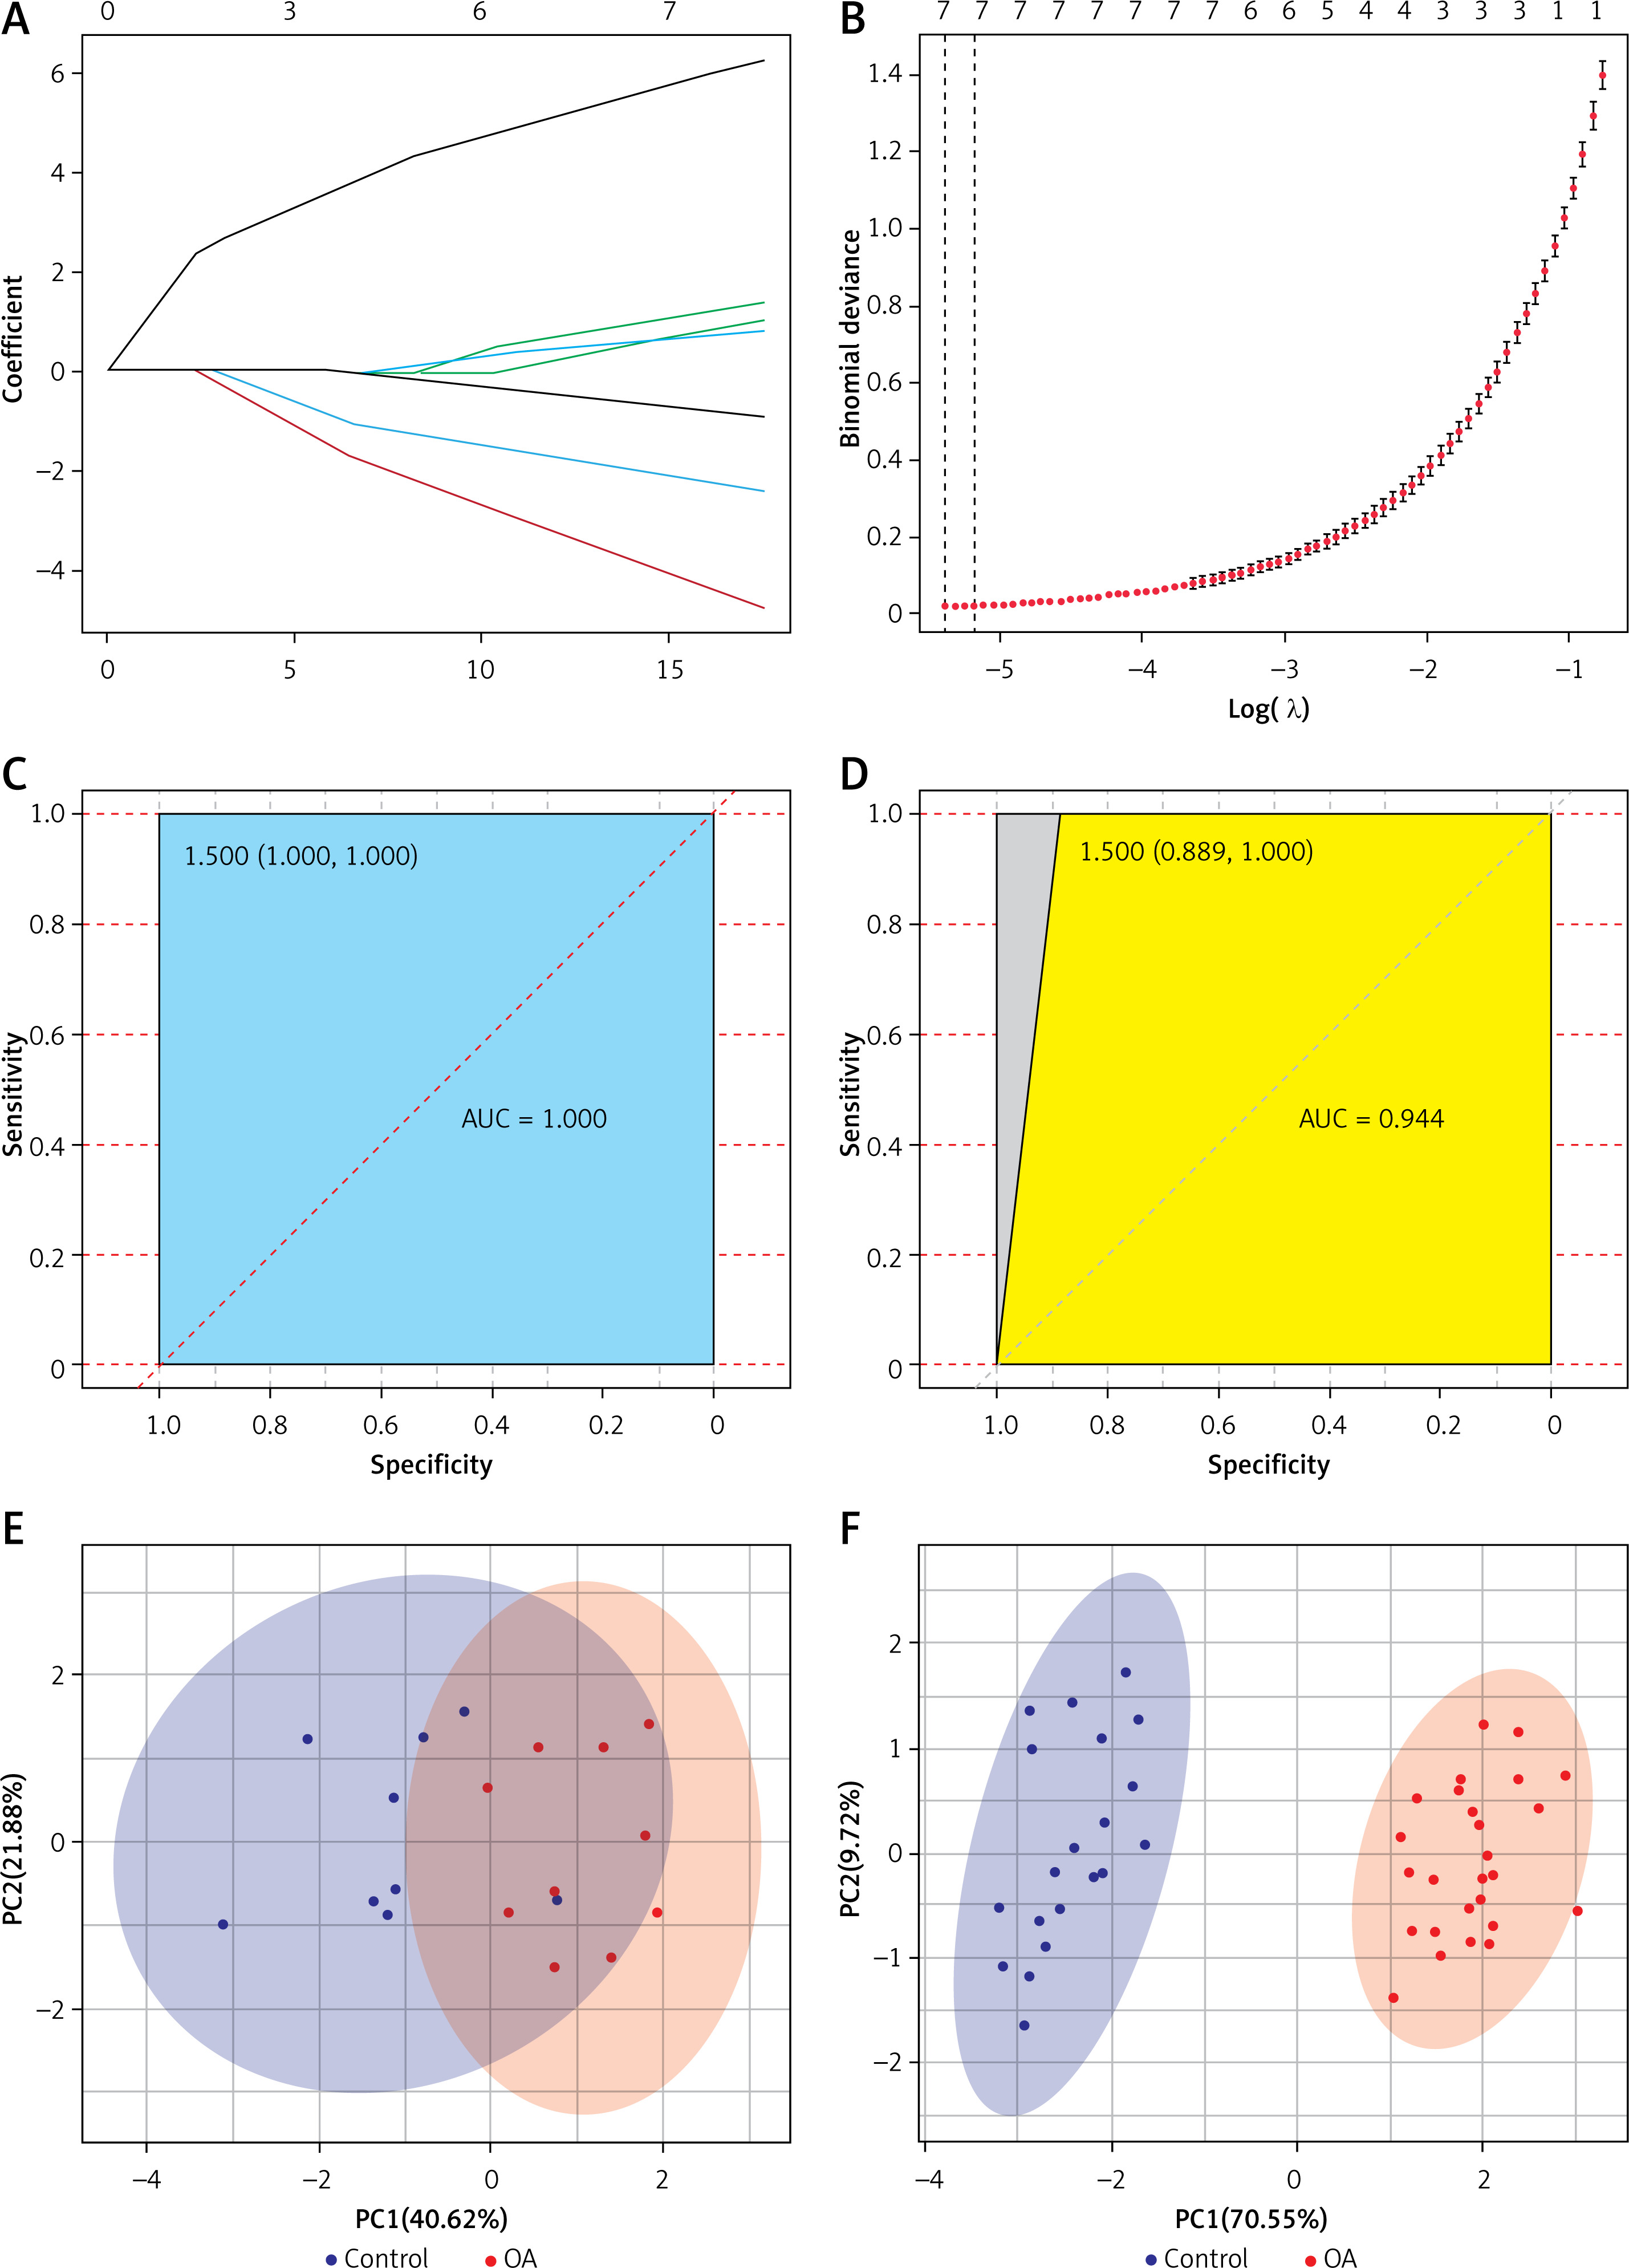
To further narrow down the varieties and construct a classification model, we constructed LASSO regression models using 47 DELs. The final 7 lncRNAs (DGCR11, FAM215A, HCG9, PART1, FAM106A, NOP14-AS1, PRORY) formed the classification model (Figures 2 A, B). The area under the receiver operating characteristic (ROC) curve for the training set was 1, which shows that the model combining 7 lncRNAs was more reliable than the classification of a single lncRNA (Figure 2 C). A single lncRNA was used to predict the classification model with the highest AUC value of 0.95 (DGCR11) (Supplementary Figure S1 A). We validated the model on the test set, where the combined AUC was 0.944 (Figure 2 D), while the highest single lncRNA was 0.889 (FAM106A) (Supplementary Figure S1 B). PCA analysis of the training and test sets showed that the normal samples had a completely different distribution pattern to the OA tissue (Figures 2 E, F). These results suggested that the model can effectively discriminate OA samples from healthy controls.
Associations between 7 selected lncRNAs and immune cell subsets
Next, we investigated the relationship between the 7 selected lncRNAs and immune cell infiltration in OA tissues. Using the CIBERSORT algorithm, we assessed the infiltration of 22 immune cell types in 26 OA tissue samples. The Wilcoxon rank test revealed that six immune cells showed significant differences in infiltrating levels between normal and OA tissues (Figure 3 A). Compared with normal tissues, OA tissues had higher proportions of memory B cells, M1 macrophages, M2 macrophages, and resting mast cells (all p < 0.05), and lower levels of naïve B cells, activated dendritic cells, activated mast cells, CD4 memory resting T cells, and CD8 T cells (all p < 0.05).
Figure 3
Association analysis between differential lncRNAs and immune infiltration. A – Expression of immune cells in control and osteoarthritis tissues. B – Correlation heatmap between differential LncRNA and immune cells
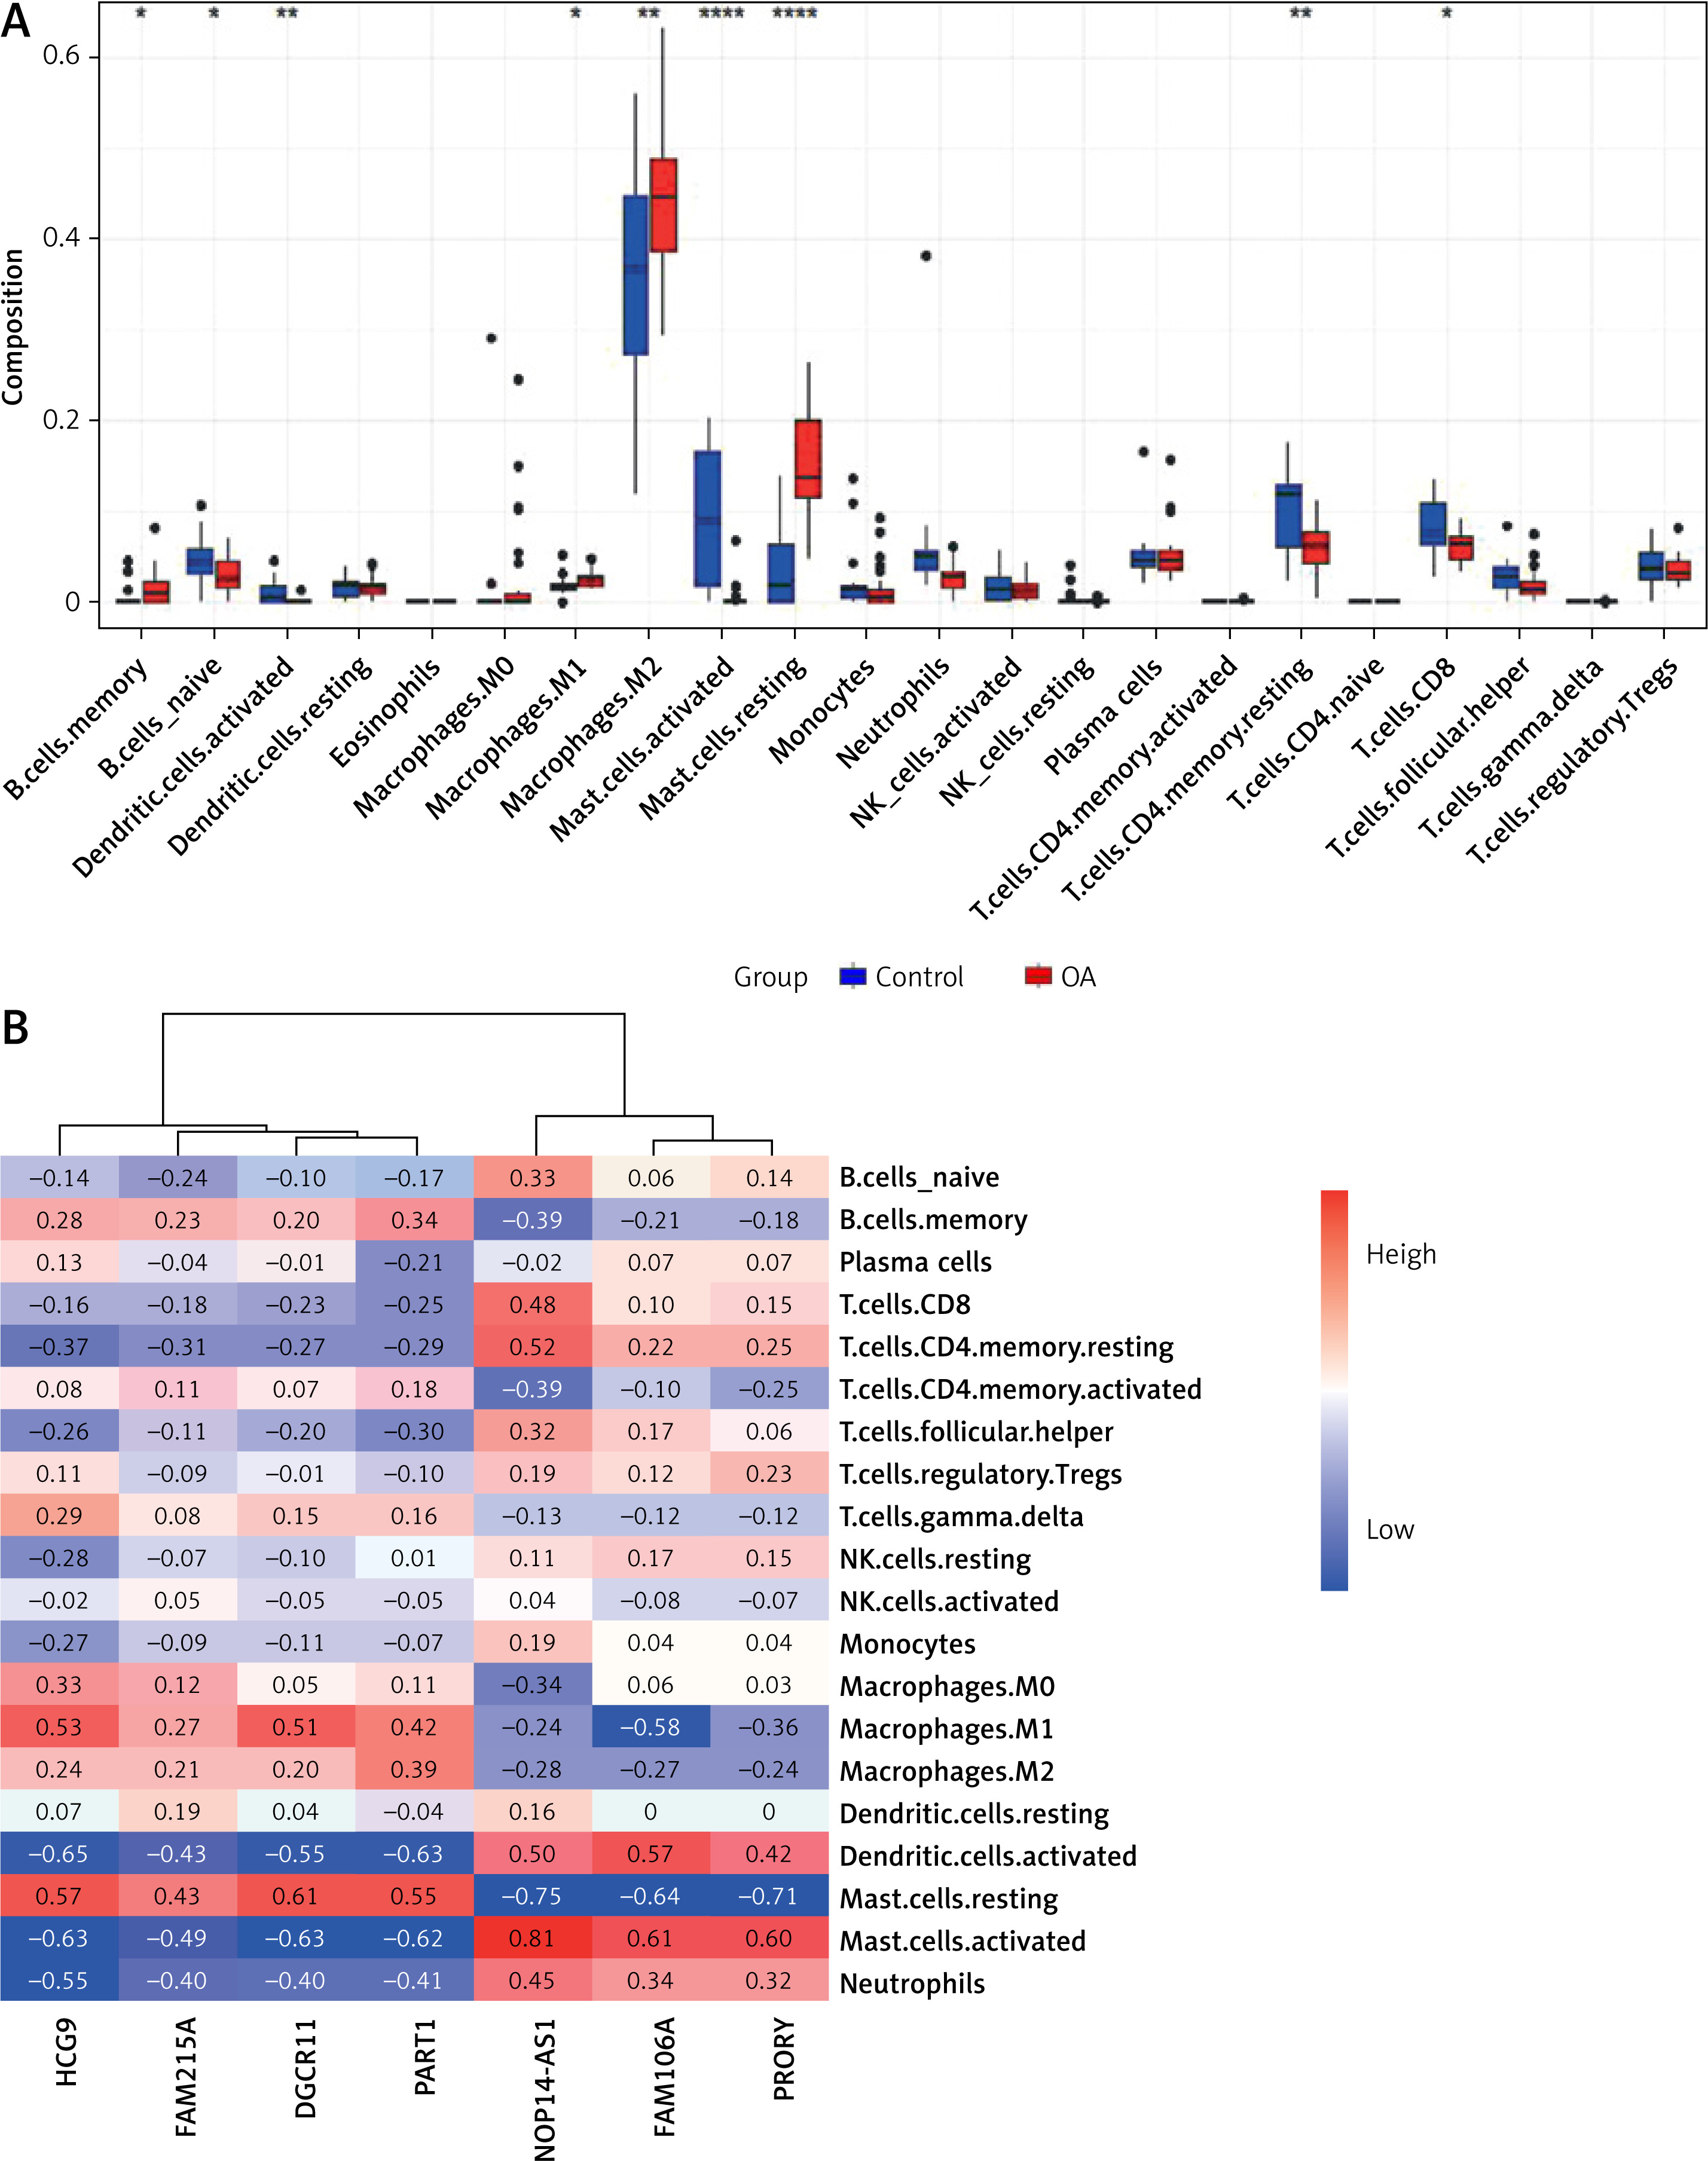
To explore the relationship and immune signatures between seven selected lncRNAs, we performed Spearman’s correlation analysis (Figure 3 B). The heatmap showed that lncRNA PART1 was positively correlated with memory B cells, M1 macrophages, M2 macrophages, and resting mast cells (R > 0.3; p < 0.05). LncRNA NOP14-AS1 was positively correlated with naïve B cells, activated dendritic cells, activated mast cells, CD4 memory resting T cells, and CD8 T cells (R > 0.3; p < 0.05). These results indicated a strong correlation between the 7 lncRNAs and immune cell infiltration in OA.
Construction of selected lncRNA-weighted gene co-expression networks
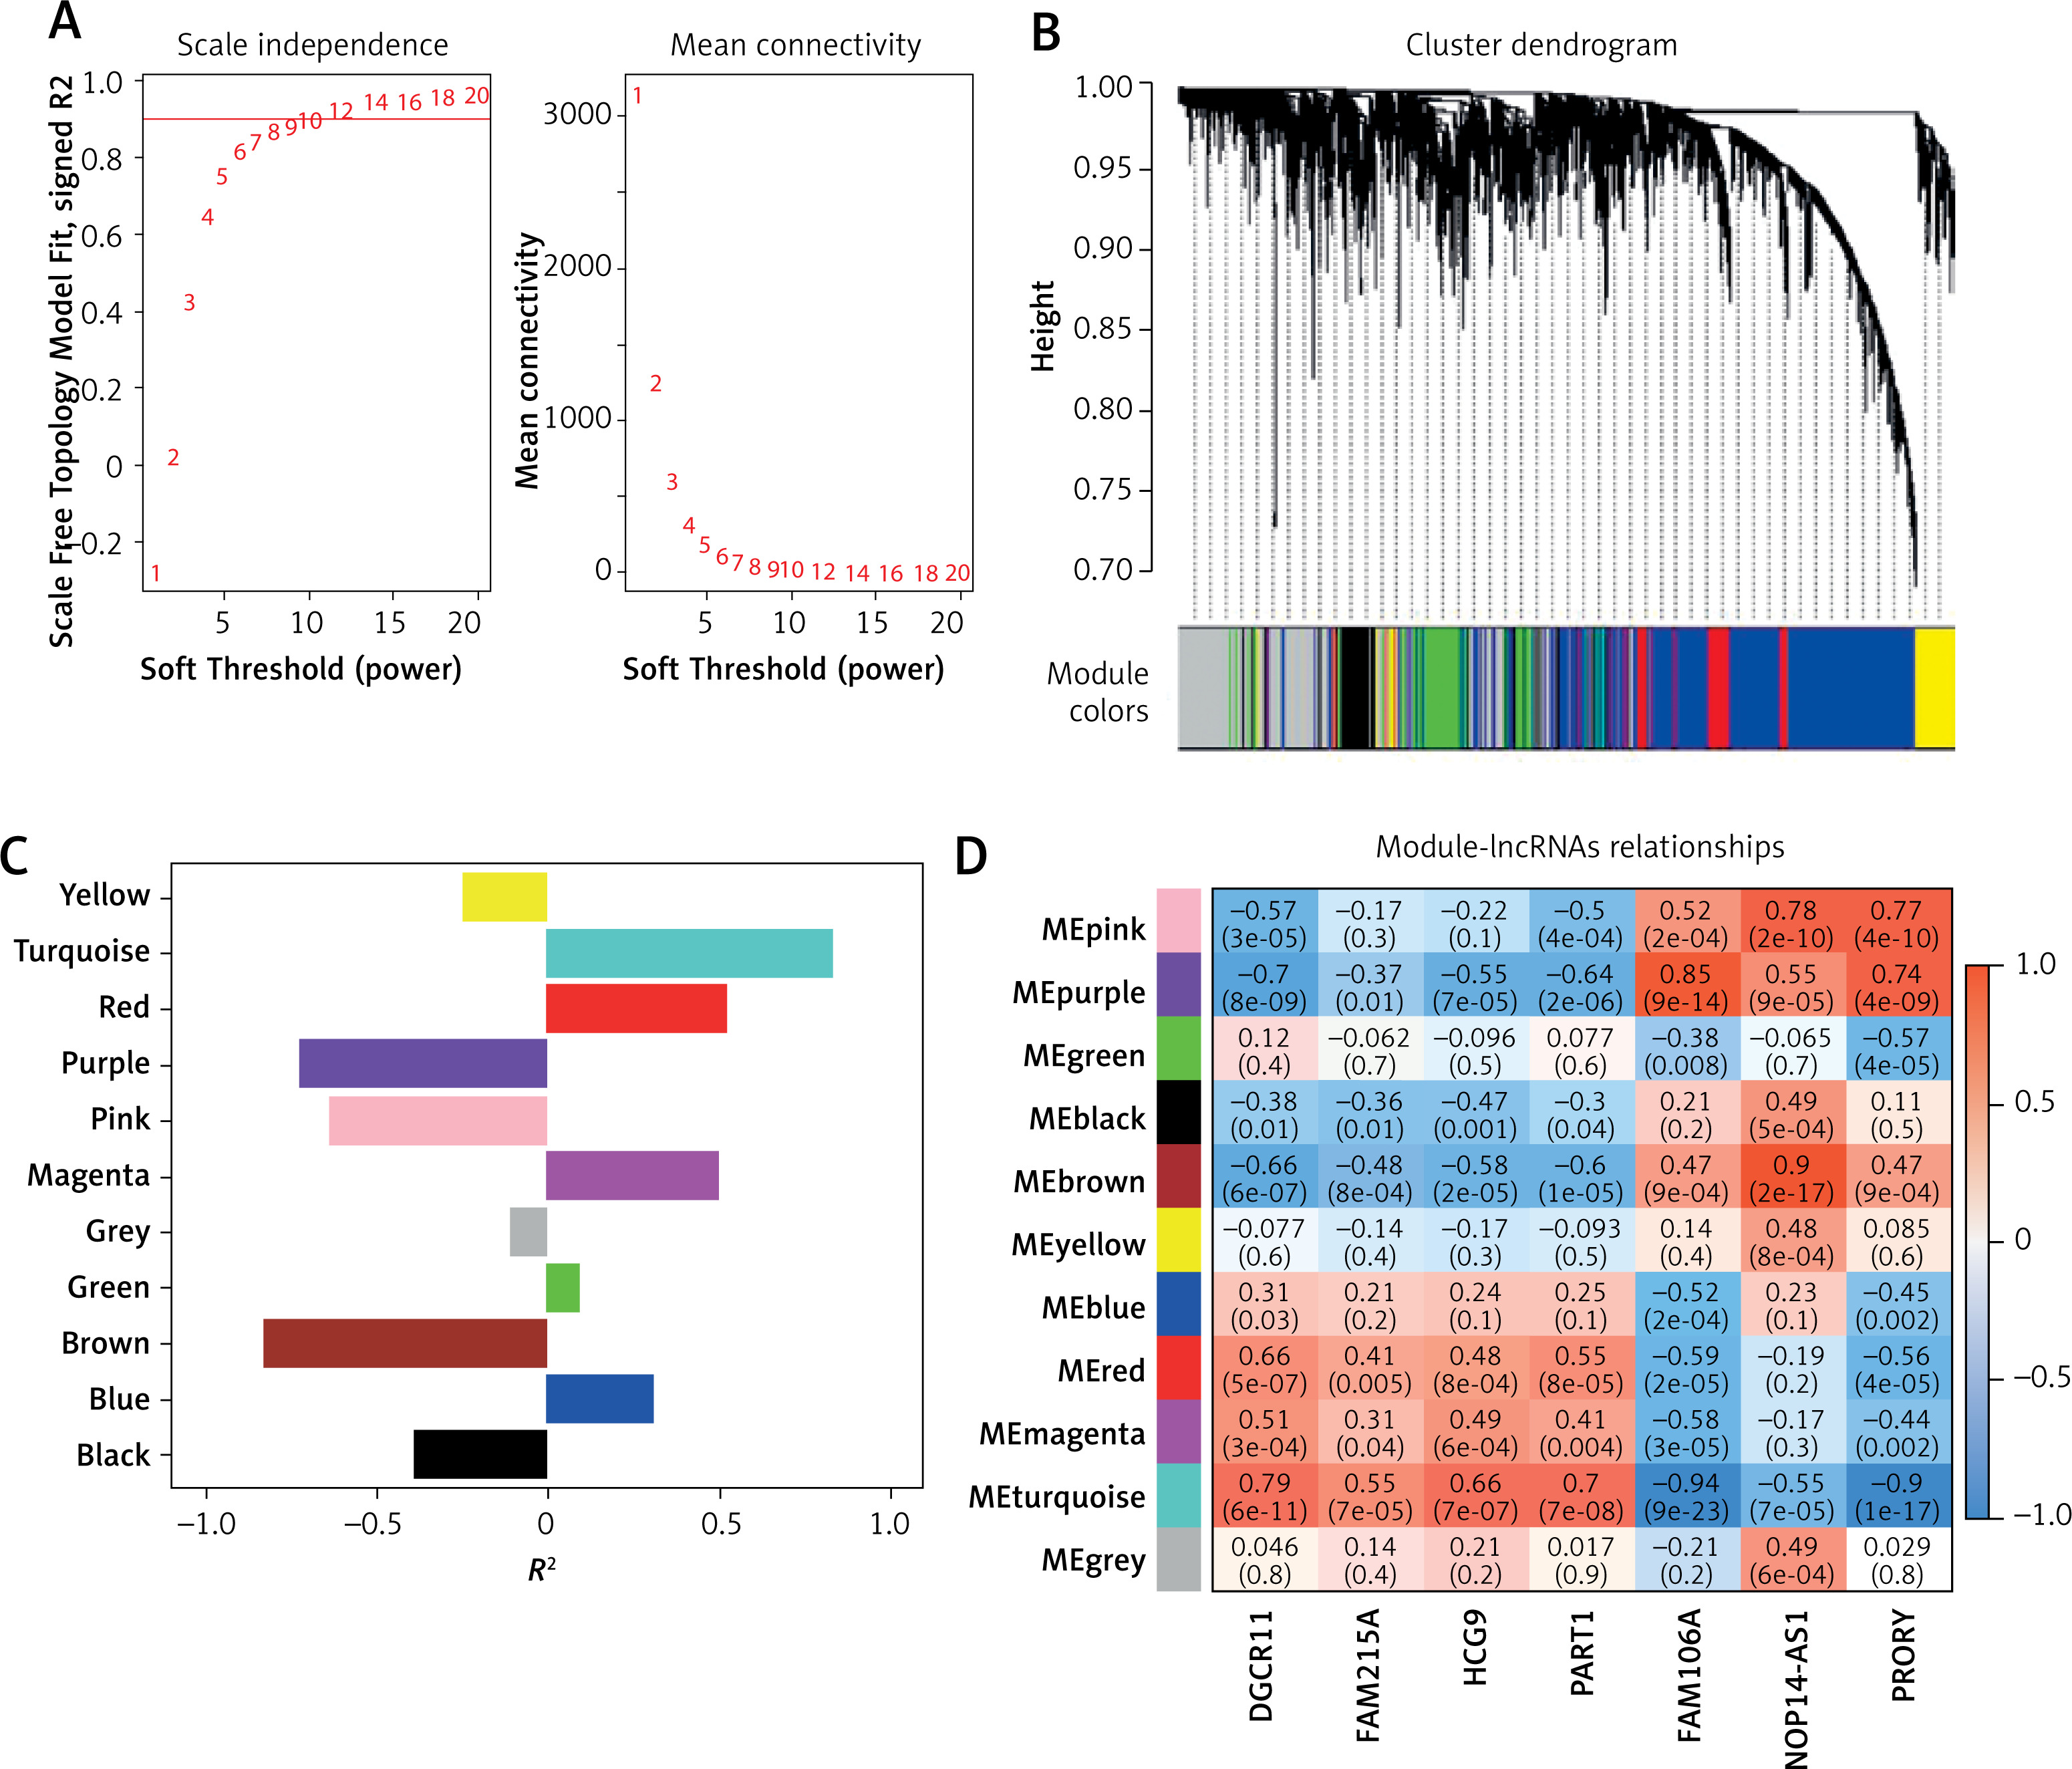
To further explore the role of these lncRNAs, we constructed WGCNA using a soft threshold of 12, ensuring that the network adhered to a scale-free distribution (Figure 4 A). This approach resulted in the identification of 10 co-expression modules (Figure 4 B), with the turquoise module showing the highest correlation with OA traits (Figure 4 C). Within the turquoise module, DGCR11, FAM215A, HCG9, and PART1 showed significant positive correlations (R > 0.3, p < 0.05), while FAM106A, NOP14-AS1, and PRORY showed significant negative correlations (R < –0.3, p < 0.05) (Figure 4 D).
Figure 4
Screening of osteoarthritis (OA)-related modules. A – Soft thresholding (power=12) to construct network graphs conforming to scale-free distributions. B – Dynamic tree cutting generates 10 co-expression modules. C – Differential expression of eigengenes in OA and controls. D – Correlation heatmap between differential LncRNAs and OA-related modules. FDR-corrected. *P < 0.05, **p < 0.01, ***p < 0.001.
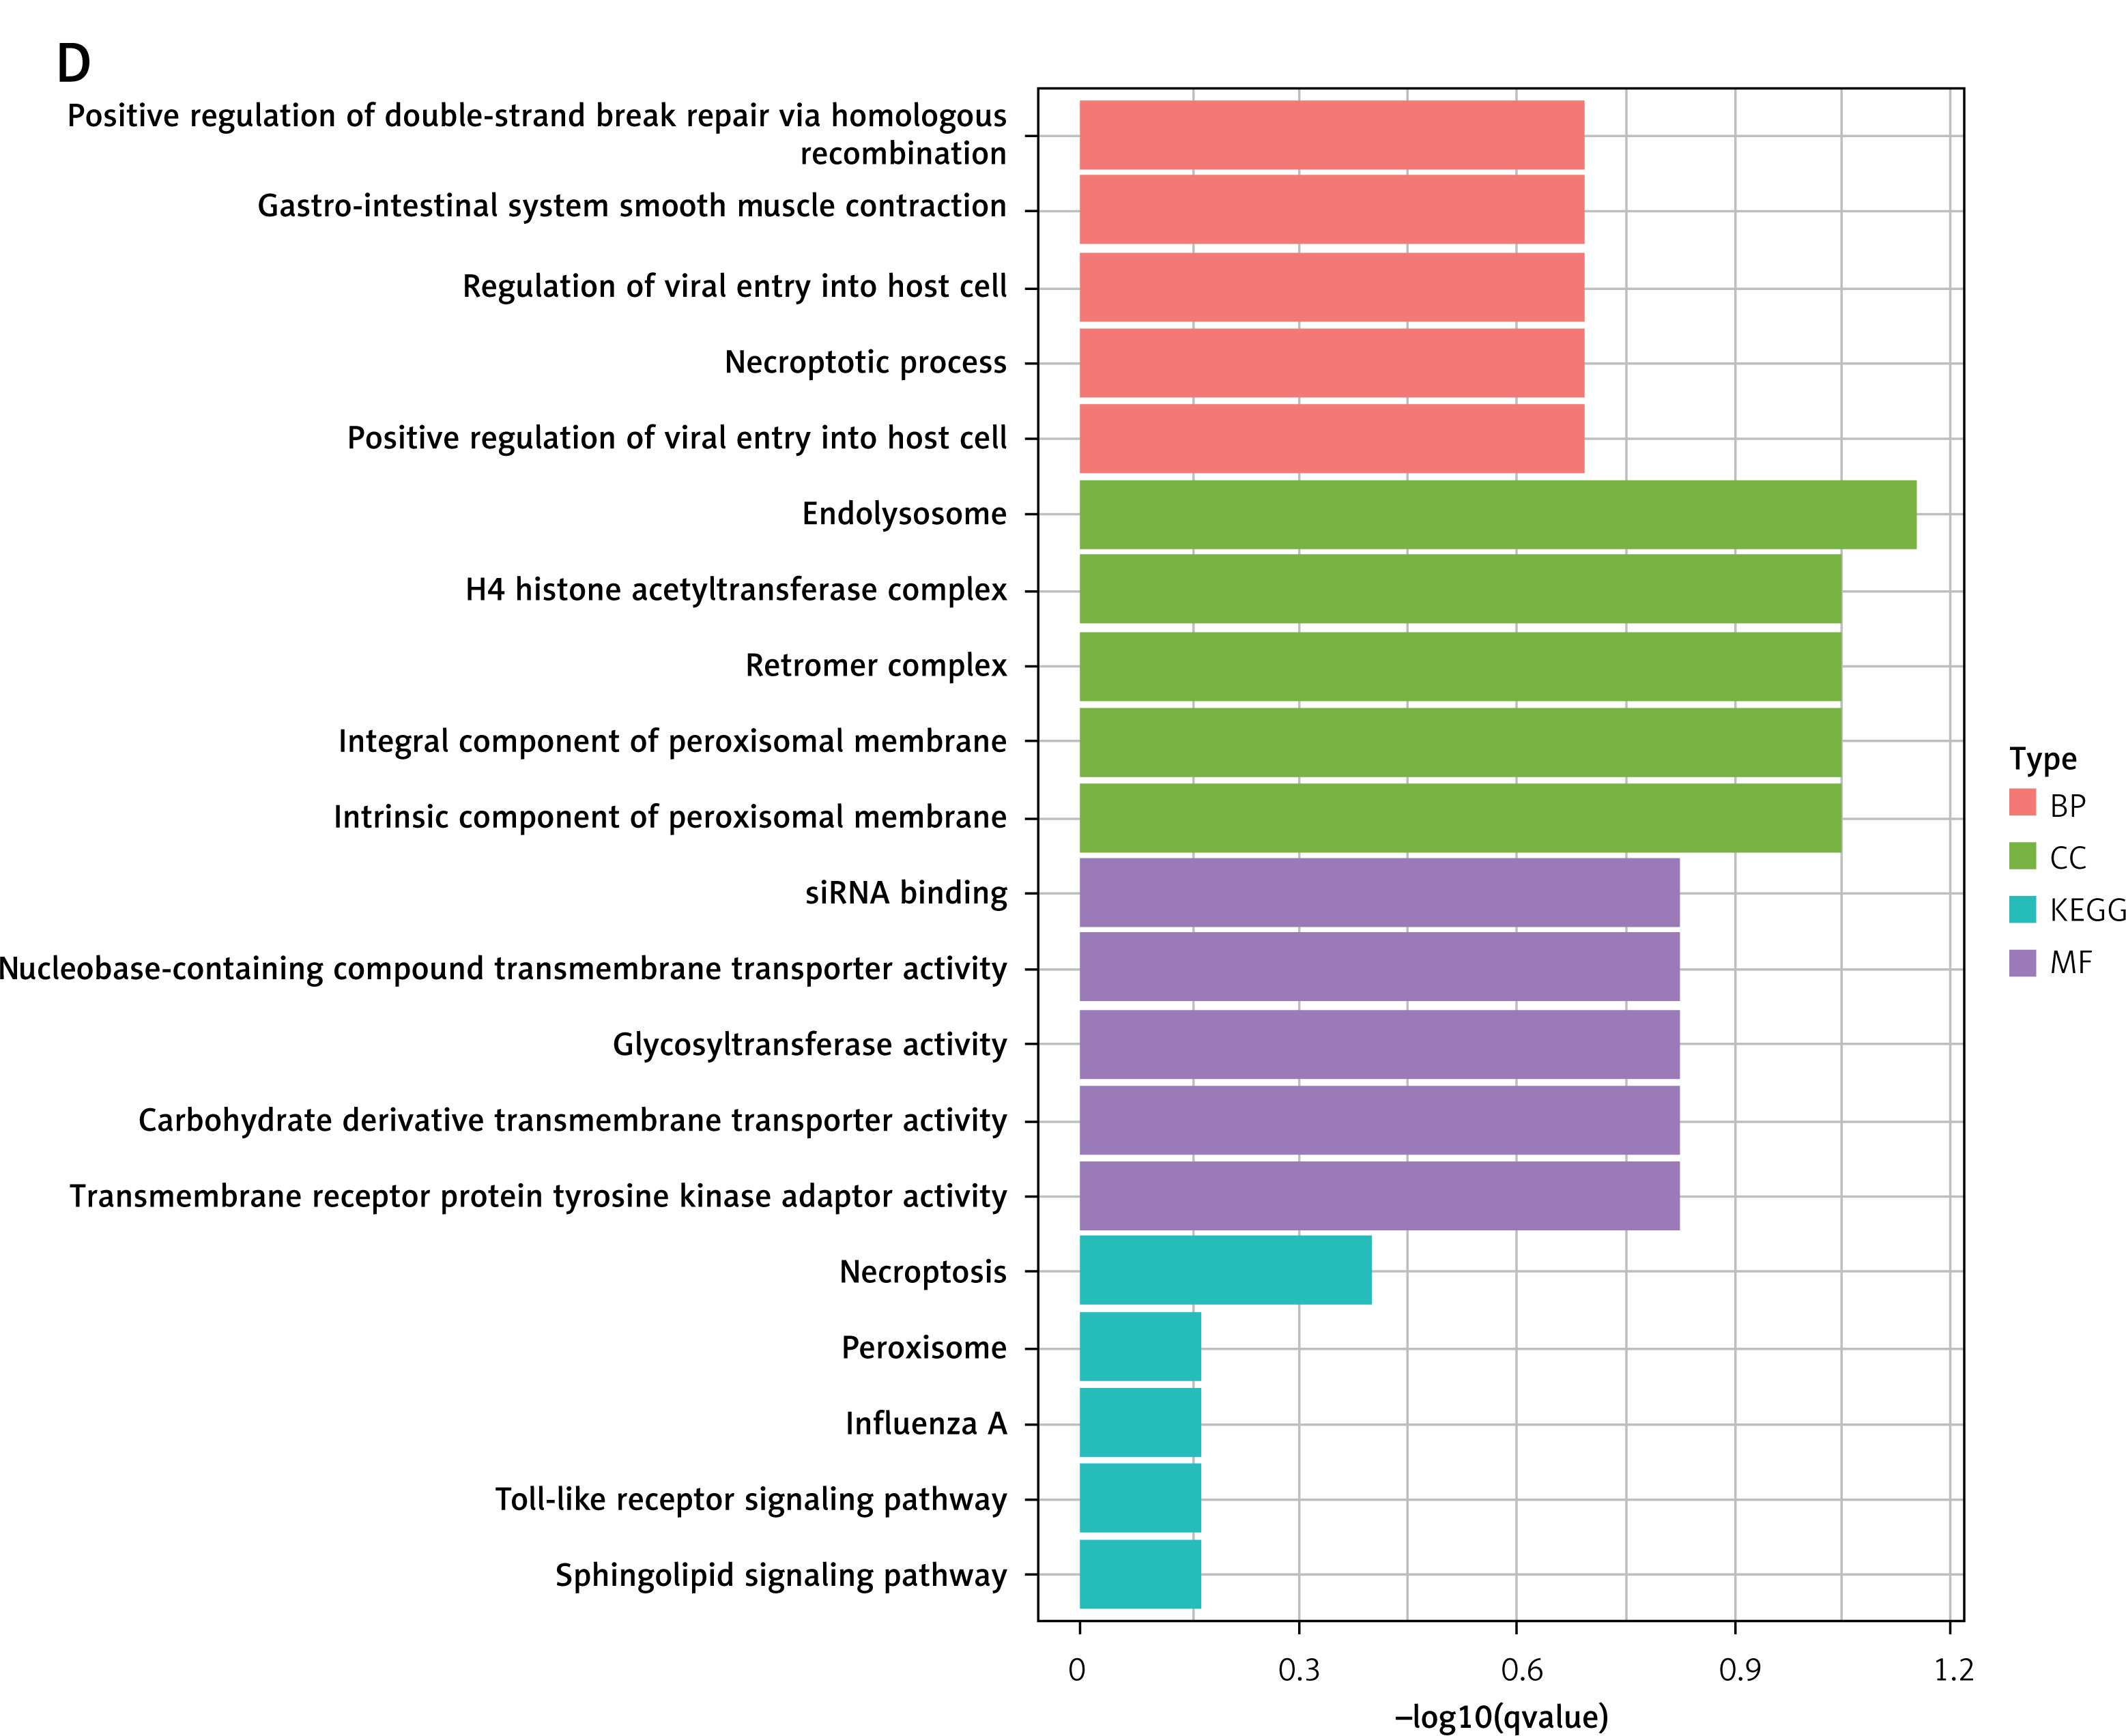
Further analysis using GO and KEGG pathway enrichment was performed on the genes within the turquoise module (Figure 5 A). To narrow the scope of the target genes of the selected lncRNAs, we performed a module membership–gene significance correlation analysis on the modules in the WGCNA network and selected the top 100 genes most strongly related to the immune signature module and OA (Figure 5 B). The Venn diagram showed that all hub genes overlapped with differentially expressed genes (Figure 5 C). GO and KEGG analyses confirmed that these hub genes were primarily involved in immunity-related pathways such as endolysosome, necroptotic process, glycosyltransferase activity, necroptosis, peroxisome, and Toll-like receptor signaling pathways (Figure 5 D). These findings underscored the central role of the turquoise module and its associated lncRNAs in the immune response related to OA.
Figure 5
Screening of osteoarthritis-related module hubs. A – GO and KEGG pathway enrichment in turquoise module. B – The screening criteria were top-100 high gene significance and high membership genes in turquoise module. C – Venn diagram of differential genes and modular hub genes. D – GO and KEGG pathway enrichment in top-100 high gene
Construction of immune-related ceRNA network
Finally, we constructed an immune-related ceRNA network focusing on DGCR11, which showed the most significant positive correlation with the module (R = 0.79, p = 6 × 10–¹¹). Using the GSE143514 dataset, we identified miRNAs and mRNAs differentially expressed in OA, and their correlations with DGCR11 was explored. Specifically, hsa-miR-122-5p, hsa-miR-138-5p, and hsa-miR-1255a were upregulated, while hsa-miR-363-3p, hsa-miR-96-5p, hsa-miR-20b-5p, hsa-miR-106a-5p, hsa-miR-675-5p, hsa-miR-548f-5p, and hsa-miR-3944-5p were downregulated (p.adj < 0.05). Spearman analysis was conducted to further examine the correlation between miRNAs and lncRNAs, demonstrating that hsa-miR-138-5p, hsa-miR-675-5p, hsa-miR-548f-5p, hsa-miR-3944-5p, and hsa-miR-1255a had a more significant correlation with lncRNA DGCR11 (|R|>0.3) (Table I). In the ceRNA network, we identified these 5 miRNA nodes and 88 mRNA nodes associated with the lncRNA DGCR11 (Figure 6 A). The Sankey diagram displays the functional pathways corresponding to the hub genes in the network. RAB7A was associated with autophagy and mitophagy, SCP2 was associated with fatty acid metabolism, and NPRL2 was associated with mTOR signaling pathway (Figure 6 B). These results highlighted the pivotal role of DGCR11 in the ceRNA network and its potential impact on immune-related pathways in OA.
Figure 6
Establishment of a ceRNA network. A – lncRNA-miRNA-mRNA network. Squares represent lncRNAs, triangles represent miRNAs, and circles represent mRNAs. B – Significantly enriched mRNAs and biological processes in which they were involved
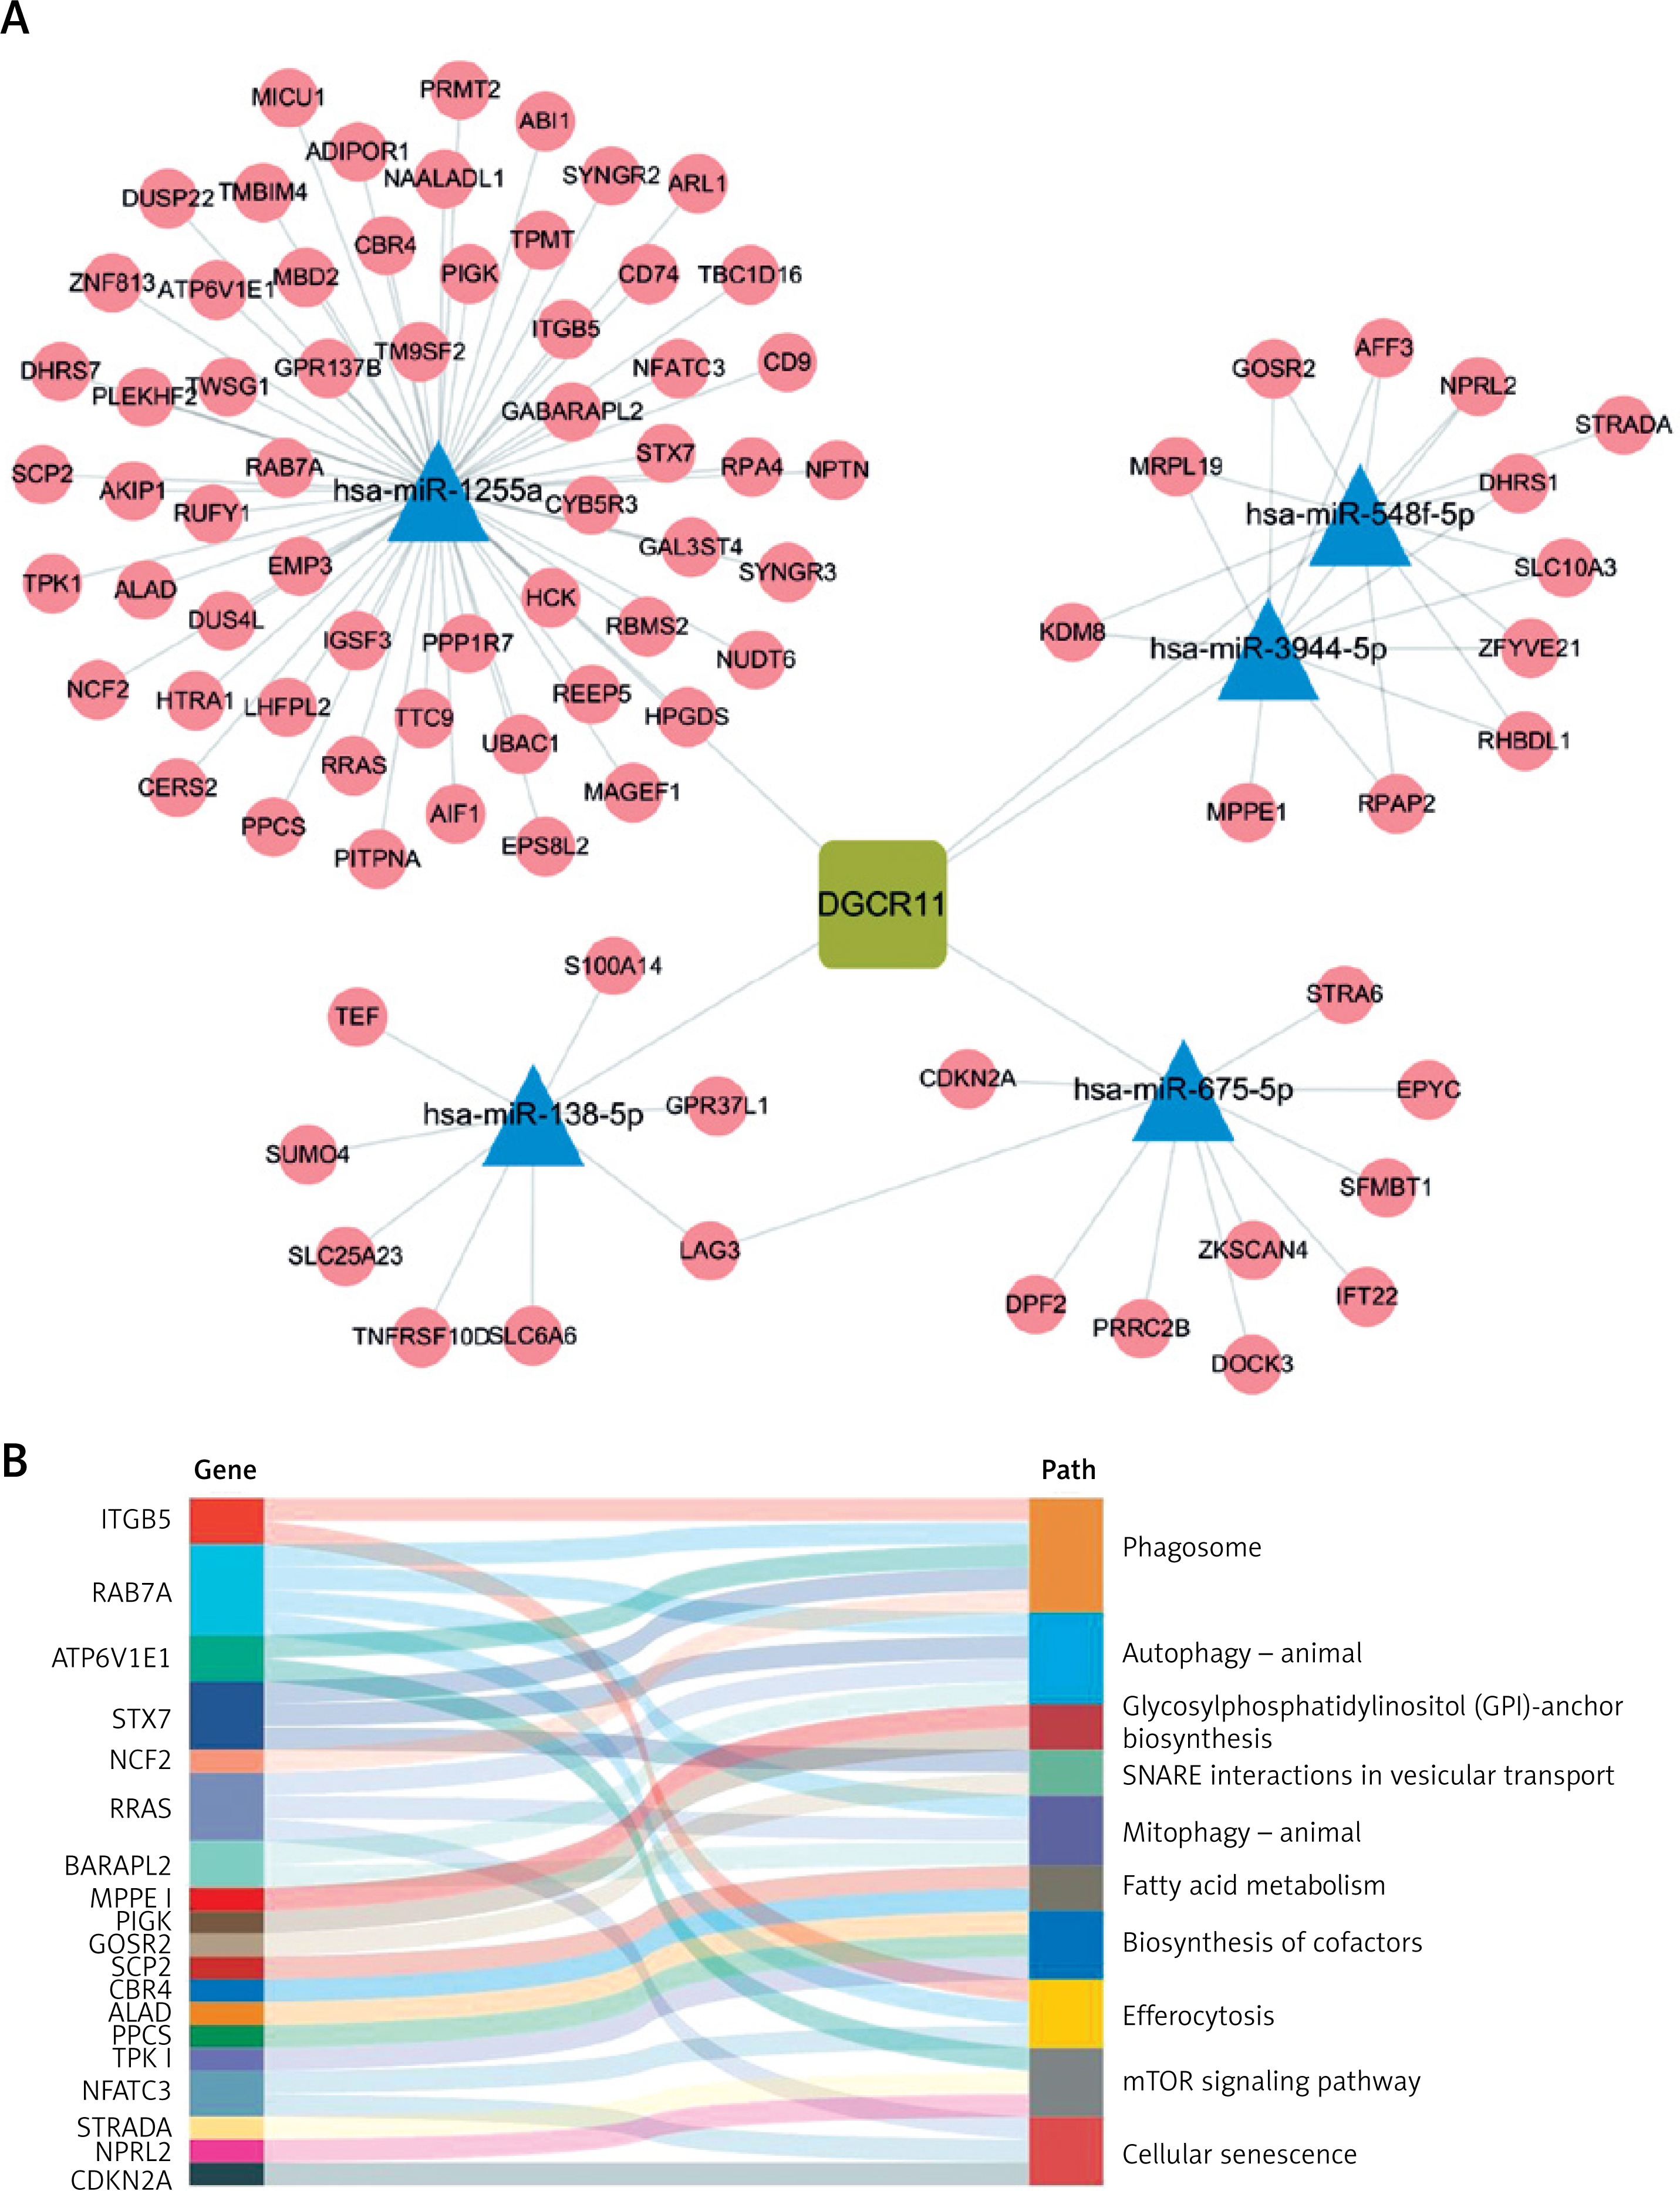
Table I
Expression levels of 10 miRNAs between control and osteoarthritis group and correlation with lncRNA DGCR11
Discussion
ceRNA networks have opened new avenues for understanding the complex pathogenesis of OA. Our study explored the immune-related ceRNA network in OA by leveraging a multi-omics approach. We identified a panel of DELs and constructed a classification model for OA with promising discriminatory power. Notably, the 7 lncRNAs included in the model exhibited significant correlations with immune cell infiltration patterns in OA tissues. Furthermore, we employed WGCNA to delineate co-expression modules and elucidate the functional relevance of lncRNAs within these modules. We identified a turquoise module with a strong correlation with OA traits and performed functional enrichment analysis on its associated hub genes, revealing enrichment in immune-related pathways. Finally, we constructed a ceRNA network centered around a key lncRNA DGCR11 within the turquoise module and identified potential miRNA and mRNA targets.
The associations between these seven lncRNAs and immune cell subsets further underscored the role of the immune system in OA pathogenesis. Our results indicated significant differences in the infiltration of various immune cells between normal and OA tissues, suggesting that immune responses play a crucial role in disease progression. The positive correlations between lncRNAs and immune cell subsets, such as memory B cells and macrophages, highlight the importance of immune modulation in OA. The ceRNA network constructed from lncRNA DGCR11 implicated various miRNAs and mRNAs, among which RAB7A and NPRL2 were found to be linked to autophagy and mTOR signaling, respectively.
The mTOR signaling pathway plays a pivotal role in cell growth, proliferation, and survival [36]. It has been implicated in various diseases, including cancer and metabolic disorders. In the context of OA, mTOR signaling is crucial because it regulates chondrocyte metabolism and cartilage homeostasis. Elevated mTOR activity has been observed in OA, leading to increased chondrocyte proliferation and reduced autophagic activity. These changes can contribute to the degeneration of cartilage and the formation of osteophytes, which are hallmark features of OA [37]. The association of NPRL2 with mTOR signaling in our study suggested that disruptions in this pathway could play a role in OA development and progression.
Autophagy is a cellular process that involves the degradation and recycling of cellular components, maintaining cell homeostasis and responding to cellular stress [38, 39]. It plays a protective role in chondrocytes by removing damaged organelles and misfolded proteins. In OA, decreased autophagy has been observed, leading to an accumulation of damaged cellular components and contributing to cartilage degradation [40]. RAB7A, identified in our ceRNA network, is associated with autophagy and mitophagy, which involves the selective removal of damaged mitochondria. STEAP3 interacts with Rab7A and RACK1, affecting the development and progression of osteoarthritis by regulating the MAPK and JAK/STAT signaling pathways [41]. The connection between RAB7A and autophagy in OA suggested that a lack of proper autophagic activity might contribute to disease progression. The reduced autophagic response in chondrocytes could lead to increased oxidative stress and cellular damage, ultimately affecting joint health.
The mTOR signaling pathway and autophagy are intricately linked, with mTOR acting as a negative regulator of autophagy. Activation of mTOR suppresses autophagy by inhibiting the phosphorylation of autophagy-related proteins (ATGs), thereby blocking the autophagic process. Conversely, autophagy can modulate mTOR signaling by reducing the levels of mTOR activators, such as insulin growth factor (IGF-1) [36, 38, 39].
Understanding the relationship between mTOR signaling, autophagy, and OA can offer potential therapeutic targets. Modulating mTOR activity to restore balance in chondrocyte metabolism might slow disease progression, while promoting autophagy could reduce cellular damage and cartilage degradation [6, 18, 42, 43]. Future research in this area could focus on developing treatments that modulate mTOR activity and enhance autophagic responses in chondrocytes. This approach could help preserve joint function and alleviate OA symptoms, providing a targeted strategy to combat this debilitating disease.
Despite these promising findings, this study has several limitations that should be acknowledged. First, our study is primarily bioinformatics-based and lacks experimental validation. While the identified lncRNAs and their associations with immune cell subsets are promising, in vitro and in vivo experiments are necessary to confirm these findings and explore the underlying mechanisms. In addition, the constructed ceRNA network and the identified pathways, such as mTOR signaling and autophagy, offer potential therapeutic targets; however, their clinical relevance and efficacy in treating OA remain to be established through further research and clinical trials.
Overall, our study underscored the complexity of OA pathogenesis and emphasized the importance of ceRNA networks in understanding disease mechanisms. The integration of multi-omics data and bioinformatics approaches allowed us to uncover new insights into OA, highlighting key molecules and pathways that could serve as diagnostic biomarkers and therapeutic targets. This research contributes to the growing body of knowledge surrounding OA and paves the way for developing personalized medical approaches tailored to individual patients. Nevertheless, further experimental validation and clinical trials are essential to translate these findings into effective treatment strategies for OA, and to fully realize the potential of the identified ceRNA networks in clinical practice.
In conclusion, this study elucidated the role of immune-related ceRNA networks in osteoarthritis pathogenesis, providing a comprehensive framework for understanding the molecular mechanisms driving disease progression. We identified differentially expressed lncRNAs and constructed a classification model with high discriminatory power for OA, offering promising diagnostic and therapeutic insights. The significant correlations between lncRNAs and immune cell infiltration patterns suggested an immunological component in OA progression. The ceRNA network centered around DGCR11 revealed connections to autophagy and mTOR signaling pathways, which play a pivotal role in cartilage homeostasis. Understanding these molecular mechanisms opens new avenues for developing targeted therapies for OA. Future research should focus on experimental validation and clinical trials to translate these findings into effective treatment strategies that can alleviate OA symptoms and improve joint function.