Introduction
Gastric cancer (GC) is a highly invasive and heterogeneous malignancy that ranked 5th in cancer morbidity with over 1 million patients per year according to Global Cancer Statistics 2020 [1]. As the predominant histological subtype, stomach adenocarcinoma (STAD) accounts for 90–95% of GC. Most patients display no symptoms before the disease develops to a middle or even advanced stage, and only a handful of them are diagnosed at an early stage. Despite breakthroughs in surgery, adjuvant chemotherapy and targeted therapy that reduced the GC mortality rate, the overall survival and quality of survival of advanced GC patients remain poor due to limited therapy and medication [2]. Hence, novel biomarkers and therapeutic targets are necessary to improve the prognosis of GC patients.
The tumor immune microenvironment (TIME) is the most important factor in the study of the immunotherapy response, and findings on immune-related components and relevant genes are helpful enough to inspire new insights into the research and development of immune checkpoint inhibitors (ICIs). Hypoxia is a common feature in the tumor microenvironment (TME), which can affect survival, proliferation, invasion, metastasis, drug resistance and angiogenesis of tumor cells by regulating cellular and biological activities [3]. It has been confirmed by numerous studies that there is a link between hypoxia and tumor immunology. Kung-Chun Chiu et al. [4] reported that HIF-1 (hypoxia-inducible factor-1, a key mediator of tumor metabolism, which is involved in tumor-related inflammatory signaling) can promote ENTPD2 (ectonucleoside triphosphate diphosphohydrolase-2, a family of nucleoside triphosphate-diphosphohydrogenase enzymes, which can slow cancer growth and improve the efficiency and efficacy of ICIs) expression, which enhances the progression of hepatocellular carcinoma and suppresses myeloid-derived cell differentiation. Meanwhile, the inhibition of ENTPD2 improves the ICI efficiency. Another study of GC conducted by Zhihua et al. [5] found that HIF-1 can inhibit M1 polarization and function of macrophages by inhibiting miR-30c (a member of the microRNA family, a tumor suppressor in human cancers) expression to decrease mTOR (mechanistic target of rapamycin, an atypical protein kinase of the PI3K-related kinase family, which has a key role in various biological processes such as cell proliferation, survival, autophagy, metabolism and immunity) activity as well as glycolysis in macrophages in GC patients. Therefore, the exploration of hypoxia- and immune-related prognostic markers in STAD would benefit the prognosis prediction and subsequent treatment of STAD patients.
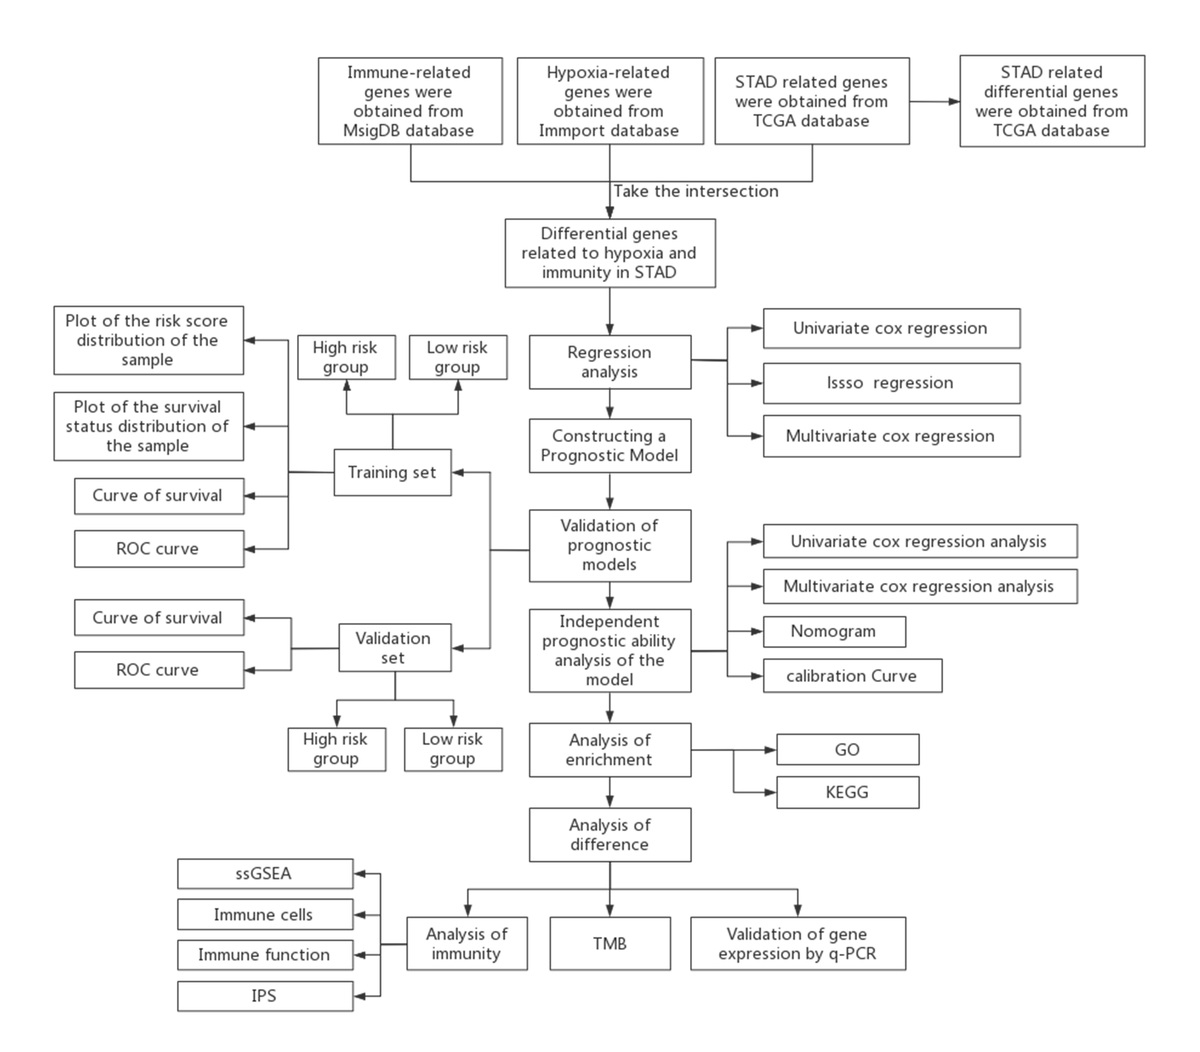
We aimed to develop a novel model based on hypoxia- and immune-related genes to predict prognosis as well as immune infiltration of STAD patients. With relevant STAD data obtained in the public dataset (The Cancer Genome Atlas (TCGA)-STAD), hypoxia- and immune-related genes were analyzed, feature genes screened, prognostic models built, and the link between risk score and clinicopathological characteristics as well as prognosis validated. In addition, the relationship between risk score and immune infiltration as well as mutation status were investigated to guide STAD treatment and improve prognosis.
Material and methods
Dataset collection
The TCGA-STAD cohort including 363 samples was downloaded from TCGA, among which there were 343 STAD tissue samples and 30 normal gastric tissue samples. In addition, single-nucleotide variants (SNV) and corresponding clinical data of STAD patients were downloaded as well. Hypoxia-related genes in STAD were obtained in MsigDB (https://www.gsea-msigdb.org/gsea/msigdb/), while immune-related genes in STAD were retrieved from ImmPort (https://www.immport.org).
Identification of differentially expressed genes related to hypoxia and immunity in STAD
To identify hypoxia- and immune-related differentially expressed genes (DEGs) in STAD, the edgeR package [6] was used for differential expression analysis on STAD and normal samples in the TCGA-STAD cohort to acquire STAD-related DEGs (|logFC| > 1 and FDR < 0.05). Subsequently, by intersecting DEGs and hypoxia-related genes/immune-related genes, the hypoxia- and immune-related DEGs in STAD were identified for analysis.
Building and validation of hypoxia-immune-based prognostic model of STAD
Referring to the survival information of STAD samples retrieved from the TCGA-STAD cohort, those with survival time longer than 30 days were randomly split into training and validation sets in the ratio of 7 : 3. To select hypoxia- and immune-related genes that affect survival of STAD patients, univariate Cox regression analysis was performed on hypoxia- and immune-related genes in the training cohort using the R package survival [7] (p < 0.05). To prevent overfitting, the genes acquired from univariate Cox regression underwent LASSO regression using glmnet [8]. Ten-fold cross-validation yielded an optimal penalty parameter lambda (λ) to remove genes with high correlation and reduce model complexity. Multivariate Cox regression analysis was performed using the R package survival to obtain prognostic genes related to hypoxia and immunity in STAD. Based on the genes required, the prognostic prediction model was built as follows: (Risk score = 0.1968 × DUSP1 + 0.0545 × IGFBP1 + 0.0587 × CGB5 – 0.0775 × FAM3D – 0.0991 × FGF8 + 0.0971 × GPC3 + 0.0655 × EGF).
Risk score of the training cohort was calculated based on the prognostic prediction model. The sample cohort was divided into high- and low-risk groups according to the median. Combined with the survival time and risk score of the samples, the survival status of STAD patients was plotted using the R package ggplot2 [9]. Subsequently, the survival curve of patients in the high- and low-risk groups was plotted using the R package survival to evaluate prognostic differences. Finally, the R package timeROC [10] was used to draw the receiver operating characteristic (ROC) curve of risk score for predicting the 1-, 3-, and 5-year survival of STAD patients, the results of which were then validated in the validation set.
Validation of the independence of risk score
Both univariate and multivariate Cox regression analyses were performed based on clinicopathologic characteristics, such as stage, gender, tumor (T), node (N), and metastasis (M). Finally, to evaluate the clinical value of risk score, nomograms were developed using rms [11] to predict 1-, 3-, and 5-year survival in STAD patients and calibration curves were drawn to assess the accuracy.
Gene Oncology and Kyoto Encyclopedia of Genes and Genomes functional enrichment analyses of DEGs
To investigate the differences in biological functions and signaling pathways involved in the high- and low-risk groups, the package edgeR was used for differential expression analysis to obtain DEGs in the high- and low-risk groups. After that, these DEGs were subject to enrichment analysis using the R package clusterProfiler [12], and the most significantly enriched Gene Oncology (GO) terms and Kyoto Encyclopedia of Genes and Genomes (KEGG) pathways were selected with a threshold of p < 0.05.
Immune microenvironment analysis
The microenvironment has been proven to impact the prognosis of tumor patients. Single sample Gene Set Enrichment Analysis (ssGSEA) was performed using the R package GSVA to investigate TME differences in STAD patients of different risk scores, based on which the association between immune infiltration status and risk score was analyzed. Subsequently, the correlation of hypoxia-related genes and immune cell scores as well as immune-related function scores were calculated, showing how hypoxia-related genes impact immune infiltration status.
Tumor mutation analysis and immunophenoscore
With gene mutation frequency of high- and low-risk groups calculated based on the mutation data in the TCGA-STAD cohort, waterfall plots were drawn using the R package GenVisR [13] to present the mutational landscape of STAD patients. The χ2 test was used to determine the differences in the top 5 gene mutation frequencies in both high- and low-risk groups. The immunophenoscore (IPS) of STAD patients were downloaded from the Tree Care Industry Association (TCIA) database for the comparison between high- and low-risk groups by using the t-test.
Cell culture
Human gastric mucosal epithelial cell (CTCC-022-HUM) and human gastric adenocarcinoma epithelial cells NUGC-3 (CTCC-0488-Luc2) and AGS (CTCC-001-0038) were purchased from MEISEN CELL. All the above cell lines were cultured in RPMI-1640 medium supplemented with 10% fetal bovine serum at 37°C in a 5% CO2 incubator.
Quantitative real-time polymerase chain reaction
Total RNA was extracted from cells using TRIzol reagent (Life Technologies, USA), and the concentration of RNA was determined using a NanoDrop 2000 system (Thermo Fisher Scientific, Inc., USA). Total RNA was reverse transcribed using PrimeScript RT Master Mix (Takara, P.R., Japan) according to the kit instructions. The amount of mRNA expression was measured using the miScript SYBR Green PCR Kit (Qiagen, Germany). The expression levels of DUSP1, IGFBP1, CGB5, FAM3D, FGF8, and GPC3 were determined by quantitative real-time polymerase chain reaction (qRT-PCR) on a Bio-Rad CFX96 real-time PCR detection system (Bio-Rad Laboratories, Hercules, USA). β-actin was used as a standardized endogenous control. Results of the 2–ΔΔCt value were used to compare the relative gene expression between the control group and the experimental group. Primer sequences were as follows: DUSP1 [14] (Forward: 5′-GCCACCATCTGCCTTGCTTACC-3′; Reverse: 5′-ATGATGCTTCGCCTCTGCTTCAC-3′), IGFBP1 [15] (Forward: 5′-TTGGGACGCCATCAGTACCTA-3′; Reverse: 5′-TTGGCTAAACTCTCTACGACTCT-3′), CGB5 [16] (Forward: 5′-CGCTGTGGACTCAGGTGTGCTG-3′; Reverse: 5′-CGCTGTGGACTCAGGTGTGCTG-3′), FAM3D [17] (Forward: 5′-GTAAAAGCCCCTTTGAGCAGT-3′; Reverse: 5′-GGCCATCCCTCGTATTTGT-3′), FGF8 [18] (Forward: 5′-CCCCTTCGCAAAGCTCATC-3′; Reverse: 5′-CCCCTTCTTGTTCATGCAGA-3′), GPC3 [19] (Forward: 5′-GTGCTTTGCCTGGCTACATC-3′; Reverse: 5′-TCCACGAGTTCTTGTCCATTC-3′), EGF [20] (Forward: 5′-CAGGGAAGATGACCACCACT-3′; Reverse: 5′-CAGTTCCCACCACTTCAGGT-3′), β-actin [14] (Forward: 5′-CTCCATCCTGGCCTCGCTGT-3′; Reverse: 5′-GCTGTCACCTTCACCGTTCC-3′).
Results
Identification of hypoxia- and immune-related prognostic genes in STAD patients
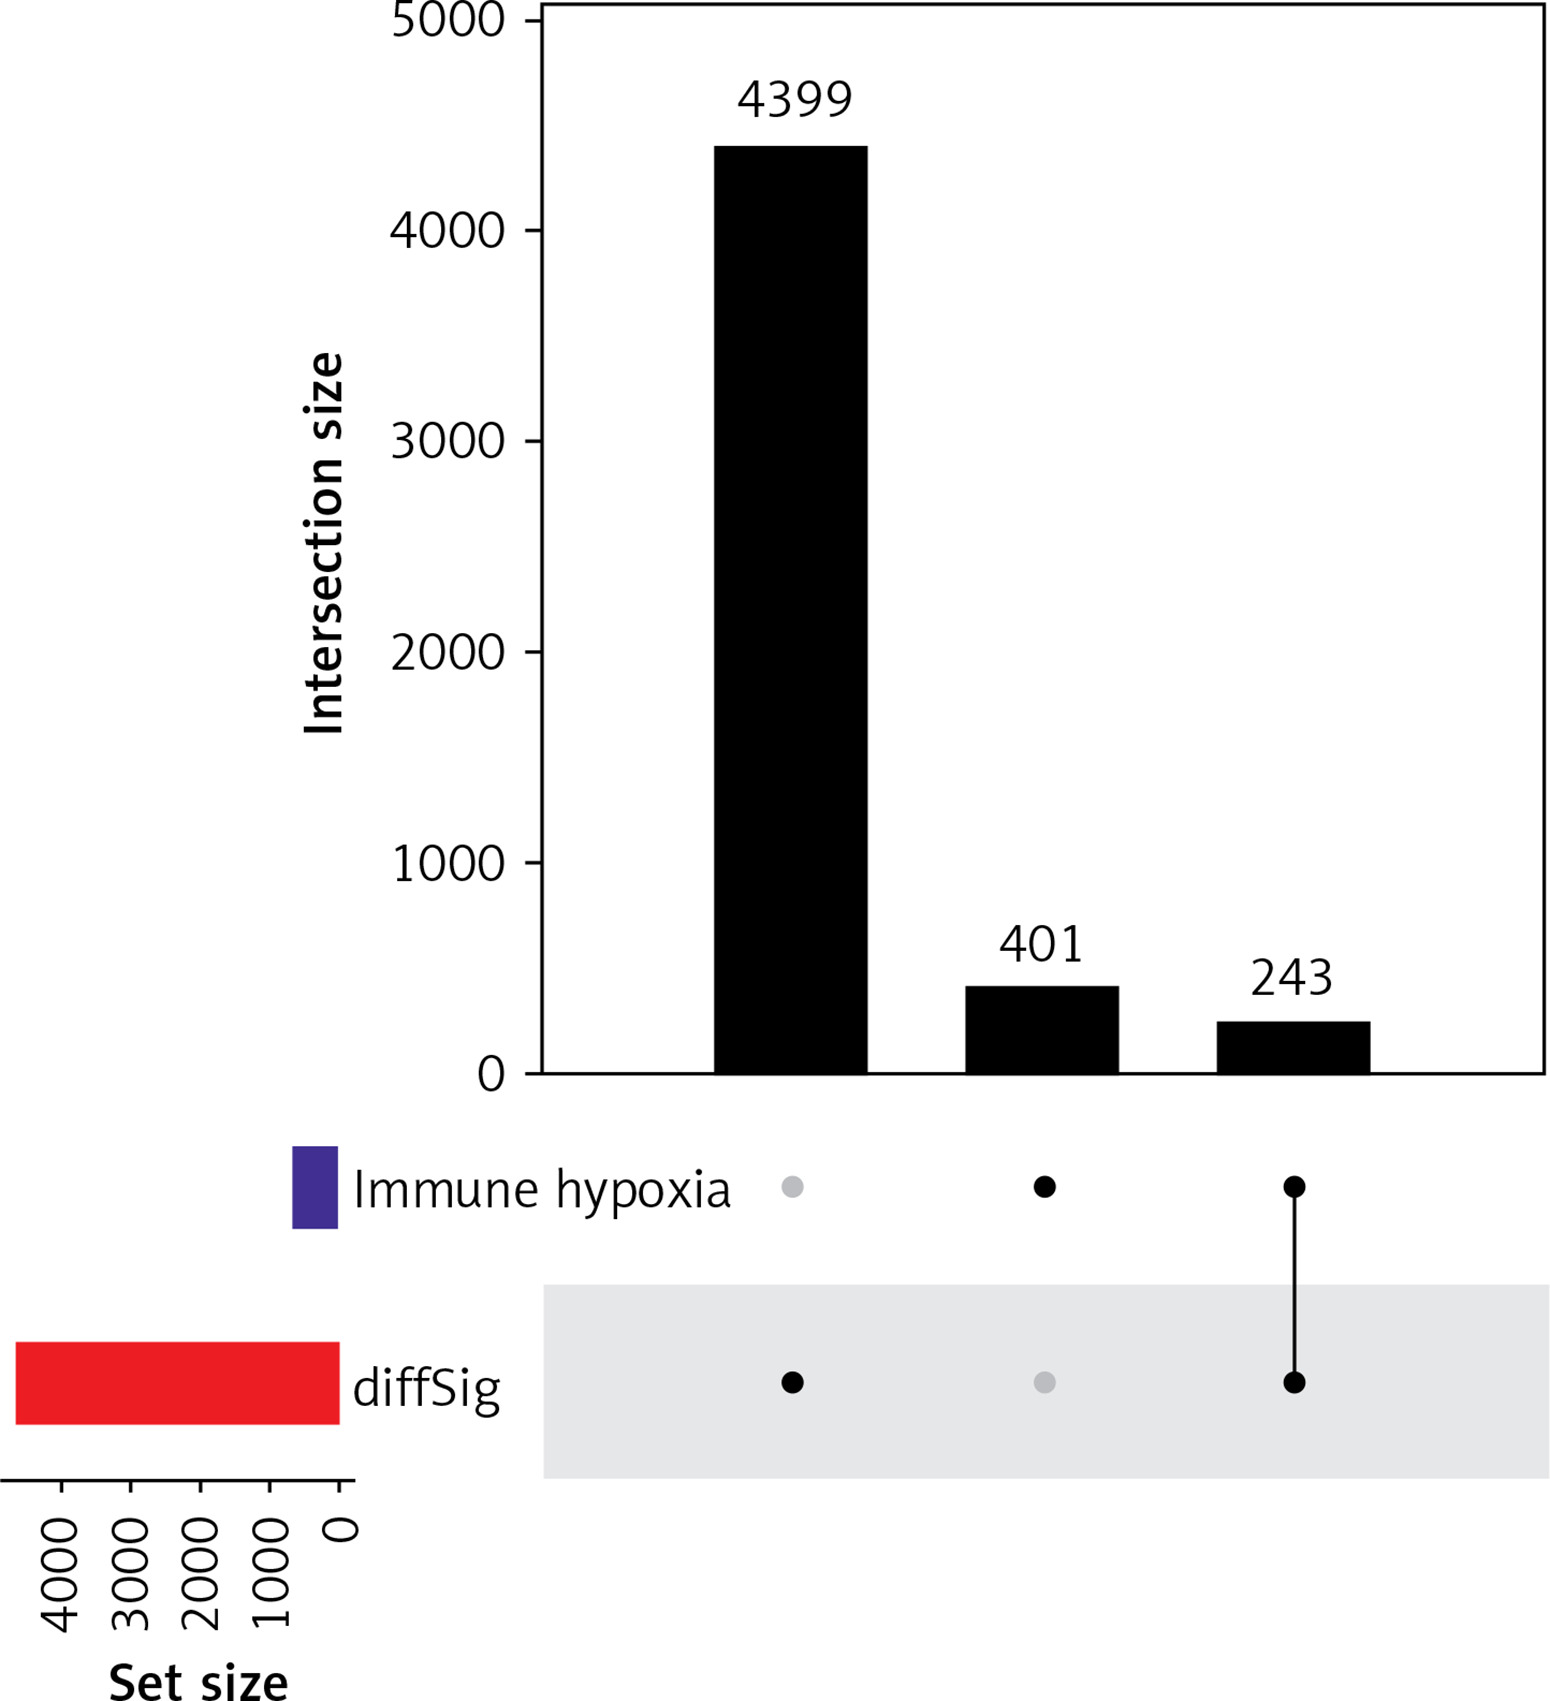
Hypoxic TME is associated with poor outcomes and survival. Hypoxic lesions are formed when intravascular oxygen delivery in tumor is insufficient to meet the metabolic needs of tumor cells. Genes expressed differently under this circumstance are known as hypoxia-related genes [21, 22]. Hypoxia affects tumor immunity by favoring immune evasion and resistance [23]. Highly hypoxic TME also impairs the maturation and activity of dendritic cells (DCs) and natural killer (NK) cells [23]. A positive correlation was found between the hypoxic TME and metabolic changes in cells of the immune system [23]. These findings indicate that hypoxia regulation can be a target in ICI therapy. We retrieved 401 hypoxia- and immune-related genes from MsigDB and ImmPort, respectively, and overlapped them with DEGs. Eventually, 243 hypoxia- and immune-related DEGs were obtained for subsequent prognostic model construction (Figure 1).
Construction and evaluation of the STAD prognostic model
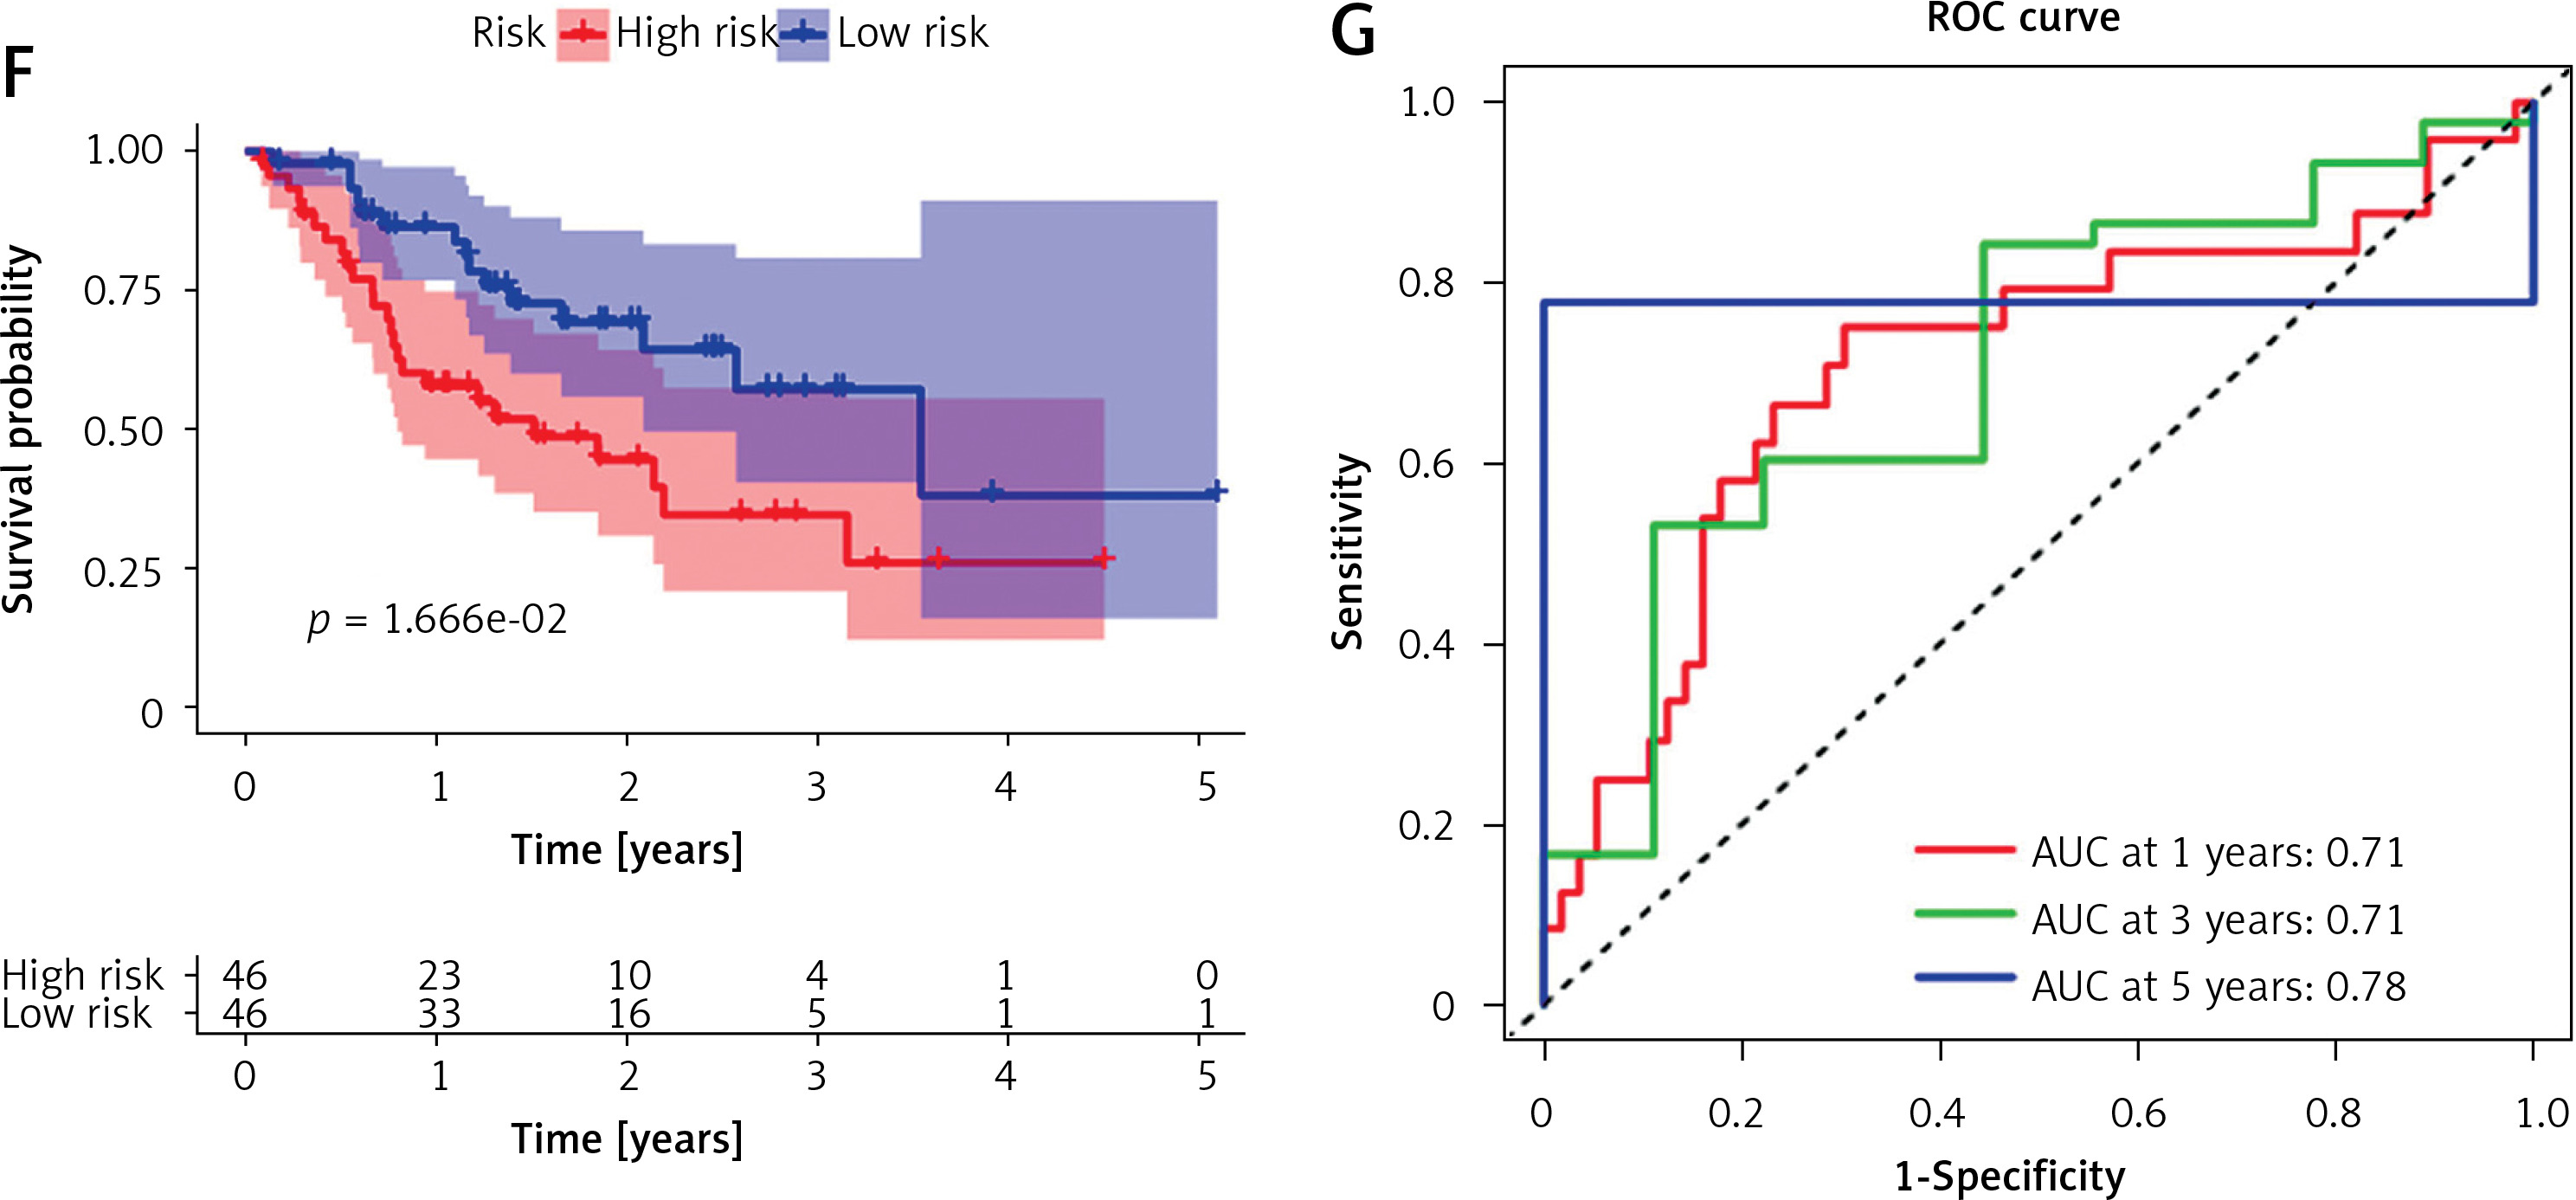
Tumor samples in the TCGA-STAD cohort were randomly split into the training set and validation set at the ratio of 7 : 3. Referring to both expression data of 243 candidate genes in the training set and the corresponding clinical information, samples with survival time > 30 days were screened. A univariate Cox regression analysis screened 29 candidate genes significantly associated with survival. Subsequently, the optimal penalty parameter λ was selected using ten-fold cross-validation. When λ = –3, the overfitting was relatively small and the complexity of the model was the lowest. Thirteen important candidate genes were finally selected out (Figures 2 A, B). After multivariate Cox regression analysis, a 7-gene hypoxia-immune-based signature was constructed for STAD prognosis (Figure 2 C). After calculating the risk score of each sample, samples in the training set were divided into high- and low-risk groups by the median risk score (Figure 3 A). According to the scatter plot of survival status, higher risk scores correlated with poorer survival status (Figure 3 B). The expression levels of prognostic signature genes in the high- and low-risk groups were presented using heat maps (Figure 3 C). In addition, better prognosis was found in low-risk groups (Figure 3 D). Subsequently, 1-, 3-, and 5-year survival of STAD patients predicted by the risk score were plotted using ROC curves, with area under the curve (AUC) values of 0.66, 0.73, and 0.64, respectively (Figure 3 E). The predictive performance of the risk score was proven. Later, we conducted validation in the validation set, and the trend was consistent with the validation set, with better outcomes for patients in the low-risk group (Figure 3 F). The AUC values of 1-, 3-, and 5-year curves were 0.71, 0.71, and 0.78, respectively (Figure 3 G). In general, an effective prognostic prediction model based on immune-related and hypoxia-related genes in STAD was constructed here.
Figure 2
Identification of hypoxia- and immune-related prognostic genes. A – Survival-related genes in STAD when log λ approaches 0 in the LASSO Cox regression model. B – Selection interval of the penalty parameter λ for the minimum goodness-of-fit. C – Forest plot of multivariate Cox regression analysis of feature genes in the best prognostic model
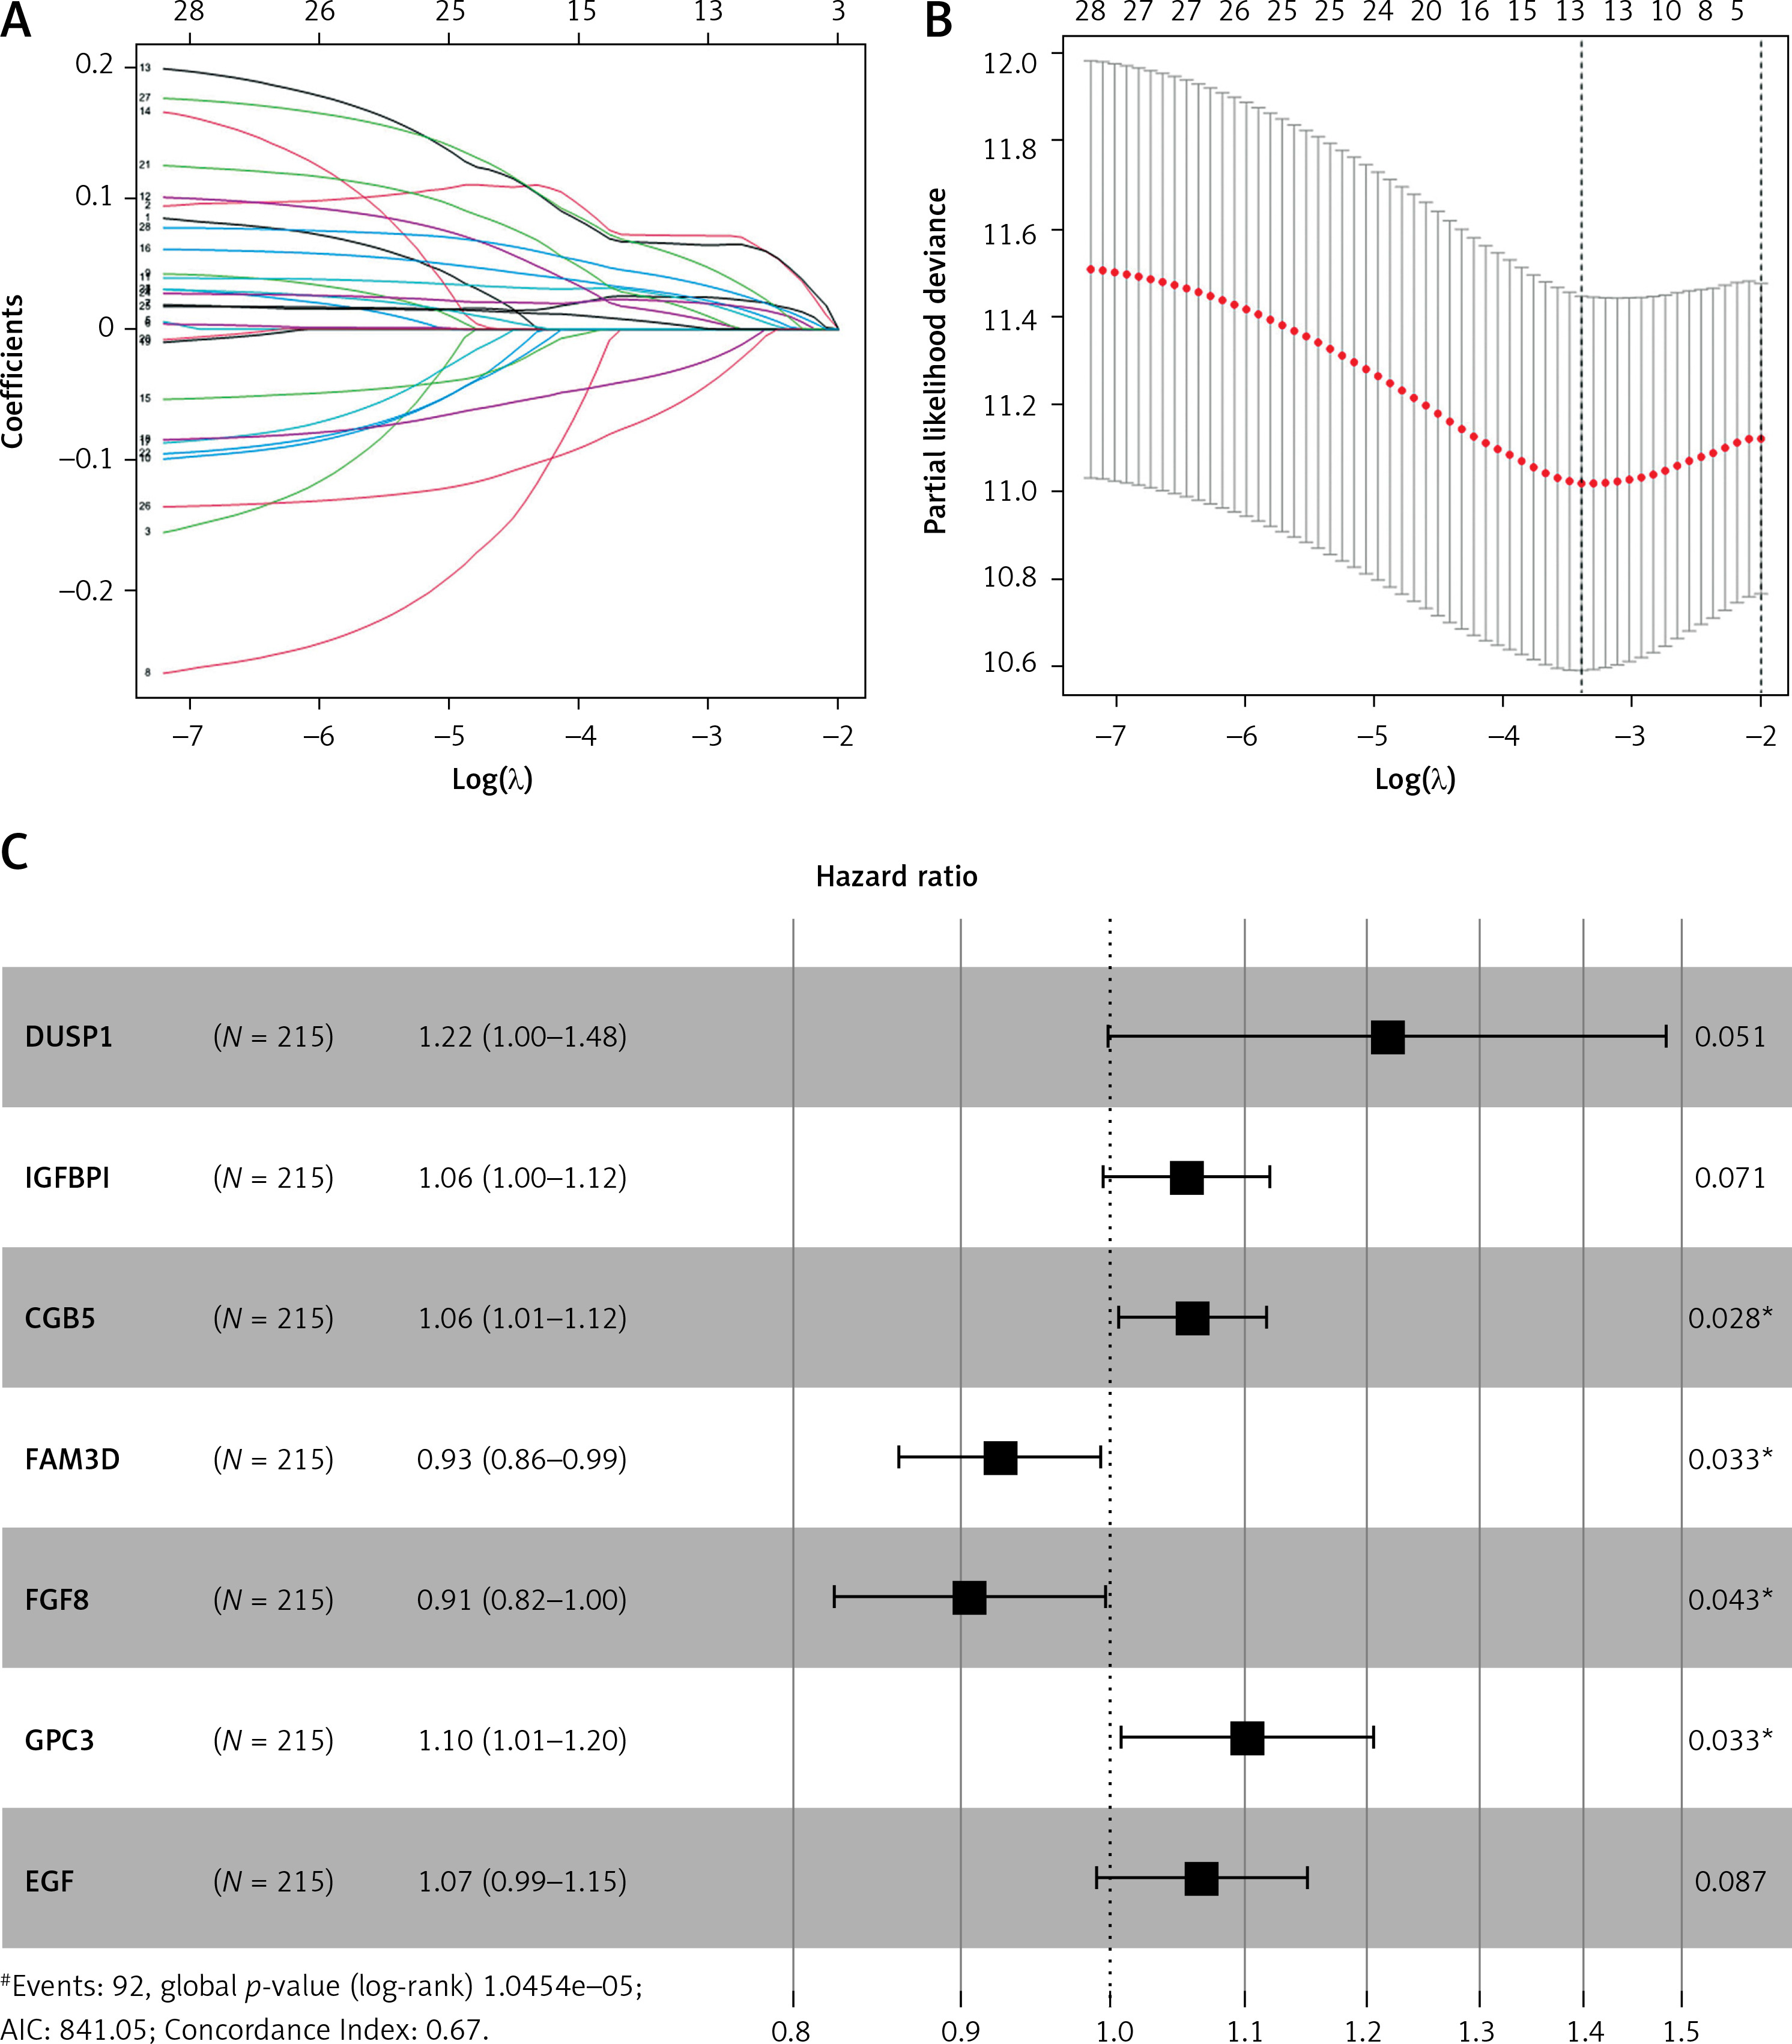
Figure 3
Validation of the STAD hypoxia- and immune-related prognostic model. A – Distribution of the high- and low-risk group samples with the median risk score as the cut-off point. B – Scatterplot of risk score and survival status in the training set. C – Survival analysis of the high- and low-risk groups in the training set. D, F – Risk score was utilized to predict ROC curves of 1-, 3-, and 5-year survival of patients in the training set. E, G – Survival analysis of the high- and low-risk groups in the validation set
Risk score can be an independent prognostic factor for STAD patients
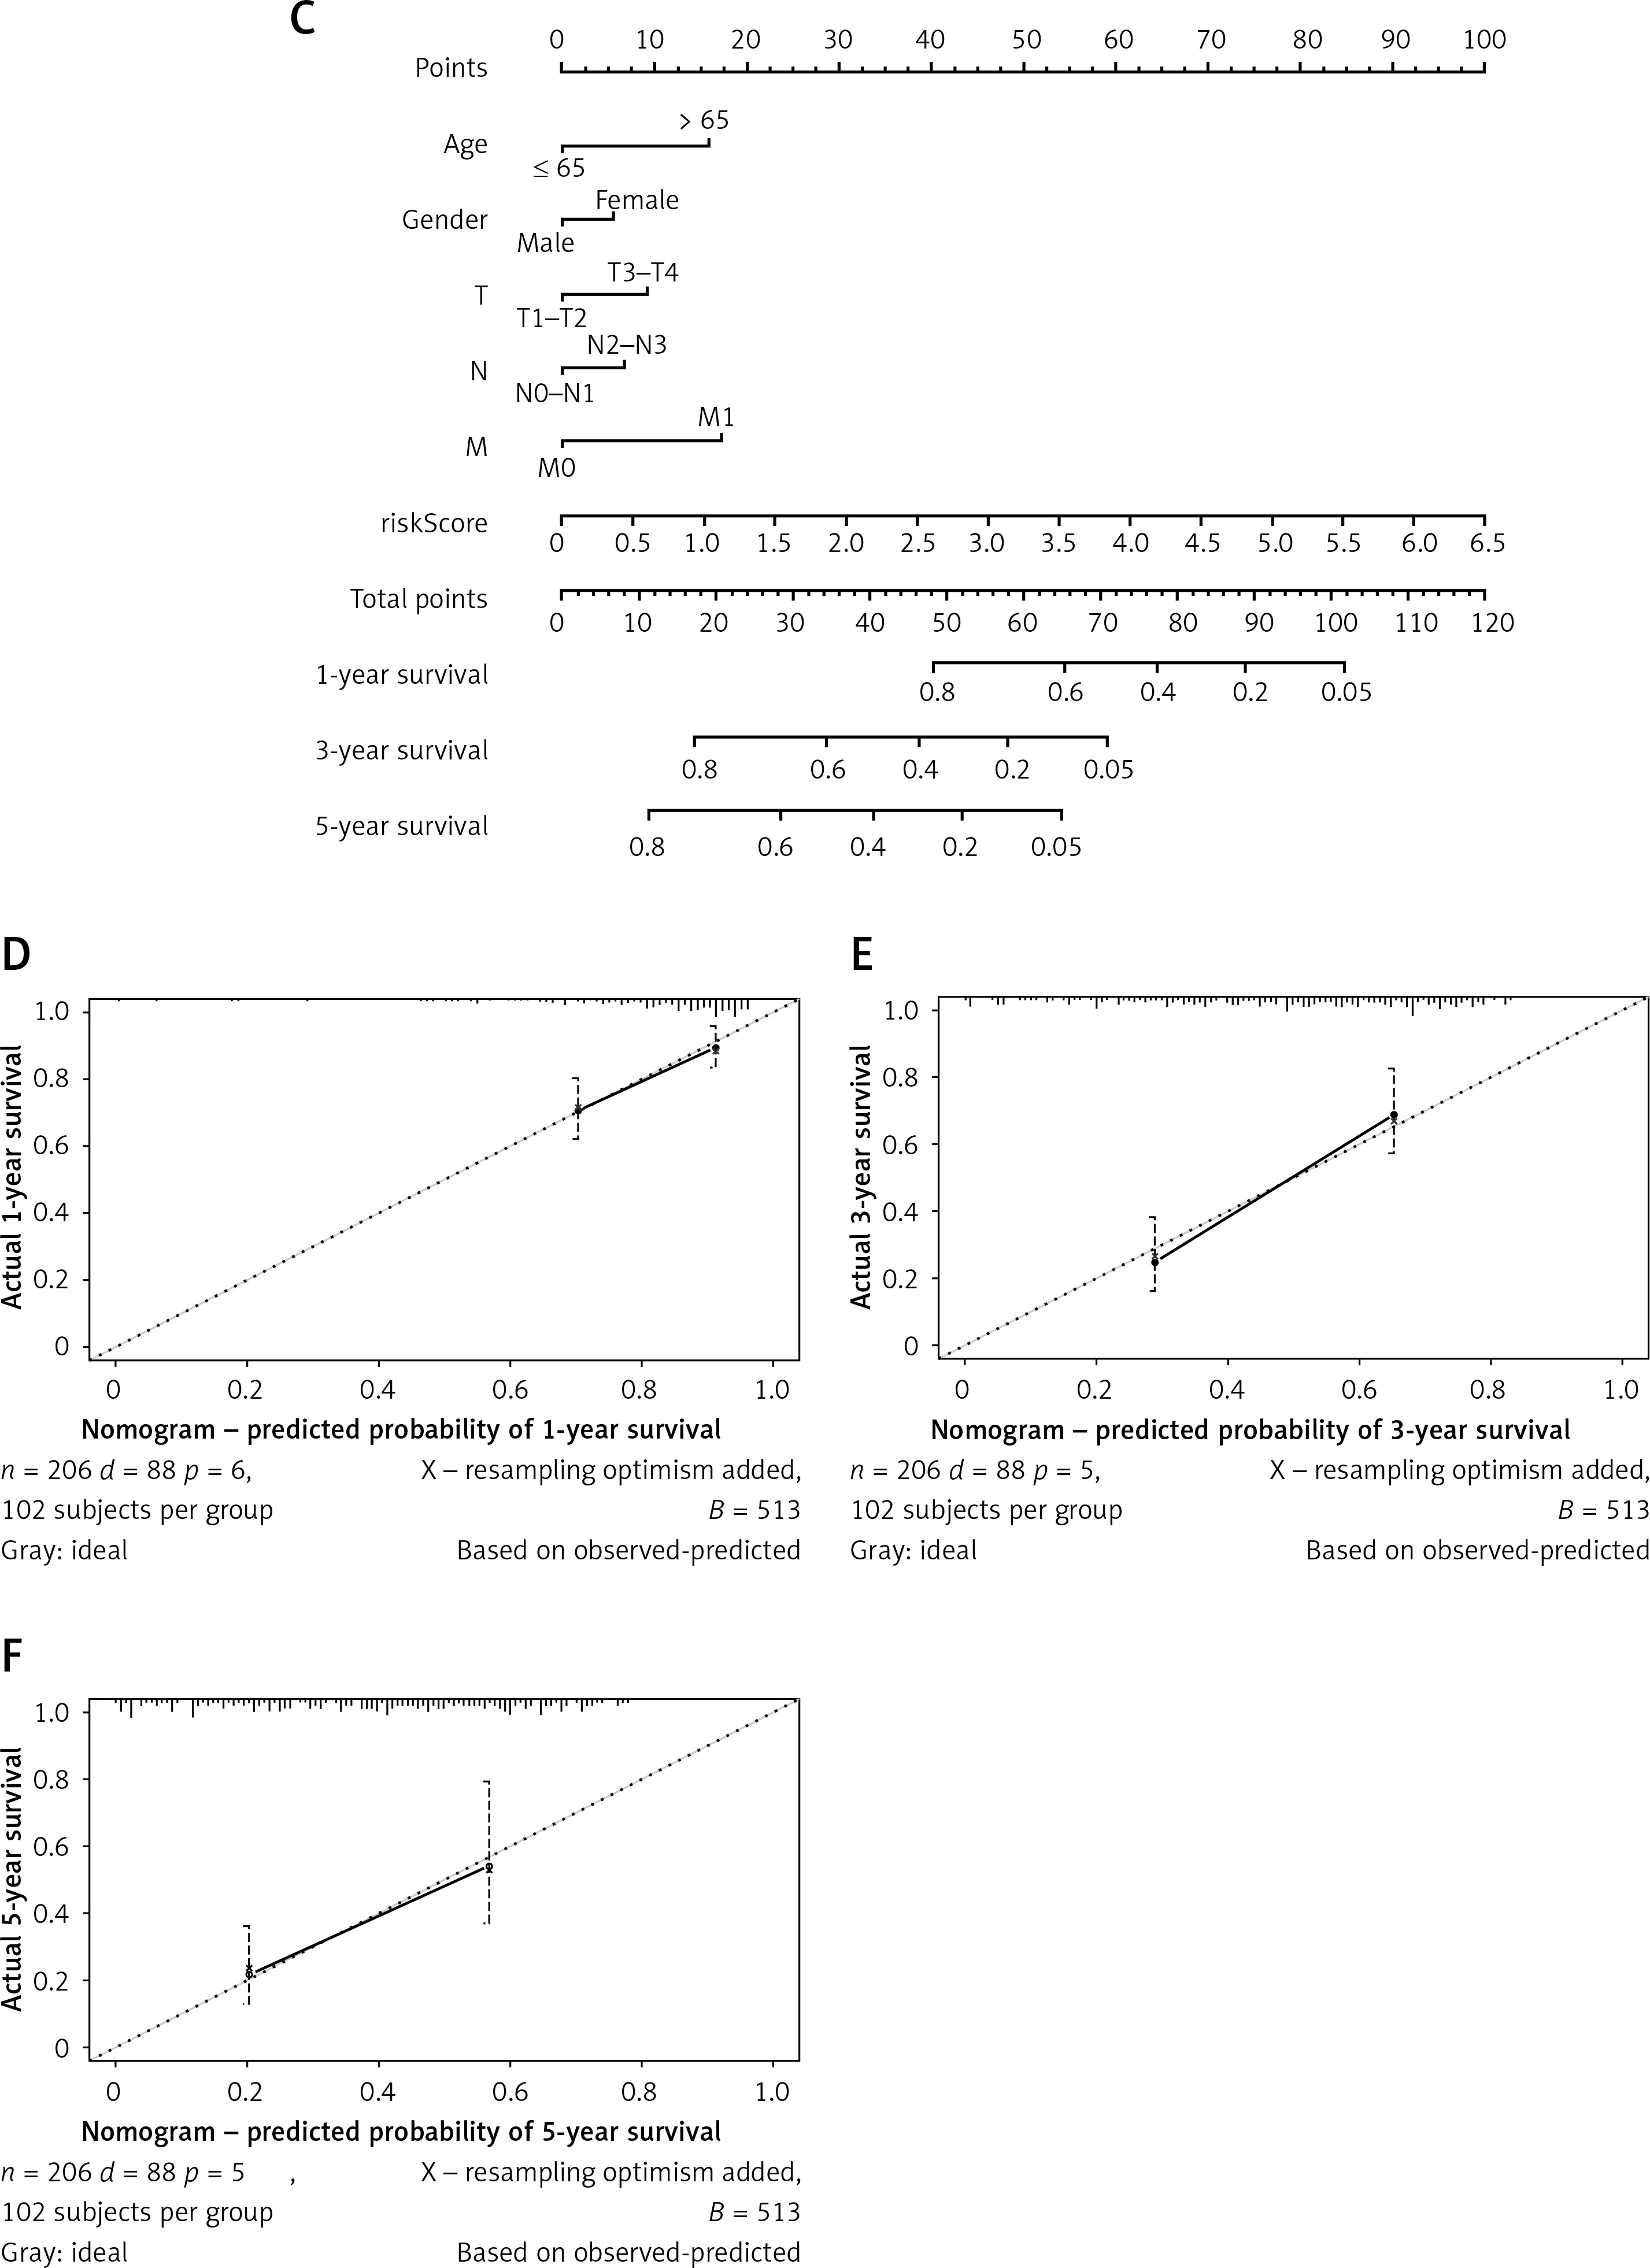
Univariate and multivariate Cox regression analyses were conducted combined with risk score and clinicopathologic characteristics such as gender and stage. Univariate Cox regression analysis identified two independent prognostic factors for STAD: N and risk score (Figure 4 A). According to multivariate Cox regression analysis, age, N, M, and risk score could be independent prognostic factors (Figure 4 B). Overall, risk score may be an independent prognostic factor in STAD patients. Subsequently, after plotting a nomogram that predicted 1-, 3-, and 5-year survival (Figure 4 C), corresponding calibration curves were plotted and showed the high predictive accuracy of the nomogram (Figures 4 D–F). Based on the above findings, the risk score obtained from the prognostic model containing 7 hypoxia- and immune-related genes could serve as an independent predictor.
Figure 4
Risk score can be used as an independent prognostic factor in STAD patients. A – Univariate Cox regression analysis of risk score and clinicopathological characteristics. B – Multivariate Cox regression analysis of risk score and clinicopathological characteristics C – Nomogram predicting 1-, 3-, and 5-year survival in STAD patients. D–F – Calibration curves of 1-, 3-, and 5-year survival
Gene Oncology and Kyoto Encyclopedia of Genes and Genomes enrichment analyses
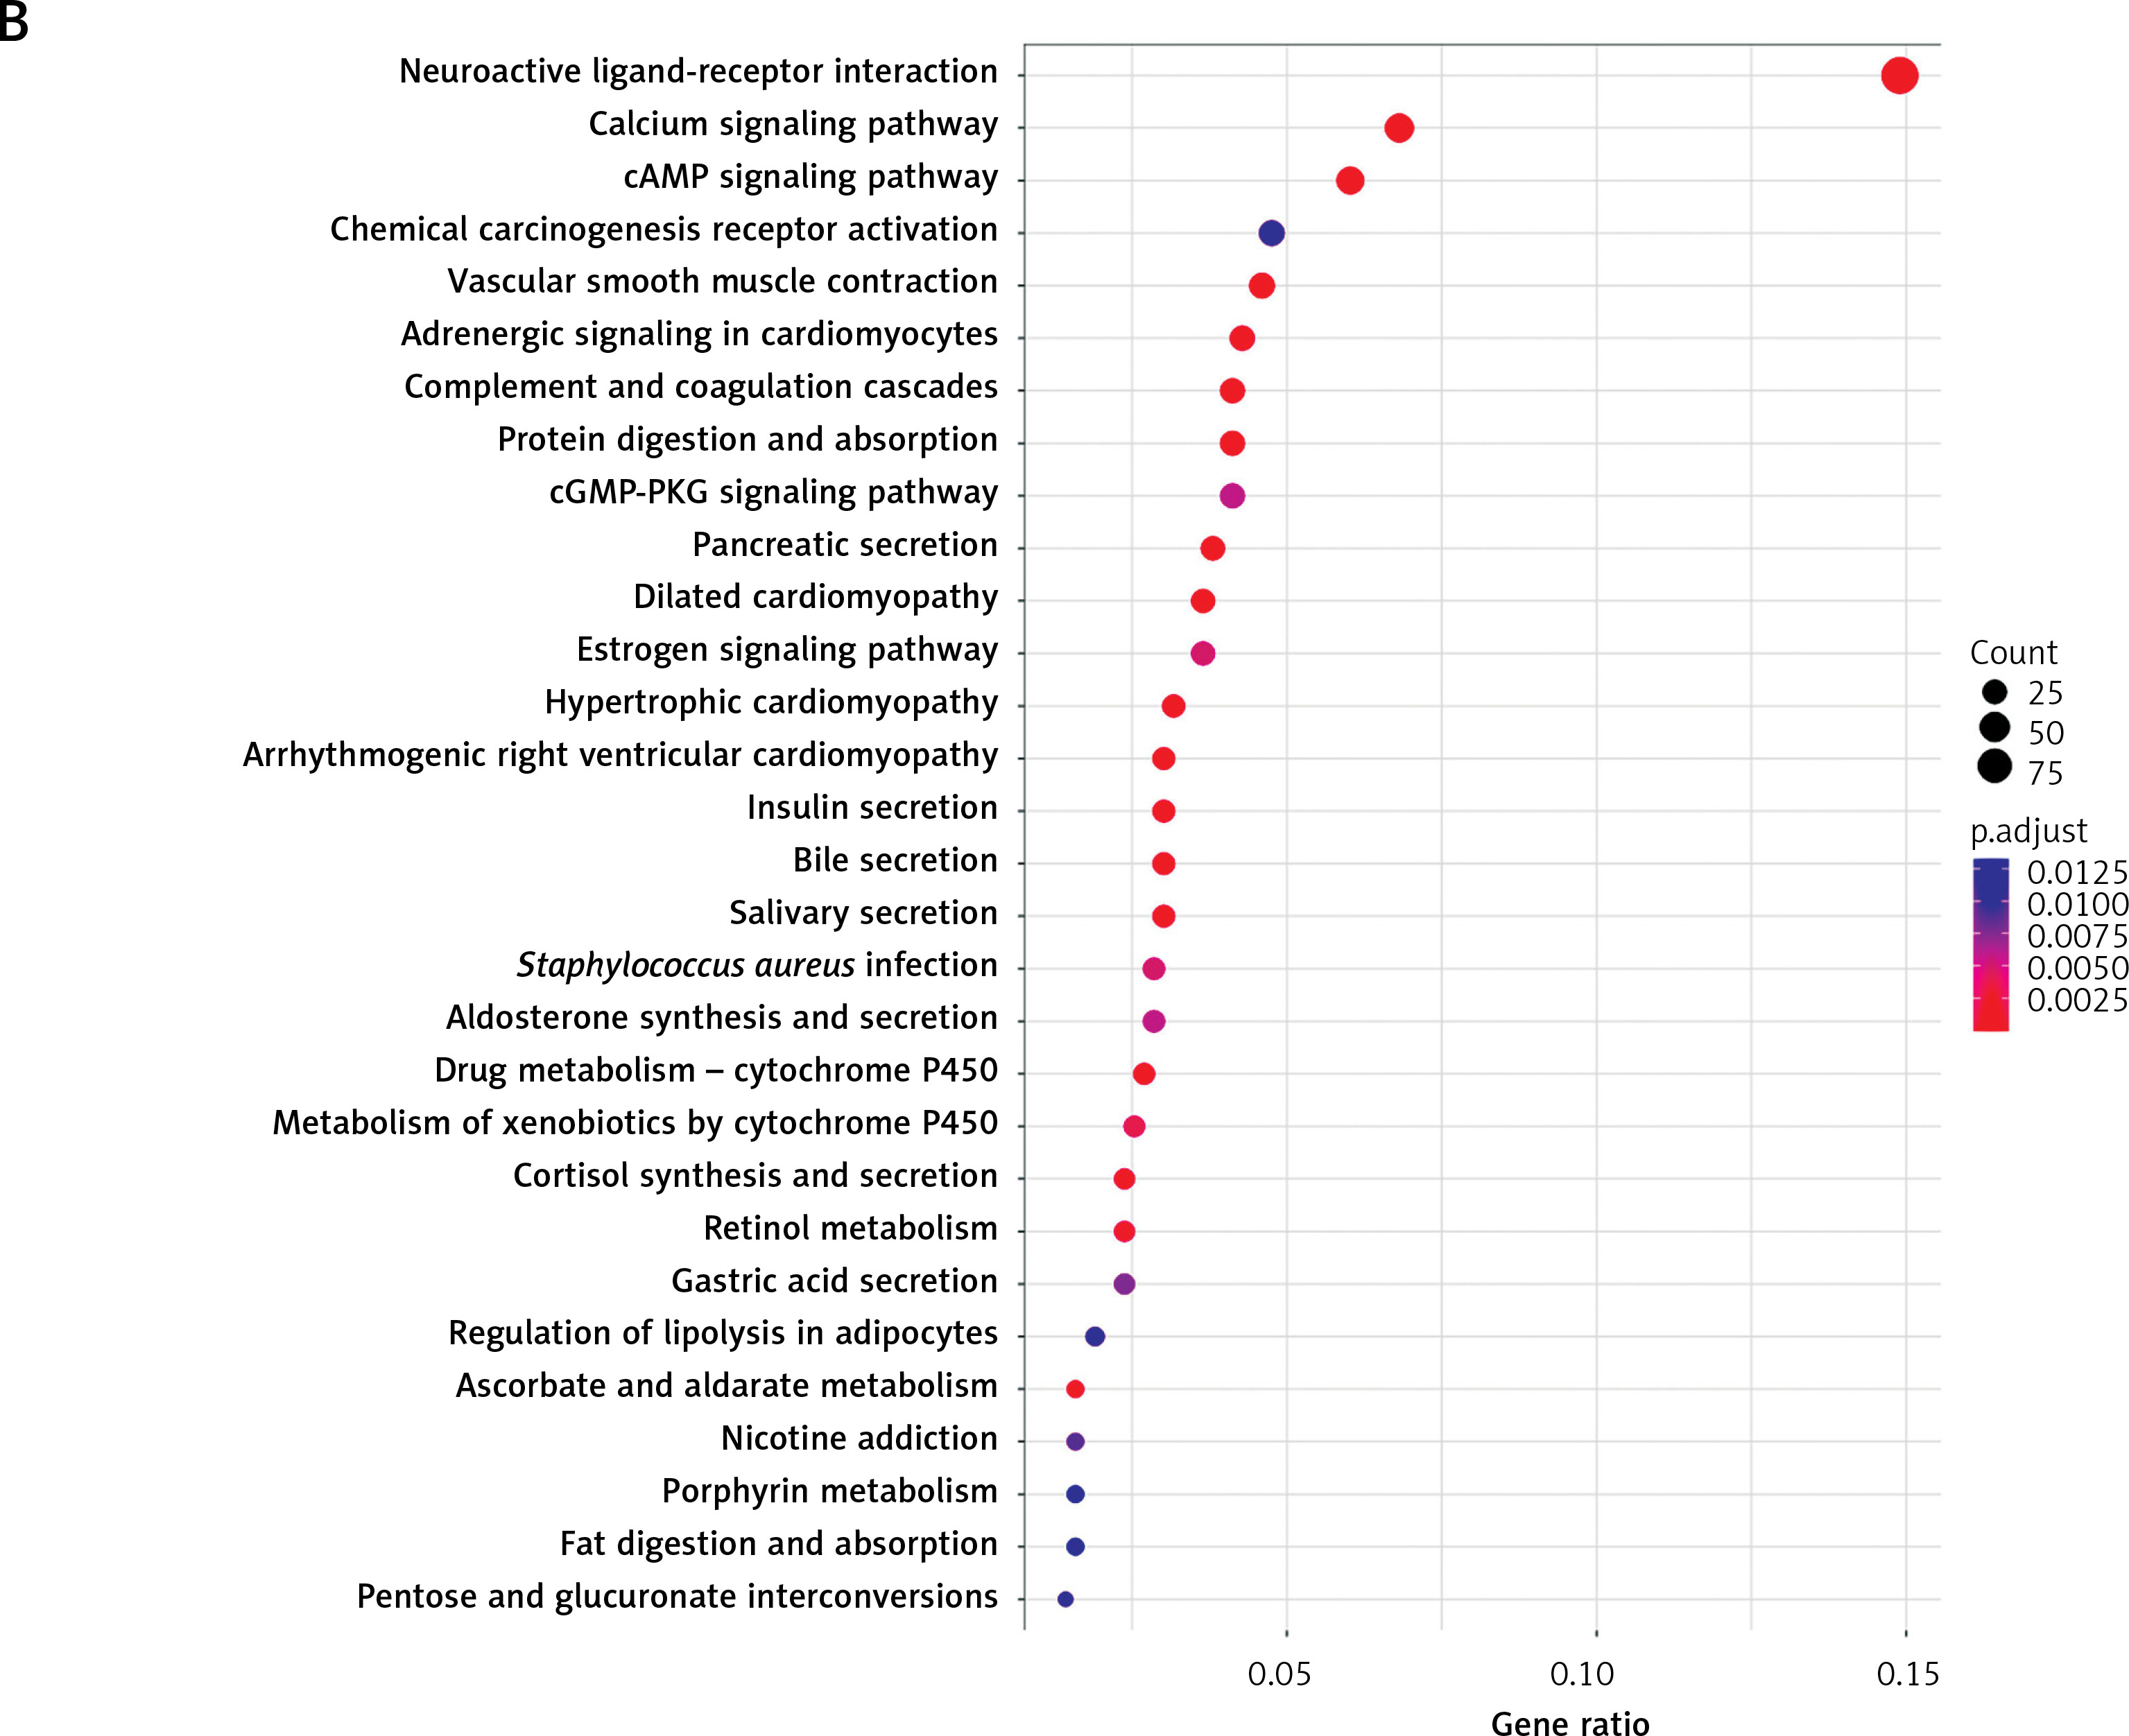
With 1340 DEGs yielded from the differential analysis, GO and KEGG enrichment analyses were performed. According to the GO analysis, most of these genes were enriched in receptor-ligand activity, collagen-containing extracellular matrix, muscle system process, signaling receptor activator activity, receptor activator activity, and axon development (Figure 5 A). KEGG analysis revealed enrichments in neuroactive ligand-receptor interaction, cAMP signaling pathway, chemical carcinogenesis-receptor activation, calcium signaling pathway and vascular smooth muscle contraction (Figure 5 B).
Differential analysis of the tumor microenvironment
The tumor microenvironment is closely related to the progression and prognosis of cancer patients [24]. After detecting the infiltration level of immune cells in the TME of each STAD patient using ssGSEA, immune infiltration and immunocompetence differences between the two risk groups were also compared. The results identified more immune-related components as well as higher immunocompetence in the low-risk group (Figures 6 A–C). Subsequently, the correlation between risk score and immune function as well as immune cell scores was calculated. The results showed that risk score was strongly negatively correlated with APC_co_inhibition (APC: antigen presenting cell), MHC_class_I (MHC: major histocompatibility complex), T_cells_co-stimulation, APC_co_stimulation, Th2_cells (T helper 2 cells), Cytolytic_activity, Inflammation-promoting, Tfh (T follicular helper cells), Check-point, Th1_cells (T helper 1 cells), pDCs (plasmacytoid dendritic cells), and T_cell_co-inhibition. This indicated that patients with a lower risk score are more likely to benefit from immunotherapy (Table I).
Figure 6
Single sample Gene Set Enrichment Analysis (ssGSEA) of high- and low-risk groups. A – Heat map depicts the expression of 29 immune cell gene sets in high- and low-risk groups. B – Violin plot of immune cell fraction differences in high- and low-risk groups. C – Violin plot of immunocompetence-related gene differences in highand low-risk groups
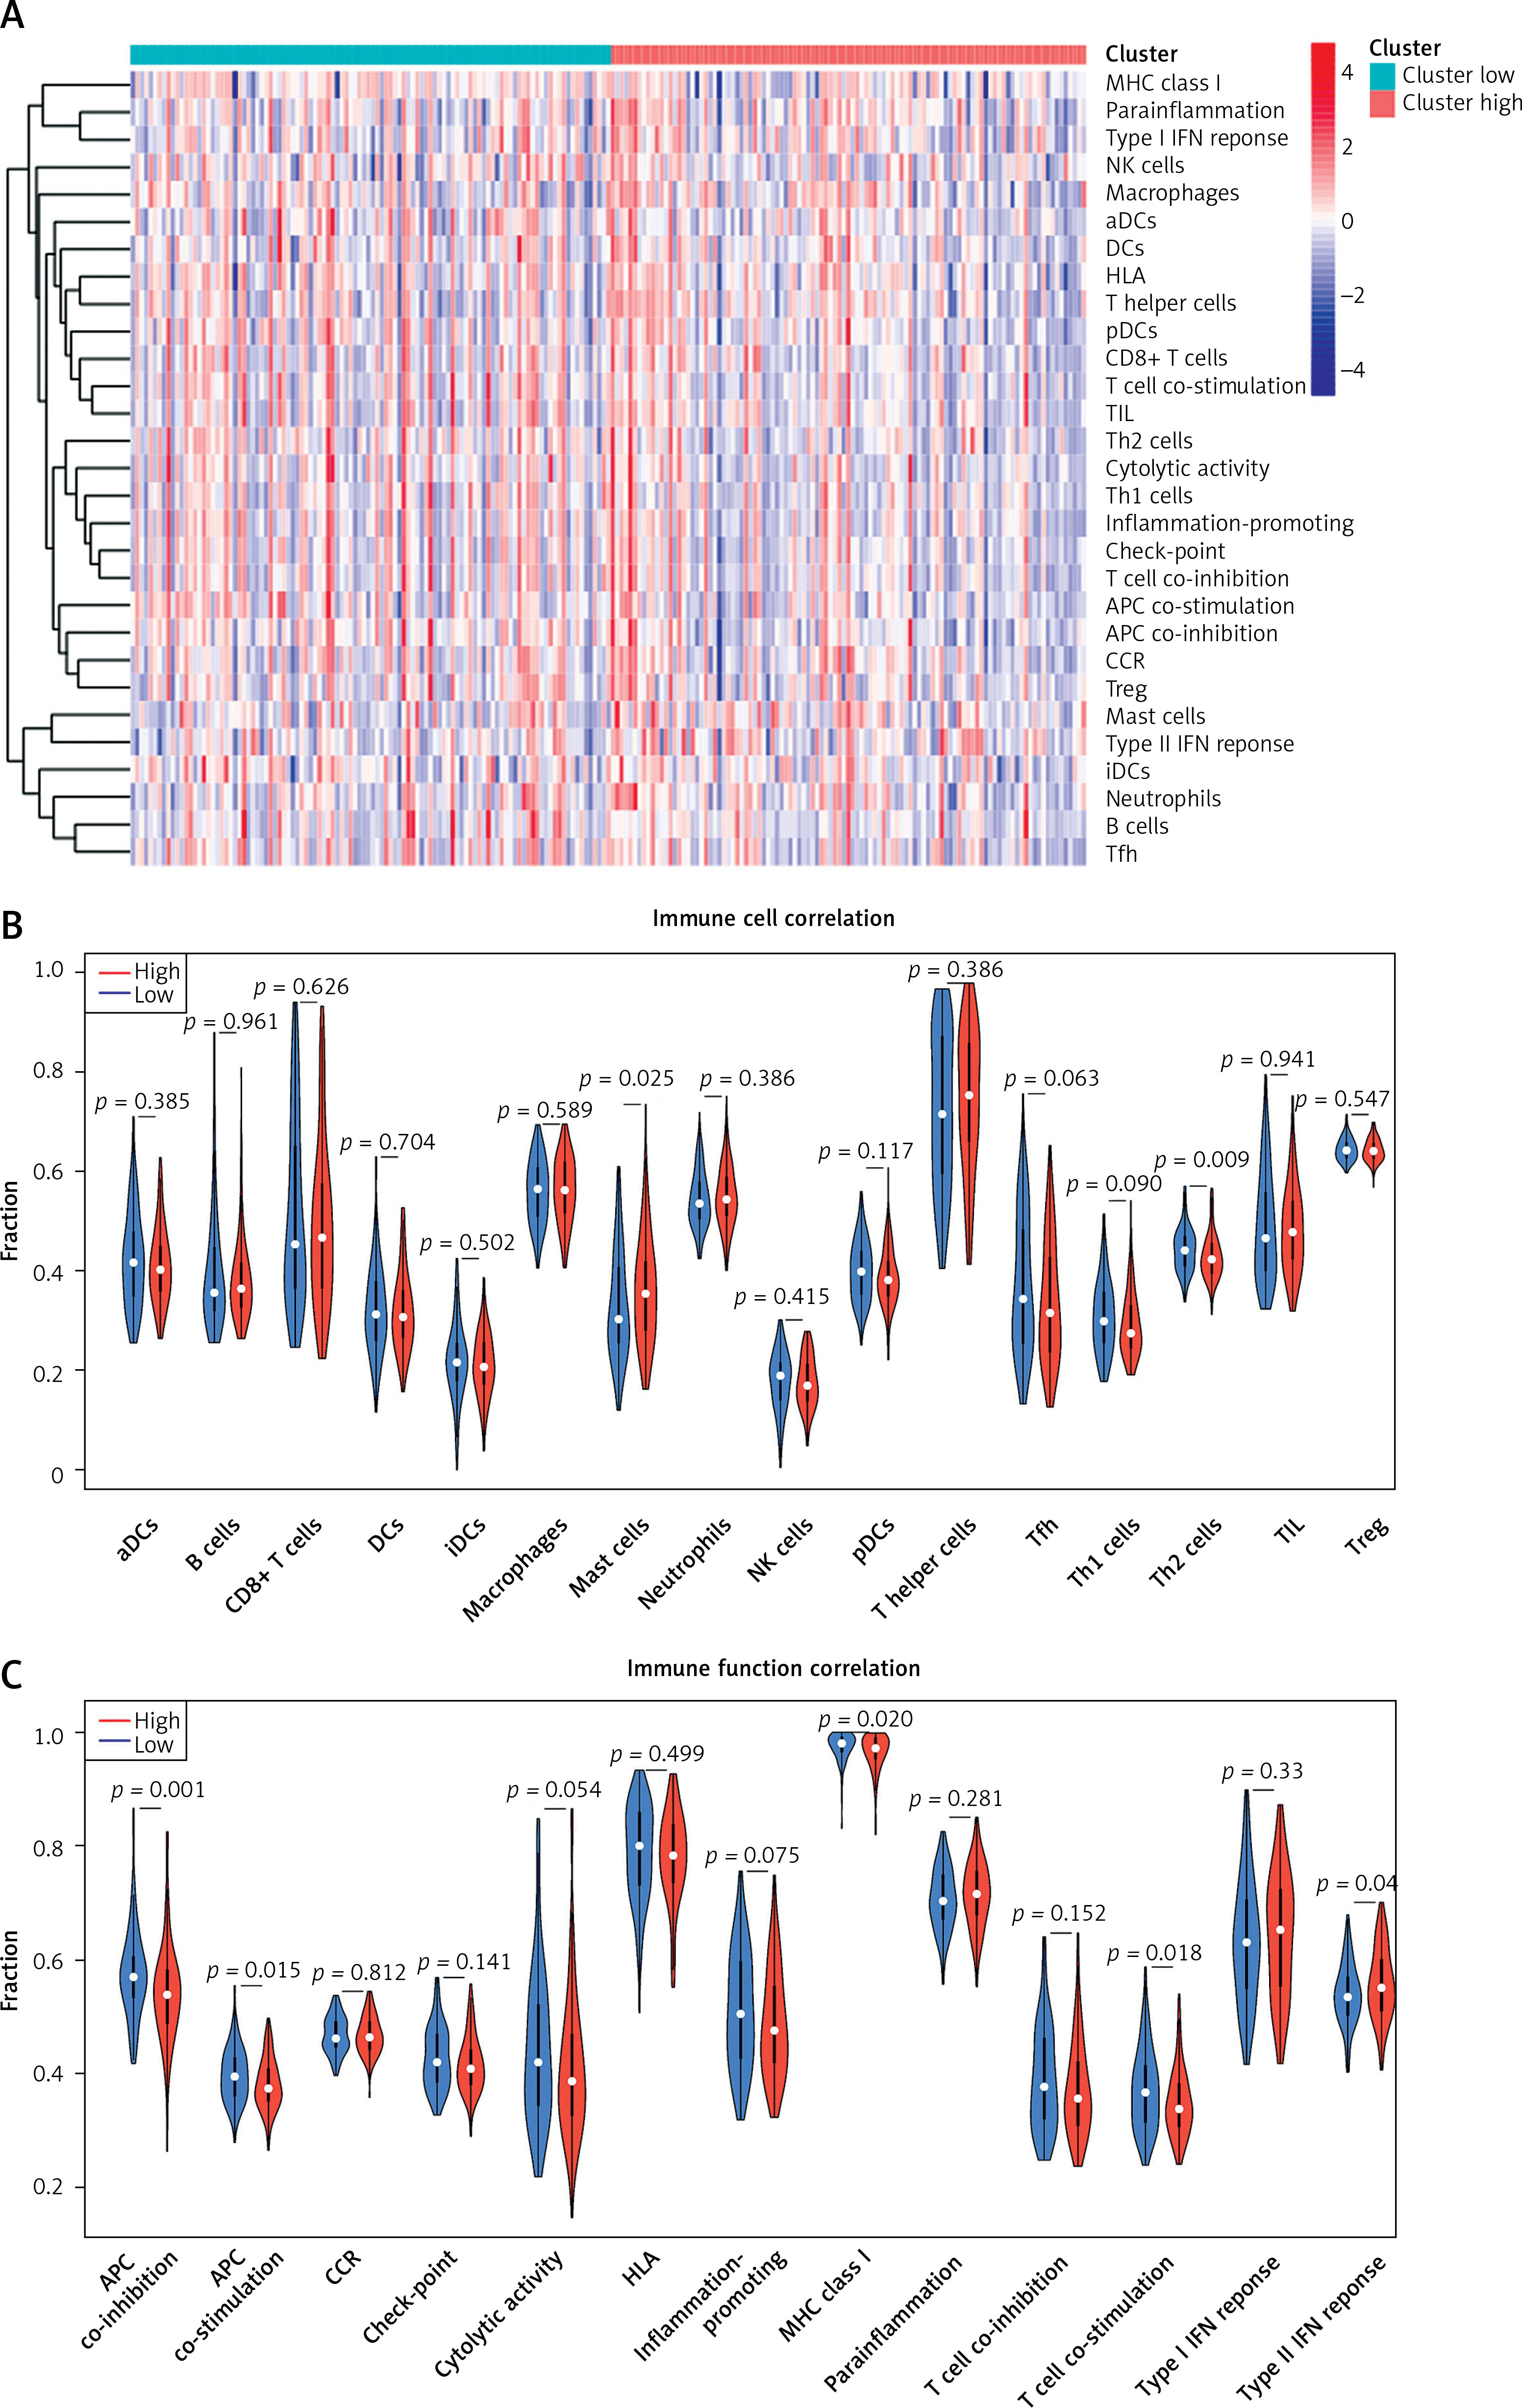
Table I
Correlation analysis of risk score with immune cell scores and immune function score
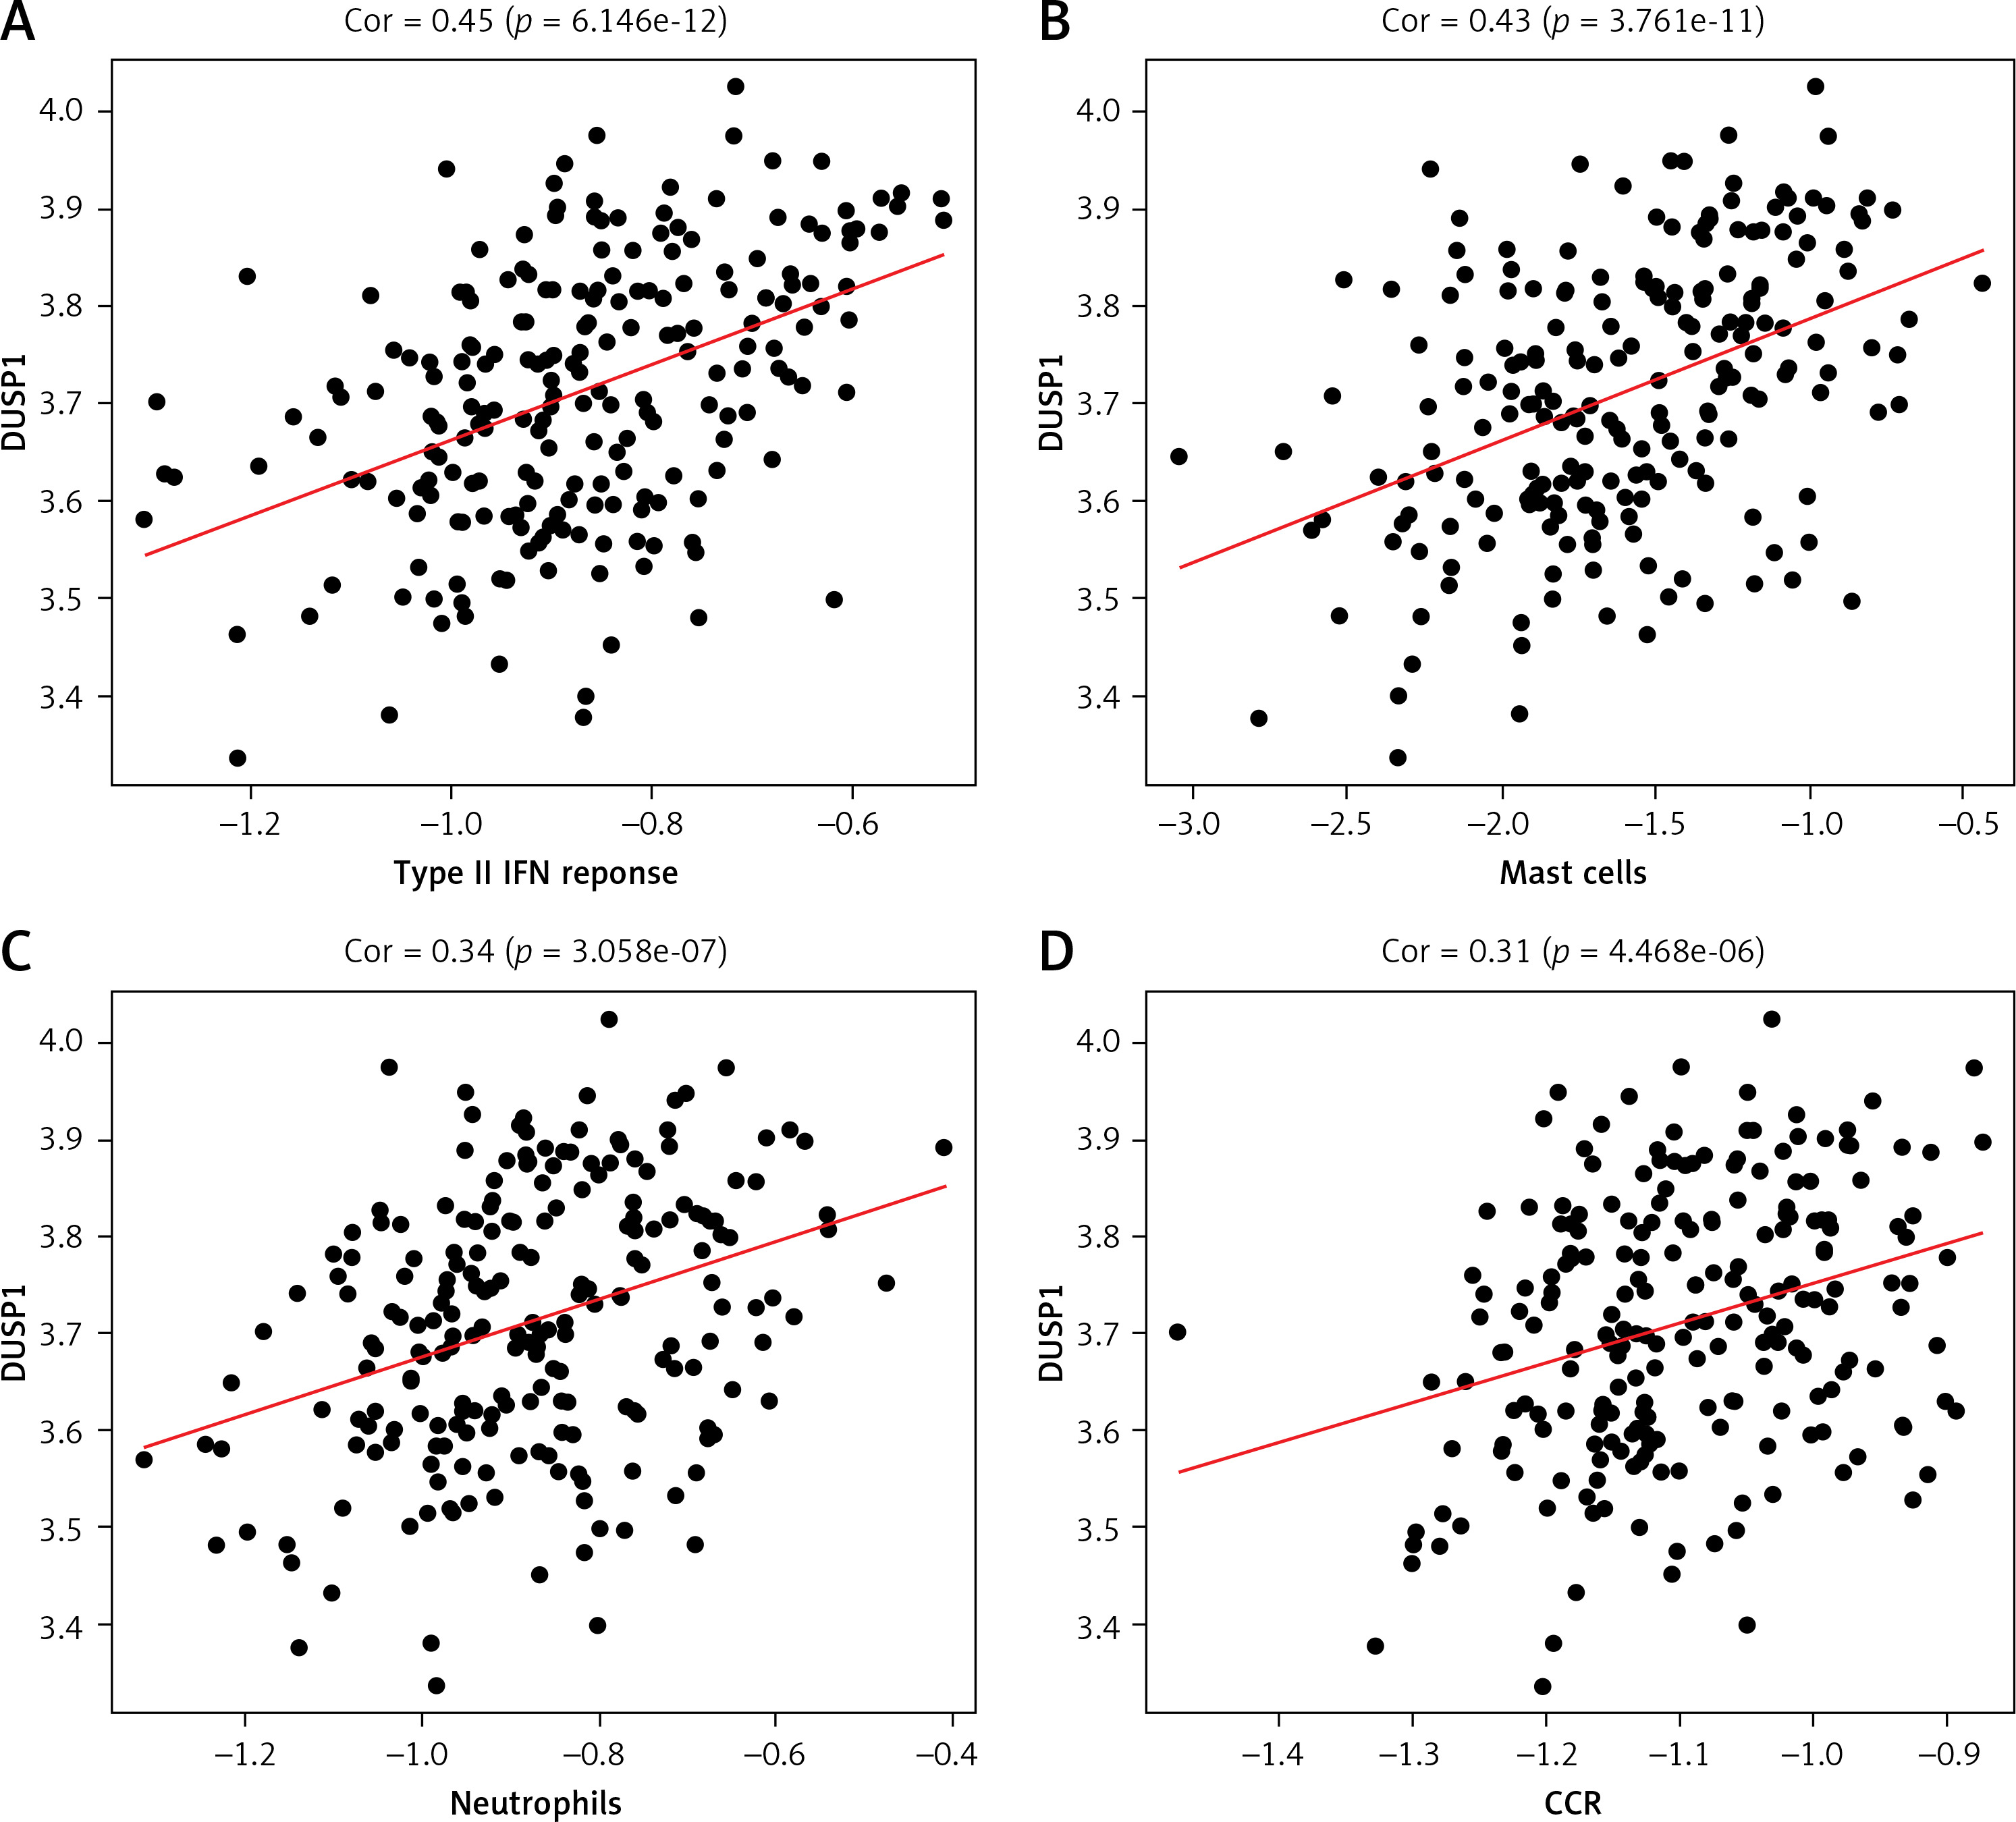
According to previous studies, DUSP1 inhibits ERK kinase activity, thereby preventing overactivation of HIF-1, a key player in regulating oxygen delivery in hypoxia tumor cells and metabolic adaptation to hypoxia [25]. Hypoxia affects tumor immune status by facilitating immune evasion and resistance [23]. Therefore, here we calculated the correlation between DUSP1 and a variety of immune-related cells and functions. DUSP1 was positively correlated not only with immune-related cell scores such as Mast_cell and Neutrophils but also with immune-related function scores such as CCR and type_II_INF_REPONSE. These observations added weight to the finding that, via repressing hypoxia, DUSP1 may inhibit immune evasion and resistance of tumor cells to suppress cancer progression (Figures 7 A–D).
Tumor mutation analysis and IPS differences in high- and low-risk groups
The top 30 most frequently mutated genes, according to the SNV mutation data from the TCGA-STAD cohort, were selected to draw waterfall plots in two risk groups in the validation set (Figures 8 A, B). According to the results, the high-risk group was identified with a higher mutation frequency of the top 30 genes, with the top 5 genes being TP53, TTN, MUC16, LRP1B, and SYNE1. As for the low-risk group, five genes that topped the mutation frequency rank were TTN, TP53, ARID1A, MUC16, and SYNE1. Subsequently, we performed a χ2 test on the above-mentioned genes to investigate whether their mutant frequency differed between the two groups. The results showed that the mutation frequencies of TTN and ARID1A were substantially elevated in the high-risk group (Table II).
Figure 8
Tumor mutation analysis and IPS difference in high- and low-risk groups. A – Tumor mutation burden (TMB) waterfall plot of top 30 mutated genes in high-risk group. B – TMB waterfall plot of top 30 mutated genes in low-risk group C – IPS difference between high- and low-risk groups. D – IPS-CTLA4 blocker scores; E – IPS-PD1/PDL1/PDL2 blocker scores, and F – IPS-CTLA4/PD1/PDL1/PDL2 blocker scores in both groups
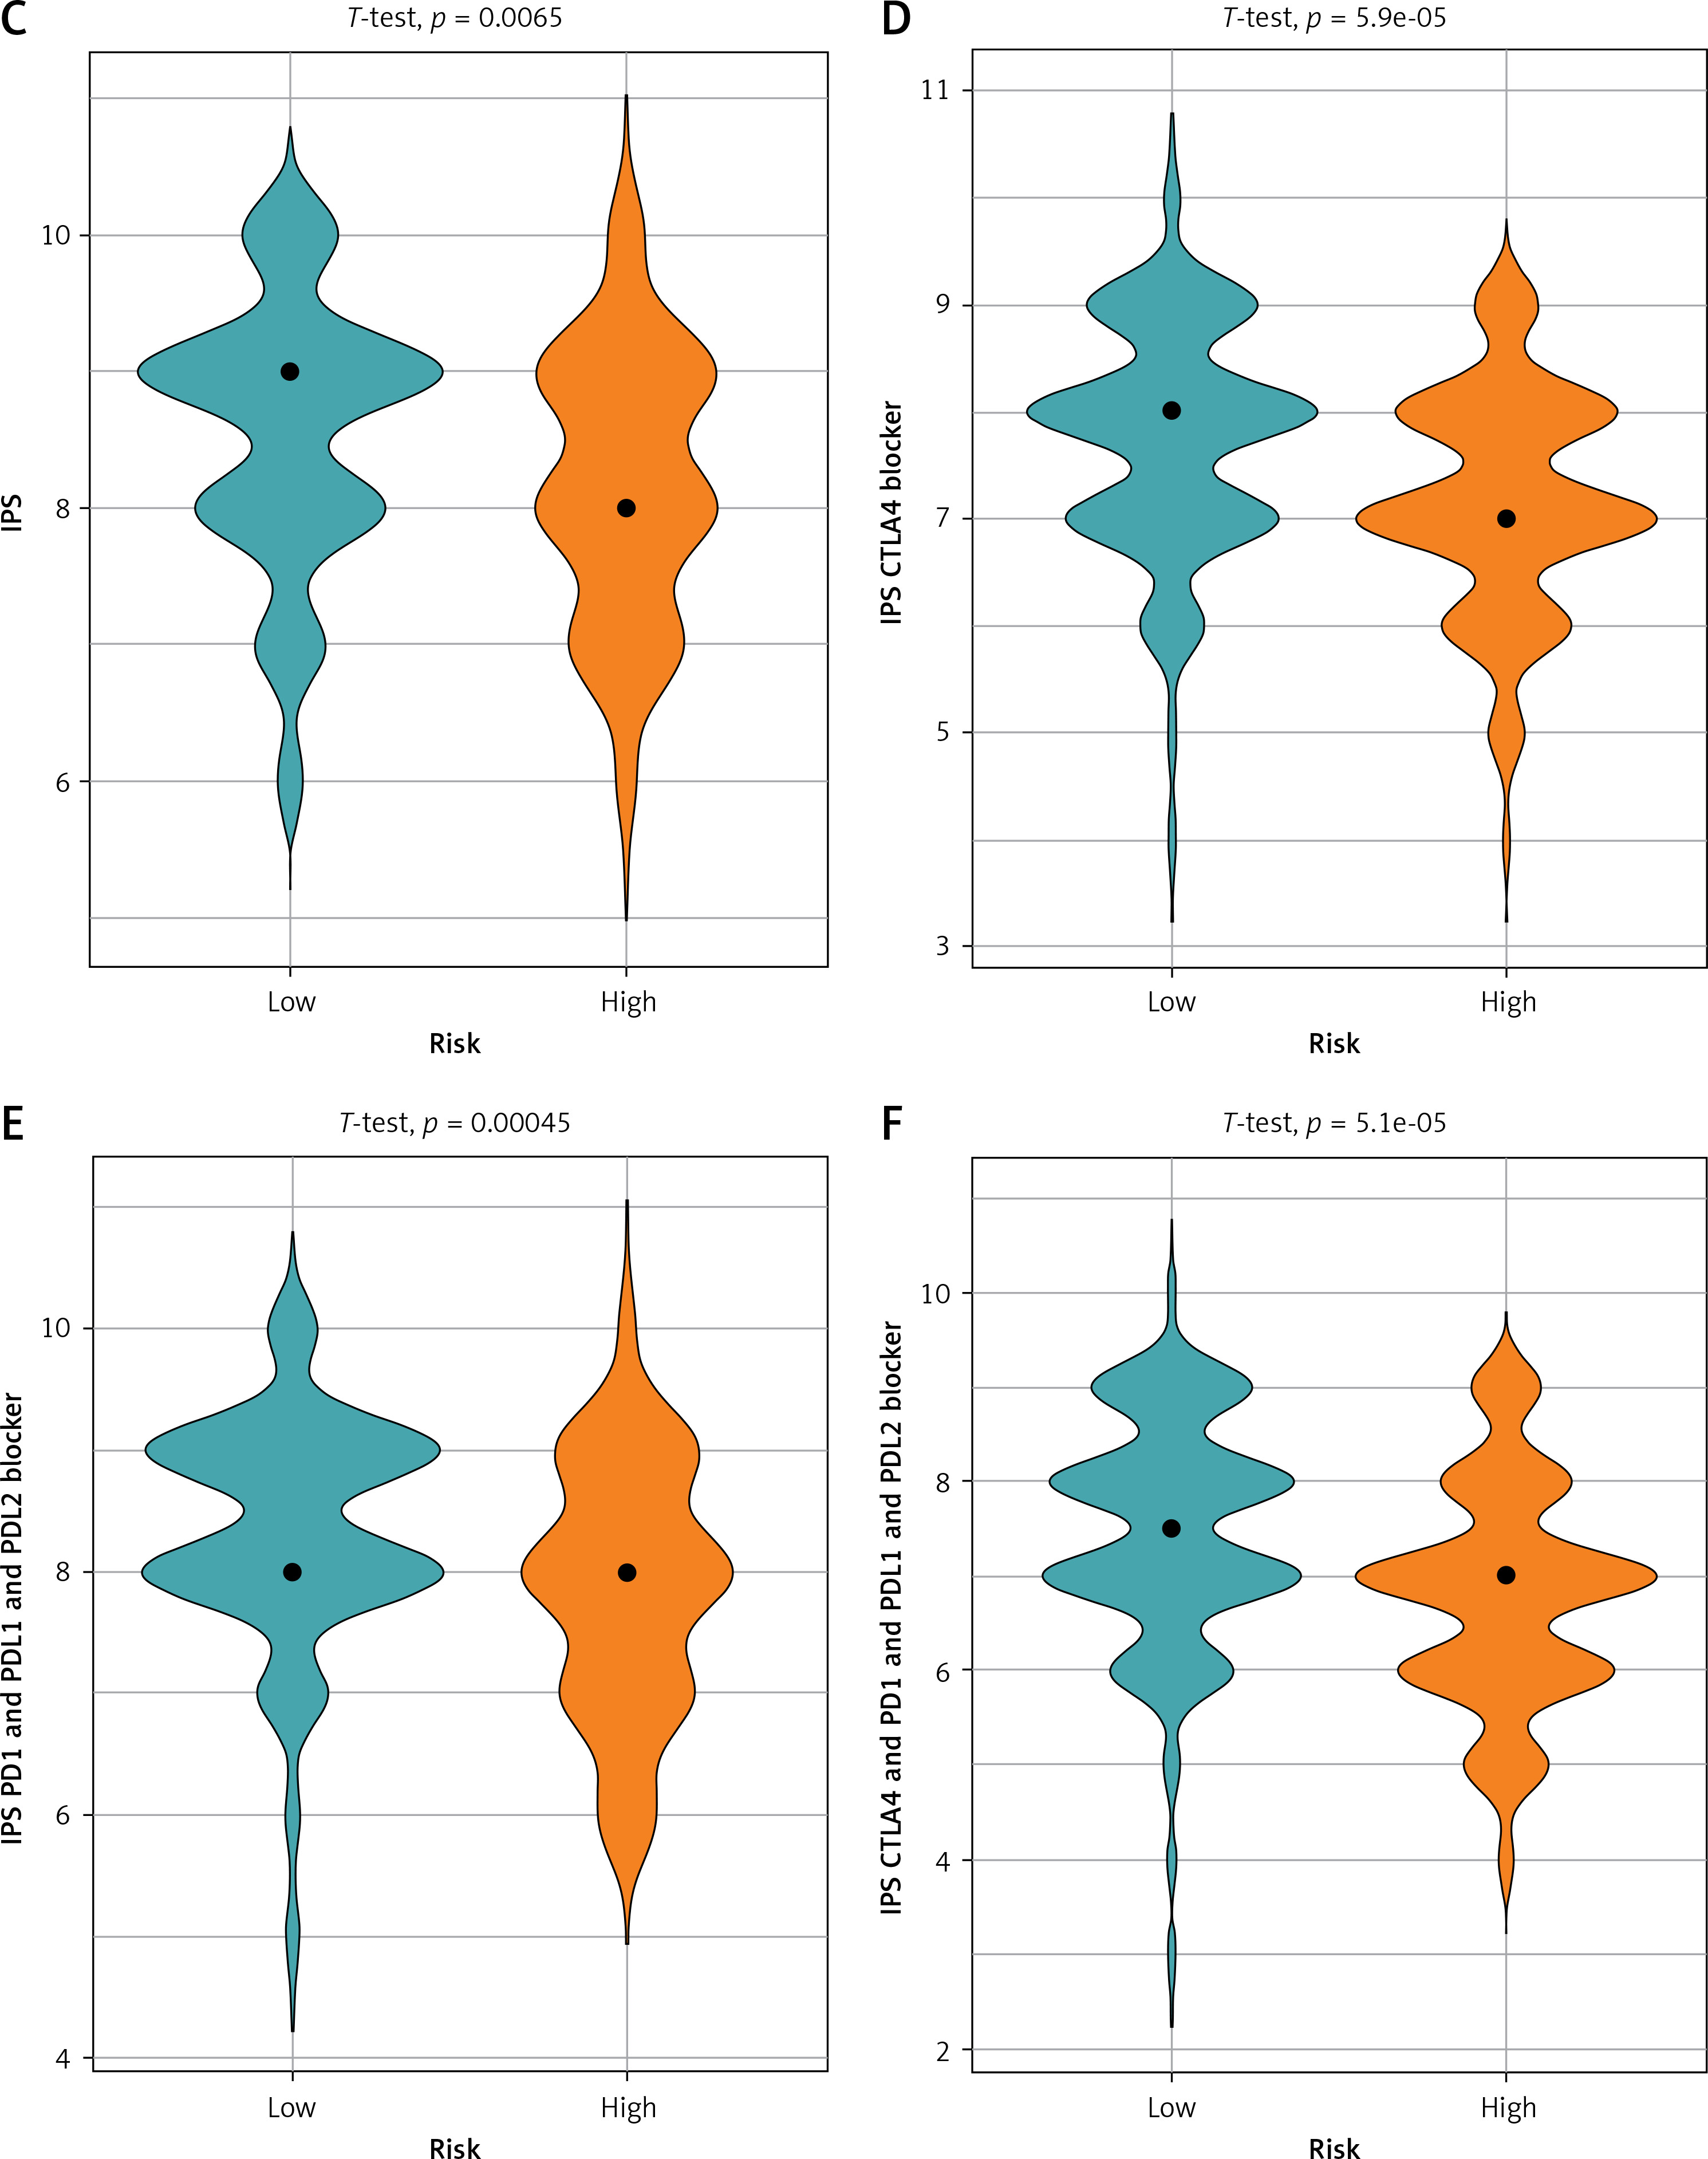
Table II
The χ2 test results of the top 5 genes ranked by mutation frequencies in the high- and low-risk groups
| id | χ2 | P-value |
|---|---|---|
| TTN | 6.32213 | 0.01192 |
| TP53 | 0.16617 | 0.68354 |
| ARID1A | 7.78352 | 0.00527 |
| MUC16 | 1.662 | 0.19733 |
| SYNE1 | 2.67463 | 0.10196 |
| LRP1B | 0.51928 | 0.47115 |
The immunophenoscore is a measurement of how oncology patients respond to ICI therapy, and higher scores indicate a better response to immunotherapy. After downloading IPS of STAD patients from TCIA, we plotted differences between 4 IPSs across high- and low-risk groups. According to the results, IPS, IPS-CTLA4 blocker score, IPS-PD1/PDL1/PDL2 blocker score, and IPS-CTLA4/PD1/PDL1/PDL2 blocker score were substantially increased in the low-risk group (Figures 8 C–F). Thus, patients in the low-risk group were more likely to benefit from ICI treatment.
Validation of expression levels of prognostic signature genes in STAD
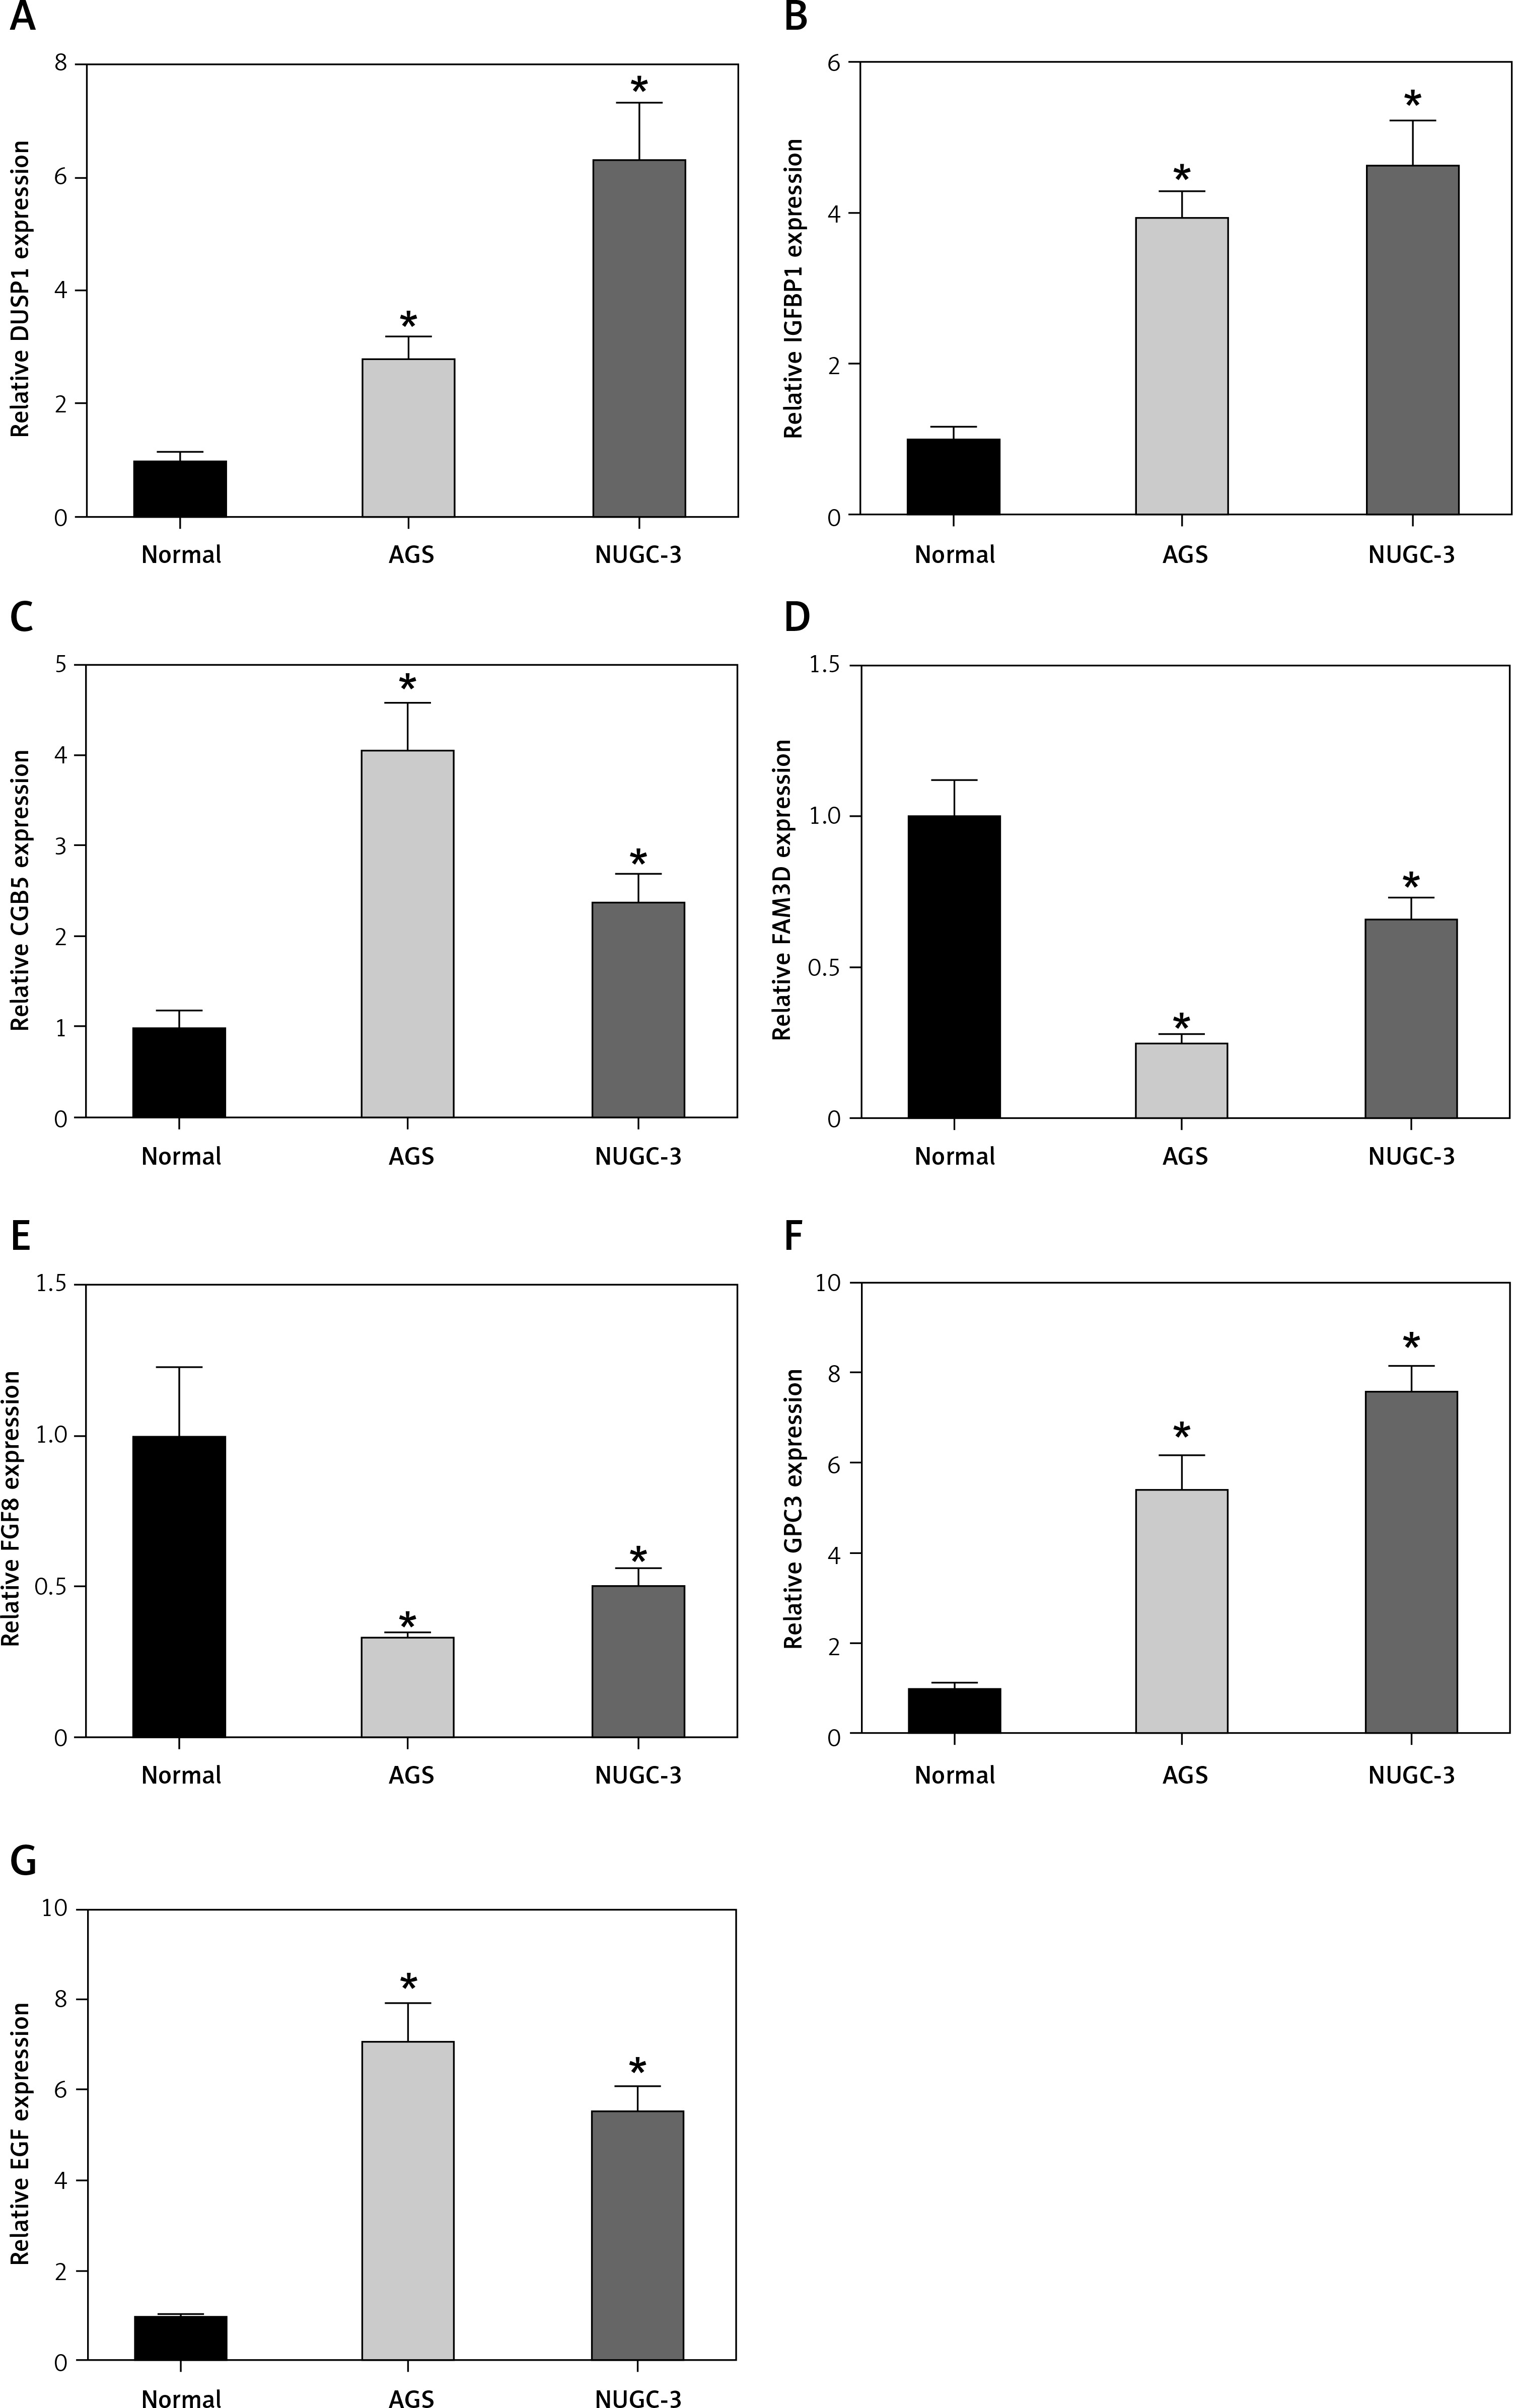
To verify whether prognostic signature genes were significantly different between STAD and normal gastric cells, we performed q-PCR analysis. As expected, the expression levels of DUSP1, IGFBP1, CGB5, GPC3 and EGF in STAD cells were significantly higher than those in normal gastric cells, while the expression levels of FAM3D and FGF8 were significantly lower (Figure 9).
Discussion
The TME is a complex network crucial to the development of cancer. Among elements within such a complex network, hypoxia is considered to be the factor most relevant to the tumor response [26]. Prevalent in most solid tumors, hypoxia has a strong relationship with drug resistance and poor prognosis as it promotes local and systemic tumor progression by activating angiogenesis [27]. Furthermore, the hypoxic TME can suppress the efficacy of the immune response [28]. It has been demonstrated that the hypoxic TME can inactivate immune effector cells and promote the activity of immunosuppressive cells, with such an immunosuppression state further enhanced by immune evasion and tumor cell adaptability to hypoxia [29–32]. Therefore, according to the characteristics of tumor hypoxia and immunity, this study retrieved relevant data from public databases and, by adopting bioinformatics analysis, built a STAD prognostic model related to hypoxia and immunity.
Hypoxia- and immune-related genes in STAD were analyzed and screened by bioinformatics methods in this study, which yielded a total of 7 prognostic feature genes (DUSP1, IGFBP1, CGB5, FAM3D, FGF8, GPC3 and EGF). Immune-related genes included CGB5, FAM3D, FGF8 and EGF. CGB5 (chorionic gonadotropin-β5) is a protein-coding gene that is mainly involved in invasive melanoma and ectopic pregnancy. Qin et al. [33] found that CGB5 is a critical gene in STAD patients’ prognosis prediction and is associated with a variety of immune cells. As a member of the FAM3 family, FAM3D (Family with sequence similarity 3 member D) is a member of the cytokine-like family and plays an important role in cell proliferation, and it has been proven to be associated with intestinal inflammation and notably highly expressed in gastrointestinal inflammation [34, 35]. Fibroblast growth factor (FGF) family genes are now included in anti-cancer therapy as targets to combat chemoresistance in many different malignancies. In a study conducted by Jomrich et al. [36], FGF8 was found to be highly expressed in adenocarcinoma of the esophagogastric junction and shorter overall survival was associated with higher FGF8 expression. EGF and its receptors are crucial to tumor development. Li et al. [37] discovered that, in basal-like breast cancer, inhibition of the EGF signaling pathway enhances PD-L1 (programmed cell death-ligand 1, a type I transmembrane protein of 40 kDa, which promotes proliferation of T cells with antigen specificity) stability and the therapeutic effect of PD-1 (programmed death 1, an important immunosuppressive molecule) blockade, thus facilitating the tumor-infiltrating cytotoxic T-cell immune response. It can be seen that these biomarkers can be used to assess the extent of clinical disease progression. In future molecular or clinical studies, these markers may also have the potential to be used as therapeutic targets to improve the prognosis of patients with various tumors, including gastric adenocarcinoma. In the clinical treatment setting, prognostic biomarkers can also help to decide whether or how to aggressively pursue therapeutic interventions.
Two hypoxia-related genes used to build the prognostic model were DUSP1 and IGFBP1. DUSP (dual-specificity protein phosphatase1), a subfamily of the protein tyrosine phosphatase (PTP) superfamily, is a negative regulator of HIF-1α [38]. It has been demonstrated that DUSP1 plays an important role in regulating cell proliferation, tumorigenesis and drug resistance. The CASC9-EZH2-DUSP1 regulatory axis is confirmed to regulate p-ERK (ERK, extracellular signal-regulated kinase, belongs to the mitogen-activated protein kinase family and is responsible for fundamental cellular processes, including cell proliferation and differentiation) expression, thus promoting gefitinib resistance in non-small cell lung cancer [39]. IGFBP (insulin-like growth factor-binding protein) is a series of cystine-rich proteins that can bind to IGFs in serum and regulate cell proliferation [40]. After analyzing IGFBP family genes in GC, Liu et al. [41] found that IGFBP1 was highly expressed in GC, and its higher expression level was associated with a shorter survival time. Xu et al. [15] found that IGFBP1 may regulate renal cell clear cell carcinoma progression and immune infiltration by mediating the biological function of monocytes. Thus, the hypoxia signature genes screened in this study are closely related to tumor immune infiltration as well as prognosis.
In recent years, immunotherapy has become more popular, since it can effectively treat cancer and help cancer patients by affecting the interaction between the human immune system and cancer [42]. Although the application of immunotherapy has been a great success in the treatment of various tumors, its efficacy is not ideal due to the limited response to immunotherapy. Hence, biomarkers indicating the response to immunotherapy are the focus of current studies. There is a close link between tumor transformation and somatic mutations. Therefore, it is important to explore tumor mutational burden (TMB) and tumor immune infiltration for the development of immunotherapy regimens and the prognosis of patients. Currently, a growing amount of research is focused on the relationship between TMB and tumor immune infiltration. Ren et al. [43] analyzed data from GC patients in public databases using the TIDE algorithm and found that patients with low stromal cell infiltration scores had higher TMB, microsatellite instability, and sensitivity to ICIs. Wang et al. [44] found that, when using the PD-1 inhibitor toripalimab to treat advanced GC patients, the response rate was significantly higher in patients with high TMB (14.6 vs. 4.0 months, HR = 0.48, 96% CI: 0.24–0.96, p = 0.038), while PD-L1 expression was not associated with patient survival. In this study, we combined TMB score with tumor immune infiltration and found that patients with a low risk score had higher immune infiltration, immune activity and TMB. It indicated that immunotherapy may yield better results among GC patients with low risk scores, which was consistent with previous studies. However, hypoxia triggers a series of events, such as promoting tumor growth, enhancing tumor immune escape and stimulating tumor angiogenesis [45]. It has been found that hypoxia enhances HLA-G expression in tumors [46, 47]. HLA-G is a marker of tumor immune escape. Murdaca et al. [48] found that HLA-G expression corresponded to a lower poor survival rate in patients with stage III gastric adenocarcinoma, which may be related to immune escape mechanisms of cancer cells [49]. This may be one of the reasons for the failure of immunotherapy and chemoresistance in some cancer patients [50]. Exploiting tumor hypoxia may be a potential cancer treatment strategy.
In conclusion, with data retrieved from public databases, this study analyzed hypoxia- and immune-related genes in STAD patients and built a 7-gene prognostic model with stable predictive performance. The prognostic risk score of patients can act not only as an independent prognostic factor but also as a reference for patients receiving immunotherapy. At the same time, the feature genes of the prognostic model in this study are closely related to the occurrence and development of tumors and can be used as potential targets for STAD treatment, which can be used as an entry point to conduct a more in-depth study of the pathogenesis of STAD. Unfortunately, there are still some limitations of this study. For instance, the retrospective data from public databases used in this study may affect the stability of the model due to inherent selection bias. Clinical data will subsequently be introduced through collaboration with other institutes to fully investigate the potential value of the 7-gene signature in clinical practice. Also, multi-prospective studies and in vivo and in vitro experiments are needed to deeply explore the link between risk score, TMB and immune infiltration to fully prove the accuracy of prognostic models.