Introduction
Irwin Rosenberg, an American researcher, originally proposed the concept of sarcopenia as a type of geriatric condition in 1989 [1], mainly characterized by decreased muscle mass, weakened muscle strength, and a decrease in individual activity ability. According to a study, sarcopenia affects older adults between the ages of 60 and 80 with a frequency of 11.1% and older adults above the age of 80 at a prevalence of 33.1% [2]. In addition, sarcopenia is closely related to heart failure (HF), frailty, etc. In patients with HF, myocardial contractility decreases, and skeletal muscle blood perfusion is insufficient, resulting in reduced skeletal muscle mass and function. Sarcopenia with frailty syndrome (FS) can also lead to a decline in physical function and quality of life in patients with a variety of diseases such as diabetes and HF [3–5], as well as an increase in hospitalization rates, length of stay and hospitalization costs, thereby increasing the public health burden – one of the biggest medical challenges society will face in the future.
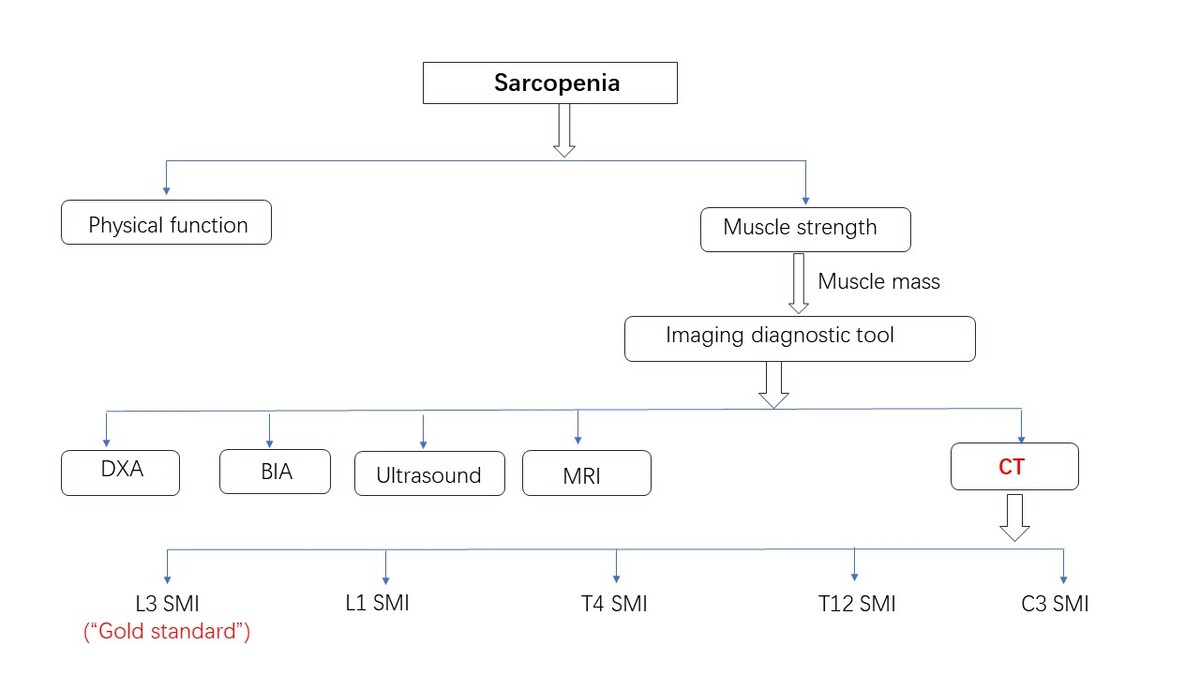
Studies have shown that sarcopenia is not only associated with aging but also occurs at an earlier age in chronic patients [6]. The International Working Group on Sarcopenia (IWGS) 2011 considers sarcopenia to be like most kinds of geriatric syndromes, rarely recognized by doctors [7]. Sarcopenia must be accurately diagnosed and treated as soon as possible because it can be a significant predictor of poor clinical outcomes in the elderly and patients with many other diseases [8]. We hope that opportunistic computed tomography (CT) screening can provide muscle mass information, improve clinicians’ understanding of sarcopenia, and provide a basis for clinical screening, identification, diagnosis, treatment, and intervention. Because of the complex diagnostic tools and inconsistent diagnostic criteria for sarcopenia [9], there are great differences in the clinical diagnosis of sarcopenia [10, 11], and the prevalence rate has a large fluctuation range, so further research on universal diagnostic tools and diagnostic criteria needs to be carried out.
Many patients with sarcopenia do not exhibit obvious symptoms, but the reduction in muscle mass is significant on imaging. In practice, while being used primarily for diagnosing thoracoabdominal diseases, CT is also increasingly utilized for routine health check-ups. Recently, CT has become more commonly used for measuring muscles [12–14]. CT measurement of muscle size is a reliable and valid technique that can be used in numerous studies to assess the presence of sarcopenia in healthy adults [15], and this CT body composition analysis has evolved into an objective measure of physical health in patients with comorbidities. The chest CT analysis we describe for assessing the presence or absence of sarcopenia has the distinct advantage of leveraging the patient’s existing opportunistic CT images, combined with an artificial intelligence (AI)-automated analysis process, to improve diagnostic efficiency without increased radiation exposure and additional test costs. The CT imaging technique clinically allows straightforward body composition analysis and sarcopenia quantification from a single axial image acquired at the different vertebrae, with the advantages and utility of CT imaging technology being far greater than those of X-ray absorptiometry (DXA) and bioelectrical impedance analysis (BIA) [16].
Many international working groups on sarcopenia have noted that an evaluation of muscle mass and function should be part of the diagnosis. However, the cut-off point of muscle mass is still used as the core diagnostic index [17]. To increase the application value of opportunistic CT screening and to provide more evidence for clinical sarcopenia diagnosis, this paper compares the current CT diagnosis of sarcopenia with other diagnostic techniques.
Comparison between existing diagnostic methods of muscle volume and CT
Skeletal muscle mass (SMM) is closely related to skeletal muscle strength and function. Total body skeletal muscle mass, appendicular skeletal muscle mass, or skeletal muscle cross-sectional area of a specific muscle group or body part can reflect SMM. Muscle loss can be divided into primary and secondary causes, with primary sarcopenia referring to a reduction of muscle mediated by aging. Secondary sarcopenia focuses on loss of muscle mass, rather than emphasizing muscle function. With the deepening of the understanding of the pathogenesis of sarcopenia, statistics on the incidence of this disease are becoming increasingly common. Studies have shown that the overall prevalence of sarcopenia in Chinese elderly men is 18%, the total prevalence of elderly men living in the community is 12.9%, and the total prevalence of hospitalized elderly men is 29.7%. The overall prevalence of sarcopenia in elderly women was 16.4%, the prevalence of community-living elderly women was 11.2%, and the prevalence of hospitalized elderly women was 23.0% [18].
In the diagnosis of sarcopenia, many screening methods are used, some for clinical purposes, and some for scientific research. In practical application, appropriate diagnostic techniques can be selected according to the requirements and advantages and disadvantages. Based on the attenuation characteristics of the X-ray beam through different tissues such as muscle and fat, CT examination can accurately distinguish muscle from other body tissues and provide information about muscle mass. Utilizing opportunistic CT images from patients or individuals undergoing health examinations incurs no additional examination costs. These opportunistic CT images may be an overlooked resource; if effectively used in sarcopenia assessment, they could greatly advance clinical diagnostic research on sarcopenia. Although BIA is easy to perform and is useful in primary care, its low accuracy limits its diagnostic application in clinical practice. Due to its outstanding advantages, CT imaging has gradually replaced traditional diagnostic techniques such as DXA, BIA, and body composition analysis to evaluate muscle mass, and it has become the first choice of more clinical workers.
DXA
DXA assesses fat, bone, and muscle mass by analyzing different attenuation characteristics of X-rays in soft tissue, bone, and muscle. The diagnostic accuracy of sarcopenia is high, the examination time is short, the cost is low, the radiation is low, and the patient compliance is high, so it has been widely used in early scientific research related to the diagnosis of sarcopenia. DXA diagnosis of sarcopenia typically follows the standards set by the Asian Working Group for Sarcopenia (AWGS) [19]. The reference values of diagnostic cut-off points for men and women were 7.0 kg/m2 and 5.4 kg/m2 respectively, which were more consistent with the body composition, genetic background, and ethnic characteristics of the Asian population. However, there are some drawbacks to the practical application of DXA: the equipment is expensive, non-portable, non-mobile, and difficult to obtain in primary medical institutions, which limits its application in large-scale epidemiological studies. The utilization rate of DXA examination equipment in various medical institutions is relatively low, with the number of DXA scanners per million population ranging from 24 in South Korea to less than 1 in Sri Lanka and Vietnam [20]. In addition, because its measurement accuracy is easily affected by the beam hardening effect and soft tissue hydration, it is inappropriate for obese patients or patients with excessive water volume [21]. Therefore, DXA plays a limited role in clinical practice.
BIA
BIA is a painless and non-invasive technology that can measure body composition such as fat, muscle, bone, and water according to the electrical conductivity of the whole body. The advantages are: easy to operate, safe and non-invasive, low cost, fast execution, convenient bedside application. The BIA diagnostic criteria for sarcopenia updated by AWGS2 were: < 7.0 kg/m2 for males and < 5.7 kg/m2 for females. However, since human impedance is closely related to water content, BIA is highly susceptible to changes in total water content and body fluids when conducting conductivity analysis, such as environmental temperature, diet, water, diarrhea, and exercise [22]. The accuracy of BIA is suboptimal, and the validity of its results cannot be unequivocally guaranteed. Moreover, the limited availability of equipment hampers its widespread implementation in large-scale clinical practice. BIA is only employed as a screening tool for sarcopenia when superior alternatives are not readily accessible [23].
CT
CT examination is routinely used clinically [24]. DXA and BIA are far less accessible as the test device than conventional CT. For CT images of patients with other diseases, if the information on muscle metabolism and muscle mass can be regularly extracted from the images, opportunistic sarcopenia screening will help in the early detection and follow-up of muscle metabolic diseases. CT, as a cross-sectional imaging technique, can be used to assess many acute and chronic diseases associated with aging, including fractures, frailty, cancer, and cardiometabolic syndrome [25], and has been associated with many important clinical outcomes, including death [26, 27]. CT image files of patients were extracted from different vertebral body levels, such as skeletal muscles of the third lumbar spine, including the erectus, transversus abdominis muscle, psoas major, internal oblique muscle, and external oblique muscle. The attenuation of muscle tissue ranges from –29 to 150 HU. The total skeletal muscle area (cm2) can be obtained by semi-automatic mapping using image processing software. Some scholars [28] believe that using the cross-sectional area (cm2) of a single skeletal muscle on CT images to predict the skeletal muscle content of the whole body is reproducible and highly correlated with other methods to evaluate skeletal muscle content. CT examination has become the main means to assess muscle mass in patients with many diseases such as cancer [28], which can display lesions, provide accurate scanning details, and help obtain skeletal muscle parameters such as muscle cross-sectional area (CSA), skeletal muscle area (SMA), skeletal muscle index (SMI), and skeletal muscle volume.
CT is currently the most accurate method to measure muscle mass, being the “gold standard” for morphological analysis [29]. Moreover, the imaging technique can be used for multiple disease stages and follow-ups [30], so sarcopenia can be evaluated in prospective and retrospective analyses. Analyzing patients’ opportunistic CT images to assess muscle mass allows for a more objective quantitative diagnosis, which is easier and more efficient. Deploying opportunistic CT images as a superior examination method can provide new strategies for sarcopenia diagnosis and treatment. A study of 450 trauma patients reported that CT-derived sarcopenia was associated with increased mortality [31]. Another study of 83 patients showed that CT-derived measurements of sarcopenia were predictive of hospital length of stay in older burn patients [32].
However, the criteria for determining skeletal muscle parameters at the level of CT images to assess sarcopenia are not uniform at present, and the cut-off point values used at the same level are also different in different studies. The main reason is that the field of view from the scan, the patient’s position, and the selection of vertebral segments are different. There is not much difference in the concept and content of sarcopenia. Clinically, when diagnosing sarcopenia based on CT images, a unified measurement posture, a unified analysis method, and a multivariate prediction rule combined with the characteristics of the patients can be used to estimate muscle CSA better [33]. The diagnostic criteria of AWGS are mainly referred to in our country. Below we focus on the development of CT in diagnosing sarcopenia and discusses the diagnostic value of AI-driven opportunistic CT images.
CT image and diagnosis of sarcopenia
L3 SMI
Regarding the CT diagnosis of sarcopenia, the initial research mainly focused on the psoas major. Bokshan et al. [34] diagnosed sarcopenia by dividing the cross-sectional area of the psoas major muscle at the fourth lumbar vertebra (L4) in the abdominal CT images by the square of the height. Later, more studies found that the muscle mass at the third lumbar vertebra (L3) in abdominal CT images was closely related to the SMM of the limbs, and the quantitative measurement of skeletal muscle and parameters related to skeletal muscle space fat at the L3 vertebral body level by CT had high repeatability. CT can accurately estimate skeletal muscle volume and whole-body muscle mass by measuring the muscle cross-sectional area of the L3 layer with three-dimensional imaging technology [35, 36]. Therefore, the most commonly used technique is to evaluate all skeletal muscle on axial sections at the L3 vertebral level [37]. These studies also further validated the reliability of quantitative CT measurements for L3 vertebral plane skeletal muscle analysis. SMI is the muscle mass of limbs after height correction [muscle mass of limbs (kg)/square of height (m2)]. On CT images, SMI can be represented by the CSA of muscle tissue (cm2)/square of height (m2) at different vertebral layers. L3 SMA or L3 SMI measured by CT can represent total body skeletal muscle mass and has become a common method for assessing sarcopenia [38–40]. L3 SMI is also the gold standard for the diagnosis of sarcopenia at home and abroad, which is widely used in the detection of sarcopenia in cancer patients. Currently, the reference value of the L3 SMI tangent point used in most cases is ≤ 39 cm2/m2 for females and ≤ 50 cm2/m2 for males [41].
L1 SMI
Muscle measurement at the L3 level requires patients to undergo abdominal CT examination, which is not suitable for routine evaluation of patients. The skeletal muscle cut-point values from the tenth thoracic vertebra (T10) to the fifth lumbar vertebra (L5), reported by Derstine et al. [42], extended the assessment of apnea to the chest and pelvic examination so that the imaging technique could be applied more widely in the clinic. Although not all chest CT scan images provided by patients with thoracic malignancies and other diseases include the L3 level, they can provide skeletal muscle parameters and other body tissue composition information at the first lumbar vertebra (L1) level. Many scholars have found that the muscle mass information of other vertebral segments on CT images can also be used to evaluate sarcopenia [43], and patients do not need to undergo non-contrast abdominal CT scanning. Chest CT can depict the conditions of the pectoralis major and latissimus dorsi muscles. Therefore, the analysis of skeletal muscle information at different levels of chest CT images is of great significance for confirming sarcopenia. Studies [44] have shown that the cut-point values of L1 SMI determined by chest CT for the diagnosis of sarcopenia are 46 cm2/m2 (male) and 29 cm2/m2 (female). At present, this test is widely used in lung cancer patients [45]. Based on a population in central China, one study defined a sex-specific cutoff for L1 SMI with low skeletal muscle mass as 36.52 cm2/m2 for men and 27.29 cm2/m2 for women [46].
T4 SMI
Pectoral muscle size is a reliable and valid piece of information that can be used in large studies to assess the presence or absence of muscle loss in patients with advanced lung disease [47]. Kim et al. [48] used the CSA of chest muscle measured by CT to conduct a correlation study with SMM measured by BIA analysis. The results showed that SMI at the fourth thoracic vertebra (T4) was moderately correlated with L3 SMI, and L1 SMI was also highly correlated with L3 SMI. Because thoracic muscle is easy to label, and its measurement is easier than that of skeletal muscle at the L3 level, T4 SMI can be used as an indicator to detect sarcopenia in patients with thoracic tumors and other types of patients, and it is increasingly applied in related studies. Low T4 CSA reflected on chest CT images of patients with idiopathic pulmonary fibrosis (IPF), chest tumors, and chronic obstructive pulmonary disease may be a strong risk factor for all-cause death [49, 50], and early diagnosis and intervention can improve the prognosis of patients. In addition, the thoracic muscles from T4 to T6 were fairly evenly distributed. CSA at each level was strongly correlated with muscle volume [47], and moderately to highly correlated with measurements of the quadriceps muscle. It is concluded that T4 SMI, T5 SMI, and T6 SMI can effectively reflect the total body muscle volume and be used to diagnose sarcopenia.
T12 SMI
Chest skeletal muscle measurements can reasonably represent the area of other skeletal muscles in the body. The muscle mass area at the twelfth thoracic vertebra (T12) on a CT image can easily and accurately diagnose sarcopenia. The T12 level muscle measurement has been used more as a clinical tool. Gao et al. [51] used chest CT to measure the cross-sectional area of muscle tissue at the level of the T12 pedicle and calculated T12 SMI. The cut-off values for the diagnosis of sarcopenia can be used according to the criteria proposed by Nemec et al. [52] of Harvard Medical School: 42.6 cm2/m2 (male) and 30.6 cm2/m2 (female). In patients with COPD, chest CT measurements provide the size of the pectoral and erector spinal muscles, which correlate with disease-related parameters such as body mass index, lung function, exercise capacity, and dyspnea [53]. Although abdominal CT is not widely used in sarcopenia diagnosis with T12 SMI, in some specific cases, such as thoracic aneurysm repair [54], chest CT is superior to abdominal CT in the evaluation of sarcopenia.
C3 SMI
In addition, as research progresses, multiple studies have shown that the assessment of SMM at the third cervical vertebra (C3) level is simple and reliable [55], and that measurement of SMM at the C3 level in head and neck CT imaging may be a viable, economical, accurate, meaningful, and rapid biomarker for the detection of sarcopenia in patients with head and neck cancer (HNC) [38, 56]. Chargi et al. [57] proposed a new criterion for diagnosing sarcopenia: for BMI < 25 kg/m2 and ≥ 25 kg/m2, low SMM in men ≤ 6.8 cm2/m2 and ≤ 8.5 cm2/m2, respectively, low SMM in women ≤ 5.3 cm2/m2 and 6.4 cm2/m2, respectively. The muscle mass information based on CT measurement technology is reliable, and it can be used as an important predictor of surgical morbidity and mortality, which will have a wider application prospect in the future.
All in all, the thoracoabdominal muscle reduction measurement is an additional robust clinical tool that can be applied to a variety of disease states, especially those patients undergoing routine CT scans. This can be used to assess sarcopenia to reduce the cost of testing and expand the diagnostic strategy. However, it is undoubtedly a time-consuming and onerous task for clinicians to manually segment muscle groups on CT images and calculate muscle volume or area to evaluate muscle mass. So far, artificial intelligence image analysis software has been gradually introduced. Machine learning algorithms are proving to be better than manual measurements of bone and muscle [58, 59].
Application advantages of artificial intelligence technology
Machine learning, part of artificial intelligence, can be used to analyze medical big data. It is independent of individual subjective factors and provides the opportunity to frequently assess some relevant variables to help diagnose disease, identify hidden trends, and develop predictive models [60, 61]. The application of artificial intelligence and machine learning technologies has enormous potential benefits and will become increasingly irreplaceable in the future development of medicine.
Reducing labor costs
Many methods have been successfully used to automatically segment muscle groups on single-layer CT images recently, among which the methods based on atlas and convolutional neural network (CNN) [58, 62–66] show great advantages. The traditional method of manually tracking muscle groups to calculate body composition parameters to diagnose sarcopenia is onerous, expensive, and time-consuming. In the era of precision medicine, AI-based analysis relies on differences in CT attenuation values between muscles and other tissues in single-layer CT sections. The measured skeletal muscle parameters can be used as indicators for the diagnosis of sarcopenia. AI graphic analysis software can automate labor-intensive tasks, greatly reducing the workload of clinicians, shortening the diagnosis time, and improving the diagnostic efficiency [28]. A study suggested that CT-based AI-powered software facilitates the evaluation of objective clinical benefits and prognostic tumor outcomes [67].
Improving the accuracy of sarcopenia assessment
Artificial segmentation analysis is prone to be limited by inter-observer variability, fat infiltration, observer time, and other factors [68]. AI can overcome these problems [69], and improve calibration performance [70]. AI can help divide skeletal muscle in a short amount of time and with the same precision as a trained subject [28]. In addition, we found that AI can be very effective in using CT imaging for automated body composition analysis, providing physicians with meaningful imaging biomarkers and further improving the clinical value of radiological reports to improve patient care [71]. Therefore, the use of CT image-based AI models to diagnose sarcopenia is of great clinical value regardless of clinical indications [72]. AI image analysis can accurately segment muscle and adipose tissues [73, 74], to distinguish the relative proportions of various tissues, and automatically calculate muscle and adipose tissue parameters [75], including visceral adipose tissue (VAT), subcutaneous adipose tissue (SAT), SMI, etc. Although the specific diagnostic threshold of sarcopenia used by this method is still uncertain, its accuracy in evaluating sarcopenia is certain.
Standardizing medical procedures
The special mathematical reconstruction algorithm in AI graphics software is used to automatically measure the distribution of skeletal muscle components and adipose tissue in different levels, various regions, and individual muscle groups on CT images with high precision, to achieve a quantitative assessment of muscle mass. This AI algorithm can also achieve standardization and repeatability of medical procedures for sarcopenia diagnosis. It is helpful to simplify the diagnostic process and improve the evaluation criteria of sarcopenia. In conclusion, AI-derived body composition represents an accessible method that can be performed through post-processing of imaging data [76], providing the basis for rapid diagnosis of sarcopenia and assessment of clinical outcomes.
Helping predict clinical outcome
When discussing the association between sarcopenia and postoperative infection in patients with colorectal cancer, Lieffers et al. [77] found that the postoperative infection rate in patients with sarcopenia was as high as 23.7% (p = 0.025), indicating that sarcopenia could predict postoperative infection, affect hospitalization rehabilitation nursing, and thus prolong postoperative hospitalization. In addition, many studies have shown that sarcopenia is associated with increased morbidity and mortality in patients with various underlying diseases [78]. Sarcopenia may also be a marker of poor prognosis in patients with different diseases such as cancer [39, 79, 80]. CT-based screening for sarcopenia has predictive value for vertebral compression fractures in elderly individuals [81], the survival rate after lung transplantation [82], the length of ICU stay in colon cancer patients [83], and patients’ overall survival time in lung cancer [84, 85]. The influence of body composition on various clinical outcomes has been broadly studied, and body composition has thus become an accepted risk factor. As this valuable metabolic information can easily be extracted from CT images, there is a growing demand for automatic software solutions.
Early diagnosis of sarcopenia with a view to early intervention plays an important role in improving the prognosis of patients. For example, patients with advanced lung disease can improve clinical outcomes through pulmonary rehabilitation [9]. AI-assisted image analysis uses automatic tissue segmentation technology to provide a standardized trend, which can explore the continuous changes in cancer-related sarcopenia [86] so that clinicians can obtain additional information needed to develop a more rational treatment plan to prevent or delay adverse consequences, and ultimately improve the clinical outcome of patients [87]. In addition, preoperative muscle mass assessment can help clinicians predict patients’ health status, and assist in better classification and targeted therapy for the best treatment results. The development of this automated CT segmentation assessment of body composition will accelerate the study of body composition and ultimately facilitate the integration of body composition measures into clinical care [88, 89].
Assisting in determining the cut point value of CT image diagnosis of sarcopenia
In daily clinical practice, the AI automatic segmentation model can simplify the diagnosis of sarcopenia and provide additional image data when CT images are examined for various clinical indications. Due to the variety of diagnostic methods and the difference in the definition of the thresholds between different populations, we need large data sets with multi-center and large sample sizes. With higher quality data annotation and large-scale AI models, relying on appropriate algorithms and eliminating heterogeneity through integrated data processing, we believe that appropriate diagnostic criteria can be explored for early diagnosis of sarcopenia and effective intervention and treatment for patients.
Using this concept, a study has solved the variability of multi-source heterogeneous data in patients with COVID-19 pulmonary infection from different subordinate medical institutions of the center and successfully established a standard prediction model for the outcome of pulmonary dispersion function after COVID-19 [90]. Therefore, an automatic CT image detection model based on deep learning should be built as soon as possible. Optimizing the AI algorithm, revealing the cutting point value of sarcopenia diagnosis and the change rule after the intervention, is conducive to providing a decision-making basis for clinical diagnosis and early prevention.
Loss of muscle mass is an important predictor of adverse clinical outcomes. Screening for sarcopenia and implementing appropriate interventions in elderly individuals are crucial. This article proposes using opportunistic CT imaging as an advantageous method for clinical application. In routine clinical practice, opportunistic CT imaging holds significant clinical value. AI-driven CT image analysis can rapidly and accurately monitor muscle mass and health status, facilitating better risk stratification for different patient groups. This technology optimizes clinical decision-making and reduces healthcare costs. Consequently, future research should focus on high-quality and rigorous methodologies to establish reliable diagnostic thresholds for sarcopenia and automate the diagnostic process. This will enhance the efficiency of sarcopenia diagnosis, leading to early intervention and delayed disease progression.