Introduction
The diverse eating habits observed across different regions are a testament to the influence of economic and cultural exchanges, which have facilitated the cross-cultural dissemination of global food practices [1–4]. Notably, beverages including alcoholic beverages, coffee, as well as tea have transcended regional boundaries to emerge as global commodities, reflecting shifts in dietary patterns and lifestyle choices [5]. These beverages are not only culturally significant but also have complex relationships with human health, particularly in the context of metabolic and neurological disorders. Understanding these relationships is crucial for unraveling the potential genetic underpinnings that link beverage consumption to various health outcomes, including sleep disorders. This study seeks to address these complexities by employing Mendelian randomization (MR), an approach that offers robust causal insights by utilizing genetic variants as instrumental variables, thus mitigating confounding factors and reverse causation that often plague observational studies.
The impact of alcoholic beverage consumption on human health has been a subject of extensive investigation. Studies have linked the intake of alcoholic beverages to cardiovascular and cerebrovascular diseases, revealing intricate relationships between alcohol consumption and various health outcomes [6–9]. Associations between alcohol consumption and diseases such as diabetes and neurological disorders, particularly alcoholic fatty liver disease, underscore the multifaceted interplay between alcohol intake and metabolic health [10–12]. These metabolic disruptions are closely linked to sleep disturbances, as the regulation of glucose and lipid metabolism plays a critical role in maintaining normal sleep architecture. Furthermore, alcohol consumption’s effects on the nervous system, including nerve conduction delays, nerve cell damage, and cognitive decline, may also contribute to the development of sleep disorders [13–16].
The nervous system’s role in regulating sleep is particularly relevant, as alcohol’s neurotoxic effects likely contribute to sleep disorders. Chronic alcohol use has been shown to impact both sensory and motor functions by slowing down nerve conduction velocities and causing structural damage to nerve cells. Additionally, cognitive decline associated with long-term alcohol use further exacerbates the risk of sleep disorders, emphasizing the need for a deeper understanding of the genetic links between alcohol consumption and sleep disturbances [14–18].
The typical duration of sleep for a person without insomnia generally falls within the range of 7 to 8 h, although the specific sleep requirements can vary individually. Insomnia sufferers often experience impaired work efficiency and compromised mental health due to insufficient sleep. Disrupted circadian rhythms have been implicated in the pathophysiology of insomnia and are associated with adverse health outcomes [19, 20]. In the contemporary workplace, coffee and tea have become integral components of the daily routine for office workers [21]. The varying habits surrounding beverage intake have implications for the body’s excitement levels, which, in turn, are intricately linked to sleep patterns [12]. This leads to the hypothesis that different beverage consumption patterns may exert diverse effects on sleep disorders, and MR is particularly suited to investigate these associations.
Mendelian randomization, an emerging statistical method in genetics, offers a powerful approach to explore these complex relationships by utilizing genetic variants as instrumental variables to infer causality [22, 23]. Previous studies have successfully applied MR to investigate the genetic associations between lifestyle factors, such as alcohol consumption, and various health outcomes, including cardiovascular and metabolic diseases [24–29]. However, there remains a significant gap in research specifically addressing the genetic links between beverage consumption patterns and sleep disorders. This gap highlights the necessity for further exploration, particularly given the complex interactions between diet, genetics, and sleep health [30–32].
Motivated by the intricate interplay between sleep disorders and drinking habits, this study employed the MR method to investigate the genetic associations between various beverage consumption patterns and sleep disorders [28–30]. By focusing on this novel area, we aimed to provide insights that not only advance our understanding of the genetic determinants of sleep health but also inform public health recommendations and clinical practices.
Material and methods
The gene sampling utilized in this study was sourced from the website https://gwas.mrcieu.ac, predominantly relying on data from the UK Biobank (UKB). The UK Biobank dataset is derived from extensive gene sequencing conducted on a large cohort of participants. Notably, the dataset is extensive, encompassing a diverse array of genes. The richness of its data positions this dataset as a potential source for novel insights into the etiology of prevalent diseases and as a guide for identifying potential therapeutic targets. Detailed information regarding the data sources is provided in Table I.
Table I
Description of contributing studies
| Type | Phenotype | Population | SNP | Sample size | Access address |
|---|---|---|---|---|---|
| ALI | Alcohol intake | Europeans | 11,887,865 | 335,394 | https://gwas.mrcieu.ac.uk/datasets/ieu-b-73/ |
| ALF | Alcohol intake frequency | Europeans | 9,851,867 | 462,346 | https://gwas.mrcieu.ac.uk/datasets/ukb-b-5779/ |
| HAL | High-frequency drinking with meals | Europeans | 9,851,867 | 235,645 | https://gwas.mrcieu.ac.uk/datasets/ukb-b-16878/ |
| TEAI | Tea intake | Europeans | 9,851,867 | 447,485 | https://gwas.mrcieu.ac.uk/datasets/ukb-b-6066/ |
| COFI | Coffee intake | Europeans | 9,851,867 | 428,860 | https://gwas.mrcieu.ac.uk/datasets/ukb-b-5237/ |
| RWI | Red wine intake | Europeans | 9,851,867 | 327,026 | https://gwas.mrcieu.ac.uk/datasets/ukb-b-5239/ |
| INS | Insomnia | Europeans | 9,851,867 | 462,341 | https://gwas.mrcieu.ac.uk/datasets/ukb-b-3957/ |
| IE | Inhibit excitability | Europeans | 9,851,867 | 460,913 | https://gwas.mrcieu.ac.uk/datasets/ukb-b-5776/ |
| SD | Sleep duration | Europeans | 9,851,867 | 460,099 | https://gwas.mrcieu.ac.uk/datasets/ukb-b-4424/ |
The exposure variables in this study refer to different drinking habits characterized by the type and frequency of beverage consumption. The variables include: 1. Alcohol intake (ALI): The average amount of alcohol consumed by an individual, typically measured in grams per day. 2. Alcohol intake frequency (ALF): The frequency of alcohol consumption, such as the number of drinking occasions per week. 3. High-frequency drinking with meals (HAL): The frequency with which alcohol is consumed during meals, indicating a pattern of alcohol intake associated with eating. 4. Tea intake (TEAI): The quantity of tea consumed, often measured in cups per day. 5. Coffee intake (COFI): The quantity of coffee consumed, measured similarly to tea intake. 6. Red wine intake (RWI): The specific consumption of red wine, distinct from other alcoholic beverages in both amount and frequency.
These exposure variables are analyzed to understand their genetic association with sleep disorder liability (SDL) outcomes, which include: 1. Insomnia (INS): Difficulty in falling or staying asleep, measured as a binary trait. 2. Inhibit excitability (IE): A measure of daytime sleepiness or fatigue, indicating the inability to stay alert. 3. Sleep duration (SD): The total amount of sleep in a 24-hour period, measured in hours.
The term “exposure factor” denotes a putative causal risk factor, encompassing biomarkers, physical measurements, or any risk factor capable of influencing outcomes. These outcomes pertain to diseases or physiological and pathological states, yet are not confined to a specific ailment. Given the numerous confounding factors inherent in the association between exposure factors and diseases, clinical observation and analysis become challenging. Drinking habits and sleep disorders, for instance, are outcomes influenced by multiple genes and factors. However, genes exhibit a stable nature, adhering to Mendel’s first and second laws of inheritance. In other words, during meiotic gamete formation, parental alleles undergo random assignment to offspring. This ensures that the link between genes and outcomes remains uninfluenced by common confounding factors, with genes serving as representatives for habits or pathological states. To discern statistical variances in genes across a substantial sample size and elucidate the genetic correlation between exposure factors and outcomes, we employ statistical methods, specifically MR. MR enables the investigation of genetic associations with outcomes, offering a robust means to analyze the intricate relationships between exposure factors and their consequential effects.
Statistical software and database sources
Our analysis was performed using RStudio software (version: 4.0.0) with a primary focus on utilizing the TwoSampleMR package [31–34]. The TwoSampleMR package allows for the systematic implementation of MR using summary data from genome-wide association studies (GWAS). It includes functions for harmonizing datasets, performing MR analysis, and assessing potential pleiotropy, making it an ideal tool for this study. For detailed information regarding the genome-wide association research data on drinking habits of different beverages (DHDB) as well as SDL, refer to the database website: https://gwas.mrcieu.ac (Table I). Ensuring the robustness of MR studies, we adhered to the critical assumptions, which encompass these three critical aspects: (1) the instrumental variables were meticulously selected to maintain a close association with exposure variables; (2) the chosen instrumental variables demonstrated no association with confounding factors linked to both exposure and outcome variables; (3) instrumental variables were employed in a manner that did not unduly influence the results unless they were inherently linked to the exposure under investigation [32, 34].
Selection of instrumental variables and screening of SNPs
In conducting the directional MR analysis, we employed DHDB as the exposure variable and SDL as the outcome variable for the selection of instrumental variables. The objective was to scrutinize and identify instrumental variables that could effectively establish the causality relationship between DHDB and SDL.
To ascertain the overall causality, we utilized a rigorous approach. Instrumental variables were selected based on genome-wide significant single nucleotide polymorphisms (SNPs) (p < 5.0 × 10⁻⁸) from large-scale GWAS on DHDB and SDL. We ensured the independence of each SNP by applying a stringent linkage disequilibrium (LD) threshold of r2 < 0.001 and a distance of 10,000 kb. The LD function in the TwoSampleMR package was employed to exclude SNPs in linkage disequilibrium and ensure the independence of each SNP in the analysis [32, 35]. This method facilitated the exclusion of linkage disequilibrium and further ensured the autonomy of each SNP in the analysis, thus enhancing the robustness of our findings.
Calculation analysis of five methods
We extracted information from the results database and amalgamated it to align with effect alleles sharing the same exposure and outcome. Employing R software, we conducted statistical analyses across the five methods, ultimately deriving the anticipated positive results (p (inverse variance weighting – IVW) < 0.05) [36, 37].
Credibility of verification results
Upon obtaining positive results, we computed the causal effect estimate (β: regression coefficient), subsequently transforming it into an odds ratio (OR) [38]. The MR-Egger method, acknowledged for providing direction-level pleiotropy estimates, was utilized. Additionally, four other meta-analysis methods renowned for their reliability in detecting horizontal pleiotropy were employed: MR-Egger, weighted median, simple mode, and weighted mode analysis [32].
We assessed the credibility of the verification results by applying Q-statistics and analyzing the MR-Egger intercept term to evaluate substantial heterogeneity and directed pleiotropic effects [39, 40]. In cases where p < 0.05 was observed in the Q-statistics method, random effects models were employed to assess the MR effect. These models were chosen to account for potential heterogeneity and pleiotropy, ensuring that our results remained robust and reliable. In these models, p < 0.05 indicated that the two samples could exclude heterogeneity.
Visual analysis
We conducted a visual analysis to discern the impact of each SNP. The regression coefficient (β) for each SNP was computed, with both β and OR values serving as indicators for positive or negative effects on the outcome. The decision boundary between positive and negative impacts was set at 0. A negative effect was inferred if the upper limit of the β within the confidence interval was less than 0; otherwise, it was regarded as a positive outcome.
Exploring the interaction between exposure and outcome, we employed scatter plots to calculate correlation coefficients (R). A negative correlation was represented by R < 0, while R > 0 denoted a positive correlation. A correlation of |R| = 0 indicated no correlation, 0 < |R| < 0.3 represented a weak correlation, and 0.3 < |R| < 1 indicated a strong correlation. Subsequently, effective gene loci were visually identified through screening in forest plots [41–43].
Reverse MR analysis
In our exploration of the comprehensive causal relationship between DHDB and SDL, we conducted a reverse MR analysis, where SDL served as the exposure and DHDB as the result. We applied the same rigorous methodology as outlined in Section 2.3 for reverse MR analysis. This included ensuring the independence of SNPs, applying robust statistical methods, and verifying the credibility of results to observe bidirectional causality between SDL and DHDB. We applied the same methodology as outlined in Section 2.3, focusing on observing two-sample one-way or two-way correlations [44].
Results
Five statistical methods were employed with DHDB as the exposure and SDL as the outcome.
We did not detect a causal relationship between ALI and IE, ALI and SD, ALF and INS, TEAI and INS, COFI and INS, COFI as well as SD, RWI and INS, RWI and IE, RWI as well as SD (p (IVW) > 0.05). Certain indicators of DHDB exhibited positive correlations with SDL (p (IVW) < 0.05): ALI as well as INS; ALF and IE; ALF as well as SD; HAL and INS; HAL and IE; HAL and SD; TEAI and IE; TEAI and SD; COFI as well as IE. The IVW calculation result and the corresponding OR value (95% CI) were statistically significant (Supplementary Table SI).
Reliability of verification results
We initiated the heterogeneity analysis using MR-Egger regression with Q-statistics for the following pairs: ALI and INS; ALF and IE; ALF and SD; HAL and INS; HAL and IE; HAL and SD; TEAI and IE; TEAI and SD; COFI and IE. The p-values for these groupings were all below 0.05 (p (Q-statistics) < 0.05). Employing random effects models, the positive associations observed in the aforementioned groups yielded p (random effects models) < 0.05. In the pleiotropic test, no significant pleiotropic effects were detected in the mentioned groups (p (pleiotropic test) > 0.05). Overall, both heterogeneity and pleiotropic analyses supported the reliability of the study findings (Table II).
Table II
Heterogeneity and pleiotropic analysis for exposure and outcome
Results of visualization analysis
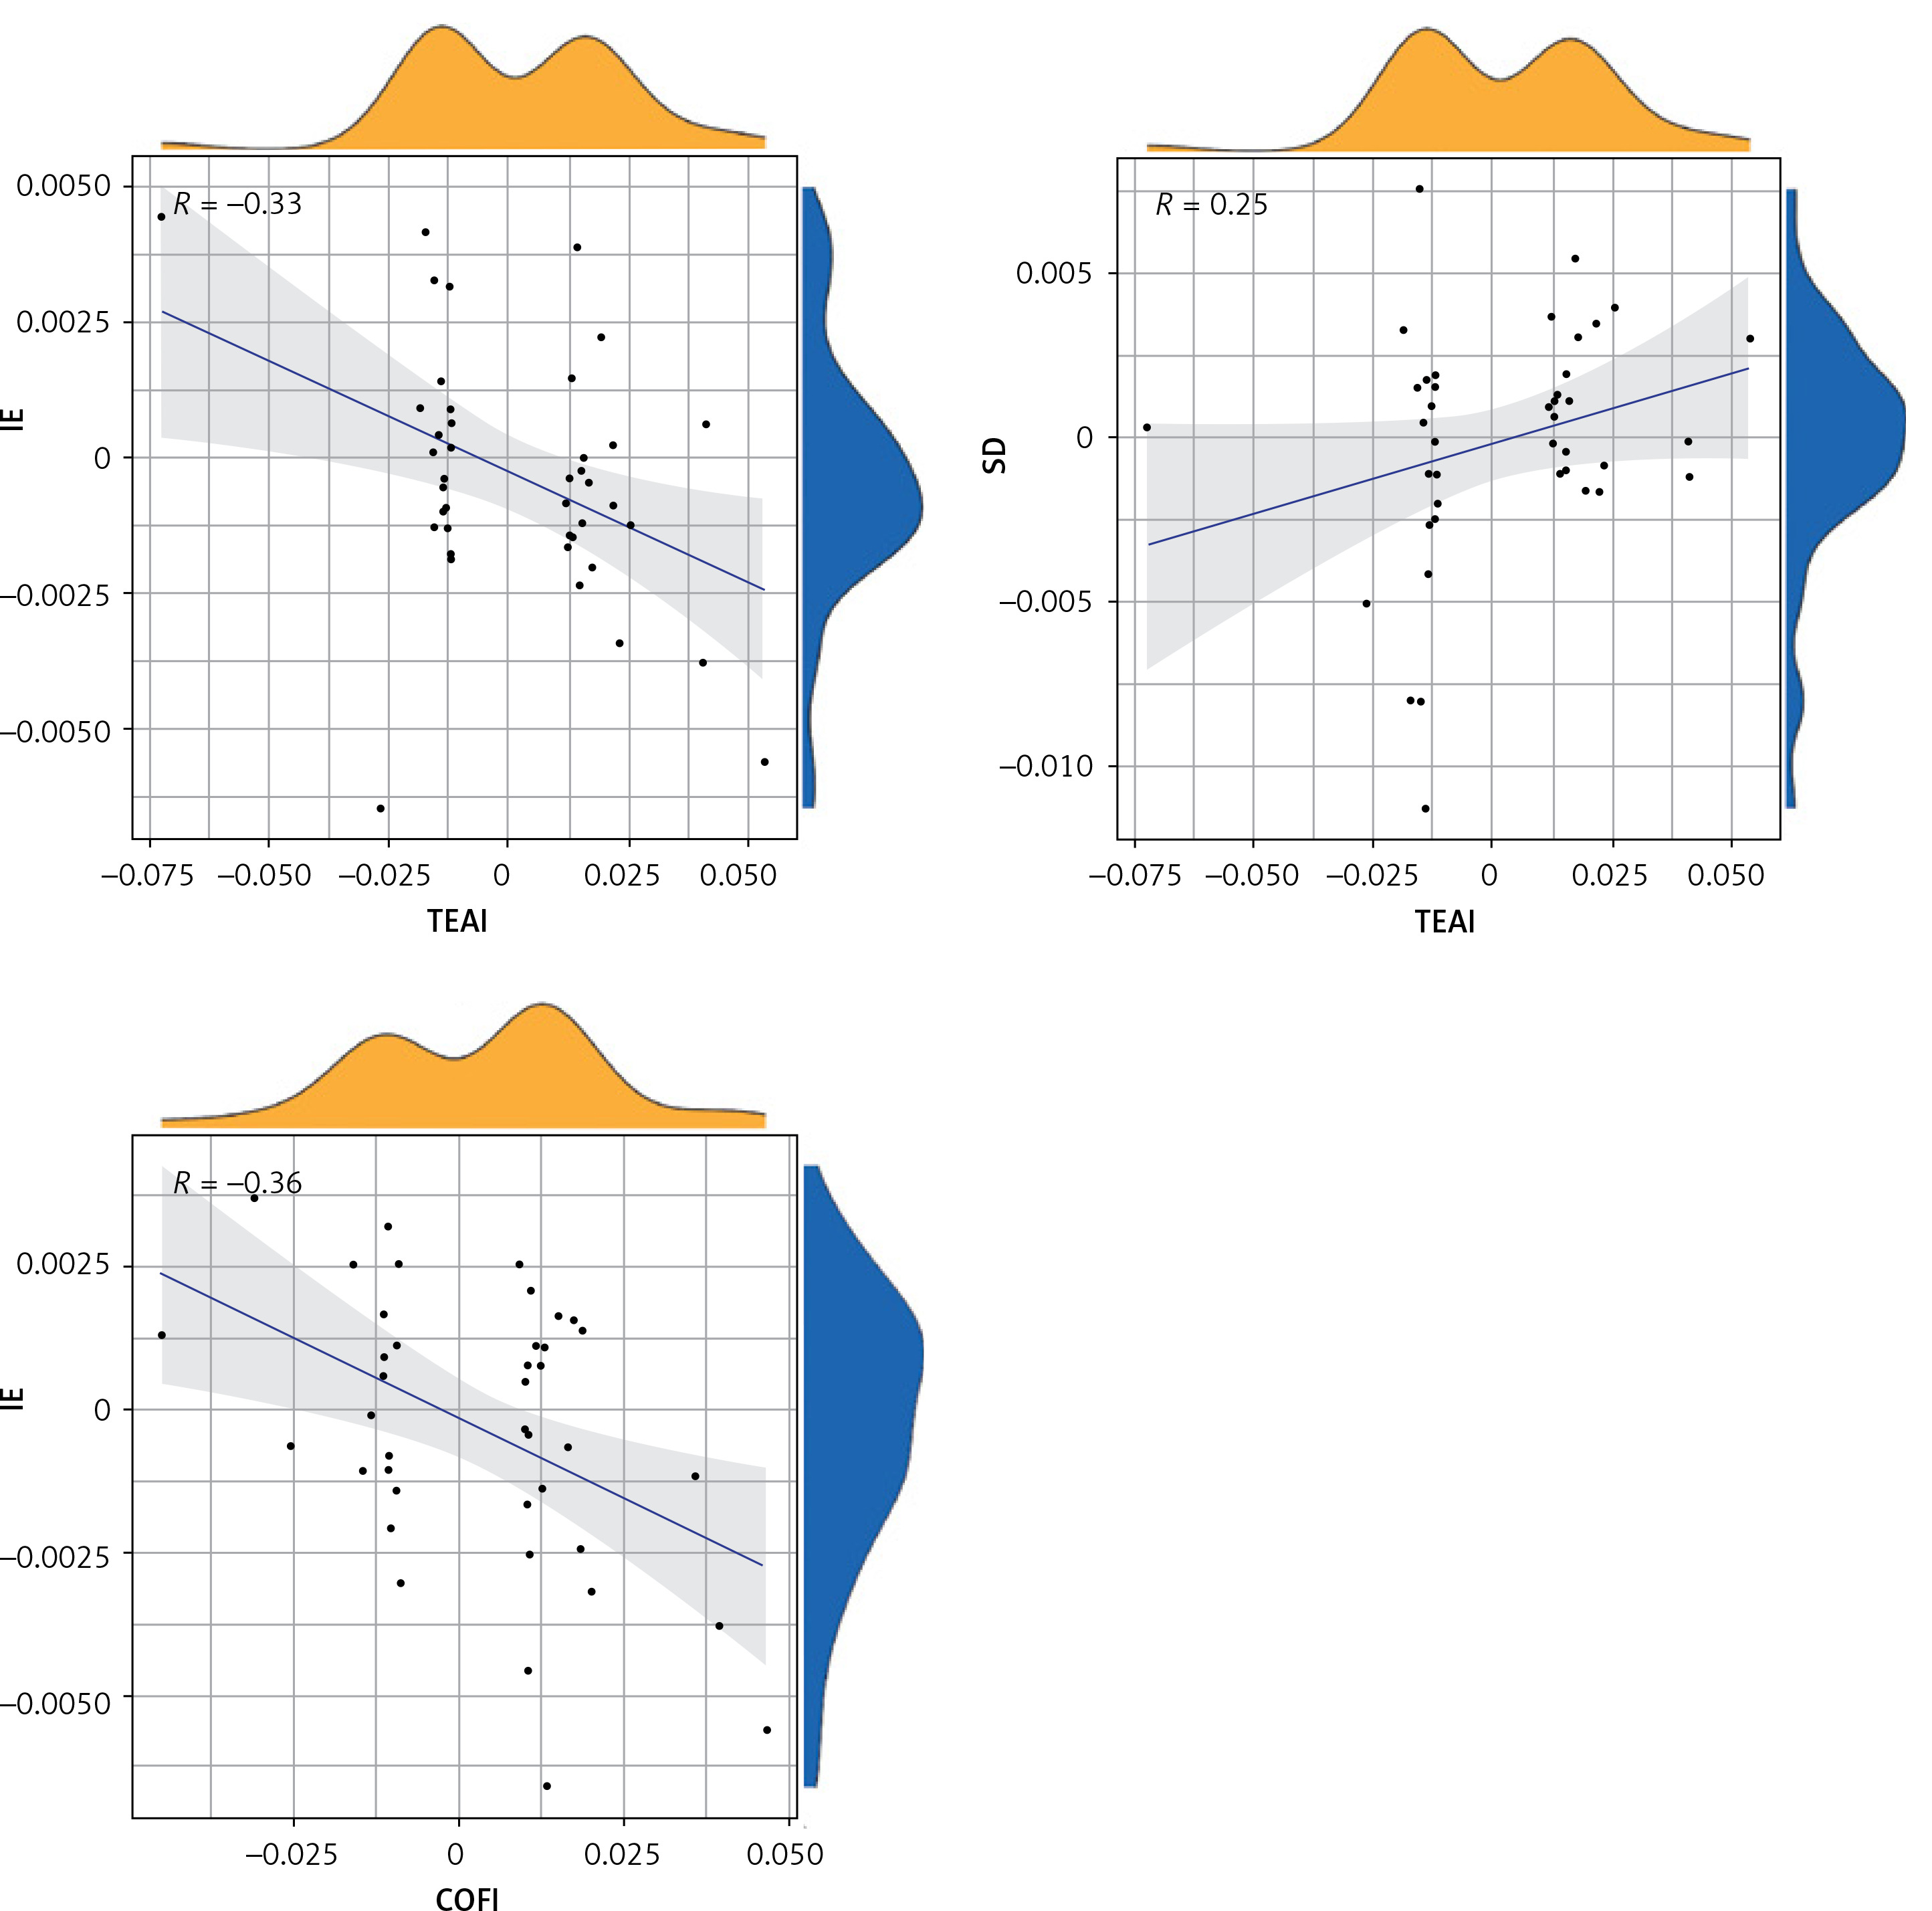
Figure 1 shows OR estimates and 95% CI of the five methods. Positive results of MR calculations were evaluated utilizing visual scatter plots as well as forest plots (Figure 2). We observed the following correlations: ALI and INS – positively correlated (R = 0.44) (Figure 2 A); ALF and IE – positively correlated (R = 0.25) (Figure 2 B); ALF and SD – negatively correlated (R = –0.12) (Figure 2 C); HAL and INS – negatively correlated (R = –0.55) (Figure 2 D); HAL and IE: negatively correlated (R = –0.32) (Figure 2 E); HAL and SD – positively correlated (R = 0.39) (Figure 2 F); TEAI and IE – negatively correlated (R = –0.33) (Figure 2 G); TEAI and SD – positively correlated (R = 0.25) (Figure 2 H); COFI and IE – negatively correlated (R = –0.36) (Figure 2 I).
Figure 1
Odds ratio (OR) estimates and 95% CI of the five methods. A – OR estimates and 95% CI of the five methods with ALI as the exposure and INS as the outcome. B – OR estimates and 95% CI of the five methods with ALF as the exposure and IE as the outcome. C – OR estimates and 95% CI of the five methods with ALF as the exposure and SD as the outcome. D – OR estimates and 95% CI of the five methods with HAL as the exposure and INS as the outcome. E – OR estimates and 95% CI of the five methods with HAL as the exposure and IE as the outcome. F – OR estimates and 95% CI of the five methods with HAL as the exposure and SD as the outcome. G – OR estimates and 95% CI of the five methods with TEAI as the exposure and IE as the outcome. H – OR estimates and 95% CI of the five methods with TEAI as the exposure and SD as the outcome. I – OR estimates and 95% CI of the five methods with COFI as the exposure and IE as the outcome
This Figure shows the forest plots for OR estimates and 95% CI of the five methods: MR Egger, weighted median, IVW, simple mode, weighted mode. The standard line is the line of “X = 1” (red dashed line).
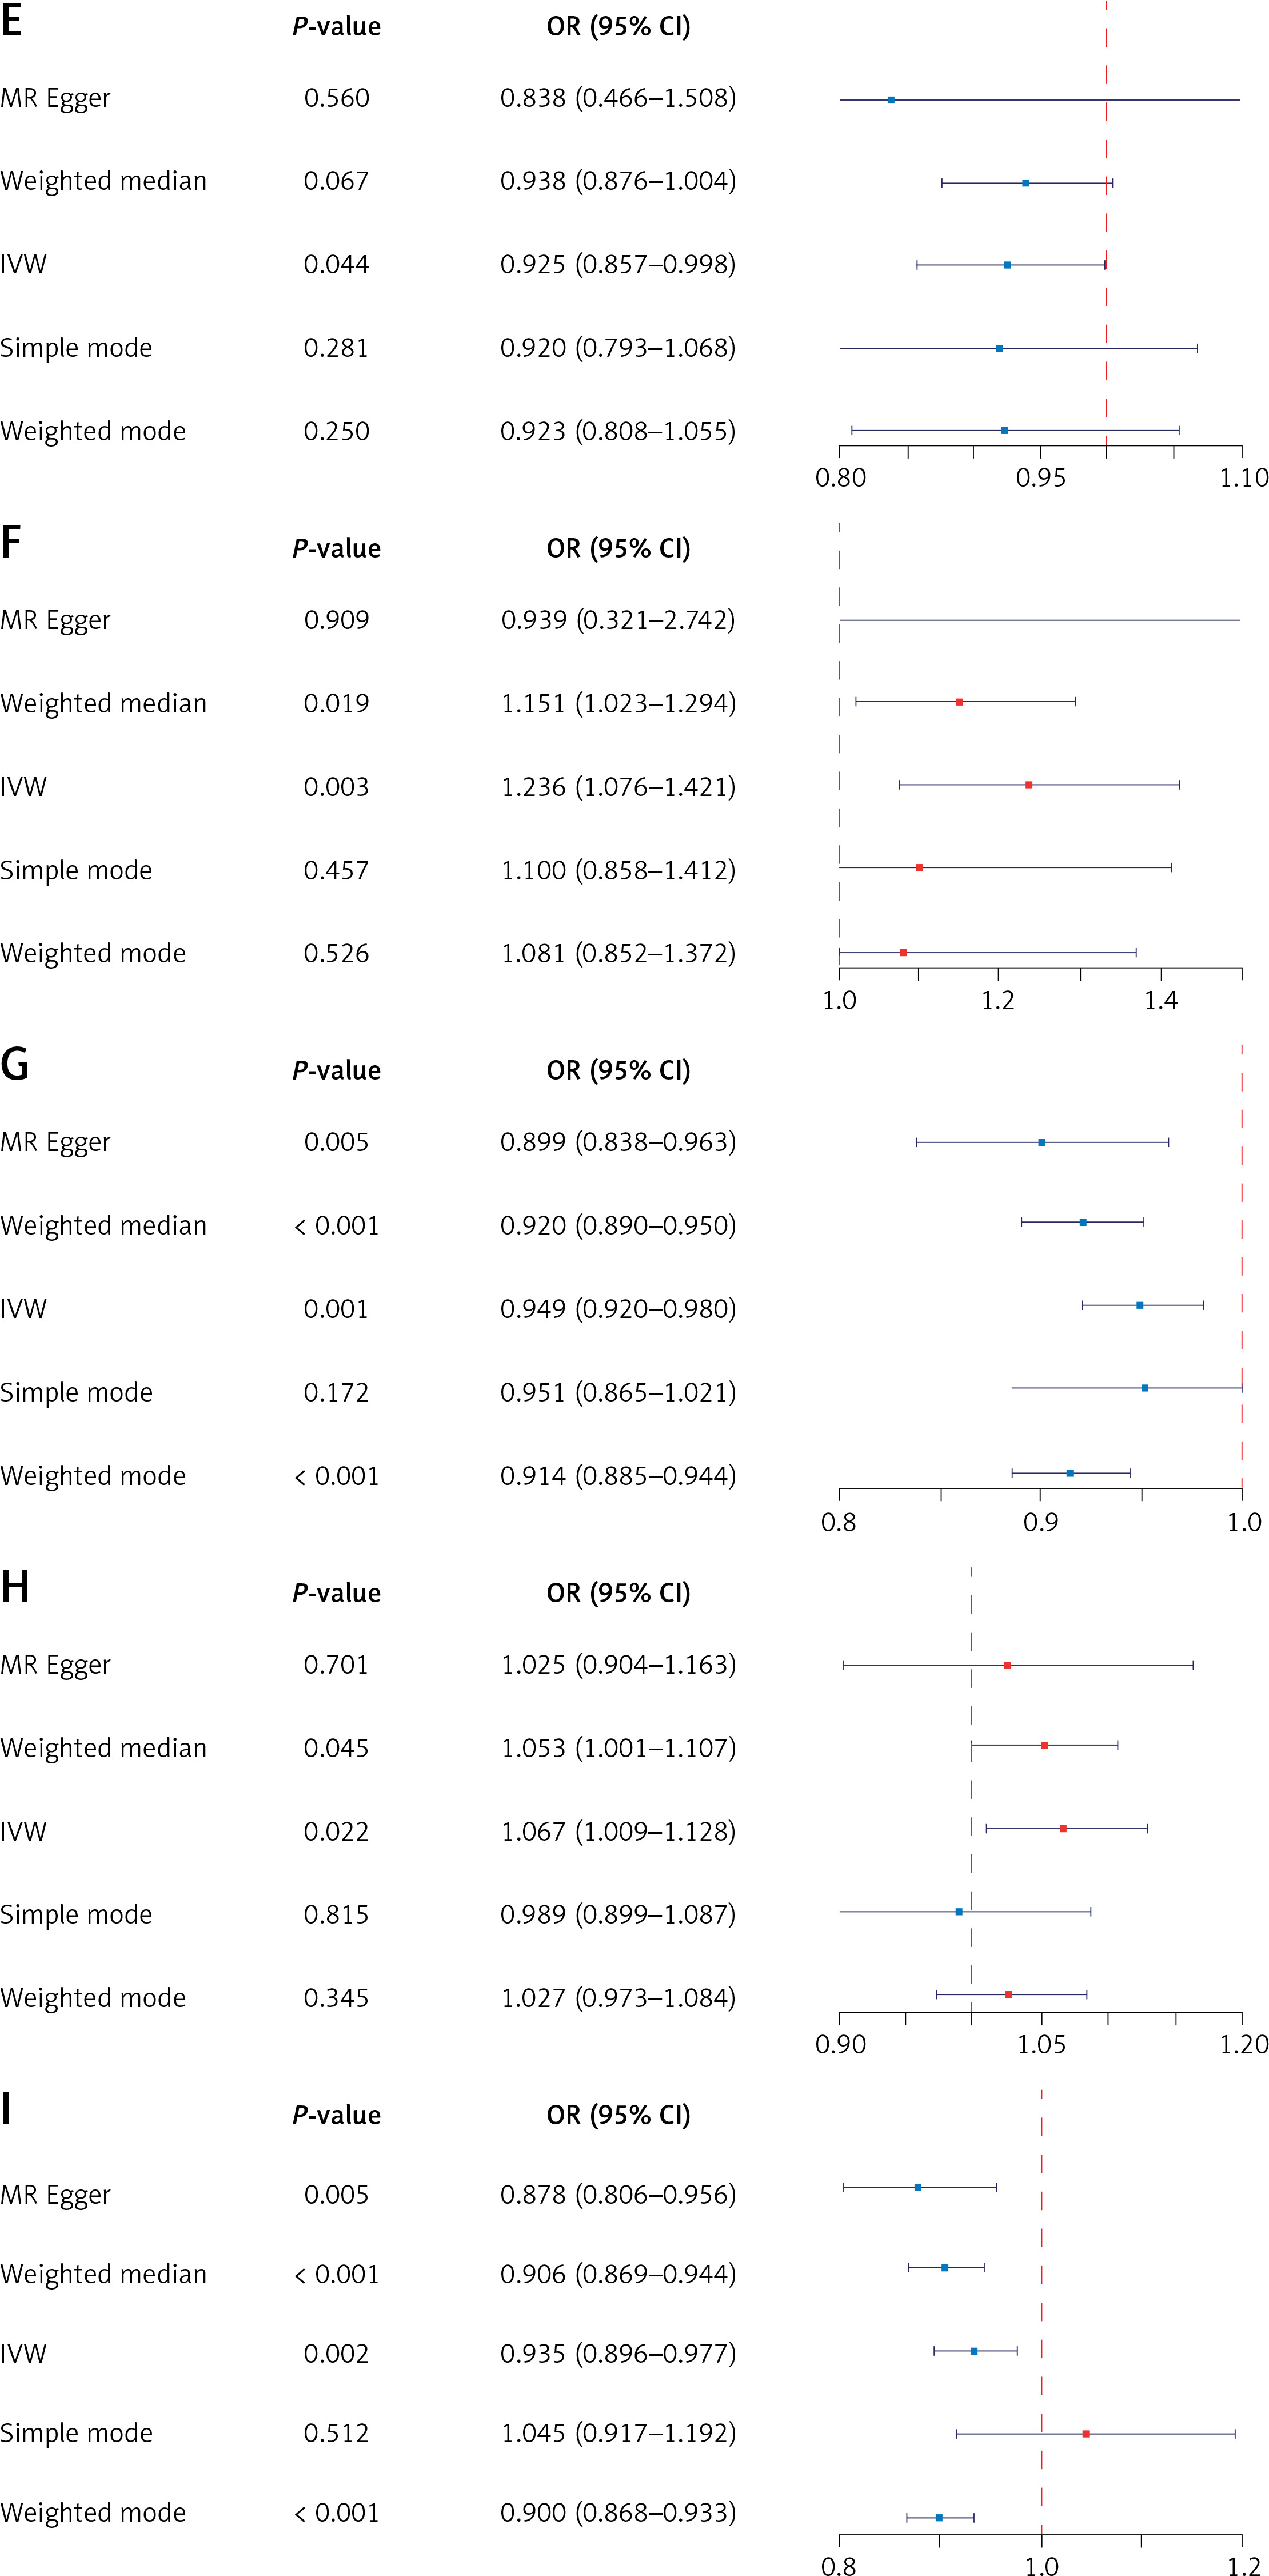
Figure 2
Scatter plots for significant SNPs with DHDB as the exposure and SDL as the outcomes Scatter plots for significant SNPs with DHDB as the exposure and SDL as the outcomes
IVW – trend line of inverse variance weighting, R – correlation coefficient.
We calculated the β values for the regression coefficients of each SNP, identified significant gene loci, and created a forest plot database (Supplementary Figure S1). The gene loci with potentially significant effects are listed in Table III and Supplementary Table SII, which detail the selected effective gene loci.
Table III
Significant SNPs for DHDB-SDL pairs
Reverse MR analysis
A few indicators of SDL were found to be associated with DHDB, as indicated by significant IVW calculation results: SD and ALF – β = –0.2536, se = 0.09, p = 0.0043; INS and HAL – β = −0.0842, se = 0.03, p = 0.0053.
We did not find any significant associations between SDL and other DHDB variables (p (IVW) > 0.05) (Table IV).
Table IV
Five statistical methods in reverse MR analysis with exposure and outcome
Discussion
In the contemporary landscape of genetic exploration into the associations between different beverage consumption patterns and sleep disorders, it is paramount to contextualize our findings within the existing body of literature. Our study, utilizing MR, delves into the interplay between genetic factors, drinking habits, and sleep outcomes. To bridge the gap between our findings and previous research, we draw upon the extensive literature on dietary habits, genetic factors, and their collective impact on health.
Diet, as an integral aspect of human life, has been extensively studied for its role in maintaining metabolism and contributing to various pathological changes [1–3]. The globalization of food practices and the transcending boundaries of beverages such as alcoholic beverages, coffee, and tea highlight shifts in dietary patterns and lifestyle choices [5]. These global trends set the stage for our exploration into the genetic underpinnings of the relationships between different beverage consumption patterns and sleep disorders.
Our study aligns with previous MR studies that have investigated the genetic associations between lifestyle factors and health outcomes, particularly in the context of alcohol consumption. For instance, previous MR analyses have demonstrated a causal relationship between alcohol intake and various health conditions, such as cardiovascular diseases and metabolic syndrome [6–12]. These studies provide a foundation for understanding the complex genetic interplay between alcohol consumption and sleep disorders. Through MR, we contribute to the evolving understanding of how genetic factors may modulate the effects of alcohol on sleep patterns.
Moreover, the incorporation of coffee and tea into the study is informed by their ubiquitous presence in modern workplaces, where their consumption is noted for potential improvements in concentration and work efficiency [21]. Our hypothesis that different beverage consumption patterns may exert diverse effects on sleep disorders stems from the varying habits surrounding beverage intake and their implications for the body’s excitement levels [22]. However, variations in age, personality, or social status among clinically participating volunteers introduce challenges in isolating and studying specific habits independently [45].
To address this, we propose the utilization of MR approaches as an alternative to studying habits in clinical settings. MR approaches involve replacing clinical diseases or pathological states with stably expressed genes that adhere to Mendel’s first and second laws of inheritance. This means that during meiotic gamete formation, parental alleles are randomly passed on to offspring, maintaining a relationship between genes and outcomes that is not influenced by common confounding factors. By employing MR, we navigate the intricate genetic landscape that potentially mediates the impact of these beverages on sleep outcomes.
The recognition of the uniqueness of individual lifestyles and the divergence in phenotypes, even among identical twins, adds depth to our understanding [46]. As emphasized by researchers, the stability and excessive alteration of lifestyle habits can result in physiological and pathological effects, influenced by multiple factors, including dietary habits, exercise, and occupation [47]. This aligns with our cautionary note on the need for prudence in formulating clinical recommendations based solely on statistical findings from MR studies.
Our predictions regarding the frequency of alcohol intake as a major factor in sleep disturbances resonate with the complex relationship between alcohol content, drinking frequency, and sleep outcomes [12]. Genetic variants in genes involved in alcohol metabolism (e.g., ADH1B, ALDH2) may influence individual responses to alcohol, thereby modulating its impact on sleep [48]. These findings align with the observed genetic link between alcohol intake and insomnia in our study. The speculation about the potential benefits of consuming alcohol with meals to address sleep disorders adds nuance to our findings, pointing towards a potential interplay of dietary habits and sleep patterns.
Beyond the foods highlighted in the aforementioned article, other dietary choices can impact sleep quality. Spicy and irritating foods, raw or cold items, and overly greasy meals warrant attention for those aiming to maintain a healthy diet and improve sleep. Consumption of spicy foods may lead to irritation of the oral and gastrointestinal mucosa, resulting in symptoms such as sore throat and abdominal pain, significantly undermining sleep quality. Likewise, excessively cold foods may trigger abdominal blood vessel constriction, causing gastrointestinal cramps and abdominal pain, hindering sleep. Furthermore, indulging in overly greasy foods before bedtime can strain the digestive system during its resting phase, potentially compromising sleep quality. To optimize sleep, it is crucial to be mindful of food and beverage choices that might adversely impact sleep patterns before heading to bed [49].
Building on existing studies that have explored the impact of energy drinks and caffeinated beverages on sleep and mood [50], our research contributes to the growing body of evidence demonstrating the relationship between different beverage types and sleep. The differentiation in results between tea and coffee consumption suggests nuanced effects on drowsiness and sleep recovery, indicating the need for further investigation into the underlying mechanisms. Caffeine, a central nervous system stimulant, exerts its wake-promoting effects by antagonizing adenosine receptors, reducing the drive for sleep [51]. The presence of L-theanine in tea, which can promote relaxation, may offset some of caffeine’s stimulant effects, explaining the differential impact of tea and coffee on sleep outcomes observed in our study [52].
By employing genes as representatives for habits or pathological states, we can effectively exclude the impact of age, personality, or social status. This approach is particularly suitable for research scenarios where direct clinical trials are challenging or when numerous influencing factors complicate trial implementation. By synthesizing insights from previous research on dietary habits, genetic factors, and health outcomes, our findings contribute to the broader understanding of the complex interconnections between lifestyle, genetics, and sleep. As we move forward, the integration of genetic perspectives into lifestyle research holds the potential for personalized interventions and targeted health recommendations. Such personalized approaches could enhance clinical practices by tailoring dietary and lifestyle interventions to the genetic profiles of individuals, thereby improving the management of sleep disorders and overall health outcomes.
The research leveraged Mendelian randomization to explore genetic links between DHDB and the likelihood of developing SDL. The findings offer crucial perspectives on these relationships. Specifically, alcohol consumption was identified as a potential contributor to insomnia, while frequent alcohol intake may be linked to increased daytime sleepiness and reduced sleep duration. Notably, regular alcohol consumption during meals appeared to reduce the likelihood of insomnia, decrease daytime sleepiness, and extend overall sleep duration. Tea consumption was not linked to a higher likelihood of insomnia and was found to reduce daytime drowsiness, possibly enhancing daytime sleep. Coffee intake was associated with reduced daytime excitability while not inducing insomnia or altering overall sleep duration. In contrast, red wine consumption did not show a significant association with insomnia, daytime sleepiness, or total sleep time.
However, the study is not without limitations. Mendelian randomization primarily assesses the genetic predisposition to certain outcomes and does not account for the multifaceted nature of sleep disorders, which may be influenced by a combination of lifestyle and genetic factors. Moreover, the study’s reliance on existing databases restricts its focus to the causality and trends identified within these datasets. Consequently, while the results offer valuable genetic insights, they should be interpreted with caution, as Mendelian randomization alone cannot establish a definitive causal relationship. These findings should be supplemented by further research, including clinical trials and animal studies, to better understand the complex interplay of factors influencing sleep disorders.
Future investigations could broaden the scope by examining additional beverages, such as energy drinks or herbal teas, to determine their genetic associations with sleep disorders. Furthermore, exploring more detailed sleep parameters, such as sleep quality, latency, and the incidence of sleep apnea, could provide a more comprehensive understanding of how different drinking habits impact sleep health. Employing advanced genetic techniques, such as multivariable Mendelian randomization or polygenic risk score analyses, might also help refine or challenge these findings, offering a more nuanced perspective on the genetic underpinnings of sleep disorders.